the uspto trademark assignment data riptions and … · trend analysis suggests ......
TRANSCRIPT

The U
CE
The views of Chief Ec
USPTO Ecorder to stireferenced material) inPaper to be
USPTO Tr
ht
Chief EconomEconomist:
expressed are conomist or th
conomic Workimulate discussand cited (oth
n other publishe referenced or
rademark
United S
ttp://www.usp
mist: Alan MaAmanda
U
those of the ine U. S. Patent
king Papers are sion, scholarly er than a gener
hed work only wr cited.
k Assignm
Office of States Pate
Working pto.gov/ip/of
A
arco a Myers
Office of U.S. Patent a
600 DAlexan
ndividual authoand Trademark
preliminary redebate, and cr
ral acknowledgwith the prior a
ment Data
Chief Econent and Tra
Paper No. 2
fficechiefecon
April 2014
ExpeStati
f Chief Econond Tradema
Dulany Streendria, VA 223
ors and do not nk Office.
esearch being sritical commengment that the agreement of t
aset: Desc
nomist ademark O
014-2 n/OCE_WP_2
ert adviser: Sistician: K
omist ark Office et 314
necessarily refl
shared in a timnt. USPTO Eco
citing author hthe authors of t
criptions
Office
2014-2.pdf
Stuart GrahamKirsten Apple
flect official po
ely manner wionomic Workinhas had access the particular E
and Insig
m e
ositions of the O
th the public inng Papers mayto unpublished
Economic Wor
ghts
Office
n y be d rking

2
The USPTO Trademark Assignment Dataset: Descriptions and Insights
Office of Chief Economist, United States Patent and Trademark Office Department of Commerce
Alan Marco
Chief Economist U.S. Patent and Trademark Office
Alexandria, Virginia
Amanda F. Myers U.S. Patent and Trademark Office
Alexandria, Virginia
Stuart Graham
Georgia Institute of Technology U.S. Patent and Trademark Office
Alexandria, Virginia
Kirsten Apple U.S. Patent and Trademark Office
Alexandria, Virginia
April 2014
Abstract
Attention to the asset value of intellectual property (IP) has traditionally concentrated on high-value patent sales and licenses. This narrow focus neglects non-patent assets held by a broader set of economic agents, such as trademarks, and overlooks the evolving ways owners are employing and monetizing their IP assets. To help remedy this deficiency, the Office of Chief Economist of the United States Patent and Trademark Office (USPTO) is releasing a series of datasets in formats convenient for researchers. This paper describes the USPTO Trademark Assignment Dataset, a database of 786,931 assignments and other transactions recorded during the 1952-2013 period and affecting 4,197,645 trademark registrations or applications. Since these data have not been commonly used, we provide a comprehensive description, present key trends, and examine the rate of transaction for issued registrations. Trend analysis suggests intensifying trademark collateralization as the number of trademarks recorded as collateral to secure debt has increased in absolute terms and relative to the stock of live registrations. The number of trademarks for which an assignment was recorded has also grown, though this trend appears to be reversing in the last decade. Among the 3.4 million registrations issued during the 1978-2013 period, 31 percent were affected by some transaction over their life; 21 percent changed ownership; and 12 percent were affected by a security interest agreement. While further empirical work is needed, transaction rates by registration cohort suggest that registered trademarks may be more likely to be traded than patents. Further, we do not find a positive relationship between the incidence of trade and maintenance, suggesting that trademark assignment and maintenance outcomes may not follow the pattern observed for patents. Despite some limitations, these data open new avenues for research, particularly with respect to trademark collateralization and the market for brands. Keywords: Intellectual Property, Trademarks, Brands, Licensing, Markets for Technology JEL Classification Numbers: O3, L2, G1, G2, G3

3
1 Contents1. Introduction ........................................................................................................................................... 4 2. Literature review ................................................................................................................................... 6 3. Types of transactions recorded with USPTO ........................................................................................ 8 3.1. Assignment of assignor’s interest and goodwill ............................................................................... 8 3.1.1. Anti-assignment in gross ............................................................................................................. 10 3.2. Security interest agreements ........................................................................................................... 11 4. Data files ............................................................................................................................................. 12 4.1. Data source ...................................................................................................................................... 12 4.2. Data file structure ............................................................................................................................ 14 4.2.1. tm_assignment & tm_convey ...................................................................................................... 15 4.2.2. tm_convey (constructed) ............................................................................................................. 15 4.2.3. tm_assignee ................................................................................................................................. 16 4.2.4. tm_subparty ................................................................................................................................. 17 4.2.5. tm_assignor ................................................................................................................................. 17 4.2.6. tm_docid ..................................................................................................................................... 19 4.2.7. tm_cf_no (constructed) ............................................................................................................... 19 4.2.8. tm_file ......................................................................................................................................... 19 4.3. Cautions .......................................................................................................................................... 19 4.3.1. Duplicate records and chain of title ............................................................................................ 20 4.3.2. Transaction recordation lag ......................................................................................................... 21 4.3.3. Censoring and registration death ................................................................................................. 23 5. Discussion ........................................................................................................................................... 23 5.1. Trends in executed transactions ...................................................................................................... 25 5.2. Trends in transacting parties ........................................................................................................... 27 5.2.1. Number of transacting parties ..................................................................................................... 27 5.2.2. Geographic origin of transacting parties ..................................................................................... 28 5.2.3. Top Creditor-Assignees .............................................................................................................. 30 5.3. Incidence of transaction per unique property .................................................................................. 31 5.3.1. Transaction rate and timing by registration cohort ..................................................................... 33 5.3.2. Relationship between recordation and maintenance ................................................................... 34 6. Conclusion .......................................................................................................................................... 36 7. References ........................................................................................................................................... 38 8. Figures and Tables .............................................................................................................................. 41 9. Appendix ............................................................................................................................................. 66 9.1. Appendix I – Form PTO-1594 ........................................................................................................ 66 9.2. Appendix II – Electronic Trademark Assignment System (ETAS) Form PTO-1594 .................... 69 9.3. Appendix III – Data files and variables .......................................................................................... 76 9.4. Appendix VI – Conveyance subcategories ..................................................................................... 79

4
1. IntroductionAttention to the asset value of intellectual property (IP) is often limited to high-value patent sales and licenses.1 This narrow focus not only neglects non-patent assets – such as trademarks – held by a broader set of economic agents, but it also overlooks the evolving ways owners are employing and monetizing their IP assets beyond assignments and licensing agreements. One explanation for the lack of attention to non-patent assets and their monetization is the dearth of data sources available to researchers and the public. To help remedy this deficiency and foster research on IP generally, the Office of Chief Economist of the United States Patent and Trademark Office (USPTO) is releasing a series of datasets in formats more convenient for comprehensive analysis than previously available.2 This paper describes the USPTO Trademark Assignment Dataset (hereafter Trademark Assignment Dataset or Dataset), a database of assignments and other transactions that pertain to federally registered U.S. trademarks, available for download at: http://www.uspto.gov/learning-and-resources/electronic-data-products/trademark-assignment-dataset.
Since these data have not been commonly used in the research community, in this paper we provide a comprehensive description of the Trademark Assignment Dataset and describe the institutional structure necessary for understanding the data. A trademark is a word, phrase, symbol, design, color, smell, sound, or combination thereof that identifies and distinguishes the goods and services of one party from those of others.3 A trademark confers protection upon the owner’s brand and investments therein from misappropriation. Both state law and Federal statute provide for trademark rights wherein the owner has the exclusive right to prevent third parties from using the same or similar mark where such use would likely cause confusion among consumers as to the source of the goods and services.4 As intellectual property, a trademark can be transferred or sold between parties through an assignment. A properly executed assignment transfers all or part of the right, title, and interest in a trademark registration or application from the existing owner (the assignor) to the recipient (the assignee).
The USPTO allows parties to record assignments of trademark applications and registrations in order to, as much as possible, maintain a complete history of claimed interests in a mark. The Office also allows the recording of supporting documentation for transactions that affect title or otherwise pertain to mark ownership, such as mergers, name changes, security interest agreements, and licenses. The Trademark Assignment Dataset contains detailed information on 786,931 assignments and other transactions recorded at the USPTO between 1952 and 2013 involving 1,491,485 million unique trademark properties (an individual application or registration). Because some assignments transfer more than one trademark,
1 See, for instance, the Nortel patent portfolio sale in 2011 for $4.5 billion. Brickly, P. “Nortel $4.5-Billion Patent Sale to Apple, Microsoft, Others Approved.” Wall Street Journal (July 11, 2011), available at http://online.wsj.com/news/articles/SB10001424052702303812104576440161959082234. 2 The Trademark Case Files Dataset was the first release of the series. It is available for download at http://www.uspto.gov/learning-and-resources/electronic-data-products/trademark-case-files-dataset-0. For a thorough description of these data, see Graham, S., Hancock, G., Marco, A. and Myers, A. (2013). “The USPTO Trademark Case Files Dataset: Descriptions, Lessons, and Insights.” SSRN working paper, available at http://papers.ssrn.com/sol3/papers.cfm?abstract_id=2188621 (“Case Files”). 3 See 15 U.S.C. § 1127. 4 See generally Case Files § 1.
5
and some trademarks are transferred more than once, the Dataset contains 4,197,645 property-level transactions.
The paper reports on our analysis of the Dataset, presenting key trends in assignments and other transactions and examining the rate at which registered trademarks have been involved in various transactions during the last 30 years. The trends we report upon in Section 5.1 suggest that trademark collateralization has been intensifying over time, since the number of trademarks recorded as debt security has increased each year both in absolute terms and relative to the stock of live registrations. Moreover, the number of trademarks for which an assignment was recorded has also grown annually, though this trend appears to be reversing in the last decade. Even as the overall stock of trademark properties being held in the economy has grown, we find that a uniform 5 to 8 percent of live properties have some kind of transaction recorded at the USPTO each year. About 3 percent were assigned each year (although that share has declined over time) and about 2 percent per year have a security interest claim recorded (although this share has increased over time). In fact, for each year since 2003, more trademark properties were recorded as collateral to secure debt than those recorded as being assigned between parties.
Our analysis also presents other important findings. Calculations imply that while trademark assignments done in the context of mergers between companies are a relatively small in volume relative to other types of transactions recorded in the dataset, they nevertheless tend to involve the transfer of more properties on average. The data further suggest that, while most transactions are between U.S. parties, “exported” trademark properties (those assigned from domestic assignor to foreign assignee) tend to outnumber “imported” properties (those assigned from foreign assignor to domestic assignee). Moreover, we find that foreign-source financing of trademark-secured debt is not uncommon in the data, particularly in more recent years.
The data also suggest that transactions over registered trademarks are not uncommon. By examining the incidence of transaction among the 3.4 million registrations issued during the 1978-2013 period, we report in Section 5.3 that 31 percent were affected by some transaction over their life; 21 percent changed ownership through assignment or merger; and 12 percent were affected by a security interest agreement. While further empirical work is needed to validate our findings, an analysis of transaction rates by registration cohort suggests that registered trademarks may be traded at higher rates than are patents. Moreover, by comparing older and younger registrations, we find that younger cohorts tend to be involved in a transaction sooner after their filing dates, often being transacted prior to registration issuance or first maintenance event. Surprisingly, we do not find a positive relationship between the incidence of trade and maintenance, providing an intriguing suggestion that trademark assignment and maintenance outcomes may not follow the pattern observed for patents.
The Trademark Assignment Dataset provides a number of opportunities for researchers. For instance, trends in the marketplace for brands can be studied. Transactions can occur during any phase of a registered mark’s lifecycle (filing through death) and registrations can be renewed indefinitely so long as the mark remains in use. Accordingly, the data capture lengthy assignment histories for some properties.

6
Indeed, the oldest transacted registration in the dataset was issued in 1884 and remained a live registration as of the January 2014.5
That said, it is important that researchers understand the limitations inherent in these trademark assignment data. Because assignments and other transactions are recorded as submitted with minimal to no verification or validation, users should be cautious of potential recordation errors and redundancies (see Section 4.3). Given lags between the trademark registration process, the execution of transactions, and recordation, truncation and censoring will often be a problem, particularly in the later years in the period. Selection is also likely to be an issue, since there is no legal requirement to record an assignment or any other transaction pertaining to a trademark property with the USPTO: Federal recordation is permissive, not mandatory. As we catalogue below in Section 3.1, statutory and regulatory law provides compelling incentives for parties to record transactions throughout the entire life of a registered mark. Nevertheless, we find some evidence of censoring due to non-recordation of non-maintained marks. Because of the potential for systematic censoring, researchers should use caution when studying the relationship between maintenance, assignment, and value.
Despite such caveats, release of these data opens new avenues for research, including that related to trademark collateralization and the market for brands. Intensifying trademark collateralization, by providing a means to raise capital in the credit market, may benefit trademark holders and possibly affords an alternative to the sale of trademark assets (WIPO, 2013). Yet, it also raises the question of whether such credit practices may have emerged from greater market efficiency and improved valuation practices or from a permissive regulatory environment that inadequately accounts for risks inherent in these assets. The drivers and welfare effects of trademark collateralization may have implications in the increasingly innovation-driven economy and warrant further study. We anticipate that the release of these data will greatly enhance our understanding of the market for brands. Transaction rates indicate that a large proportion of registered trademarks are traded, though more empirical work on the probability and determinants of trade is still needed.
The remainder of this paper is organized as follows. In Section 2, we survey some past empirical research on trademarks, the market for IP, and IP collateralization. Section 3 provides a brief primer on the most common types of transactions recorded with the USPTO. Section 4 describes the source and organizational structure of the Trademark Assignment Dataset and reviews the key variables in each data file. In Section 5, we discuss trends in executed transactions and transacting parties and examine the rate of transaction for issued registrations. Section 6 concludes with some suggestive topics for further study.
2. LiteraturereviewTraditionally, the literature on trademarks has been largely non-empirical in nature, examining the trademark system from a historic or legal perspective (e.g., Schechter, 1927), through economic theory (e.g., Landes and Posner, 1987), in the context of strategic brand management (e.g., Elliot and Percy,
5 U.S. Reg. No. 11210 for a logo containing the term “SAMSON” for use on “CORDS, LINES…AND ROPES”. Registration last renewed on December 14, 2013.

7
2006), or for intangible asset valuation conditional on subjective considerations (e.g. Wilkins, 1992; Smith 1996). While still limited, the body of empirical literature on trademarks has lately grown, particularly in Europe but also in the United States. Recent empirical works have studied the relationship between trademarks and firm market value (Sandner, 2009; Sandner and Block, 2011), firm productivity and employment (Greenhalgh et al., 2011), financial returns to branding efforts (Krasnikov, Mishra, and Orozco, 2009), innovative activity in service and high-tech sectors (Schmoch, 2003; Mendonca et al., 2004; Millot, 2009; Gotsch and Hipp, 2011). Other scholars link trademark data with data on patents, copyrights, or other forms of IP to examine complementarities (Somaya and Graham, 2006; Llerena and Millot, 2013; Apple, 2013) or model innovation functions at the firm (Heimonen, 2012) or regional scale (Ferreira and Godinho, 2011) to discern the relative importance of IP rights. Despite these few examples, literature using U.S. trademark administrative data remain rare and studies employing trademark assignment data are even more scarce.
Quite the opposite is true for studies using the patent data. Literature investigating or employing patent data is well-established and abundant,6 although those employing patent assignments are less so. Chesbrough (2006) completed one of the first studies exploring the market for trading IP using USPTO patent assignment data. He showed a rising trend in reassignments of patents, often involving a number of intermediary firms to facilitate this activity. Serrano (2010) used USPTO data on patent assignments and renewals to examine the market for patents, finding that the proportion of patents traded is large—13.5 percent of granted patents are traded at least once over their life cycle—but differs across technology fields and type of patentees. He models patent transfers and renewals and finds that younger, frequently cited, more original, and recently traded patents are more likely to be traded and renewed. Galasso, Schankerman, and Serrano (2013) employed patent assignments with patent litigation data to test a model of gains from trade in patent enforcement, using an instrumental variable approach based on differences in tax rates.
Literature of IP collateralization is sparse, predominantly using legal analyses to examine the use of intangibles to secure debt (Bezant, 2003; Brian, 2011). Murphy (2002) provides a detailed review of the U.S. laws governing collateralization of intangible property, particularly patents, copyrights, and trademarks, and the ambiguity of perfecting security interests in such assets relative to tangible counterparts. UNCITRAL (2011) supplies a comparable discussion at the international level. Both present policy prescriptions to reduce uncertainty surrounding the use of intellectual property as collateral. Amable et al. (2010) present a theoretical framework for using patents as collateral by innovative firms, suggesting that patent collateralization increases the effect of innovative rents on investment. In a rare empirical study, Loumioti (2011) finds that 21 percent of U.S.-originated secured syndicated loans during the 1996-2005 period were collateralized by intangibles (patents, trademarks, and/or copyrights), with intangible asset collateralization increasing over that time. She examines the determinants of this credit practice and the ex-post performance of loans secured by intangibles and finds evidence consistent with
6 There is an extensive body of economic literature using patent data (Pakes and Schankerman, 1984; Schankerman and Pakes, 1986; Pakes, 1986; Tratjenberg, 1990; Jaffe, Henderson, and Tratjenberg, 1993; Putnam, 1997; Lanjouw, 1998; Schankerman, 1998; Harhoff, Narin, Scherer, and Vopel, 1999; Lanjouw and Schankerman, 2001; Hall, Jaffe, and Tratjenberg, 2001; etc.).

8
intangible asset collateralization being an innovation rather than a negative mutation in the corporate loan market.
3. TypesoftransactionsrecordedwithUSPTOThe USPTO allows for the recordation of assignments to maintain a complete history of all claimed interests in a mark under Section 10 of the Lanham Act.7 In addition to assignments of an assignor’s interest, the USPTO allows the recording of documents that affect the title to a trademark application or registration, principally certificates issued by appropriate authorities showing a change of name or merger of businesses.8 The Office also will allow parties to record certain instruments that do not constitute an assignment or change of title but are relevant to mark ownership, such as security agreements, licenses, consent agreements, liens, and mortgages.9 The USPTO records these instruments to give third parties notice of equitable interest or other matters pertaining to mark ownership.10 In our dataset, the nature of conveyance text indicates whether the transaction being recorded is an assignment, name change, merger, security interest agreement, or other instrument (see Section 5.1.1). Recordation of any of these types of transactions is not mandatory, but statutory and regulatory law provides compelling incentives for parties to record. Below we provide a brief primer on trademark law as it applies to the most common types of transactions recorded with the USPTO.11
3.1. Assignmentofassignor’sinterestandgoodwillAn assignment of assignor’s interest (henceforth “assignment”) is a transfer by an assignor of its entire right, title, and interest in a registered mark or a mark for which an application for registration has been filed.12 After a valid assignment, the assignee acquires all of the legal advantages of the mark that the assignor enjoyed, including priority of use.13 Under American common law, an entity establishes rights and priority over others only through prior and continuous use of the mark in commerce.14 A later (or
7 15 U.S.C. § 1060. See TMEP § 501.01. 8 37 C.F.R. § 3.11(a). TMEP § 503.02. 9 Id. 10 An equitable interest is an “interest held by virtue of an equitable title (a title that indicates a beneficial interest in property and that gives the holder the right to acquire formal legal title) or claimed on equitable grounds, such as the interest held by a trust beneficiary. Black's Law Dictionary (9th 3d. 2009). 11 See generally Case Files § 3 for general background on trademarks and the Federal trademark registration process. 12 37 C.F.R. § 3.1. 13 See, e.g., Johanna Farms, Inc. v. Citrus Bowl, Inc., 468 F. Supp. 866, 874–875, 199 U.S.P.Q. 16 (E.D.N.Y. 1978) (“[T]he legitimate purchaser becomes transfixed to the position of his predecessor, enjoying the latter's rights in the mark dating from its initial use and suffering the burdens on and limitations of its use that were incumbent on his predecessor.”); Federal Treasury Enterprise Sojuzplodoimport v. Spirits Int’l. N.V., 623 F.3d 61, 68, 96 U.S.P.Q.2d 1906 (2d Cir. 2010) (“[O]nly after a valid assignment of trademarks does the assignee succeed to the rights of the assignor.”). The Lanham Act codifies this rule by providing that the terms “applicant” and “registrant” include “legal representatives, predecessors, successors and assigns of such applicant or registrant.” 15 U.S.C. § 1127. See 2 J. Thomas McCarthy, MCCARTHY ON TRADEMARKS AND UNFAIR COMPETITION § 18:15 (4th ed. 2010) (“McCarthy”). 14 Unlike patent law, rights in trademarks are not acquired through discovery or invention of the mark, but only through actual use. Likewise, while in most civil law nations that follow the rule that ownership and priority go to the party first to file an application or obtain registration, in the United States, the rule of priority is that ownership and priority go to the party who was first to use the mark in commerce. See, e.g., Sengoku Works Ltd. v. RMC Int’l., Ltd., 96 F.3d 1217, 1219, 40 U.S.P.Q.2d 1149 (9th Cir.), as modified, 97 F.3d 1460 (9th Cir. 1996) ("To acquire ownership of a trademark it is not enough to have invented the

9
“junior”) user of a mark is liable to a senior user if there is a likelihood of consumer confusion from parallel use of the same or similar mark on identical or related goods. Federal registration confers additional benefits15 but is not necessary for an entity to create, enforce, or transfer common law trademark rights. Even if the assignment fails to comply with federal requirements, common law rights in a mark (registered or not) may still pass between parties.16 Note, however, that assignment of a mark in gross, i.e. apart from goodwill which it symbolizes, is invalid under both federal and common law (see Section 3.1). An owner may assign only a portion of his or her interest in a trademark to a third party via a partial assignment. For instance, an owner may transfer part of its business with the mark and goodwill associated with that portion, i.e., the portion related to some of the listed goods and services, while maintaining the mark for use in connection with the retained portion.17
Federal recordation of an entire or partial assignment is not mandatory. There is no express legal requirement for parties to disclose trademark assignments to the USPTO; however, both statute and federal regulations provide incentives for recordation. Per the Lanham Act, recordation with the USPTO provides prima facie evidence of execution, placing the burden on the challenging party to prove the assignment invalid.18 The statute also provides that failure to record an assignment of trademark rights renders the assignment void against subsequent purchasers of the mark.19 Thus, if an assignment goes unrecorded, the assignor may sell the mark to a subsequent purchaser, and that subsequent assignment, if recorded, will take priority.20 The purchaser in the previous, unrecorded assignment loses rights in the mark. Note that the Lanham Act does not impose a fixed time limit for recordation but requires only that the assignee record before a subsequent purchase to safeguard its rights against a subsequent purchaser’s claim.
Federal regulations provide further incentive for recordation by limiting the ability of an unrecorded assignee to take certain legal actions with regard to the assigned application or registration. Only the owner of record may take action in a trademark matter pending before the USPTO, including prosecuting mark first or even to have registered it first; the party claiming ownership must have been the first to actually use the mark in the sale of goods or services."). See McCarthy’s § 16. 15 See Case Files § 3. 16 See Ph. Schneider Brewing Co. v. Century Distilling Co., 107 F.2d 699, 43 U.S.P.Q. 262 (10th Cir. 1939). The court explained that the substantive rights attached to a trademark are determined wholly by common law principles, and that the statutory provisions for the registration of trademarks and the assignment of registered marks neither confers nor limits these substantive rights. See McCarthy § 18:11. 17 See VISA, U.S.A., Inc. v. Birmingham Trust Nat’l Bank, 696 F.2d 1371, 216 U.S.P.Q. 649 (Fed. Cir. 1982). If the assignor assigned a registration with respect to only some of the listed goods and services, both the assignor and assignee must filing maintenance and renewal applications to maintain the registration. See TMEP § 1615 regarding requests to divide registrations in which ownership has changed with respect to some but not all of the goods/services. 18 15 U.S.C. § 1060(a)(3). See, e.g., Sonic Distributors, Inc. v. Int’l Battery, Inc., 175 U.S.P.Q. 255 (T.T.A.B. 1972) (“Under Section 10 of the Act of 1946, recordation of an assignment in the Patent Office is prima facie evidence of execution. Since there is no rebuttal of the assignment, petitioner must be considered the owner of the registrations which it has pleaded.”). 19 “An assignment shall be void against any subsequent purchaser for valuable consideration without notice, unless the prescribed information reporting the assignment is recorded in the United States Patent and Trademark Office within 3 months after the date of the assignment or prior to the subsequent purchase.” 15 U.S.C. § 1060(a)(4). 20 See Old Charter Distillery Co. v. Ooms, 73 F. Supp. 539, 75 U.S.P.Q. 280 (D.D.C. 1947), aff'd, 188 F.2d 614, 87 U.S.P.Q. 365 (D.C. Cir. 1950); Belden v. Zophar Mills, Inc., 34 F.2d 125 (2d Cir. 1929); R & R Partners, Inc. v. Tovar, 447 F. Supp. 2d 1141, 82 U.S.P.Q.2d 1572 (D. Nev. 2006) (“Because the assignment was invalid, R & R has not suffered an injury in fact and does not have standing to maintain this action. …. However, the court finds that LVCVA does have standing to bring this action. Because the alleged assignment was invalid, all rights in the WHHSH mark remained with LVCVA.”).

10
an application or submitting documents to maintain a registration. The original applicant is presumed to be the owner of a trademark application or registration, unless there is an assignment.21 To become the owner of record, the assignee must establish ownership in compliance with 37 C.F.R. § 3.73(b), which generally requires the assignee submit documentary evidence of a chain of title from original owner to assignee (See Section 4). Since a registration must be maintained by the expiration of the sixth year after registration and maintained and renewed at consecutive ten-year periods following the registration date, indefinitely, to remain live, this incentive to record does not diminish over the life of a registered mark.22 This requirement is also likely to compel trademarks owners changing their name or merging with other parties to record such transactions with USPTO as the resulting entity must establish itself as the owner of record to take action with regard to the affected trademark assets. Indeed, we observe recordation of assignments, name changes, and mergers lumped around the sixth-, tenth-, and twentieth-year of registration for the aforementioned reasons (see Section 4.3.1 and Figure 8).
More generally, one function of the U.S. Trademark Register is to provide notice of claimed rights which increases business certainty as to use of marks in commerce. Recording current ownership information with the USPTO is typically in the owner’s best interest because it confirms, for purposes of mark clearance by third parties, that the claimed right and the actual use of the mark in commerce are by the same entity. Owners pursue federal registration, in part, to make the market aware of the brand and their trademark rights, and similar motivation are likely to induce assignees to record the transfer of those rights.
3.1.1. Anti‐assignmentingrossAs we noted above, in the United States, a trademark cannot be assigned between parties apart from the goodwill it symbolizes.23 The “anti-assignment in gross” rule arises from common law24 and subsequent codification in the Lanham Act.25 If an assignment is deemed invalid as being “in gross,” the purported assignee acquires no ownership rights in the mark and has no standing to sue a third party for infringement. What legally constitutes a sufficient transfer of corresponding goodwill for a valid assignment has evolved over time.26 The modern view generally holds an assignment to be valid if the assignee’s use of the mark will not mislead or deceive consumers and preserves the continuity of the 21 37 C.F.R. § 3.73(a). 22 See Case Files § 4.2. 23 Trademark systems in most other countries do not require the transfer of the corresponding goodwill. See 3-10 GILSON ON
TRADEMARKS § 10.02 24 See, e.g., Mr. Donut of America, Inc. v. Mr. Donut, Inc., 418 F.2d 838 (9th Cir. 1969). 25 15 U.S.C. § 1060(a)(1). See McCarthy § 18 for detailed legal background on anti-assignment in gross and anti-trafficking rules. 26 The traditional interpretation required full transfer of business ownership, including tangible assets, to be deemed a valid trademark assignment. See MacMahan Pharmacal Co. v. Denver Chem. Mfg. Co., 113 F. 468 (8th Cir. 1901). Under this interpretation, assignment also required the assignor refrain from selling similar products under a different brand after the transfer of the mark. See Bulte v. Iglehart Bros., 137 F. 492 (7th Cir. 1905). The courts have relaxed the rule over time, initially accepting transfer of only the assets necessary to produce the same goods. See, e.g., Mulhens & Kropff, Inc. v. Ferd. Muelhens, Inc., 43 F.2d 937 (2d Cir. 1930). The courts then deemed the transfer of tangible assets unnecessary so long as the assignee’s products were substantially similar. See, e.g., Old Charter Distillery Co. v. Ooms, 73 F. Supp. 539 (D.D.C. 1947). Later, the courts required only that the assignor’s products be similar in kind. See, e.g., Hy-Cross Hatchery, Inc. v. Osborne, 303 F.2d 947 (C.C.P.A. 1962). See generally Irene Calboli, Trademark Assignment “With Goodwill”: A Concept Whose Time Has Gone, 57 FLA. L. REV. 771 (2005) and McCarthy § 18:3.
11
goodwill symbolized by the mark.27 We highlight the evolution of this rule to stress that the nature of trademark assignments executed at earlier dates may differ from that of assignments executed more recently.28
3.2. SecurityinterestagreementsAs potentially valuable assets, trademarks may serve as collateral for debt via a security interest agreement. Under a typical agreement, a lender takes an interest in the trademark to secure payment on a loan. The debtor retains title to the mark and the lender, as a secured creditor, has certain preferential rights in the disposition of the asset. Thus, a security agreement does not involve a change of ownership unless and until the borrower defaults and the lender forecloses on and seizes the mark.29 Security interests are enforceable between parties to the agreement, but creditors wishing to defend their interest against third parties must record, or “perfect,” their security interest in the debtor’s collateral. Perfecting a security interest assures creditors priority over subsequent third party claims to the collateral (Murphy, 2002).
The law is not settled concerning the proper venue in which to record a financing statement in order to perfect a security interest in a trademark. At present, perfection can be accomplished under Article 9 of the Uniform Commercial Code (U.C.C.).30 Although the U.C.C. provides that any federal filing scheme would preempt its provisions, case law suggests that the Lanham Act only addresses the (immediate) assignment of trademarks, not security interests (a conditional future assignment) on federally registered
27 See, e.g., Green River Bottling Co. v. Green River Corp., 997 F.2d 359 (7th Cir. 1993) (“A trademark cannot be sold ‘in gross,’ that is, separately from the essential assets used to make the product or service that the trademark identifies. … The discontinuity would be too great. The consumer would have no assurance that he was getting the same thing (more or less) in buying the product or service from its new maker.”); Sugar Busters LLC v. Brennan, 177 F.3d 258, 50 U.S.P.Q.2d 1821 (5th Cir. 1999) (“The purpose of the rule prohibiting the sale or assignment of a trademark in gross is to prevent a consumer from being misled or confused as to the source and nature of the goods or services that he or she acquires.”). See McCarthy, § 18:3. 28 The general rule is that an invalid assignment operates to pass no rights to the purported assignee. Generally, the most notable impact is that the purported assignee does not succeed to the assignor’s priority of use. See Luckie Magic Corp. v. McCall Mfg. Co., 133 U.S.P.Q. 487 (TTAB 1962); Royal Baking Powder Co. v. Raymond, 70 F. 376 (C.C.D. Ill. 1895), aff'd, 85 F. 231 (7th Cir. 1898) (assignee under invalid assignment acquires rights by use from date of his own first use); Mister Donut of America, Inc. v. Mr. Donut, Inc., 418 F.2d 838, 164 U.S.P.Q. 67 (9th Cir. 1969), overruled in part by Golden Door, Inc. v. Odisho, 646 F.2d 347, 208 U.S.P.Q. 638 (9th Cir. 1980) (defendant not entitled to priority as of date of invalid assignment, but entitled to its own date of first use). 29 Henry, S., Ferraro, H. and Keeton, H. “Securing a Loan with Patents, Trademarks, and Copyrights is Best for Lenders,” Pratt’s Journal of Bankruptcy Law, Issue 1, January 2010, pp. 50-64. For the purposes of the anti-assignment in gross rule, a security agreement is comparable to a conditional assignment, i.e. not a present transfer of the mark, but an agreement to assign in the future event of default and, therefore, does not require the transfer of goodwill. However, if the debtor defaults and the creditor-assignee enforces the security, the mark must pass with the goodwill it symbolizes for the assignment to be valid. Haymaker Sports, Inc. v. Turian, 581 F.2d 257, 198 U.S.P.Q. 610 (C.C.P.A. 1978); In re Roman Cleanser Co., 802 F.2d 207, 231 U.S.P.Q. 301 (6th Cir. 1986) (when the creditor enforces the conditional assignment security, there is an operative assignment which must meet the anti-assignment-in-gross rule). See McCarthy’s § 18:7. 30 Article 9 of the U.C.C. governs security interests in personal property, including “general intangibles” which encompass intellectual property. U.C.C. § 9-109(a)(1). To perfect a security interest in general intangibles, a lender must file a U.C.C. financing statement with the state authority in the jurisdiction in which the borrower resides. U.C.C. § 9-301(a).

12
marks.31 Thus, without an express federal statute, case law points to the U.C.C. as governing the proper method of perfecting.32
Though neither necessary nor sufficient to perfect a security interest in a mark, commentators consider it advisable to record a security interest at the USPTO.33 According to one source, “[t]hese instruments are recorded to give third parties notification of equitable interests or other matters relevant to the ownership of a mark.”34 Thus, while recording with the Office is not considered a “constructive” notice, it may provide actual or “inquiry” notice to subsequent purchasers who rely on the USPTO record.35
4. Datafiles
4.1. DatasourceTo record a transaction with the USPTO, a party must submit supporting documentation, Form PTO-1594 (a required coversheet, hereafter “coversheet” or “PTO-1594”) 36, and pay prescribed fees.37 Proper
31 In re Roman Cleanser Co., 43 B.R. 940 (Bankr. E.D. Mich. 1984) (holding that assignments are transfers of title, and security interests only secure repayment of indebtedness.); In re Together Dev. Corp., 227 B.R. 439, 441 (Bankr. D. Mass. 1998). See Xuan-Thao Nguyan, The New Uniform Commercial Code; Intellectual Property and Security Interest, 2007 A.L.I.-A.B.A. CONTINUING LEGAL EDUC. 417, 434 (“Under federal trademark law, there is no definition of assignment, which casts doubt on whether assignment of a trademark is to encompass a grant of security interests. Courts have resolved such doubt by examining the ordinary usage of the term ‘assignment’ at the time the Lanham Act was passed in 1946, prior to the promulgation of Article 9 of the U.C.C.)”_ 32 Id. See also Trimarchi v. Together Dev. Corp., 255 B.R. 606, 611 (D. Mass. 2000); In re TR-3 Industries, 41 B.R. 128, 131 (Bankr. C.D. Cal. 1984) (The omission by Congress of a registration provision for security interests in trademarks was purposeful and the recordation provision of the Lanham Act does not preempt Article 9); In re C.C. & Co., Inc., 86 B.R. 485, 487 (Bankr. E.D. Va. 1988) (Congress did not intend Lanham Act to provide method for perfection of security interest in trade names and lender had properly perfected its security interest in a trade name by filing financing statement under Virginia's U.C.C.); In re Chattanooga Choo-Choo Co., 98 B.R. 792 (Bankr. E.D. Tenn. 1989) (Lanham Act provides only for registration of ownership, not notice of security interests, and therefore Article 9 governs perfection of a security interest in a trademark); In re 199Z, Inc., 137 B.R. 778, (Bankr. C.D. Cal. 1992) (because Lanham Act refers only to assignments and not to "pledges, mortgages, or hypothecations of trademarks," a PTO filing did not perfect the creditor's security interest in a trademark). 33 See Aneta Ferguson, The Trademark Filing Trap, 49 IDEA 197 (2009) (“Such recording is permitted and provides actual notice…Actual notice will be enough to deprive a purchaser of his bona fide status.”). See William C. Hillman, Documenting Secured Transactions, PLIREF-SECTRN § 3:11.1 at 3-20 (2007) (“The fact remains that any recorded instrument can provide actual notice, if someone searches the records of the Patent and Trademark Office.”); Thomas M. Ward, The Perfection & Priority Rules for Security Interests in Copyrights, Patents & Trademarks; The Current Structural Dissonance & Proposed Legislative Cures, 53 Me. L. Rev. 391, 433 (2001) (Filing an ordinary security agreement with the PTO may provide “inquiry notice” to those who access the database.) 34 TMEP § 503.02. See Snow Machs., Inc. v. S. Slope Dev. Corp., 754 N.Y.S.2d 383, 386 (N.Y. App. Div. 2002) (illustrating that an unprotected security interest can obtain priority over a buyer, if the buyer took the collateral with actual knowledge of the unperfected security interest.) See Alice Haemmerli, Insecurity Interests: Where Intellectual Property And Commercial Law Collide, 96 Colum. L. Rev. 1645, 1671 (1996) (discusses the TMEP’s past provisions addressing the lack of constructive notice for recording security interests). 35 Murphy, 2002. Constructive notice refers to notice presumed by law to have been acquired by a person and thus imputed to that person. See BLACK’S LAW DICTIONARY 1164 (9th ed. 2009). Inquiry notice refers to notice attributed to a person when the information would lead an ordinarily prudent person to investigate the matter further. See BLACK’S LAW DICTIONARY 1165 (9th ed. 2009). 36 37 C.F.R. § 3.73(b). A name change requires only a cover sheet without documentation. 37 C.F.R. § 3.25(a). The cover sheet must record the following: conveying party (assignor) name; receiving party (assignee) name, address, legal entity and citizenship; a description of the nature of the conveyance (assignment or other transaction recorded); each application serial number or registration number for which the document is recorded (if known); a name and address for correspondence; date the
13
supporting documentation consists of a copy of the document (e.g., an executed assignment), a copy of an extract from the document evidencing the effect on title, or a statement signed by both assignee and assignor explaining how the conveyance affects the title.38 The coversheet includes information related to the transaction, such as the parties’ identity, dates, and a brief description of the transaction. The USPTO launched the Electronic Trademark Assignment System (ETAS) in 2003 to allow parties to complete an online coversheet and submit supporting documentation electronically. It is important to note that the hard-copy (physical) and electronic versions of the coversheet differ (see Appendices I and II).
The USPTO Assignment Recordation Branch subsequently records the coversheet and documentation in the Assignment Database and issues a notice to the parties reflecting the information recorded.39 Generally, the USPTO does not examine the substance of documents submitted. Recordation is a ministerial act and not a determination of the document’s validity or effect on title. The USPTO determines the effect of a document only when an assignee attempts to take action on an application or registration.40 Since only the owner of record may take action in a trademark matter pending before the Office, the USPTO will examine the chain of title solely for the purposes of determining whether the owner of record and the entity attempting to take an action are the same party.41
The Trademark Assignment Dataset is derived from the information submitted to the USPTO in the PTO-1594 coversheet and supporting documentation. The USPTO releases this information to the public in hierarchically-structured XML files via Data.gov.42 These XML files contain transaction-specific data for each recordation, including the recordation date and conveyance text, and multiple nested elements, such as an entry for each assignor and assignee.43 We parsed the XML files and migrated the data to non-
document was executed; and a signature of the party submitting the document. 37 C.F.R. § 3.31. The cover sheet should also record: conveying party (assignor) legal entity and citizenship; the total number of applications and registrations involved; the total fee; and an identification or description of the mark. TMEP § 503.03(e). 37 Per the fee schedule effective January 1, 2014 (last revised March 19, 2013), the fee to record a trademark assignment or other transaction is $40 for the first trademark per document and $25 for second and subsequent marks in the same document. See http://www.uspto.gov/web/offices/ac/qs/ope/fee031913.htm#tmsvc. 38 Prior to October 31, 1999, the USPTO would only record the original document or a true copy of the original. The Trademark Law Treaty Implementation Act amended Lanham Act § 10, effective October 30, 1999 to permit recordation of either the original document or these forms of supporting documentation. 39 The USPTO maintains the Assignment Database separate from the Trademark Administrative Database. 37 C.F.R. § 3.85. As of November 2, 2003, with some exceptions, the USPTO will automatically update owner records in Trademark Administrative Database when an assignment of entire interest and goodwill, merger, nunc pro tunc assignment, or name change is recorded with the Assignment Recordation Branch. The Trademark Administrative Database is not updated automatically if: a) the execution date is earlier than or the same as the execution date of a previously recorded document; b) a party files multiple assignments with the same execution date on the same day; c) recordation occurs during specific blackout periods in prosecution when ownership of pending applications cannot be updated; or d) if the maximum number of assignments has been recorded during the life of the application – i.e. 9 before publication and 9 after publication. When such exceptions apply, the assignee must separately notify Trademark Operations to update the Trademark Administrative Database. See TMEP § 504.01; Case Files § 4.3. 40 37 C.F.R. § 3.54 41 37 C.F.R. § 3.73(b); TMEP § 502.01. 42 https://explore.data.gov/Business-Enterprise/Trademark-Daily-XML-Applications-Assignments-and-T/eqbw-esys. The USPTO also makes the Trademark Assignment XML files available for bulk download at through the Reed Tech bulk data products site http://trademarks.reedtech.com/index.php. All of these sources provide the XML files wrapped inside downloadable ZIP files. The concatenated XML documents are not the same as standard XML files and, thus, are not immediately readable by an ordinary XML parser. We used a SAX (Simple API) parser to parse the XML files. 43 Documentation for the source XML files is available at http://www.uspto.gov/products/xml-resources.jsp.

14
nested rectangular data files in comma-separated values (CSV) and Stata dataset (DTA) formats to be more compatible with statistical software. The result is a relational database described here.
4.2. DatafilestructureFigure 1 displays the organizational structure of the Trademark Assignment Dataset (excluding constructed data files). There is one primary data file, which we refer to as tm_assignment, that contains a single observation for each transaction recorded with the USPTO. Each transaction has a distinct reel number and frame number combination or “reel-frame identification” (rf_id).44 The rf_id uniquely identifies each record in tm_assignment, and users should use the rf_id to link tm_assignment to the three secondary data files. These secondary files include data on the assignor(s), assignee(s), and propert(ies) for each rf_id in tm_assignment. There is one tertiary file that includes information on assignee sub-parties, though it is only observed in the source XML starting with transactions recorded in late 2013. For the sake of brevity, we discuss only variables of particular interest to researchers below. We include tables in Appendix III listing variable names, formats, coverage, and definitions for each data file. Also, as a resource for researches using our data, we highlight here the Assignments on the Web for Trademarks (AOTW-TM) web tool for searching for an individual transaction record.45 For most transactions recorded after April 1998, the AOTW-TM system will contain a copy of the coversheet and supporting documentation in PDF formats.
Data coverage varies across recordation year cohorts as well as data files. For example, assignor or assignee address data may be populated for transactions recorded at earlier dates but missing for more recently-recorded transactions. Similarly, nationality and legal entity fields may be populated for the assignee but not the assignor in the same transaction. To guide users in determining the appropriate approach for dealing with missing data, we graph data coverage for key variables in each of the three main data files in Figures 2, 3, and 4.
It is important to clarify some terminology before describing the data files in more detail. To reiterate, we use the terms “transaction” and “recordation” interchangeably to refer to rf_ids of all conveyance types (i.e.. assignments, name changes, mergers, security interest agreements, etc.). We use the terms “property” or “asset” to refer to a single trademark application or registration involved in a transaction. Each property is uniquely identified by its serial number, which is comparable to an application identification number.46 Since a single transaction may affect more than one property, we also discuss our observations at the transaction-property level of analysis. In this context, such property-level transactions
44 The one- to six-digit refers to the microfilm reel number of the assignment entry in USPTO records. The one- to four-digit frame number refers to the location of the assignment entry on the reel number in USPTO records. While both reel number and frame number are sequential, there are missing values in the sequence because each only specifies the first page of the assignment records and records may have multiple pages. In each data file in the dataset, we retain leading zeros in the rf_id to facilitate matching. 45 Available at http://assignments.uspto.gov/assignments/q?db=tm 46 All applications filed for U.S. trademark registration are issued an eight-digit serial number comprised of a two-digit series code and six additional numbers assigned by order of filing within the series code. Generally, the series codes correspond to significant changes to the federal registration system. See TMEP § 401.02. All properties have a unique serial number. Only applications issued a registration have a unique seven-digit registration number.

15
capture the number of properties affected by any transaction (“transacted properties”) during a particular time period. By combining rf_id and serial number, one may uniquely identify each property-level transaction.
4.2.1. tm_assignment&tm_conveyThe tm_assignment data file contains a single entry for each of the 786,931 transactions recorded with the USPTO during the 1952 to 2013 period. While the earliest recordation date in tm_assignment is March 26, 1952, the number of transactions recorded before 1955 is negligible.47 Thus, we largely limit all time trend graphs to recordation year cohorts 1955 through 2013. The tm_assignment data file includes the rf_id, the recordation date, a page count, and fields for the correspondent name and address (this last typically reflects a “power of attorney” or legal representative). The five correspondent-address fields consist of free-form text strings rather than distinct fields for street, city, state, etc. Finally, the file contains a conveyance text field which captures information from the coversheet, entered either from a pre-specified list of “nature of conveyance” types or as user inputted text describing the interest conveyed or transaction to be recorded. Figure 2 shows data coverage for key variables in tm_assignment by recordation year cohort. Correspondent name and address fields are populated for all but the earliest recordation year cohorts. Conveyance text data is missing for a very minor share of transactions, most of which were recorded between 2008 and 2010.
4.2.2. tm_convey(constructed)The conveyance text field in tm_assignment is not well standardized. The pre-specified menu of nature of conveyance types varies over time and across paper and electronic version of the PTO-1594 coversheet (see Appendices I and II). Recording parties largely opt to input a description rather than select from the listed options, especially before 1964 and after 1994.48 Nonetheless, some specific phrases, such as “entire interest,” “security interest,” or “merger,” can be exploited for pattern matching. To aid users, we employed pattern matching within the conveyance text field to construct the tm_convey data file, which contains a generated variable conveyance subcategory (conv_group) field for each rf_id. In order to create the variable, we first applied the Levenshtein (1966) algorithm to group conveyance text observations based on matching strings.49 We then designated a distinct conveyance subcategory to each record by searching on strings included in the coversheet list, as well as those occurring most frequently in the user-inputted conveyance field over time. For any remaining records, we used regular expressions to identify
47 There are six rf_ids in tm_assignment with a recordation date prior to 1955. Additionally, there are 24 rf_ids in tm_assignment that do not have a populated recordation date. These observations are omitted from all trend graphs by recordation year. 48 We identified conveyance text matching a selection from the pre-formatted list in the current PTO-1594 coversheet (paper or electronic form) for 43 percent of rf_ids in tm_assignment. We observe very common terms that may reflect the term captured rather than that listed in the pre-formatted list. For example, “ASSIGNS THE ENTIRE INTEREST” is listed in the conveyance field for 31 percent of rf_ids. This phrase is a small variation on the option in the current PTO-1594 coversheet “ASSIGNS THE ENTIRE INTEREST AND THE GOODWILL”. 49 We removed special characters from the conveyance text field prior to applying the Levenshtein algorithm with a 10% threshold.

16
conveyance subcategory.50 Appendix IV provides more detail on searched strings used to designate each conveyance subcategory. While we made our best effort to accurately identify conveyance subcategories in tm_convey, group matching may introduce some measurement error. We encourage data users to improve on our method and devise additional conveyance groupings where appropriate to the research question being investigated.51
4.2.3. tm_assigneeThe tm_assignee file contains data captured for the assignee(s) for each rf_id in tm_assignment. It includes the assignee’s name, address (separate fields for street, city, state, country, and postal code), and nationality (state of origin for U.S. and country of origin for foreign). The data file also includes fields reflecting inputted information consisting of alternative names under which the assignee previously operated (“formerly known as” statement and “DBA/AKA/TA” statement) or parties of which the assignee is composed (“composed of” statement). Figure 3 depicts data coverage for specific fields in tm_ assignee. Assignee street address data coverage improves considerably after 1992, to near complete coverage since 1996.52 Assignee address state and/or country fields are mostly populated starting in 1996 (although users may be able to identify or infer state and country from the street address field for earlier recordations).53
The tm_assignee file contains a legal entity field which captures the selection from a pre-specified menu of entity types or user inputted text describing the assignee’s legal status. The legal entity field appears to be better standardized than the conveyance text field in tm_assignment. The same pre-specified list of entity types appears in both paper and electronic versions of the PTO-1594 coversheet, but the modern electronic form provides additional options (See Appendices I and II). Most parties select a legal entity type from the pre-specified menu rather than input a description.54 As with the other key variables in tm-_assignee, legal entity data coverage is limited until the early 1990s, but the field is mostly populated after 1992, ranging from about 90% to 100% (see Figure 3).
50 See http://www.stata.com/support/faqs/data/regex.html. 51 For example, the conveyance text field may reference specific instruments or assets of potential interest, such as “patent” (1,143 rf_ids) or “copyright” (268 rf_ids). The vast majority of rf_ids referencing “patent” or “copyright” appear to be security agreements or releases. 52 The tm_assignee data file contains two fields for street address: ee_address_1 and ee_address_2. Data coverage for assignee street address in Figure 3 represents the proportion of each recordation year cohort with either street address field populated. For transactions recorded prior to 2003, the second address field is typically populated even when the first address field is not. The first address field is predominantly populated starting in 2003. We presume this is the result of inconsistent data capture after launch of ETAS in 2003. See Section 4. 53 Data coverage for assignee address state/country in Figure 3 represents the proportion of each recordation year cohort with either address state or address country field populated. Coverage for the address city field is omitted from Figure 3 as it is largely comparable to data coverage for address state/country fields across recordation year cohorts. For transactions recorded prior to 1996, the street address fields (ee_address_1 and ee_address_2) may contain city, state, and country data missing from the distinct city (ee_city), state (ee_state), and country (ee_country) fields. We presume that the cover sheet format or data capture process changed in 1996 to allow for distinct address fields. 54 We identified a legal entity code matching a selection from the pre-formatted list in the current PTO-1594 coversheet (paper or electronic form) for about 67 percent of assignee observations in tm_assignee. Note that the legal entity field may be populated with “UNKNOWN” or instruction to “SEE DOCUMENT”.

17
4.2.4. tm_subpartyStarting in September 2013, a new element was added to ETAS to allow parties to separately record information on the sub-parties of which the assignee may be composed. This information was previously recorded in the “composed of” statement in the tm_assignee data file. The new element was added, presumably, to ensure compliance with the regulatory requirement that assignees consisting of partnerships or joint ventures list their constituent partners.55 To facilitate linking assignee observations to their sub-parties, we added rf_id and ee_name (assignee name) fields to the tm_subparty data file. A sub-party can have its own sub-entities (i.e., an assignee can be composed of multiple sub-parties, each of which may be composed of multiple other entities). We constructed two unique identifiers to distinguish first-level assignee sub-parties (sbpty1_id, the sub-parties of the assignee) from their sub-entities (sbpty2_id, the sub-entities of any assignee sub-parties). For both first- and second-level sub-parties, the tm_subparty data file includes fields capturing sub-party name, legal entity type, and state/country.
4.2.5. tm_assignorThe tm_assignor data file contains data recorded for the assignor(s) for each rf_id in tm_assignment. It largely mirrors the tm_assignee data file, capturing much of the same information for the assignor, including assignor’s name, address (separate fields for street, city, state, country, and postal code), nationality (state of origin for U.S. and country of origin for foreign), legal entity code, alternative names (“formerly known as” statement, “DBA/AKA/TA” statement), and parties of which assignor is composed (“composed of” statement). Figure 4 depicts data coverage for key fields in tm_assignor. Assignor address data coverage basically disappears for transactions recorded after 1992, presumably because the PTO-1594 coversheet was revised and ceased recording addresses for assignors.56 By contrast, both assignor nationality and legal entity data coverage improve starting in the late 1980s. As in the assignee data file, the legal entity field in tm_assignor captures the selection from a pre-specified menu or user inputted text describing the assignor’s legal status. The pre-specified menu of legal entity types for assignors is the same as that for assignees (in both the current paper and electronic versions of the PTO-1594). Again, most reporting parties select a legal entity type from the pre-specified list rather than input a description.57
Finally, the tm_assignor file contains date fields capturing the execution date before a notary and the date of the signature of acknowledgement. Generally, only one of these two fields is populated (either the former field is populated when the latter field is not, or vice versa). Moreover, the acknowledgement date field is not generally populated for transactions recorded after 1988.58 As a rule in our foregoing analysis,
55 If party receiving is a partnership or joint venture, the cover sheet should set forth the names, legal entities, and nationality of all general partners or active members that compose the partnership or joint venture. 37 C.F.R. § 3.31(f). 56 See 37 C.F.R. § 3.31(a)(1) and (2). 57 We identified a legal entity code matching a selection from the pre-formatted list in the current PTO-1594 coversheet (paper or electronic form) for about 72 percent of assignor observations in tm_assignor. Note that the legal entity field may be populated with “UNKNOWN” or instruction to “SEE DOCUMENT”. 58 Both execution date and acknowledge date fields are populated in only 50 observations in the tm_assignor data file. Of these, the date fields do not equate in 22 observations with a median absolute value difference of 97 days.

18
we assume that the date of a transaction is given by the execution date field if populated, and use the acknowledgement date field otherwise.
Multiple execution dates are possible for a single transaction since execution dates are recorded on a per assignor basis. For the vast majority (99%) of observations in tm_assignor, there is only one execution date per rf_id even when there are multiple assignors. We find that 1,387 rf_ids relating to 5,368 assignor observations have between 2 and 7 different execution dates (see Table 1). For these rf_ids, the median range between the multiple execution dates is 18 days but some outliers show over 1,000 days between first and last execution.
In order to better understand these records, we reviewed the supporting documentation from ATOW-TM for a small sample of rf_ids with multiple execution dates.59 Typically, the dates reflect different days each assignor signed or notarized the document. For example, rf_id 2435/0648 records the assignment of the registered trademark “MOTIVA” between three assignors (“SHELL OIL COMPANY”, “TEXACO INC.”, and “SAUDI REFINING, INC.”) to a single assignee (“MOTIVA ENTERPRISES LLC”).60 The tm_assignor file contains three execution dates for this rf_id, reflecting the different dates each assignor signed the supporting documentation.61 While a case could be made to use any of the three dates as the execution date for the trademark assignment, we favor using the last date because it denotes signature by all conveying parties, and thus a completed transaction.62 We also prefer using the last execution date because earlier date(s) may signal a prior transaction that the current assignee reports, presumably to establish chain of title. For example, rf_id 3578/0276 records, in July 2007, the assignment of the registered trademark “SHRINKFAST” and lists one assignee (“AF GLOENCO, INC.”) and two assignors (“SHRINKFAST CORPORATION” and “BATTENFELD GLOUCESTER ENGINEERING COMPANY, INC”) with two execution dates over four years apart.63 From the supporting documentation, we determine that the earlier execution date designates a prior exchange between the listed assignors (“SHRINKFAST CORPORATION” assigned the mark to “BATTENFELD” in November 2002).64 The later execution date, in April 2007, signifies the assignment from the receiving party in the prior transactions (“BATTENFELD”) to the assignee listed (“AF GLOENCO, INC.”). Accordingly, the rf_id actually reflects two distinct assignments but only the later transaction was recorded. Again, we opt to apply the last execution date in such a situation because it signifies transfer to the listed assignee. Note that including rf_ids that record a current and prior transaction in the descriptive analysis below may understate the incidence and frequency of transactions. However, given the small number of rf_ids with multiple execution dates (less than 1%) and the fact that we can only identify such rf_ids by manually reviewing the supporting documentation, we opt to ignore this potential source of bias.
59 We pulled a random sample of 100 rf_ids with multiple execution dates and the range between earliest and last execution dates exceeding the median of 18 days. We then reviewed the supporting documentation for each rf_id from ATOW-TM. 60 U.S. Reg. No. 2502341. 61 See documentation from ATOW-TM: http://assignments.uspto.gov/assignments/assignment-tm-2435-0648.pdf. 62 The terms of the contract may render the transaction effective upon the initial party’s signature or signature by a majority of parties. 63 U.S. Reg. No. 1553356. 64 See documentation from ATOW-TM: http://assignments.uspto.gov/assignments/assignment-tm-3578-0276.pdf

19
4.2.6. tm_docidThe tm_docid data file contains identification data for the trademark propert(ies) for each rf_id in tm_assignment. For each property observation, the file contains the serial number, a registration number (if a U.S. registration was issued prior to the rf_id recordation date), and an international registration number (if a registration was issued under the Madrid Protocol prior to the rf_id recordation date).65 There are 4,197,645 property-level observations in tm_docid but only 1,491,485 distinct assets (unique serial numbers), consistent with some properties being involved in multiple transactions.
4.2.7. tm_cf_no(constructed)Recordation of serial and registration numbers in tm_docid is not regulated, and errors are apparent. To aid users wanting to match these data to other sources, we constructed an index data file, tm_cf_no, containing the rf_id, serial number, and registration number from tm_docid and the matching serial number and registration number from the USPTO Trademark Case Files Dataset66 (indicated by the prefix cf_). Both serial number and registration number match in both datasets for 99 percent of observations in tm_docid. For those that do not match on both fields, we constructed an “error” field in tm_cf_no which designates the following possible recordation errors: 1) serial number match with no registration number reported at recordation67; 2) registration number match with possible serial number error in transaction record68; 3) serial number match with possible registration number error in transaction record69; 4) multiple matches possible70; and 5) neither serial number nor registration number match.
4.2.8. tm_fileThe tm_file data file contains information about the generation of the original XML files. The transaction date field indicates the date the file generation process was last executed (in the current version, January 8, 2014).
4.3. CautionsWe reproduced the data from the XML files in their entirety, making no attempt to correct errors, with one exception related to duplicate records present in the XML. We converted only the most current XML file for each distinct rf_id. However, we identified a small number of duplicate assignor, assignee, and property entries within each individual XML file. For example, we sometimes found that the same exact
65 The international registration number is not a unique identifier. Applications with different serial numbers may have the same international registration number. 66 See Case Files. 67 Assignments recorded prior to the registration issuance date where only the serial number was reported. 68 These observations largely involve a serial number with an invalid or unemployed series, such as “80” or “90.” 69 These observations largely involve an invalid or unemployed registration number often with a matching serial number of an abandoned (non-registered) application. 70 Serial number in assignment record links to different registration number in the USPTO Trademark Case Files Dataset and registration number in assignment record links to different serial number in USPTO Trademark Case Files Dataset.

20
information would appear in XML for a single assignee multiple times.71 We removed these duplicate entries from the CSV and DTA files but include – for completeness – a “count” variable in each data file indicating the number of times the entire observation appeared in the XML.72
Because users provide the information to be recorded and the USPTO does not validate the accuracy of that information, typographical errors and inaccuracies are to be expected throughout the data files. However, since there is no means to conduct a large-scale validation to determine to what extent data errors are random, we treat them as such. Likewise, much of the data are not regularized, particularly assignor/assignee name and address fields and conveyance text. We opted to retain the free-form text throughout to allow data users the greatest flexibility in employing these data. Name disambiguation and entity aggregation was beyond the scope of this project.
Users should be cautious of potential biases from recordation practices. Clearly, the dataset captures only those transactions recorded with the USPTO, so that users should be prudent about making inferences about the entire population of transactions. This is plainly illustrated by the minimal number of trademark licenses or licensing agreements included in the dataset. While the clustering on conveyance text shows that “licenses” comprise less than 2% of all transactions in the data (see Appendix IV), the growth in U.S. trademark licensing value reported by the U.S. Bureau of Economic Analysis has grown from $15 billion to $25 billion during 2006 to 2011 (WIPO, 2013), suggesting that such licenses are underreported in the USPTO conveyance data.
4.3.1. DuplicaterecordsandchainoftitleWe also warn users about two particular recordation practices we observe. First, ostensibly the same transaction is recorded multiple times for each trademark property – or subset of properties – affected (i.e., the same recordation and execution dates and matching assignor and assignee data appear for multiple rf_ids, each with distinct serial numbers). For example, rf_id 2018/0372 and rf_id 2018/0390 were both recorded on January 14, 2000 for an assignment executed December 29, 1999 between “JOHNSON, DONALD J.” (assignor) and “JOHNSON TRAILER CO.” (assignee) with the same correspondent name and address listed. Only the affected properties differ: rf_id 2018/0372 records the assignment of the mark “LOAD WARRIOR” and rf_id 2018/0390 the assignment of the mark “LEAD DEMONSTRATOR”.73 Thus, each rf_id appears to be a property-level transaction recorded individually. We identify this type of property-level recording in roughly 6 percent of rf_ids (comprising 3 percent of property-level transactions) in the dataset. We are uncertain whether these anomalies result from the data capture process or recordation practice, although we observe the rf_ids involved are largely for
71 See, e.g., reel frame 764/0904 http://assignments.uspto.gov/assignments/q?db=tm&qt=rf&reel=0961&frame=0046&sno=&rno=&asnr=&asnri=&asne=&asnei=&asns=&apct=&apcti=&rgst=&rgsti= 72 There are 235 observations (0.03%) in tm_assignee, 386 observations (0.04%) in tm_assignor, and 3,900 observations (0.09%) in tm_docid with a count value greater than one, indicating that they appeared more than once in the XML source. 73 Respectively, U.S. Reg. No. 2275329 and U.S. Reg. No. 2277512.The supporting documentation for the two rf_ids is also identical with the exception of different registration numbers listed for the assigned property. See http://assignments.uspto.gov/assignments/assignment-tm-2018-0372.pdf and http://assignments.uspto.gov/assignments/assignment-tm-2018-0390.pdf.

21
assignments and name changes.74 Since this practice affects transaction counts but not property-level transaction counts, we generally employ the latter as our unit of observation. Where we do examine the data by rf_id, such as our examination of properties per rf_id in the analysis associated with Table 1 and Figure 7, the trends and summary statistics remain largely unchanged regardless of whether we omit or include the rf_ids we identified as property-level recordings.
In other circumstances, a seemingly identical transaction is recorded multiple times under different conveyance types or with different conveyance text (i.e., the same recordation and execution dates, matching assignor and assignee data, and identical serial numbers appear for multiple rf_ids, each with a different conveyance). For example, rf_id 3407/0036 and rf_id 3407/0093 were each filed on October 9, 2006 for a transaction executed on May 27, 2003 between “SCHLUMBERGERSEMA TELEKOM GMBH & CO. KG” (assignor) and “LHS TELEKOM GMBH & CO. KG” (assignee) for the same registered mark (“BSCS”). However the former records an assignment and the latter a name change.75 Both of these may have of course been part of the same transaction. So while such dual-recording may overstate both transaction and property-level transaction counts, they occur only rarely in our dataset: We identify potential dual-recording for less than 1 percent of rf_ids (comprising about 2 percent of property-level transactions).76
Users should also take care to note that there is no straightforward method to establish the unbroken chain of title for an individual property using the dataset. Because names are recorded anew from the cover sheet for each transaction recorded with the USPTO, this renders establishing the sequence of transactions for a single property problematic. A new name may appear as an assignor despite not having previously appeared as an assignee or initial registrant. Such gaps may be the result of a prior assignment going unrecorded, or a conveying party being listed under a different name or not being listed at all when reporting as the assignee. Although there is a regulatory requirement that assignees consisting of partnerships or joint ventures list their constituent partners, thus rule does not appear to be widely followed, particularly for older transactions.77 It may be possible for users to improve upon possible broken chain of title by employing other variables in the dataset, particularly assignee addresses and nationality. Additionally, owner data in the USPTO Trademark Case File Dataset can be valuable for verifying changes in the owner of record of trademark properties over time.78
4.3.2. Transactionrecordationlag
74 Of the 50,826 rf_ids identified as potential property-level transactions recorded individually, 56 percent are assignments, 31 percent name changes, and 5 percent had no conveyance recorded. 75 U.S. Reg. No. 2038066. 76 Note that these rf_ids may record distinct transaction with largely the same data. For example, rf_id 3277/0830 and rf_id 3277/0852 have matching recordation date, execution date, correspondent name and address, assignor data, assignee data, and 24 trademark properties but differing conveyance text indicating “SENIOR SECURITY INTEREST” (See http://assignments.uspto.gov/assignments/assignment-tm-3277-0830.pdf) and “SECOND LIEN SECURITY INTEREST” (See http://assignments.uspto.gov/assignments/assignment-tm-3277-0852.pdf). 77 See 37 C.F.R. § 3.31(f). 78 See Case Files §§ 4.3 and 5.2.3.

22
When considering the timing of transactions included in the Trademark Assignment Dataset, users must consider the time lag between the execution of the transaction and recordation in the USPTO. Figure 5 displays trends in transactions by year of recordation compared with year of execution. Clearly, trends by recordation year reflect the volume of transactions filed with USPTO; the execution date trend should better reflect transactions. Figure 5 suggests that there is an observable lag between recordation and execution for much of the time series. In particular, we observe the first peak in executed transactions occurring in 2000, rather than 2002, which is more consistent with a surge of transactions during the dot-com bubble.79 For all transactions in the dataset, the recordation date lags the execution date by an average of 303 days, with a median of 40 days.80 But, the mean (and median) recordation lag has varied over time. Table 2 shows the mean, median, and quartiles of the recordation lag for execution year sub-periods.81 To avoid potential biases from time variant recordation lags evident in Table 2, users should employ assignment time series dated by execution date wherever possible. However, users should also be aware of the truncation problem: Executed assignments that have yet to be recorded are increasingly missing for the most recent years. To aid in understanding this bias, Figure 6 shows the cumulative total of recorded and executed transactions and the cumulative share unrecorded (i.e., the share of executed transactions unrecorded up until that point in time). We find that through 2001, about 8 percent previously executed transactions had yet to be recorded. Since Figure 6 can only include executed transactions that are recorded, the unrecorded percent declines below zero by 2013.82 Disregarding the earliest years, it appears from Figure 6 that 5 to 10 percent of executed transactions, yet to be recorded, may be missing from the data for the most recent time periods.
An additional concern is that the recordation lag exhibits non-random variation across conveyance subcategories. Figure 7 shows the distribution of transactions by recordation lag for each conveyance subcategory using a box and whisker plot.83 Security interest agreements and releases were recorded almost entirely within one year of execution, consistent with creditor-assignees incentive to give public notice of their interest promptly (see Section 3.2). Trademark assignments also tend to be recorded quickly, though somewhat slower that security agreements. By contrast, the recording of mergers and name changes tends to be more delayed. Since the assignee in a merger or name change is a related—if not the same—party as the assignor, there may be less incentive to avoid recordation delay. However, to take certain action with regard to the conveyed trademark property, the assignee must establish itself as the owner of record with the USPTO (see Section 3.1). Thus, it is plausible that assignees in mergers and name changes may be delaying recordation until an application is at risk of abandonment or a registration is at risk of cancellation.
To explore this hypothesis, we graph in Figure 8 our analysis of the distribution of property-level transactions by the time of recordation from registration issuance for only those transactions where
79 We observed similar surge in trademark registrations. See Case Files § 5.21. 80 Mean and median for all rf_ids with an execution date between 1955 and 2013. 81 Figures in Table 2 may still suffer from truncation as previously executed transactions may yet to be recorded with USPTO. 82 At the end of the series, the number of recordations must—by definition—be equal to or greater than the number of executions. 83 In Figure 7, the length of the dark box indicates the interquartile range (IQR) and the white vertical line subdividing the box is the median. The dark horizontal lines or “whiskers” extend to the lower and upper adjacent values (i.e., designating values within 1.5 IQR of the nearer quartile). Data points outside these adjacent values are omitted.

23
recordation lags execution by more than one year.84 The results show distinct concentrations of assignment, merger, and name change property-level transactions recorded 6, 10, and 20 years from issuance when registrations are at risk of cancellation or expiration. No such concentrations are evident in Figure 8 for security interests or releases.85 Accordingly, researchers should note that the truncation problem is most acute for merger and name change conveyance subcategories and may be of less concern for assignments and security interest agreements.
4.3.3. CensoringandregistrationdeathUsers should also be careful to account for censoring due to non-recordation. In particular, the maintenance history of a trademark will be correlated with the probability that an assignment is recorded. One might expect the incidence of a transaction to be positively correlated with longevity, as both observations potentially indicate property value. In fact, this correlation has been pointed out and exploited in empirical research on patent value (Serrano, 2010). Concurrently, some of the correlation between observing recordation and maintenance may be due to censoring. Assignees may have less incentive to record the assignment of a trademark registration that is not ultimately maintained. Because these assignments go unrecorded, the incidence of transaction in the period prior to death will be censored and the observed transaction propensity for non-maintained marks will be biased downwards. In other words, the censoring can artificially overstate the correlation between assignment and maintenance. In order to help users of the Dataset, we explore this point further in Section 5.3.2.
5. DiscussionWe now discuss summary statistics for some of the main variables of interest in our dataset, highlighting trends and stylized facts that we regard as needing further in-depth study. Table 1 presents summary statistics by transaction (unique rf_id) for each conveyance subcategory. The dataset contains 786,931 recordations, affecting 4,197,645 total properties. Just over half of all recordations are single property transactions between a single assignee and a single assignor. The remainder is largely multiple property transactions, although the distribution of asset size, as measured by the number of properties per rf_id, is highly skewed and, as Figure 9 depicts, varies across conveyance subcategories. Security interest agreements and releases tend to be the largest, affecting 13 and 14 properties per rf_id, on average, respectively; while assignments tend to be smallest, affecting only 3 properties per rf_id, on average.
Accordingly, while assignments comprise the largest share at over half (53 percent) of rf_ids, they affect only one-third of all transacted properties in the dataset (see Table 1).86 Most assignments (64 percent) are single property transactions, suggesting that trademarks may often be transferred individually rather than as part of a large portfolio deal. By contrast, 54 percent of mergers are multiple-property transactions, and
84 To calculate the duration from registration issuance to recordation we pulled registration dates from Case Files for the serial numbers in the tm_cf_no. Thus, serial numbers with no registration date in Case Files are excluded from Figure 8. 85 In fact, security interest claims appear to frequently occur before sixth-year maintenance, something we explore more in Section 5. 86 We include partial interest assignments with entire interest assignments.

24
mergers include, on average, twice as many properties as do assignments. Still, as Table 1 shows, mergers are rare compared to the other conveyance types, comprising roughly 6 percent of rf_ids and affecting only 8 percent of all transacted properties in the dataset. Changes in name, address, or place of incorporation – not resulting from a merger – are the second most numerous type of transaction, comprising about 20 percent of rf_ids in the dataset.87 While such transactions do not denote an actual change in ownership, they may indicate certain aspects of firm behavior with respect to intangible assets and, thereby, warrant further study.
Security interest agreements encompass all transactions with conveyance text indicating a security interest, collateral, mortgage, and/or lien. Table 1 shows that such transactions make up about 11 percent of rf_ids but, because they tend include more properties, account for 27 percent of observations at the transaction-property level in the dataset. Nearly 80 percent of security agreements are multiple-property transactions, implying that trademark portfolios, rather than individual registrations, may typically serve as collateral for loans. While largely absent prior to the 1980s, security agreements have grown rapidly since, exhibiting average annual growth rates of roughly 16 percent in terms of both number of transactions and affected properties between 1980 and 2005.
A “release” terminates an existing agreement between the parties. Such transactions largely entail the release of a security interest and, because securitizations involve more properties on average, releases tend to also affect comparatively more properties per rf_id. Recorded releases begin to occur in nontrivial numbers in the late 1980s but are far less common than security agreements themselves. This suggests that parties might not record the re-conveyance of rights when loans end (or that loans remain outstanding). It may also reflect a lag between the arrival of a security agreement and the (necessarily later) release.
Parties can also file an amendment or correction to a prior recordation. For example, an assignee might record a correction if the prior recorded assignment listed the wrong registration number for the property transferred.88 Corrections are issued with a new rf_id and are recorded separately from the original. As Table 1 indicates, corrections account for roughly 3 percent of rf_ids in the dataset. We made no attempt to link corrections to the original recordation they correct or revise.89 Given that we expect that errors requiring subsequent correction occur randomly, any bias on subsequent analysis should be minimal.
The “other” conveyance category in Table 1 contains: i) assignments with less common conveyance types: license, letters of testamentary, letters of administration, or court appointment of trustee; and ii)
87 Name change recordations include observations with conveyance texts indicating a change in name, address, or state/country of incorporation. It excludes name changes resulting from merger. Any observation referencing a merger or equivalent in the conveyance text is included in the merger subcategory. 88 For example rf_id 3019/0361 corrects the assignment of U.S. Reg. No. 1493758, previously recorded in rf_id 2867/0726 listing U.S. Reg. No. 1493458 in error. 89 The conveyance text in tm_assignment for corrections may indicate the rf_id for which the observation is amending or correcting. Matching on execution date, tm_assignor, tm_assignee fields may also facilitate identification of the prior rf_id to be corrected. Matching on serial or registration number is problematic if the correction is being made to an erroneously recorded serial or registration number.
25
assignment for which we could not identify a single conveyance type through group pattern matching.90 Table 1 shows summary statistics for the relatively few rf_ids for which no conveyance text was recorded in the dataset.
Throughout the remainder of this paper, we focus on the more economically relevant transactions affecting trademarks, specifically those associated with ownership changes (via assignment or merger) and security interest claims (agreements and releases). Name changes likely reflect the reshuffling of trademarks among related parties and, while possibly capturing certain firm behavior with respect to intangible assets, have seemingly less significance compared to transfers and collateralization. The “other” category does contain certain conveyance types of consequence, particularly licenses and matters related to court proceedings, but such transactions are relatively scarce in the data. Accordingly, any descriptive analysis will not be particularly informative.
5.1. TrendsinexecutedtransactionsFigure 10 shows the trend in transactions by conveyance types for execution dates in years 1955 through 2013. Figure 11 presents trends in property-level transactions by conveyance for the same time period. Thus, Figure 10 displays the incidence of transactions over time and Figure 11 presents the aggregate volume of trademark properties involved in those transactions. Figures 12 and 13 depict each conveyance type’s share of executed transactions and property-level transactions, respectively, year on year. From these graphs, six overall trends, conditional on recording, stand out:
1. The number of trademark properties used as collateral to secure debt has surged dramatically over the past 30 years.
Creditors claimed a security interest in roughly 5,700 trademark properties in 1985. Within a decade, the annual number of properties used to secure debt in recorded transactions tripled and grew exponentially thereafter. In 2007, a security interest was claimed on close to 75,600 trademark properties, increasing by a factor of 13 in just over two decades. Figure 10 shows the volume of recorded property-level security agreements collapsing in 2008, likely reflecting the overall contraction during the recent financial crisis. New recorded securitizations quickly recovered, however, involving roughly 79,200 trademark properties in 2012.
2. Traditional assignments have grown substantially, but this trend appears to be reversing.
From 1980 to 2000, the number of recorded properties assigned between parties each year climbed from about 11,100 to 53,700, an average growth rate of 7 percent per year. Thereafter, however, Figure 11 shows the volume of assigned properties trending down, falling to roughly 42,500 in 2010. The recorded number of traded properties fell even as the number of assignments executed (Figure 10) continued to grow, though at a slower pace. Overall, trends in recordation show recently executed assignments affecting fewer properties and suggest a reversal in the growth observed in the prior decades.
90 We were unable to designate a distinct conveyance type through group pattern matching for 10,250 (1.3 percent) observations in tm_assignment.

26
3. Mergers involving the transfer of trademark assets comprise a sizeable proportion of total mergers and acquisitions activity in the United States.
While small in number compared to other conveyance types recorded in the data, mergers involving trademarks appear to account for a sizeable share of overall merger and acquisition (M&A) activity. Figure 10 shows recorded mergers involving trademark assets increasing in the late 1990s and exceeding 2,600 by 2000. To put these numbers into perspective, in Figure 14, we compare recorded mergers involving trademarks with overall M&A activity in the U.S. for select years.91 Figure 14 suggests that recorded mergers involving trademarks represent roughly 19 to 28 percent of M&A activity during the 1997 to 2003 period. We limit Figure 14 to these select years to avoid truncation problems (see Section 4.4). Still, that recorded mergers involving trademarks represent at or over one-fifth of M&A activity in these years is noteworthy and may suggest that trademarks are important assets in mergers.
4. Releases track security interest agreements with some delay, but further study into the duration of security agreements is needed.
Releases are the fastest growing conveyance subcategory in terms of recordations and property-level transactions because they were effectively nonexistent in the data prior to 1980. We expect releases to approximate the number of security agreements executed with some delay. Indeed, Figure 10 and Figure 11 show releases largely mirroring security agreements in terms of executions and property-level transactions, respectively, though lagged. The duration of security interest agreements warrants further investigation as contemporaneous movements in the trends suggest many agreements are released within a year of their creation.
5. More trademark properties within the last decade have been affected by security interest agreements and releases each year than by assignments, mergers, and name changes.
Figure 12 and Figure 13 depict the relative decline in assignments, mergers, and name changes as a proportion of executed transactions and property-level transactions, respectively. While they comprised roughly 90 percent of property-level transactions in the early 1980s, together these three conveyance types account for 63 percent in 2000 and only 44 percent in 2007. By contrast, security agreements and releases rise from 5 percent of property-level transactions in 1980 to one-third in 2000 and more than half by 2007. These trends may be a consequence of changes in the relative demand for these transactions in the marketplace, or to changes in recording behavior over time.
6. Even as the overall stock of trademark properties has grown, consistently 5 to 8 percent of live properties are involved in some recorded transaction (excluding corrections) each year – 3 percent assigned per year, though trending down, and security interest claimed on 2 percent per year and trending up.
91 Executed mergers affecting trademark properties as a proportion of all mergers and acquisitions activity from Census, The 2006 Statistical Abstract, Table 751 Mergers and Acquisitions, from Thomson Financial, available at http://www.census.gov/compendia/statab/2006/tables/06s0751.xls. Figure 14 is limited to years in which data on merger and acquisition activity was available.

27
We expect the number of properties affected by any type of transaction to increase over time, at least partially, because the overall stock of trademark properties being held in the global economy has grown.92 To examine how the recorded number of properties transacted each year has increased relative to the available stock, Figure 15 shows transacted properties per year as a proportion of 100 live properties (pending applications and live registrations) for each conveyance type.93 It depicts property-level transactions and distinct transacted properties as a proportion of live properties by execution year. Distinct transacted properties are unique serial numbers only, so that serial numbers with multiple transactions executed within that year and conveyance type are counted only once. Each year since 1985, 5 to 8 percent of the stock of live trademarks has been involved in some recorded transaction (excluding corrections). This proportion has been fairly stable over time, indicating that the number properties involved in a recorded transaction has grown largely at the same pace as the overall stock. The mix of recorded transactions in which properties are involved, however, has changed. Roughly 3 percent of live properties were recorded as being assigned each year prior to 2002, but that proportion has trended down over the past decade. By contrast, an increasing share of trademarks were subject to a recorded security interest– the proportion of live properties affected by a security agreement each year reached 2 percent by 1996 and has ranged from 2 to 3 percent thereafter. Recorded mergers typically involve less than 1 percent of live properties per year and name changes 1 to 2 percent each year.
5.2. TrendsintransactingpartiesAlthough the volume of types of transactions and number of properties involved is a compelling line of inquiry, we are also interested in understanding the participation and behavior of parties engaged in the developing marketplace for trademarks and brands. Accordingly, in this Section, we report our results from employing the Trademark Assignment Dataset to explore the attributes and trends in the conveying and receiving parties for each different conveyance type (excluding corrections).
5.2.1. NumberoftransactingpartiesAs Table 1 indicates, the vast majority of recorded transactions (95 percent) are between only two entities or “one-to-one” transactions. However, there is variation in the number of transacting parties over time and across conveyance types. Figure 16 shows the breakdown of property-level transactions by single party and multiple party transactions for each recorded conveyance type. Recorded assignments and name changes are predominantly one-to-one transactions regardless of execution year. Security agreements recorded between multiple debtor-assignors and a single creditor-assignee are increasingly commonly, accounting for roughly 25 to 30 percent of properties with a security interest claimed per year since 2006. Generally, assignors are related parties that collectively or separately have rights to the trademark asset(s)
92 The stock of live properties has quadrupled since 1982 as dramatic growth in new registrations has more than offset the outflow of cancelled for expired registrations. See Case Files § 5.2.1 for details on filing, registration, and renewal trends. 93 The stock of live properties is derived from the Case Files dataset and includes live registrations as well as pending applications because parties may convey interest in an application prior to a registration being issued. Figure 15 only includes execution years 1982 through 2012 because abandonments are only observable in Case File dataset for applications filed in and after 1982. See Case Files § 5.1.

28
for which the creditor-assignee is claiming a security interest. For example, the transaction with the most assignors in the dataset is a security interest agreement affecting 42 trademark properties between 506 assignors and a single creditor-assignee (“DEUTSCHE BANK NATIONAL TRUST COMPANY”).94 The assignors appear to be subsidiaries or branches of Hovnanian Enterprises, Inc. (e.g. “K. HOVNANIAN AT SKYE ISLE, LLC”, “K. HOVNANIAN AT TROVATA, INC.”, etc.), a U.S. homebuilding company95, that have some right to all or a subset of the listed trademark properties (e.g. “KHOV”, “HOMES FOR A NEW GENERATION”).96 When the security interest agreement concludes, the creditor would ordinarily release its security interest in the trademark assets back to all assignors. Indeed, recorded releases from a single assignor to multiple assignees comprise a growing share of released properties—25 to 30 percent per year since 2007.
Figure 16 indicates that the few recorded transactions between multiple assignees and multiple assignors are predominantly mergers executed prior to 1993. However, this trend appears to stem largely from the identical entity or entities being listed as both an assignor and assignee in the same transaction. We find that roughly 4 percent of assignee name observations in the data match exactly to the assignor name for the same rf_id.97 These records consist mainly of mergers and name changes, but sometimes assignments. We observe that the same party was listed on both sides of 20 to 30 percent of recorded mergers in each execution year prior to 1993. Thereafter, such dual recordings diminish, possibly due to a change in the administrative data process or evolving recordation practices.
5.2.2. GeographicoriginoftransactingpartiesUsing the nationality data of assignors and assignees, we identified each recordation as a domestic, foreign, or cross-national transaction.98 Where the nationality field was unpopulated, we used the address state or country field to determine nationality.99 Domestic transactions, involving only or majority U.S. assignee(s) and assignor(s), make up 70 percent of property-level transactions in the Dataset.100 Foreign transactions, with only or majority non-U.S. parties on both sides of the transaction, comprise roughly 6 percent.101 Cross-national transactions account for 5 percent of property-level transactions in the dataset—
94 Reel/frame 3792/0537. 95 http://www.khov.com/Home/IR/CorporateSummary/CorporateSummary.htm. 96 “KHOV” U.S. Reg. No. 2710008; “HOMES FOR A NEW GENERATION” U.S. Reg. No. 1878892. 97 We matched on the exact text strings of assign name (ee_name) and assignor name (or_name) for the first 244 characters as this is the character string limit for STATA version 12. Only 26 ee_name and 31 or_name observations exceed 244 characters. 98 Per the PTO-1594 form instructions, the nationality field should reflect the U.S. state or foreign country of incorporation for corporations; the U.S. state or foreign country under which an association, partnership, or joint venture is organized; and citizenship for individuals. 99 We base geography on nationality rather than address as the nationality field records state or country of incorporation or organization; whereas it is unclear exactly what the address fields capture. See “Guidelines for Completing Trademark Cover Sheets (PTO-1594)" in Appendix I. 100 A transaction was designated as domestic if assignor(s) reporting U.S. nationality outnumber any assignor(s) reporting non-U.S. nationality and assignee(s) reporting U.S. nationality outnumber any assignee(s) reporting non-U.S. nationality. Of these, 99.86% involve only U.S. assignor(s) and only U.S. assignee(s); 0.05% only U.S. assignor(s) and majority U.S. assignees; 0.08% majority U.S. assignors and only U.S. assignee(s); and 0.00% majority U.S. assignors and majority U.S. assignees. 101 A transaction was designated as foreign if assignor(s) reporting non-U.S. nationality outnumber any assignor(s) reporting U.S. nationality and assignee(s) reporting non-U.S. nationality outnumber any assignee(s) reporting U.S. nationality. Of these, 99.96% involve only non-U.S. assignor(s) and only non-U.S. assignee(s); 0.01% only non-U.S. assignor(s) and majority non-U.S.

29
3 percent outgoing (U.S. assignor to foreign assignee)102 and 2 percent incoming (foreign assignor to U.S assignee).103 We were unable to categorize the geography of the remaining property-level transactions due to insufficient data coverage.
Figure 17 depicts the domestic, foreign, and cross-national share of property-level transactions for each conveyance type by execution year. Since data coverage is limited for many of the assignee and/or assignor fields in the early years of our period (see Figures 2 and 3), long-term trend analysis is unreliable. Nevertheless, Figure 17 indicates some interesting features transactions in recent years. Across conveyance types, the majority of recorded property-level transactions are domestic exchanges, but purely foreign transactions account for a sizeable share of properties assigned (10 to 14 percent) or affected by mergers (8 to 12 percent) each year since 2006. The factors that may be motivating foreign parties to acquire trademarks used in U.S. markets, whether via assignment or merger, are interesting and warrant further investigation. Recorded name changes among foreign entities appear relatively common– since 2006, 20 to 36 percent of properties involved in an owner name change concerned only foreign parties. While name changes may merely indicate reshuffling of assets among related parties, the factors driving this behavior may be noteworthy, particularly if firms are motivated by differences in the tax or regulatory environments across countries.
Recordations of cross-national changes in trademark ownership are infrequent but not absent. Among recordations specifying more recent execution dates, roughly 5 percent of properties assigned were “exported” from domestic assignors to foreign assignees with “imported” properties from foreign assignors to domestic assignees comprising only about 3 percent. US-to-foreign (“outgoing”) transacted properties also outnumber foreign-to-US (“incoming”) ones among recorded securitization agreements, but the implication of that result is somewhat different. An outgoing security interest agreement denotes foreign-source financing of domestic debt, since a security interest is granted from a domestic debtor-assignor to a foreign creditor-assignee. Accordingly, an incoming security agreement implies a domestic creditor-assignee securing interest on a property owned by a foreign debtor-assignor. Figure 17 suggests that foreign-source financing of trademark-secured debt is not uncommon in our data, particularly in more recent execution years. Foreign creditor-assignees recorded a security interest on roughly 11 to 12 percent of properties involved in such transactions each year since 2010. Likewise, incoming releases, where a foreign creditor releases the security interest back to the domestic assignee, comprise about 12 to 13 percent of released properties per year since 2011.
assignees; 0.03% majority non-U.S. assignors and only non-U.S. assignee(s); and 0.00% majority non-U.S. assignors and majority non-U.S. assignees. 102 A transaction was designated as outgoing if assignor(s) reporting U.S. nationality outnumber any assignor(s) reporting non-U.S. nationality and assignee(s) reporting non-U.S. nationality outnumber any assignee(s) reporting U.S. nationality. Of these, 99.57% involve only U.S. assignor(s) and only non-U.S. assignee(s); 0.28% only U.S. assignor(s) and majority non-U.S. assignees; 0.14% majority U.S. assignors and only non-U.S. assignee(s); and 0.00% majority U.S. assignors and majority non-U.S. assignees. 103 A transaction was designated as incoming if assignor(s) reporting non-U.S. nationality outnumber any assignor(s) reporting U.S. nationality and assignee(s) reporting U.S. nationality outnumber any assignee(s) reporting non-U.S. nationality. Of these, 99.22% involve only non-U.S. assignor(s) and only U.S. assignee(s); 0.19% only non-U.S. assignor(s) and majority U.S. assignees; 0.58% majority non-U.S. assignors and only U.S. assignee(s); and 0.01% majority non-U.S. assignors and majority U.S. assignees.
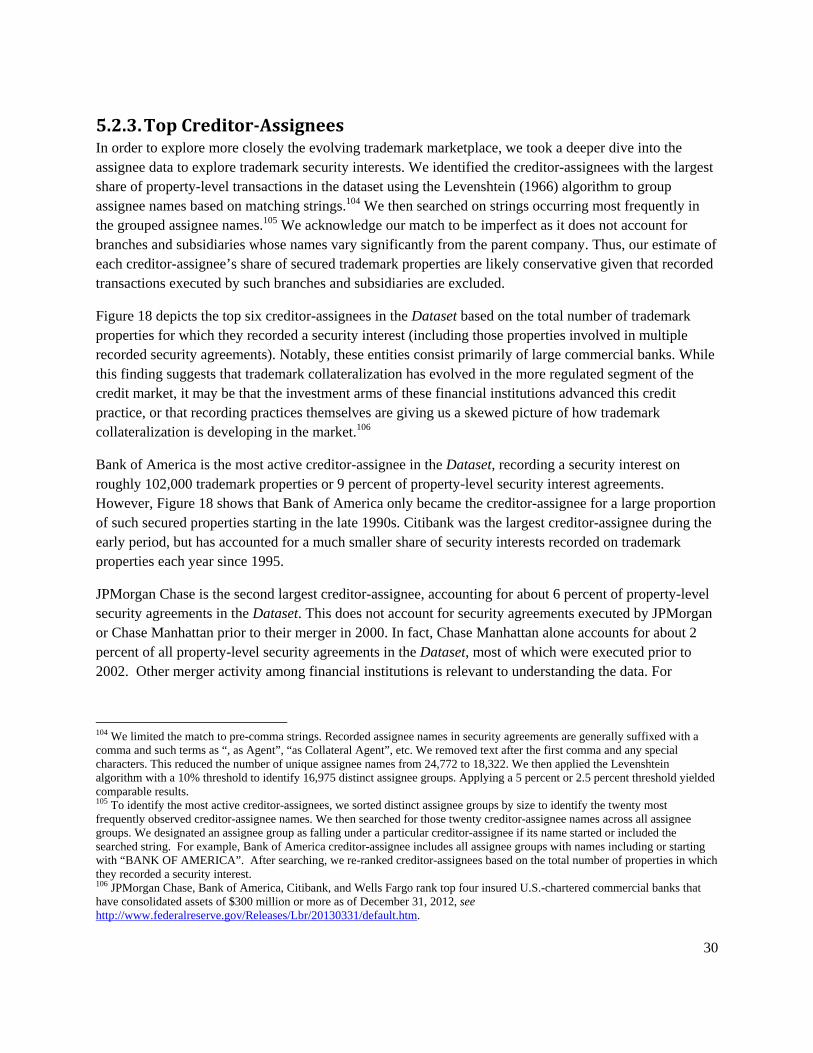
30
5.2.3. TopCreditor‐AssigneesIn order to explore more closely the evolving trademark marketplace, we took a deeper dive into the assignee data to explore trademark security interests. We identified the creditor-assignees with the largest share of property-level transactions in the dataset using the Levenshtein (1966) algorithm to group assignee names based on matching strings.104 We then searched on strings occurring most frequently in the grouped assignee names.105 We acknowledge our match to be imperfect as it does not account for branches and subsidiaries whose names vary significantly from the parent company. Thus, our estimate of each creditor-assignee’s share of secured trademark properties are likely conservative given that recorded transactions executed by such branches and subsidiaries are excluded.
Figure 18 depicts the top six creditor-assignees in the Dataset based on the total number of trademark properties for which they recorded a security interest (including those properties involved in multiple recorded security agreements). Notably, these entities consist primarily of large commercial banks. While this finding suggests that trademark collateralization has evolved in the more regulated segment of the credit market, it may be that the investment arms of these financial institutions advanced this credit practice, or that recording practices themselves are giving us a skewed picture of how trademark collateralization is developing in the market.106
Bank of America is the most active creditor-assignee in the Dataset, recording a security interest on roughly 102,000 trademark properties or 9 percent of property-level security interest agreements. However, Figure 18 shows that Bank of America only became the creditor-assignee for a large proportion of such secured properties starting in the late 1990s. Citibank was the largest creditor-assignee during the early period, but has accounted for a much smaller share of security interests recorded on trademark properties each year since 1995.
JPMorgan Chase is the second largest creditor-assignee, accounting for about 6 percent of property-level security agreements in the Dataset. This does not account for security agreements executed by JPMorgan or Chase Manhattan prior to their merger in 2000. In fact, Chase Manhattan alone accounts for about 2 percent of all property-level security agreements in the Dataset, most of which were executed prior to 2002. Other merger activity among financial institutions is relevant to understanding the data. For
104 We limited the match to pre-comma strings. Recorded assignee names in security agreements are generally suffixed with a comma and such terms as “, as Agent”, “as Collateral Agent”, etc. We removed text after the first comma and any special characters. This reduced the number of unique assignee names from 24,772 to 18,322. We then applied the Levenshtein algorithm with a 10% threshold to identify 16,975 distinct assignee groups. Applying a 5 percent or 2.5 percent threshold yielded comparable results. 105 To identify the most active creditor-assignees, we sorted distinct assignee groups by size to identify the twenty most frequently observed creditor-assignee names. We then searched for those twenty creditor-assignee names across all assignee groups. We designated an assignee group as falling under a particular creditor-assignee if its name started or included the searched string. For example, Bank of America creditor-assignee includes all assignee groups with names including or starting with “BANK OF AMERICA”. After searching, we re-ranked creditor-assignees based on the total number of properties in which they recorded a security interest. 106 JPMorgan Chase, Bank of America, Citibank, and Wells Fargo rank top four insured U.S.-chartered commercial banks that have consolidated assets of $300 million or more as of December 31, 2012, see http://www.federalreserve.gov/Releases/Lbr/20130331/default.htm.

31
example, Wachovia accounted for 3-6 percent of annual security claims recorded on trademark properties from 2002 until it was acquired by Wells Fargo in 2008.
Credit Suisse stands out as the sole non-commercial bank and sole foreign entity among the most active firms. Compared to the volume of recordings among the other top six credit-assignees in 2007, Credit Suisse’s security interest claims captured an unusually large share of the annual total. As evident in Figure 18, while the share of claims recorded by other entities contracted or held constant from 2006 to 2007, Credit Suisse’s share tripled from 3 to 9 percent. This result may indicate that entry by non-commercial and/or foreign banks played a part in the spike of security interest claims recorded on trademark properties in 2007 (see Figure 11).
Figure 18 suggests that a small number of creditor-assignees may have accounted for a sizeable proportion of all trademark properties involved in securitization since 2000, though the composition and relative share held by those entities appears to have varied. To consider how concentrated the market for trademark collateralized debt may be, we graph in Figure 19 the concentration ratio for the five largest creditor-assignees (based on the number of properties against which they record security interest) by execution year in our Dataset. During the initial growth in recorded security interest between 1980 and 1990, Figure 19 shows the top five creditor-assignees comprising 20 to 40 percent of property-level security agreements. While there is considerable variation in the early years, the overall U-shaped trend in the ratio indicates high concentration among a few firms when trademark security agreements were rarely recorded, followed by new entry among recorders and less concentration as the recordation of security interest on trademarks grew through the mid-1990s. Thereafter, the volume of trademarks properties involved in a recorded security agreement surged (see Figure 11), and it appears that the market became increasingly concentrated, albeit there was also a contemporaneous general consolidation among firms in the financial market. Still, Figure 19 shows that, since 2005, the top five credit-assignees have accounted for over one-third of recordations in the market for trademark-secured loans.
5.3. IncidenceoftransactionperuniquepropertyHaving examined the volume of properties involved in recorded transactions over time, we chose to aggregate all properties involved in a transaction in a given year. In this section, we focus instead on distinct trademark properties (unique serial numbers) and consider the probability of an individual property having been involved in a recorded transaction during its entire life. Accordingly, we combined the Trademark Assignment Dataset with data on trademark registrations drawn from the USPTO Trademark Case Files Dataset. We limited our Case Files sample to registrations, omitting applications that were abandoned or remain pending. While the Assignment Dataset contains transactions recorded for such applications, for the sake of simplicity we focused solely on the 3.4 million trademark registrations

32
issued between 1978 and 2013.107 In so doing, we understand that we are likely selecting on more valuable properties.
Table 3 shows the proportion of registrations with any recorded transaction, an ownership change (assignment or merger), or security interest claim. For those registrations with transactions recorded at least once, Table 3 also presents summary statistics on the frequency of such transactions per registration and per year of trademark registration. Of the 3.4 million registrations issued by the USPTO between 1978 and 2013, roughly 31 percent were involved in a recorded transaction at some point during their life. Most registrations, once thus transacted, were involved in multiple events—2.8 times, on average. For properties, the mean number of recorded transactions per year of registration was 0.48, with a median of 0.21. In other words, properties were involved in a recorded transaction, on average, every two years of registration, and every five years at the median.
As is common, the distribution of repeated events has a long tail. A small number of registered trademarks were involved in recorded transactions frequently during their lives. For instance, 40 transactions were recorded for the 1984 registration of the mark “AUGSBURGER” (on average, 1.2 transactions per year of registration) for use on beer, including an assignment from “Augsburger brewery company” to “Stroh Brewery Company” in 1994, and a subsequent assignment from “Stroh Brewery Company” to “Pabst Brewing Company” in 1999.108 It is notable that the registrations with the highest number of recorded transactions per year of registration in Table 3 are young registrations issued in late 2013 with very active transaction records, each involved in no more than 5 recordations prior to or within the first year of registration.
Roughly 21 percent of the registrations were recorded as being transferred between parties through an assignment or merger. Multiple ownership changes do not appear to be common. Table 3 indicates that individual registrations, if recorded as being traded between parties, were traded 1.6 times, on average. For these transacted properties, an ownership change occurred on average 0.25 times per year of registration (or once every four years). At the median, these properties were involved in a recordation 0.15 times per year of registration (or once every seven years). The distribution of ownership changes per registration is also highly skewed with a small number of registered trademarks being involved in such a recordation frequently, as many as 35 times during their life.
Multiple security interest recordings on a single registered trademark are more common. About 12 percent of registrations were recorded as collateral to secure debt at some point during their lives. However, a registration, if subject to a recorded security interest agreement, was subject to 2.2 such agreements, on average. For these properties, such a securitization occurred on average 0.43 times per year of registration (or once every 28 months), and at the median, 0.19 times per year of registration (or once every five years).
107 We also omit: 1) 9,249 serial numbers that were back-filed or have invalid serial numbers (see Case Files Table 2); 2) 34 serial numbers with a death date prior to registration date, indicating an application issued a registration number but abandoned during a TTAB proceeding. 108 U.S. Reg. No. 1268132.

33
5.3.1. TransactionrateandtimingbyregistrationcohortTable 3 provides a summary view of the incidence and frequency of recorded transactions for trademarks registered from 1978-2013. Clearly, we expect the frequency of transaction to vary with registration age: Older cohorts will have been at hazard of being involved in a transaction longer than younger cohorts. Figures 20 and 21 present the proportion of registered trademarks involved in a recorded transaction, and the time period of the first transaction by registration year cohort. Since trademarks were registered under two different renewal “regimes,” the calculations represented in Figure 20 are based only on registrations issued prior to November 16, 1989 (initially subject to twenty-year renewal terms and converted to ten-year terms upon the first renewal event after that date).109 Figure 21 includes registrations issued only on or after November 16, 1989 (subject to ten-year renewal terms throughout). In each figure, the proportion of registrations involved in a recorded transaction is broken out by the timing of the first transaction: i) prior to issuance; ii) from issuance date through sixth year maintenance date; iii) following sixth year maintenance through first renewal date; and iv) following first renewal date through second renewal date. These four time periods reflect critical events in the life of a registered mark, i.e. when applications are pending prior to issuance; at sixth year maintenance when registrations are at hazard of cancellation for lack of use; and at each incremental renewal event when registrations are at hazard of cancellation for lack of use or expiration for lack of renewal.110 Figures 20 and 21 present the data in this manner in order to provide for consistent comparison of the proportion of registrations transacted as of each of these events across registration cohorts. Maintenance and renewal are considered distinct requirements from a legal perspective. But failure to comply with either requirement results in “death” of the registration. For simplicity sake, we discuss registrations as being maintained, rather than renewed (or maintained and renewed), because maintenance is required in the sixth year and at each incremental renewal event, whereas the renewal requirement only applies at the latter.
Looking first at older registrations, Figure 20 indicates largely consistent rates across cohorts: roughly 40 percent are involved in a recorded transaction at least once, and 30 percent experienced a recorded owner change at least once. The timing of the first recorded ownership change relative to maintenance events is also fairly stable, particularly after 1979. Roughly 3 to 5 percent of registrations are first recorded as being transferred prior to issuance, 15 to 18 percent between issuance and first maintenance (years 0-6), and 11 to 14 percent between first and second maintenance (years 7-20). The incidence and timing of recorded security interest agreements are less consistent across cohorts. Figure 20 shows that a higher proportion of registrations were recorded as securing debt (nearly 15 percent) among the youngest cohorts. This increased rate overall is due to a higher incidence of security agreements being recorded between issuance and first maintenance (years 0-6). The proportion of registrations with a recorded security interest prior to first maintenance more than doubles (from 2.5 to 6.6 percent) between the 1980 and 1988 cohorts.
We now turn to an analysis of more recently issued registrations, represented in Figure 21. While transaction rates are clearly censored for the youngest cohorts, we can observe some similar patterns
109 Figures omit registrations issued in 1989 on or after November 16. See Case Files § 4.2 for additional background on maintenance and renewal requirements. 110 See Case Files § 4.2.

34
compared to Figure 20. For the pre-1994 registration cohorts (i.e., those subject to three maintenance events), recorded transaction rates are similar to the older cohorts shown in Figure 20 – about 40 percent were involved in a transaction and 30 percent were transferred between parties. Roughly 15 percent of registrations in the pre-1994 cohorts were involved in a recorded securitization, roughly mirroring the rate for the 1989 cohort demonstrated in Figure 20.
Figure 21 shows first recorded transactions occurring earlier in the registration live cycle, but notably only among registrations issued through the mid-2000s. The proportion of registrations first involved in a recorded trade prior to issuance increases from 3.2 percent among the members of the 1991 cohort to 7.2 percent among the trademarks in the 2001 cohort. The proportion showing an initial recordation of a security interest likewise climbs from 1.0 percent for the 1991 cohort to 3.8 percent for the 2001 counterpart. Pre-issuance rates appear to subside for younger cohorts, particularly those issued after 2007; however, this may be due to censoring from delayed recordation.
When we consider trademarks registered during the middle period (mid-1990s to mid-2000s), multiple factors likely contributed to the shortening of time elapsed between registration and first recorded trades and security interest claims. First, pendency in USPTO examination was trending up during this period, thus tending to extend the time during which applications were at hazard of being involved in a recorded transaction prior to issuance.111 Indeed, the proportion of 1994 to 2005 registrations first showing a recorded trade during their second and third year of pendency was roughly double that of cohorts issued in prior (earliest) and subsequent (latest) years in our analysis period. A second contributing factor may be that the recording of transacting activity was growing overall (in absolute terms, per Figure 11, and relative to the stock of live properties, per Figure 15), thus raising the incidence of recorded transactions for all registrations regardless of age. Both Figures 20 and 21 indicate some support for this notion. For trademarks among the 1993 to 1997 registration cohorts , Figure 21 shows a higher incidence of first recorded ownership change (18 percent) between issuance and first maintenance in years 1999 to 2003, corresponding to the spike in property-level assignments (see Figure 11). Likewise, marks in the 1996 to 1999 registration cohorts have a higher rate of first recorded security interest (9 percent) between issuance and first maintenance in years 2002 to 2005, when the recordation of security interests at the property-level exhibited exponential growth (see Figure 11).
5.3.2. RelationshipbetweenrecordationandmaintenanceAre the transaction recordings available in this Dataset an indicator of the private value of a trademark? As we discussed briefly in Section 4.3.2, if we use recent literature as a guide (Serrano, 2010), it is reasonable to conjecture that recorded transactions, particularly those involving a change of ownership, are value correlates. Similarly, prior studies on patent renewal (Schankerman and Pakes, 1986) support the notion that registration renewals may also offer information on the trademark value. However, because assignments may go unrecorded in the period prior to the “death” of the registration, any such
111 Exit pendency trended up for applications filed based on use and intended use from 1992 until the early 2000s and trended down thereafter. For the 2002 registration cohort, median time to issuance was 1.5 years for applications filed based on use and 2.3 years for applications filed based on intended use. See Case Files § 5.2.1.4.

35
observed correlation may be artificial. In this section, we briefly consider the relationship between trademark transaction recordation and maintenance.
We explore some basic dynamics in this relationship in Figure 22, showing the proportion of registrations with a recorded ownership change occurring at different phases in the registration life cycle by three maintenance cohorts: i) maintained in the sixth year only (M6); ii) maintained at second maintenance event but not third (M10 for 1989-92 cohort and M20 for 1978-89 cohort); and iii) maintained at third maintenance event (M20 for 1989-92 cohort and M30 for 1978-89 cohort). Thus, Figure 22 depicts the incidence of a recorded trade conditional on survival, i.e. number of events the registration was maintained. We limited the analysis to “older” surviving trademarks (those registration cohorts for which we can observe three maintenance events). We restrict the data in this way because we want to directly compare the incidence of a recorded ownership change for trademarks surviving one to three events. The left panel shows the incidence of recorded ownership changes in each specified period for 1989-92 registrations (issued under the ten-year renewal terms). The right panel presents the same incidences across maintenance cohorts for 1978-89 registrations (issued under twenty-year renewal terms that transitioned to ten-year terms following first renewal at year 20).
Note the absence of a clear positive relationship between the proportion of registrations with a recorded ownership change and the number of times maintained in Figure 22. In fact, there appears to be an inverse relationship between maintenance and ownership change between issuance and first maintenance (years 0-6) for both 1989-92 and 1978-89 registrations (see “dashed” confidence intervals falling in both panels, from left to right). While very preliminary, this result is noteworthy because it runs counter to findings in the patent literature which generally find a positive correlation between the frequency of assignment and the number of maintenance fee payments (Serrano, 2010).
Censoring may be introducing bias in our estimates, particularly in the more recent years. For instance, while we observe a positive relationship between recorded ownership change and maintenance in the 1978-89 cohort (right panel) during years 7-20 and 21-30, and in the 1989-92 cohort (left panel) during years 11-20, we cannot, without other evidence, know whether these results are subject to censoring. In order to explore the possible impact of such censoring, we focused more closely on the 0-6 year period and the 7-10 year period for 1989-92 registrations, presenting our calculations in Figure 23. Between the two time periods, we compare the proportion with a recorded ownership change among those trademarks that will die (which we observe) at the end of years 7-10 (M6) and those that will survive (also observed) to subsequent period(s) (M10 survives through year 20 and M20 survives through year 30 and possibly thereafter).112 Looking first at registrations that are maintained more than once (the survivors), those that are maintained three times (M20) tend to be involved in a recorded trade in years 0-6 less often than those that will be maintained twice (M10). This relationship does not hold in the 7-10 year period because confidence intervals overlap. During these periods, we know that neither category is subject to censoring because both are maintained at the ten year mark. Thus, we can expect no differential effect on the likelihood of recording based on immediate survival.
112 This exercise is essentially a very simple differences-in-differences approach.

36
In contrast, those maintained only once (M6) show a marked difference in the 0-6 year period relative to the 7-10 year period. In years 0-6, the recorded trade rate for M6 registrations is comparable to that of M10 registrations. The M6 proportion falls dramatically in the 7-10 year period. Some of this drop may be real; but, some of the drop may be artificial. In particular, if we assume that the owners have information about the private value and the likelihood of ultimately maintaining the property, then during years 7-10 there should be less incentive to record transactions because the owner knows the trademark will not be maintained, and therefore the cost of recording will be “wasted effort.” The M6 category is the only category for which, under these assumptions, such an incentive would change between the years 0-6 and years 7-10. Accordingly, we are presented with an opportunity to investigate the potential impact of censoring.
In Figure 23, we calculate the ratio of the mean proportion of M6 registrations with an ownership in years 0-6 year to that of M10 registrations.113 We then apply that ratio to the mean proportion of M10 registrations with ownership change in years 7-10 to calculate the “anticipated” proportion of M6 registrations in years 7-10.114 Thus, this anticipated figure reflects what the M6 rate of transaction (recorded) would have been had the ratio of the first period held into the second period. The confidence interval for the observed M6 rate of transaction (recorded) falls below the anticipated counterpart in Figure 23. If our assumptions are correct, the gap between these two intervals (or part of it) may be attributed to censoring.
We should note at this point that this exercise is intended as an example, not as a definitive result. It demonstrates the potential impact of censoring. As such, it should serve as a caution for any researcher studying the relationship between maintenance, assignment, and value using the Dataset.
6. ConclusionRelease of the USPTO Trademark Assignment Dataset opens multiple avenues for original research, particularly with respect to trademark collateralization and the market for brands. Interestingly, our trend analysis of the Dataset suggests that trademark holders are increasingly using these assets to secure debt. Yet, in addition to investigating how accurately these USPTO recordations represent the population of trademark securitizations happening in the economy, further examination of the credit market is desirable in order to determine how pervasive loans using trademarks and other IP as collateral are relative to other secured loans. If trademark collateralization is, in fact, escalating, inquiry into the drivers and welfare effects of this credit practice may have substantial implications. Such credit practices conceivably benefit trademark holders by providing a novel means of raising capital, potentially as an alternative to asset liquidation.
113 In years 0-6, the mean proportion of registrations with a recorded ownership change is 0.224590 for M6 and 0.229292, yielding a ratio of 0.979493. 114 Applying the 0.979493 ratio to the mean proportion of M10 registrations with an ownership change in years 7-10 yields an anticipated M6 rate of transaction of 0.181 for years 7-10 (i.e., M10 mean proportion 0.184874 x 0.979493 ratio = 0.181083). We calculated the anticipated 95 percent confidence interval for M6 in years 7-10 by calculating the ratio of anticipated mean to observe mean and applying it to the observed confidence interval (e.g., ratio of anticipated to observed mean 0.181083/0.155962 x observed lower limit 0.151777 = anticipated lower limit 0.176224).

37
If the recordations reflected in these data are an accurate portrayal of market trends, then more trademark properties were used to raise capital during the last decade than the volume being traded. That may suggest that owners are able to raise funds by borrowing on rather than selling intangible assets, and are increasingly involved in those kinds of transactions. That being said, the factors contributing to the growth in trademark collateralization greatly affect the welfare implications. If such credit practices have resulted from greater market efficiency and improved intangible valuation practices, loans secured by trademarks could benefit both borrowers and lenders. On the other hand, if trademark collateralization stems from an overly-permissive regulatory environment that inadequately accounts for possible risks in these assets, this trend may have negative welfare effects. The potential consequences of entry by foreign creditors and the increasingly concentrated nature of this market, both of which are suggested by our data analysis, may be worth considering. Lastly, the impact of foreclosure on collateralized trademarks and the possible lessening of the goodwill they represent are, to our knowledge, largely unexamined issues.
We expect release of the USPTO Trademark Assignment Dataset to contribute instrumentally to our collective understanding of the market for brands, and encourage future research toward that end. Our analysis suggests that a large proportion of registered trademarks may be traded during their life, but more empirical work is needed to uncover the real probabilities and determinants of that trade, as well as its implications. The absence of our finding a positive relationship between assignment incidence and maintenance may mean that the market for trademark brands differs substantially from that of patents. In-depth study of the relationship between trademark maintenance, assignment, and value is particularly warranted, although researchers using these data should be cautious of selection, and the potential for systematic censoring due to non-recordation of non-renewed marks. The acceleration of first recorded trades, such that we observe a sizeable share occurring during pendency, is also noteworthy – particularly when such transfers involve applications filed on intended use. Since trademark rights depend on use in commerce, the validity and signal to the market of transactions involving trademarks not yet actually registered is an interesting phenomenon.
Overall, a dynamic look at the market for trademarks is also warranted. Our analysis suggests that, while the volume of trademark properties involved in a recorded trade each year grew through the 2000s, this trend has appeared to reverse over the past decade. The factors driving this reversal, whether related to recording practices or the apparently increasing collateralization of trademarks is unknown. Moreover, any potential impacts upon trademark owners and the holders of collateral are equally unexplored. Mergers involving trademarks also merit further study. If the share of mergers involving trademarks has grown over time, this would suggests trademarks, and possibly other intangibles, are becoming more important assets in overall M&A activity. By providing the Trademark Assignment Dataset, we intend to provide an opportunity for scholars and the public to enrich our collective understanding in these and numerous other areas of inquiry.
38
7. ReferencesAmable, B., J. Chatelian, and K. Ralf. “Patents as Collateral”, Journal of Economic Dynamics and
Control. Vol. 34(6), pp. 1092-1104.
Apple, K. S. 2013. “Should Business Methods Be Patentable; Understand the Impact of Business Method Patents on Society.” Dissertation for Fulfillment of PhD in School of Public Policy. George Mason University. Fairfax, VA.
Bezant, M., 2003. “The use of intellectual property as security for debt finance.” Journal of Knowledge Management. Vol. 1(3), pp. 237-63.
Brian, W.J. 2011. “Using intellectual property to secure financing after the worst financial crisis since the Great Depression.” 15 Intellectual Property L. Rev. 449.
Cain, C. P., ed. 2011. Trademark Manual of Examining Procedure. 8th ed. United States Patent and Trademark Office, October. http://tess2.uspto.gov/tmdb/tmep/.
Ceccagnoli, M., S. J. H. Graham, M. Higgins, and J. Lee. 2010. "Productivity and the Role of Complementary Assets in Firms’ Demand for Technology Innovations." Industrial and Corporate Change. Vol. 19(3), pp. 839-869.
Chesbrough, H. 2006. “Emerging Secondary Markets for Intellectual Property: US and Japan Comparisons.” Research Report to National Center for Industrial Property Information and Training (NCIPI), March 31, 2006.
Ferreira, V., and M. Godinho. 2011. "Building an Innovation Function with Patents and Trademarks: Evidence from Portuguese Regional Innovation Systems." DRUID working paper series.
Fischer, T. and J. Henkel. 2012. “Patent Trolls on Markets for Technology--An Empirical Analysis of NPEs' Patent Acquisitions.” Research Policy. Vol. 41(9), pp. 1519-33.
Galasso, A., M. Schankerman, and C. Serrano. 2013. “Trading and Enforcing Patent Rights.” RAND Journal of Economics, Vol. 44(2), pp. 275-312.Gotsch, M., and C. Hipp. 2011. "Measurement of Innovation Activities in the Knowledge-Intensive Services Industry: A Trademark Approach." Fraunhofer working paper.
Graham, S. J.H., G. Hancock, A. Marco, and A. F. Myers. 2013. “The USPTO Trademark Case Files Dataset: Descriptions, Lessons, and Insights.” Journal of Economics & Management Strategy. Vol. 22(4), pp. 669–705.
———. 2013. “The USPTO Trademark Case Files Dataset: Descriptions, Lessons, and Insights.” SSRN working paper, available at http://papers.ssrn.com/sol3/papers.cfm?abstract_id=2188621.
Greenhalgh, C., M. Rogers, P. Schautcheck, and V. Sena. 2011. Trademark Incentives. UK Intellectual Property Office.

39
Heimonen, T. 2012. "What are the factors that affect innovation in growing SMEs?" European Journal of Innovation Management, Vol. 15(1), pp.122-44.
Krasnikov, A., and S. Mishra, and D.Orozco. 2009. "Evaluating the Financial Impact of Branding Using Trademarks: A Framework and Empirical Evidence." Journal of Marketing, Vol. 73(6), pp. 154-66.
Lamoreaux, N. R. and K. L. Sokoloff. 1999. “Inventive Activity and the Market for Technology in the United States, 1840-1920,” NBER Working Paper 7017.
Landes, W. M., and R. A. Posner. 1987. “Trademark law: an economic perspective.” Journal of Law and Economics, Vol. 30(2), pp. 265–309.
Lerner, J. 2010. “The Litigation of Financial Innovations.” Journal of Law and Economics. Vol. 53( 4), pp. 807-31.
Levenshtein, V. I. 1966. “Binary codes capable of correcting deletions, insertions, and reversals.” Soviet Physics Doklady, Vol. 10(8), pp. 707–10.
Llerena, P. and V. Millot. 2013. “Are Trade Marks and Patents Complementary or Substitute Protections for Innovation.” Bureau d’Economie Theorique et Appliquee Working Paper 2013-01.
Loumioti, M. 2011. “The use of intangible assets as loan collateral.” Doctoral dissertation. Retrieved from https://msbfile03.usc.edu/digitalmeasures/loumioti/intellcont/TheUseOfIntangiblesAsLoanCollateral_Final-1.pdf.
Marco, A. and G. Rausser. 2011. “Complementarities and Spillovers in Mergers: An Empirical Investigation Using Patent Data.” Economics of Innovation and New Technology. Vol. 20(3-4), pp. 207-31.
McAleer, M., F. Chan, and D. Marinova. “An Econometric Analysis of Asymmetric Volatility: Theory and Application to Patents.” Journal of Econometrics. Vol. 139(2), pp. 259-84.
Millot, V. 2009. "Trademarks as an Indicator of Product and Marketing Innovations." OECD Science, Technology and Industry Working Papers. http://dx.doi.org/10.1787/224428874418.
———. 2011. "Firms’ Intangible Assets: Who Relies on Trademarks? Analysis of French and German Firms’ Trademarking Behaviour." DRUID working paper.
Navarro, G. 2001. “A guided tour to approximate string matching.” ACM Computing Surveys, Vol. 33(1), pp. 31–88.
Sandner, P. G. 2009. "The Valuation of Intangible Assets: An Exploration of Patent and Trademark Portfolios." Mimeo.
Sandner, P. G., and J. Block. 2011. “The Market Value of R&D, Patents, and Trademarks.” Research Policy, Vol. 40(7), pp. 969-85.

40
Schankerman, M., and Pakes, A. 1986. “Estimates of the value of patent rights in European countries during post-1950 period.” Economic Journal, Vol. 96, pp. 1052–1076.
Schechter, F. I. 1927. “The Rational Basis of Trademark Protection.” Harvard Law Review, Vol. 40(6), pp. 813–833.
Schmoch, U., and S. Gauch. 2009. "Service Marks as Indicators for Innovation in Knowledge-Based Services." Research Evaluation, Vol. 18(4), pp. 323-35.
Serrano, C. J. 2010. “The Dynamics of the Transfer and Renewal of Patents.” The RAND Journal of Economics, Vol. 41(4), pp. 686-708.
Smith, G. V. 1996. Trademark Valuation. Wiley.
Somaya, D., and S. J. H. Graham. 2006. “Vermeers and Rembrandts in the Same Attic: Complementarity Between Copyright and Trademark Leveraging Strategies in Software.” SSRN working paper. http://papers.ssrn.com/sol3/papers.cfm?abstract_id=887484.
Wilkins, M. 1992. "The Neglected Intangible Asset: The Influence of the Trade Mark on the Rise of the Modern Corporation." Business History, Vol. 34(1), pp. 66-95.
WIPO (World Intellectual Property Organization). 2013. World Intellectual Property Report 2013: Brands – Reputation and Image in the Global Marketplace. WIPO.

41
8. FiguresandTablesTable 1: Summary statistics for recorded transactions by conveyance
Conveyance Variable Obs. Freq. (%) AGR (%) 1980-2005
per transactions (unique rf_id)
Mean S.D. Min P50 Max
assignment assignees 425831 51.77 1.02 0.22 1 1 57 assignors 433887 50.33 1.04 0.32 1 1 64 execution dates 417891 53.16 1.00 0.09 0 1 6 properties 1369250 32.62 6.24 3.27 10.80 1 1 1381 transactions 418938 53.24 5.81
name change assignees 155991 18.96 1.00 0.08 1 1 7 assignors 158162 18.35 1.02 0.24 1 1 50 execution dates 155503 19.78 1.00 0.05 0 1 4 properties 670448 15.97 7.51 4.31 15.84 1 1 1383 transactions 155455 19.75 8.64
security interest assignees 96163 11.69 1.09 0.83 1 1 48 assignors 123868 14.37 1.40 3.46 1 1 506 execution dates 88341 11.24 1.00 0.06 0 1 7 properties 1140573 27.17 15.53 12.91 28.96 1 5 1013 transactions 88332 11.22 15.71
merger assignees 52490 6.38 1.07 0.26 1 1 5 assignors 62618 7.26 1.28 1.03 1 1 35 execution dates 49121 6.25 1.00 0.07 0 1 4 properties 327144 7.79 6.81 6.67 21.09 1 2 936 transactions 49020 6.23 8.25
release assignees 50823 6.18 1.39 2.55 1 1 158 assignors 39711 4.61 1.08 0.86 1 1 47 execution dates 36778 4.68 1.00 0.09 0 1 7 properties 505268 12.04 20.92 13.77 30.81 1 5 795 transactions 36681 4.66 19.39
correction assignees 21017 2.56 1.04 0.77 1 1 79 assignors 23569 2.73 1.17 1.73 1 1 104 execution dates 20204 2.57 1.00 0.08 0 1 7 properties 109887 2.62 18.12 5.45 16.73 1 1 434 transactions 20167 2.56 17.72
other assignees 15968 1.94 1.14 1.09 1 1 95 assignors 15891 1.84 1.13 1.04 1 1 75 execution dates 14006 1.78 1.00 0.10 0 1 4 properties 70499 1.68 6.80 5.02 14.15 1 1 582 transactions 14049 1.79 5.98
no conveyance assignees 4290 0.52 1.00 0.02 1 1 2 recorded assignors 4299 0.50 1.00 0.15 1 1 11
execution dates 4289 0.55 1.00 0.00 1 1 1 properties 4576 0.11 16.08 1.07 1.11 1 1 50 transactions 4289 0.55 19.05
total assignees 822573 100.00 1.05 0.67 1 1 158 assignors 862005 100.00 1.10 1.28 1 1 506 execution dates 786133 100.00 1.00 0.08 0 1 7 properties 4197645 100.00 8.92 5.33 17.35 1 1 1383
transactions 786931 100.00 7.66 Freq: Share (%) of variable total. AGR: Avg annual growth rate (%) of variable sum from 1980 to 2005. Execution date figures reflect distinct execution dates per rf_id.

42
Table 2: Recordation lag by 5-year sub-periods
Execution Years
lag: recordation date-execution date (days)
Mean S.D. P25 P50 P75 P90
1955-59 218.77 1078.30 7 17 55 254 1960-64 191.05 940.43 7 18 58 243 1965-69 229.06 996.88 7 21 76 308 1970-74 263.57 1084.46 8 24 84 386 1975-79 292.19 1077.67 10 25 86 412 1980-84 374.52 1115.24 12 34 129 773 1985-89 468.36 1117.97 14 48 257 1530 1990-94 436.31 942.65 14 56 313 1437 1995-99 438.71 815.13 17 78 426 1458 2000-04 374.26 689.16 16 71 382 1221 2005-09 215.11 435.88 7 35 168 709
total 302.88 755.00 10 40 197 881
Note: total includes all rf_ids with an execution date between 1955 and 2013. Figures may still suffer from truncation as transactions executed in 2005-09 (or earlier) may yet to be recorded.
Table 3: Rate and frequency of transaction for registrations issued 1978-2013
Transaction Transacted
(%)
transactions per registration if transacted
transactions per year of registration if transacted
Mean S.D. Min P50 Max Mean S.D. Min P50 Max
any 31.05 2.83 2.92 1 2 40 0.48 7.03 0.03 0.21 1826.25 ownership change 20.95 1.58 1.06 1 1 35 0.25 3.89 0.03 0.15 730.50 security interest 11.93 2.18 1.66 1 2 26 0.43 7.08 0.03 0.19 1461.00
observations 3364471
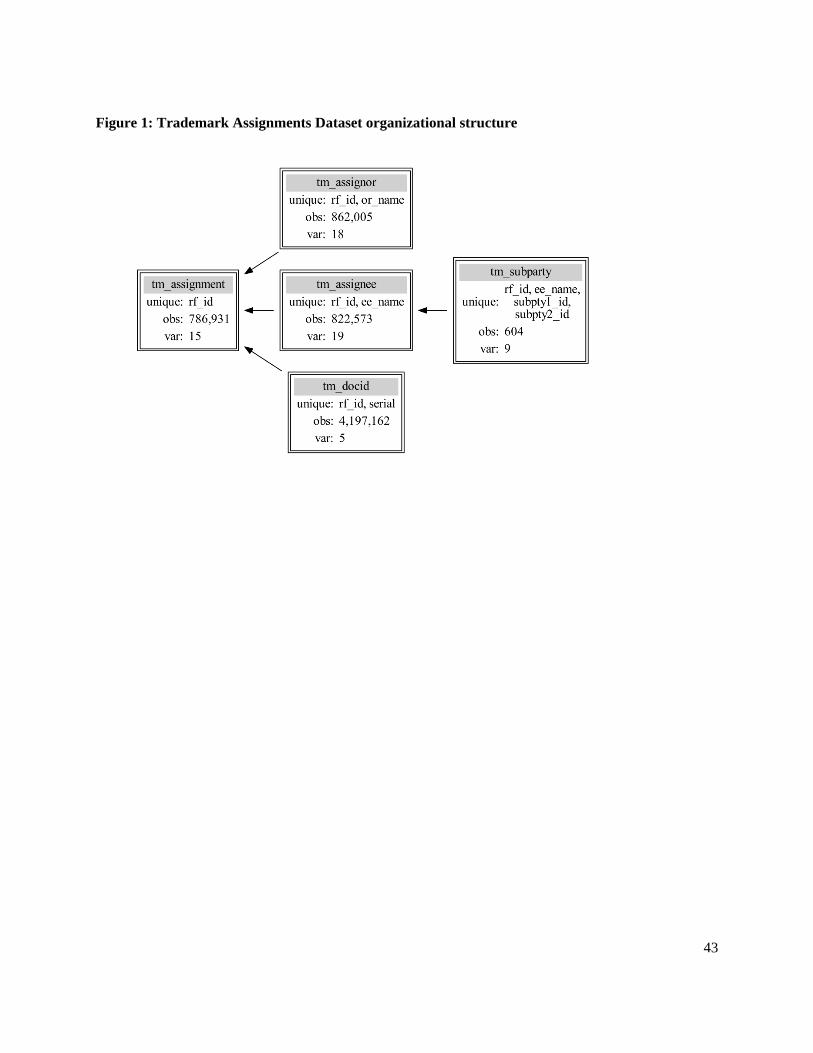
43
Figure 1: Trademark Assignments Dataset organizational structure

44
Figure 2: Transaction data coverage
Figure depicts the proportion of rf_ids with data coverage for key variables in tm_assignment by recordation year cohort. Correspondent name and address fields are populated for all but the earliest recordation years. Conveyance text data is missing for a very minor share of transactions, most of which were recorded between 2008 and 2010.
0
.2
.4
.6
.8
1
sha
re
1955 1965 1975 1985 1995 2005recordation year
correspondent name correspondent address
conveyance text
excludes 24 rf_ids missing record_dt

45
Figure 3: Assignee data coverage
Figure presents the proportion of assignee observations (unique rf_id, ee_name) with data coverage for key variables in tm_assignee by recordation year cohort. Assignee street address data coverage improves considerably after 1992, to near complete coverage since 1996. Address state and/or country fields are mostly populated starting in 1996 (although users may be able to identify state/country from the street address field). Assignee legal entity data coverage is limited until the early 1990s, but the field is mostly populated after 1992, ranging from about 90% to 100%
0
.2
.4
.6
.8
1
sha
re
1955 1965 1975 1985 1995 2005recordation year
name nationalityaddress street legal entity*address state/country
*Field populated with entry other than UNKNOWN or SEE DOCUMENTexcludes 24 rf_ids missing record_dt

46
Figure 4: Assignor data coverage
Figure shows the proportion of assignor observations (unique rf_id, or_name) with data coverage for key variables in tm_assignor by recordation year cohort. Address data coverage basically disappears for transactions recorded after 1992, presumably because the PTO-1594 coversheet was revised and ceased recording addresses for assignors. Both assignor nationality and legal entity data coverage improve starting in the late 1980s. The 2,396 rf_ids missing an execution or acknowledgement date were recored prior to 1994.
0
.2
.4
.6
.8
1
sha
re
1955 1965 1975 1985 1995 2005recordation year
name nationalityaddress street legal entity*address state/country execution/acknowledge date
*Field populated with entry other than UNKNOWN or SEE DOCUMENTexcludes 24 rf_ids missing record_dt

47
Figure 5: Transactions by recordation and execution years
Figure depicts the number of transactions (rf_ids) by year of recordation and by year of execution, showing an observable lag between recordation and execution. In particular, it shows the first peak in executed transactions occurring in 2000, rather than 2002, which is more consistent with a surge of transactions expected during the dot-com bubble.
0
10000
20000
30000
40000
tra
nsa
ctio
ns
(co
unt)
1955 1965 1975 1985 1995 2005year
by recordation by execution
excludes 2396 rd_ids with no execution date recorded

48
Figure 6: Cumulative total of transactions and unrecorded gap
Figure shows the cumulative total of transactions (rf_ids) by recordation year and by execution year (top panel, left axis). It also depicts the cumulative share of transactions unrecorded (the share of previously executed transactions yet to be recorded up until that point in time) from 1995 to 2013 (bottom panel, right axis). Disregarding the earliest years, 5 to 10 percent of executed transactions, yet to be recorded, may be missing from the data for the most recent time periods
0.05.1.15.2.25
cum
ula
tive
sha
re u
nre
cord
ed
0
200000
400000
600000
800000
tra
nsa
ctio
ns
(cu
mul
ativ
e co
unt
)
1955 1965 1975 1985 1995 2005year
by recordation by execution cumulative share unrecorded
excludes 2396 rd_ids with no execution date recorded

49
Figure 7: Distribution of transactions by recordation lag by conveyance type
Figure depicts the distribution of transactions (rf_ids) by recordation lag for each conveyance subcategory using a box and whisker plot.115 It shows non-random variation in the recordation lag across conveyance subcategories. Security interest agreements and releases in the Dataset were recorded almost entirely within one year of execution. Trademark assignments also tend to be recorded quickly, though slower that security agreements. But merger and name change recordations tend to be more delayed.
115 The length of the dark box indicates the interquartile range (IQR) and the white vertical line subdividing the box is the median. The dark horizontal lines or “whiskers” extend to the lower and upper adjacent values (i.e., designating values within 1.5 IQR of the nearer quartile). Data points outside these adjacent values are omitted.
0 2 4 6 8
lag: recordation date-execution date (years)
no conveyance recorded
other
correction
release
merger
security interest
name change
assignment
excludes outside values and 2396 rd_ids with no execution date recorded

50
Figure 8: Distribution of recordation relative to issuance (property-level transactions)
Figure shows the distribution of property-level transactions (unique rf_id, serial_no combinations) by the duration from registration issuance to transaction recordation for only those transactions where recordation lags execution by more than one year.116 There are distinct concentrations of assignment, merger, and name change property-level transactions recorded 6, 10, and 20 years from issuance when registrations are at risk of cancellation or expiration. No such concentrations are evident for security interests or releases. Thus, the truncation problem is most acute for mergers and name changes and may be of less concern for assignments and security interest agreements.
116 To calculate the duration from registration issuance to recordation we pulled registration dates from Case Files for the serial numbers in the tm_cf_no. Thus, serial numbers with no registration date in Case Files are excluded from Figure 8.
0
.025
.05
.075
.1
.125
0
.025
.05
.075
.1
.125
-10 0 10 20 30 40 50 60 -10 0 10 20 30 40 50 60 -10 0 10 20 30 40 50 60 -10 0 10 20 30 40 50 60
-10 0 10 20 30 40 50 60 -10 0 10 20 30 40 50 60 -10 0 10 20 30 40 50 60 -10 0 10 20 30 40 50 60
assignment name change security interest merger
release correction other TotalDen
sity
time since issuance (years)
Graphs by conveyance type: sixth-year maintenance and ten-year renewal terms indicated by gray barsexcludes outside values and property-level transactions recorded within one year of execution and/or affecting applications
Timing of Recordation
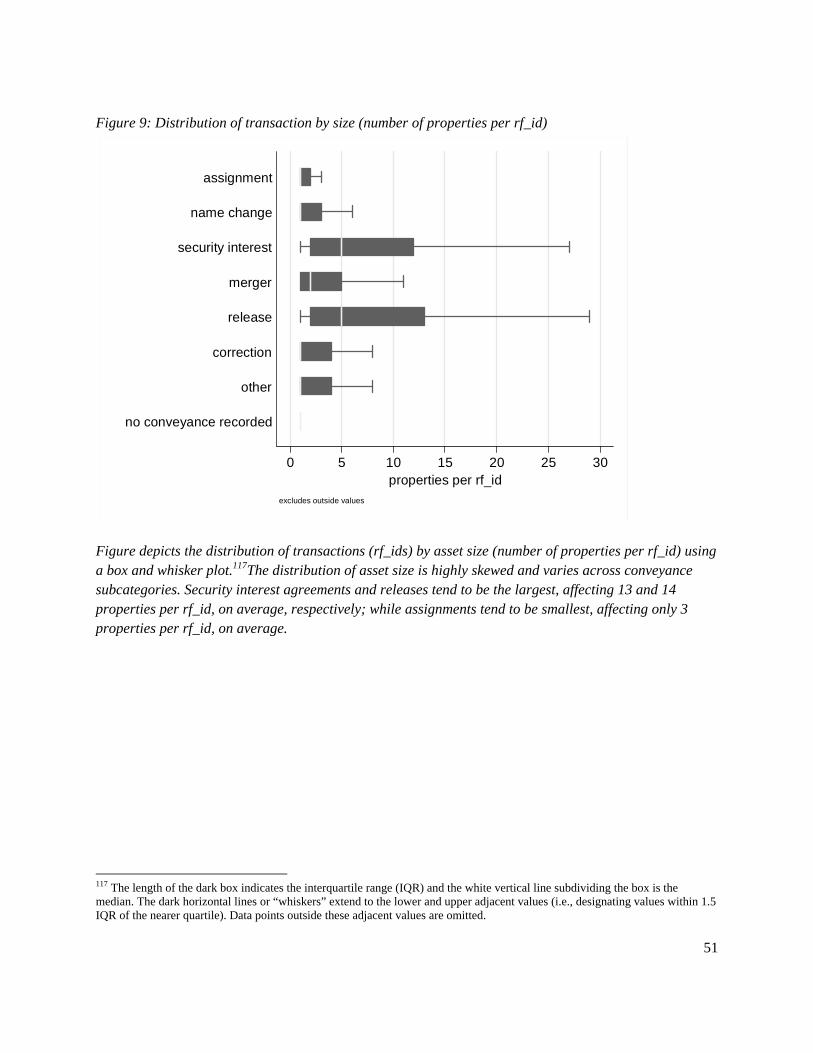
51
Figure 9: Distribution of transaction by size (number of properties per rf_id)
Figure depicts the distribution of transactions (rf_ids) by asset size (number of properties per rf_id) using a box and whisker plot.117The distribution of asset size is highly skewed and varies across conveyance subcategories. Security interest agreements and releases tend to be the largest, affecting 13 and 14 properties per rf_id, on average, respectively; while assignments tend to be smallest, affecting only 3 properties per rf_id, on average.
117 The length of the dark box indicates the interquartile range (IQR) and the white vertical line subdividing the box is the median. The dark horizontal lines or “whiskers” extend to the lower and upper adjacent values (i.e., designating values within 1.5 IQR of the nearer quartile). Data points outside these adjacent values are omitted.
0 5 10 15 20 25 30properties per rf_id
no conveyance recorded
other
correction
release
merger
security interest
name change
assignment
excludes outside values

52
Figure 10: Transactions by execution year
Figure shows the trend in the number of recorded transactions (rf_ids) by conveyance and execution year during the 1955 to 2013 period.
0
4000
8000
12000
16000
tra
nsa
ctio
ns
(co
unt)
1955 1965 1975 1985 1995 2005execution year
assignment name change security interest mergerrelease correction other

53
Figure 11: Property-level transactions by execution year
Figure shows the trend in the number of property-level transactions (unique rf_id, serial_no combinations) by conveyance and execution year during the 1955 to 2013 period.
0
20000
40000
60000
80000
pro
pert
y-le
vel t
rans
act
ions
(co
unt
)
1955 1965 1975 1985 1995 2005execution year
assignment name change security interest mergerrelease correction other

54
Figure 12: Proportion of transactions
Figure depicts the share of recorded transactions (rf_ids) by conveyance in each execution year for the 1955 to 2013 period. It shows the relative decline in assignments, mergers, and name changes as a proportion of executed transactions.
0
.2
.4
.6
.8
1
pro
port
ion
of t
rans
act
ions
1955 1965 1975 1985 1995 2005execution year
assignment name change security interest merger
release correction other
excludes transactions with no conveyance recorded

55
Figure 13: Proportion of property-level transactions
Figure illustrates the share of property-level transactions (unique rf_id, serial_no combinations) by conveyance in each execution year for the 1955 to 2013 period. It depicts the relative decline in assignments, mergers, and name changes, which comprise roughly 90 percent of property-level transactions in the early 1980s but account for only 44 percent by 2007. By contrast, security agreements and releases rise from 5 percent of property-level transactions in 1980 to more than half by 2007.
0
.2
.4
.6
.8
1
pro
port
ion
of p
rope
rty-
leve
l tra
nsa
ctio
ns
1955 1965 1975 1985 1995 2005execution year
assignment name change security interest merger
release correction other
excludes transactions with no conveyance recorded

56
Figure 14: Recorded mergers involving trademarks compared to all merger and acquisition activity
Figure compares recorded mergers involving trademarks with overall merger and acquisition (M&A) in the U.S. for select years.118 It suggests that recorded mergers involving trademarks represent roughly 19 to 28 percent of M&A activity during the 1997 to 2003 period.
118 Executed mergers affecting trademark properties as a proportion of all mergers and acquisitions activity from Census, The 2006 Statistical Abstract, Table 751 Mergers and Acquisitions, from Thomson Financial, available at http://www.census.gov/compendia/statab/2006/tables/06s0751.xls. Figure 14 is limited to years in which data on merger and acquisition activity was available.
0
.05
.1
.15
.2
.25
.3
tra
nsa
ctio
ns
/ me
rge
rs a
nd
acq
uisi
tions
0
2500
5000
7500
10000
12500
15000
cou
nt
1990 1992 1994 1996 1998 2000 2002year
all mergers and acquisitions (M&A) [left axis]
recorded mergers involving TMs (rf_ids) [left axis]
recorded mergers involving TMs / M&A [right axis]
Mergers and acquisitions activity from Census, The 2006 Statistical Abstract,Table 751 Mergers and Acquisitions from Thomson Financial

57
Figure 15: Property-level transactions as a proportion of the stock of live properties
Figure shows transacted properties per year as a proportion of 100 live properties (pending applications and live registrations) for each conveyance type.119 It depicts all property-level transactions (unique rf_id, serial_no combinations) and distinct transacted properties (unique serial_no within execution year and conveyance combination) as a proportion of live properties by execution year. For the latter, serial numbers with multiple transactions executed within a given year and conveyance type are counted only once. Each year since 1985, 5 to 8 percent of the stock of live trademarks has been involved in some recorded transaction (excluding corrections). This proportion has been fairly stable over time, indicating that the number of properties involved in a recorded transaction has grown at largely the same pace as the overall stock.
119 The stock of live properties is derived from the Case Files dataset and includes live registrations as well as pending applications because parties may convey interest in an application prior to a registration being issued. Figure 15 only includes execution years 1982 through 2012 because abandonments are only observable in Case File dataset for applications filed in and after 1982. See Case Files § 5.1.
0
1
2
3
4
1982 1992 2002 2012
assignment
0
.5
1
1.5
2
1982 1992 2002 2012
name change
0
1
2
3
4
1982 1992 2002 2012
security interest
0
.5
1
1.5
2
1982 1992 2002 2012
merger
pro
pert
y-le
vel t
ran
sact
ion
s pe
r 10
0 liv
e p
rop
ertie
s
0
1
2
3
4
1982 1992 2002 2012
release
0
.5
1
1.5
2
1982 1992 2002 2012
other
Graphs by conveyance type; excludes correctionsDistinct properties are unique serial numbers within execution year and conveyance type
all property-level transactions distinct annual transacted properties*
execution year
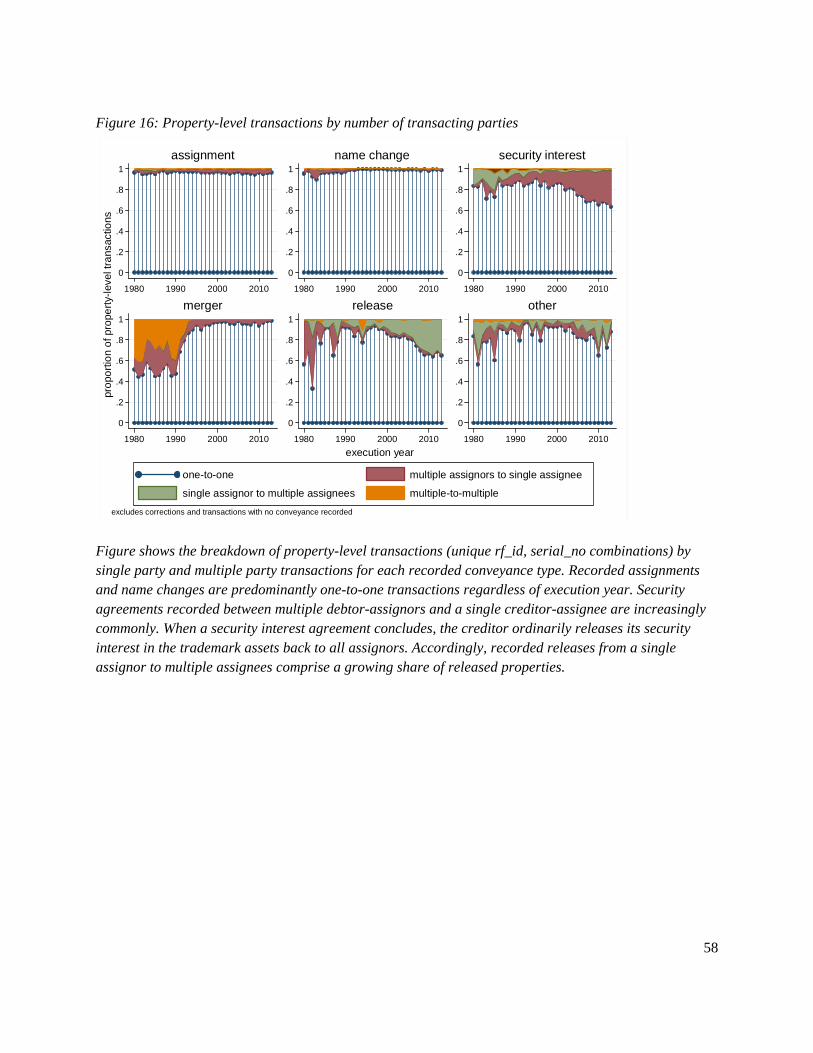
58
Figure 16: Property-level transactions by number of transacting parties
Figure shows the breakdown of property-level transactions (unique rf_id, serial_no combinations) by single party and multiple party transactions for each recorded conveyance type. Recorded assignments and name changes are predominantly one-to-one transactions regardless of execution year. Security agreements recorded between multiple debtor-assignors and a single creditor-assignee are increasingly commonly. When a security interest agreement concludes, the creditor ordinarily releases its security interest in the trademark assets back to all assignors. Accordingly, recorded releases from a single assignor to multiple assignees comprise a growing share of released properties.
0
.2
.4
.6
.8
1
1980 1990 2000 2010
assignment
0
.2
.4
.6
.8
1
1980 1990 2000 2010
name change
0
.2
.4
.6
.8
1
1980 1990 2000 2010
security interest
0
.2
.4
.6
.8
1
1980 1990 2000 2010
merger
0
.2
.4
.6
.8
1
1980 1990 2000 2010
release
0
.2
.4
.6
.8
1
1980 1990 2000 2010
other
excludes corrections and transactions with no conveyance recorded
one-to-one multiple assignors to single assignee
single assignor to multiple assignees multiple-to-multiple
execution year
pro
port
ion
of p
rope
rty-
leve
l tra
nsac
tions

59
Figure 17: Property-level transactions by nationality of transacting parties
Figure shows the domestic, foreign, and cross-national share of property-level transactions (unique rf_id, serial_no combinations) for each conveyance type by execution year. Across conveyance types, the majority of recorded property-level transactions are domestic exchanges, but purely foreign transactions account for a sizeable share of properties assigned or affected by mergers each year since 2006. Recordations of cross-national changes in trademark ownership are infrequent but not absent. Among recordations specifying more recent execution dates, roughly 5 percent of properties assigned were “exported” from domestic assignors to foreign assignees with “imported” properties from foreign assignors to domestic assignees comprising only about 3 percent.
0
.2
.4
.6
.8
1
1995 2000 2005 2010
assignment
0
.2
.4
.6
.8
1
1995 2000 2005 2010
name change
0
.2
.4
.6
.8
1
1995 2000 2005 2010
security interest
0
.2
.4
.6
.8
1
1995 2000 2005 2010
merger
0
.2
.4
.6
.8
1
1995 2000 2005 2010
release
0
.2
.4
.6
.8
1
1995 2000 2005 2010
other
excludes corrections and transactions with no conveyance recorded
domestic foreign international incoming
international outgoing unknown
execution year
pro
port
ion
of p
rope
rty-
leve
l tra
nsac
tions

60
Figure 18: Top Six Creditor-Assignees share of property-level transactions by execution year
Figure depicts the top six creditor-assignees in the Dataset based on the total number of trademark properties for which they recorded a security interest (including properties involved in multiple recorded security agreements). Notably, these entities consist primarily of large commercial banks. Bank of America is the most active creditor-assignee, recording a security interest on roughly 102,000 trademark properties or 9 percent of all property-level security agreements. Yet, Bank of America only became the creditor-assignee for a large share of such secured properties starting in the late 1990s. Citibank was the largest creditor-assignee during the early period, but has accounted for a much smaller share of security interests recorded on trademark properties each year since 1995.
0
.05
.1
.15
.2
.25
.3
.35
.4
.45
shar
e o
f re
cord
ed
secu
rity
inte
rest
aga
inst
pro
per
ties
1980 1985 1990 1995 2000 2005 2010execution year
Bank of Amercia JPMorgan Chase Bank
GE Capital Corporation Citibank
Wells Fargo Bank Credit Suisse

61
Figure 19: Concentration ratio – five largest creditor-assignees
Figure shows the concentration ratio for the five largest creditor-assignees (based on the number of properties against which they record security interest) by execution year in our Dataset. While there is considerable variation in the early years, the overall U-shaped trend in the ratio indicates high concentration among a few firms when trademark security agreements were rarely recorded, followed by new entry among recorders and less concentration as the recordation of security interest on trademarks grew through the mid-1990s.
0
.1
.2
.3
.4
.5
sha
re o
f re
cord
ed s
ecu
rity
inte
rest
ag
ains
t pro
pert
ies
1980 1985 1990 1995 2000 2005 2010execution year

62
Figure 20: Proportion registrations of transacted by timing of first transaction (registration issued 1978-1989 under twenty-year renewal regime)
Figure presents the proportion of registered trademarks involved in a recorded transaction by the time period of the first transaction for each registration year cohort. It includes only registrations issued during the 1978 to 1989 period under the twenty-year renewal regime. Rates are largely consistent across cohorts: roughly 40 percent involved in at least one recorded transaction and 30 percent experienced a recorded owner change. The timing of the first recorded ownership change relative to maintenance events is also fairly stable, particularly after 1979. The incidence and timing of recorded security interest agreements are less consistent across cohorts. A higher proportion of registrations were recorded as securing debt (nearly 15 percent) among the youngest cohorts, reflecting a higher incidence of security agreements being recorded between issuance and maintenance (years 0-6).
0
.05
.1
.15
.2
.25
.3
.35
.4
.45
1978
1980
1982
1984
1986
1988
1978
1980
1982
1984
1986
1988
1978
1980
1982
1984
1986
1988
all transactions ownership change security interest
pre-issue years 0-6 years 7-20 years 21-30
pro
port
ion
firs
t tra
nsa
cte
d
registration year cohort
Graphs by transaction typeRegistrations issued under twenty-year renewal terms; 1989 cohort excludes registrations issued on or after 16nov1989

63
Figure 21: Proportion registrations of transacted by timing of first transaction (registration issued 1990-2013 under ten-year renewal regime)
Figure presents the proportion of registered trademarks involved in a recorded transaction by the time period of the first transaction for each registration year cohort. It includes only registrations issued during the 1990 to 2013 period under the ten-year renewal regime. For the pre-1994 registration cohorts (i.e., those subject to three maintenance events), recorded transaction rates are similar to the older cohorts shown in Figure 20 – about 40 percent involved in a transaction and 30 percent transferred between parties. Roughly 15 percent of registrations in the pre-1994 cohorts were involved in a recorded securitization, roughly mirroring the rate for the 1989 cohort demonstrated in Figure 20. Figure 21 also shows first recorded transactions occurring earlier in the registration live cycle, but notably only among registrations issued through the mid-2000s.
0
.05
.1
.15
.2
.25
.3
.35
.4
.45
1990
1993
1996
1999
2002
2005
2008
2011
1990
1993
1996
1999
2002
2005
2008
2011
1990
1993
1996
1999
2002
2005
2008
2011
all transactions ownership change security interest
pre-issue years 0-6 years 7-10 years 11-20
years 21-30
pro
port
ion
firs
t tra
nsa
cte
d
registration year cohort
Graphs by transaction typeRegistrations issued under ten-year renewal terms

64
Figure 22: Proportion of registrations with an ownership change by maintenance cohort
Figure shows the proportion of registrations with a recorded ownership change occurring at different phases in the registration life cycle by three maintenance cohorts. It depicts the incidence of a recorded trade conditional on survival, i.e. number of events the registration was maintained. Note the absence of a clear positive relationship between the proportion of registrations with a recorded ownership change and the number of times maintained. In fact, there appears to be an inverse relationship between maintenance and ownership change between issuance and first maintenance (years 0-6) for both 1989-92 and 1978-89 registrations (see “dashed” confidence intervals falling in both panels, from left to right). There is a positive relationship between recorded ownership change and maintenance in the 1978-89 cohort (right panel) during years 7-20 and 21-30, and in the 1989-92 cohort (left panel) during years 11-20, though these results may be subject to censoring.
.14
.16
.18
.2
.22
.24
.26
.28
prop
ortio
n w
ith o
wne
rshi
p c
han
ge in
per
iod
M6 M10 M20
years 0-6 (95% CI)
years 7-10 (95% CI)
years 11-20 (95% CI)
1989-1992 cohort (ten-year terms)
0
.05
.1
.15
.2
.25
.3
.35
.4
.45
prop
ortio
n w
ith o
wne
rshi
p c
han
ge in
per
iod
M6 M20 M30
years 0-6 (95% CI)
years 7-20 (95% CI)
years 21-30 (95% CI)
1979-1989 cohort (twenty-year terms)
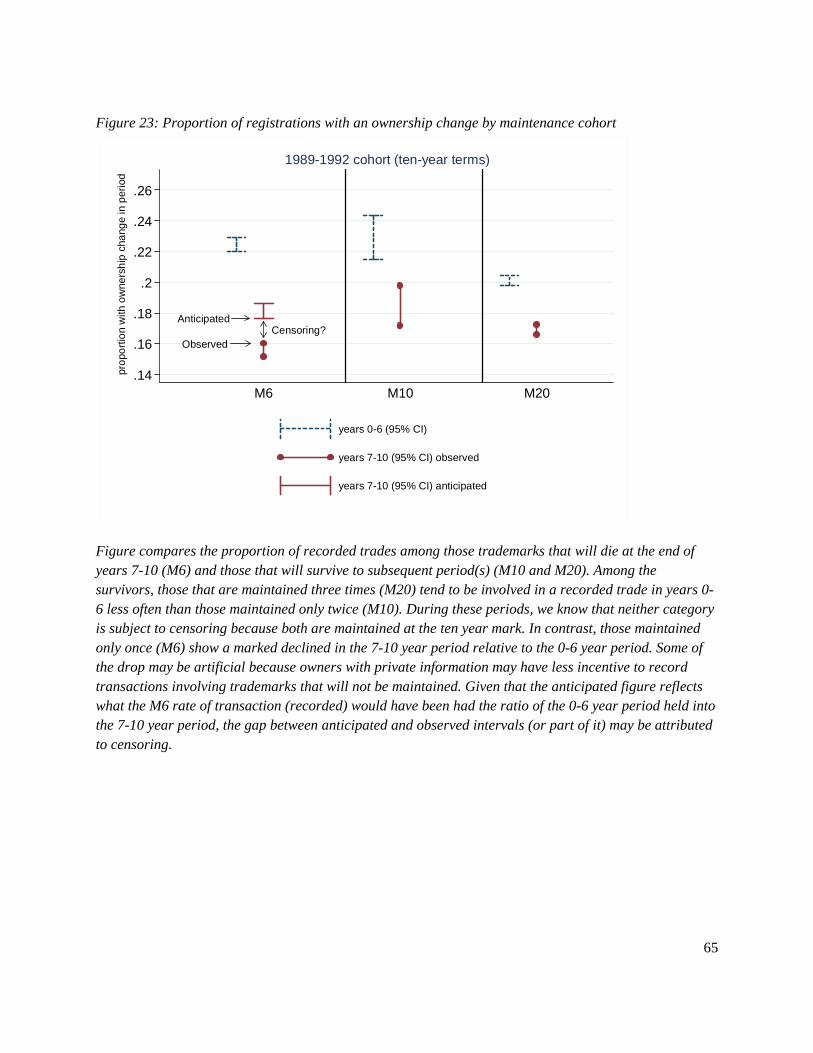
65
Figure 23: Proportion of registrations with an ownership change by maintenance cohort
Figure compares the proportion of recorded trades among those trademarks that will die at the end of years 7-10 (M6) and those that will survive to subsequent period(s) (M10 and M20). Among the survivors, those that are maintained three times (M20) tend to be involved in a recorded trade in years 0-6 less often than those maintained only twice (M10). During these periods, we know that neither category is subject to censoring because both are maintained at the ten year mark. In contrast, those maintained only once (M6) show a marked declined in the 7-10 year period relative to the 0-6 year period. Some of the drop may be artificial because owners with private information may have less incentive to record transactions involving trademarks that will not be maintained. Given that the anticipated figure reflects what the M6 rate of transaction (recorded) would have been had the ratio of the 0-6 year period held into the 7-10 year period, the gap between anticipated and observed intervals (or part of it) may be attributed to censoring.
Anticipated
ObservedCensoring?
.14
.16
.18
.2
.22
.24
.26
pro
port
ion
with
ow
ners
hip
cha
nge
in p
erio
d
M6 M10 M20
years 0-6 (95% CI)
years 7-10 (95% CI) observed
years 7-10 (95% CI) anticipated
1989-1992 cohort (ten-year terms)
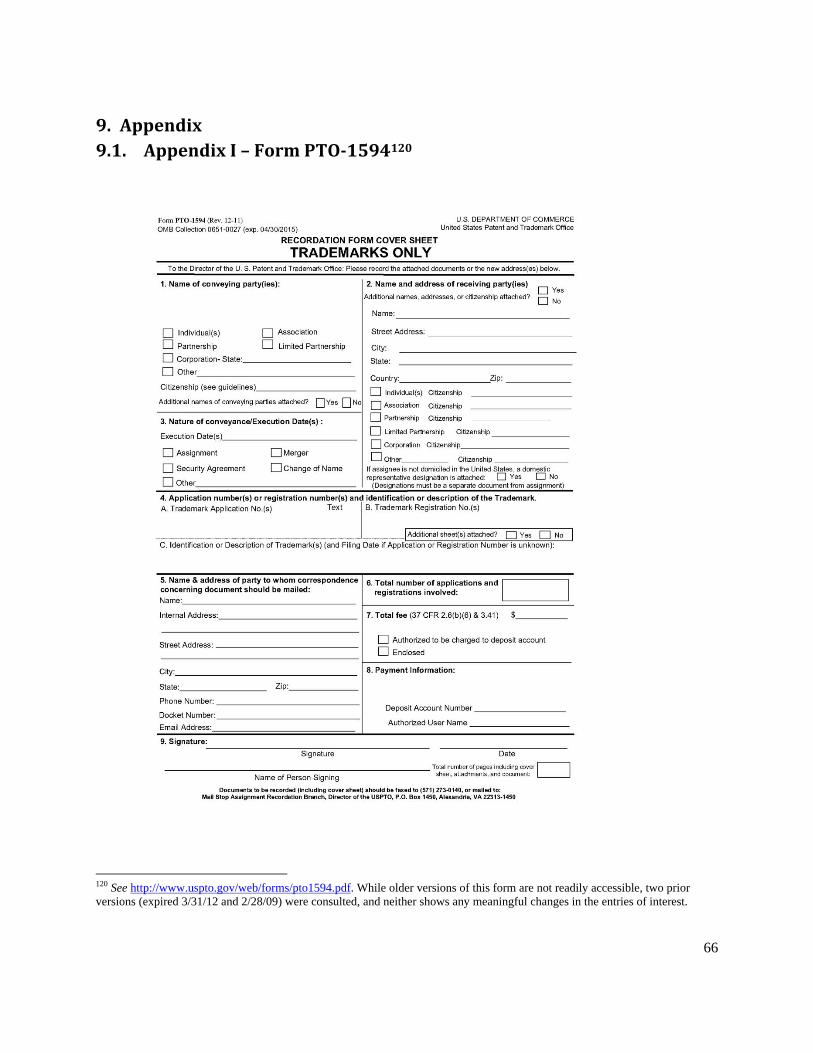
66
9. Appendix9.1. AppendixI–FormPTO‐1594120
120 See http://www.uspto.gov/web/forms/pto1594.pdf. While older versions of this form are not readily accessible, two prior versions (expired 3/31/12 and 2/28/09) were consulted, and neither shows any meaningful changes in the entries of interest.

67

68

69
9.2. AppendixII–ElectronicTrademarkAssignmentSystem(ETAS)FormPTO‐1594121
121 See http://etas.uspto.gov/.

70

71

72
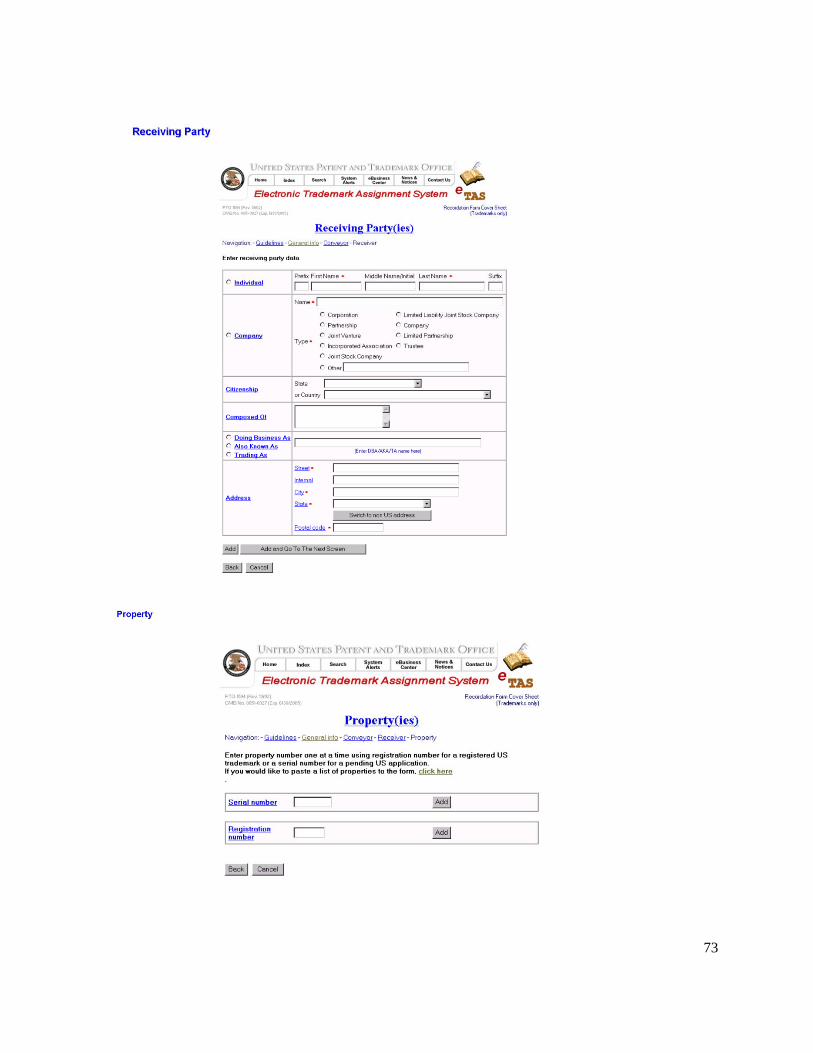
73

74
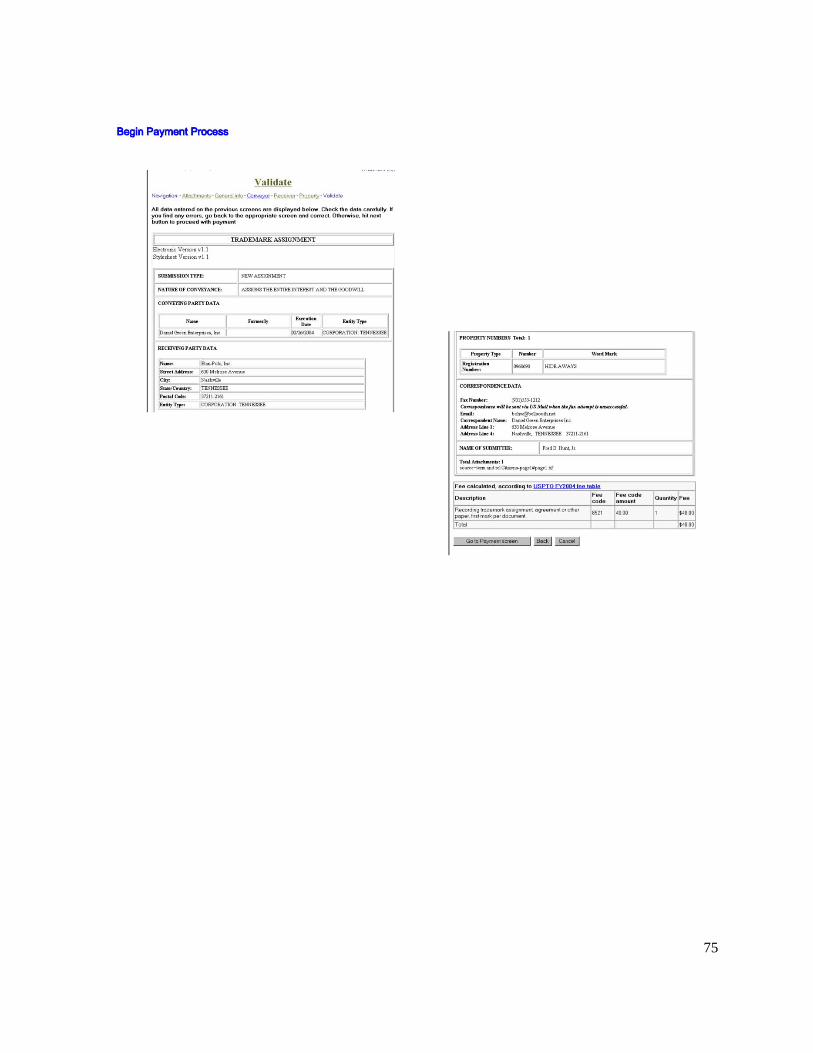
75

76
9.3. AppendixIII–Datafilesandvariables
Appendix III provides variable tables for each data file in the USPTO Trademark Assignment Dataset. To ease use, we revised and standardized variable names from those in the XML source files. However, each variable label in the Stata DTA files contains a description and cites the original variable name (within “< >”) from the XML source. Many elements of the XML files consist of free‐form text without limits to character length. To ease memory constraints, we truncated certain character variables in the Stata DTA files. For each truncated variable, we added an integer variable containing the full character length and denoted with the suffix “_len.” We retained full text strings in the CSV files.
tm_assignment.dta obs: 786,931 Created by the Python stata package. vars: 15 11 Feb 2014 14:28 size: 409,204,120 storage display value variable name type format label variable label rf_id str8 %-8s Reel-Frame Identification file_id byte %8.0f XML File Number cname str50 %-20s Correspondent Name <person-or-organization-name> caddress_1 str50 %-20s Correspondent Address Line 1 <address-1> caddress_2 str49 %-20s Correspondent Address Line 2 <address-2> caddress_3 str49 %-20s Correspondent Address Line 3 <address-3> caddress_4 str50 %-20s Correspondent Address Line 4 <address-4> reel_no int %8.0f Reel Number <reel-no> frame_no str4 %-4s Frame Number <frame-no> record_dt float %td Date Recorded <date-recorded> page_count int %8.0f Page Count <page-count> convey_text str244 %-20s Conveyance Text <conveyance-text> convey_text_len int %8.0f Length of Conveyance Text purge_in byte %8.0f Purge Indicator <purge-indicator> last_update_dt float %td Last Update Date <last-update-date>
tm_convey.dta (constructed) obs: 786,931 Created by the Python stata package. vars: 2 26 Feb 2014 11:14 size: 9,443,172 storage display value variable name type format label variable label rf_id str8 %-8s Reel-Frame Identification conv_group float %22.0g conlb
tm_docid.dta obs: 4,197,162 Created by the Python stata package. vars: 5 11 Feb 2014 14:28 size: 134,309,184 storage display value variable name type format label variable label rf_id str8 %-8s Reel-Frame Identification serial str8 %-8s Serial Number <serial-no> reg_no str7 %-7s Registration Number <registration-no> intl_reg_no str8 %-8s International Registration Number <intl-reg-no> count byte %8.0f Count of observations in XML

77
tm_cf_no.dta (constructed) obs: 4,197,645 Created by the Python stata package. vars: 6 14 Feb 2014 13:32 size: 176,301,090 storage display value variable name type format label variable label rf_id str8 %-8s Reel-Frame Identification serial str8 %-8s Serial Number <serial-no> reg_no str7 %-7s Registration Number <registration-no> error float %16.0g Matching to Case Files Error cf_serial_no str8 %9s Case Files Serial Number cf_registration_no str7 %9s Case Files Registration Number tm_assignor.dta obs: 862,005 Created by the Python stata package. vars: 18 11 Feb 2014 14:28 size: 1,663,669,650 storage display value variable name type format label variable label rf_id str8 %-8s Reel-Frame Identification or_name str244 %-20s Assignor Name <person-or-organization-name> or_name_len int %8.0f Length of Assignor Name or_address_1 str238 %-20s Assignor Address Line 1 <address-1> or_address_2 str151 %-20s Assignor Address Line 2 <address-2> or_city str244 %-20s Assignor City <city> or_city_len int %8.0f Length of Assignor City or_state str20 %-20s Assignor State <state> or_postcode str9 %-9s Assignor Postal Code <postcode> or_country str38 %-20s Assignor Country <country-name> or_natlty str45 %-20s Assignor Nationality <nationality> or_legal_entity_text str240 %-20s Assignor Legal Entity Text <legal-entity-text> or_former_stm str229 %-20s Assignor Formerly Known as <formerly-statement> or_comp_stm str240 %-20s Assignor Composed of Statement <composed-of-statement> or_dba_stm str211 %-20s Assignor DBA/AKA/TA Statement <dba-aka-ta-statement> exec_dt float %td Execution Date <execution-date> ack_dt float %td Acknowledgement Date <date-acknowledged> count byte %8.0f Count of observations in XML tm_assignee.dta obs: 822,573 Created by the Python stata package. vars: 19 11 Feb 2014 14:28 size: 1,639,387,989 storage display value variable name type format label variable label rf_id str8 %-8s Reel-Frame Identification ee_name str244 %-20s Assignee Name <person-or-organization-name> ee_name_len int %8.0f Length of Assignee Name ee_address_1 str240 %-20s Assignee Address Line 1 <address-1> ee_address_2 str224 %-20s Assignee Address Line 2 <address-2> ee_city str244 %-20s Assignee City <city> ee_city_len int %8.0f Length of Assignee City ee_state str45 %-20s Assignee State <state> ee_postcode str15 %-15s Assignee Postal Code <postcode> ee_country str42 %-20s Assignee Country <country-name> ee_natlty str45 %-20s Assignee Nationality <nationality> ee_legal_entity_text str244 %-20s Assignee Legal Entity Text <legal-entity-text> ee_legal_entity_text_len

78
int %8.0f Length of Assignee Legal Entity Text ee_former_stm str143 %-20s Assignee Formerly Known as <formerly-statement> ee_comp_stm str244 %-20s Assignee Composed of Statement <composed-of-statement> ee_comp_stm_len int %8.0f Length of Assignee Composed of Statement ee_dba_stm str244 %-20s Assignee DBA/AKA/TA Statement <dba-aka-ta-statement> ee_dba_stm_len int %8.0f Length of Assignee DBA/AKA/TA Statement count byte %8.0f Count of observations in XML
tm_subparty.dta obs: 604 Created by the Python stata package. vars: 9 11 Feb 2014 14:28 size: 304,416 storage display value variable name type format label variable label rf_id str8 %-8s Reel-Frame Identification ee_name str199 %-20s Assignee Name <person-or-organization-name> subpty1_id int %8.0f Sub-party level 1 ID subpty2_id int %8.0f Sub-party level 2 ID entity str41 %-20s Sub-party entity type entity_code str2 %-2s Sub-party entity type code name str233 %-20s Sub-party name stctry str14 %-14s Sub-party state/country stctry_code str3 %-3s Sub-party state/country code
tm_file.dta obs: 1 Created by the Python stata package. vars: 5 11 Feb 2014 14:28 size: 14 storage display value variable name type format label variable label file_id byte %8.0f XML File Number action_key_code str2 %-2s Action Key Code - AN=Annual, DA=Daily
<action-key-code> transaction_dt float %td Date File Prepared <transaction-date> dtd_version str3 %-3s XML DTD Version <version-no> dtd_version_dt float %td Date of XML DTD Version <version-date>

79
9.4. AppendixVI–Conveyancesubcategories
To construct the conv_group field in the tm_convey data file, we first removed numbers, special characters, and extraneous spaces from the convey_text field in the tm_assignments data file. We then applied the Levenshtein (1966) algorithm with 10 percent threshold to identify matching strings. This reduced the number of distinct convey_text observations from 95,326 (in tm_assignment) to 46,066. We then designated a conveyance subcategory by: i) matching on options from the PTO-1594 cover sheet (paper or electronic); ii) matching on frequently observed strings; and iii) where a conveyance subcategory was not designated via the prior to steps, searching on regular expressions.122 We flag rf_ids containing specific regular expressions under each subcategory. With some exceptions, rf_ids flagged in multiple subcategories based on regular expressions were placed in the other subcategory.
conv_group: assignment [418,983 (53.24%) rf_ids] 1. Matching one of the following options from PTO-1594 cover sheet (paper or electronic)
[140.936 (17.91%) rf_ids] "ASSIGNMENT" "ASSIGNS THE ENTIRE INTEREST AND THE GOODWILL" "ASSIGNMENT OF AN UNDIVIDED PART OF ASSIGNORS INTEREST" "NUNC PRO TUNC ASSIGNMENT"
2. Matching one of the following frequently observed strings [267,549 (34.00%) rf_ids] "ASSIGNS THE ENTIRE INTEREST" "NUNC PRO TUNC ASSIGNMENT EFFECTIVE" "ASSIGNS AS OF DEC THE ENTIRE INTEREST AND THE GOOD WILL" "ASSIGNS THE ENTIRE INTEREST AND THE GOODWILL EFFECTIVE" "ASSIGNS ALL INTEREST TOGETHER WITH THE GOOD WILL OF THE BUSINESS SYMBOLIZED BY SAID MARK" "ASSIGNS THE ENTIRE INTEREST EFFECTIVE" "ASSIGNS THE ENTIRE INTEREST TOGETHER WITH THE GOOD WILL OF THE BUSINESS IN CONNECTION WITH WHICH SAID MARK IS USED" "ASSIGNS THE ENTIRE INTEREST IN SAID MARK TOGETHER WITH THE GOOD WILL OF THE BUSINESS IN CONNECTION THEREWITH" "ASSIGNS THE ENTIRE INTEREST TOGETHER WITH THAT PART OF THE GOOD WILL OF THE BUSINESS CONNECTED WITH THE USE OF SAID MARK" "ASSET PURCHASE AGREEMENT" "ASSIGNS AS OF DEC ALL INTEREST AND THE GOOD WILL" "ASSIGNS THE ENTIRE INTEREST AND THE GOOD WILL SUBJECT TO AGREEMENT RECITED" "BILL OF SALE" "CONFIRMATORY ASSIGNMENT"
3. Matching by the following regular expressions [10,453 (1.33%) rf_ids]
"NUNC PRO TUNC" "ENTIRE INTEREST|ALL INTEREST" "GOODWILL|GOOD WILL" "AN UNDIVIDED PART" "PURCHASE AGREEMENT" "CONFIRMATORY ASSIGNMENT|CONFIRMATORY TRADEMARK ASSIGNMENT|CONFIRMATION OF ASSIGNMENT|CONFIRMATION ASSIGNMENT" "CONTRIBUTION AGREEMENT" "CONDITIONAL ASSIGNMENT" "ASSIGNS SAID MARK" "ASSET PURCHASE|MARK PURCHASE|MARK TRANSFER|TRANSFER OF ASSETS|ASSET TRANSFER" "ASSUMPTION AGREEMENT|ASSIGNMENT AGREEMENT|ASSIGNMENT AND ASSUMPTION" "PARTIAL ASSIGNMENT|ASSIGNS PERCENT INTEREST" "^ASSIGNMENT EFFECTIVE" "SALE|ACQUISITION|CHANGE OF OWNERSHIP|TRANSFER OF OWNERSHIP" "INTELLECTUAL PROPERTY ASSIGNMENT|ASSIGNMENT OF INTELLECTUAL PROPERTY" "CONVEYANCE AGREEMENT" "QUITCLAIM"
122 See http://www.stata.com/support/faqs/data/regex.html.

80
"RELATING TO TITLE OF THIS REGISTRATION" "SELLER AGREES TO SELL" "TRADEMARK ASSIGNMENT AGREEMENT|^ASSIGNMENT OF TRADEMARK$|^ASSIGNMENT OF TRADEMARKS$|^TRADEMARK ASSIGNMENT$|^TRADEMARK$|^TRADEMARK AGREEMENT$|^TRADEMARKS$"
conv_group: name change [155,455 (19.75%) rf_ids] 1. Matching the following option from PTO-1594 cover sheet (paper or electronic) [134,030
(17.03%) rf_ids] "CHANGE OF NAME"
2. Matching one of the following frequently observed strings [13,805 (1.75%) rf_ids]
"CHANGE OF ADDRESS" "CERTIFIED COPY OF CHANGE OF NAME FILED IN THE OFFICE OF THE SECRETARY OF STATE OF
DELAWARE ON MAY" "CONVERSION" "CHANGE OF NAME EFFECTIVE" "CHANGE OF NAME EFFECTIVE SEE DOCUMENT FOR DETAILS" "CERTIFICATE OF CONVERSION" "CHANGE OF NAME EFFECTIVE SEE RECORD FOR DETAILS" "CHANGE OF NAME SEE DOCUMENT FOR DETAILS" "CHANGE OF NAME EFFECTIVE MARCH" "CHANGE OF NAME SEE RECORD FOR DETAILS"
3. Matching by the following regular expressions [7,620 (0.97%) rf_ids] "CHANGE OF NAME|NAME CHANGE|CHANGES OF NAMES" "CHANGE OF ADDRESS|ADDRESS CHANGE|CHANGES OF ADDRESS|CHANGE OF ASSIGNEES ADDRESS" "CONVERSION" "CHANGE OF LEGAL" "CHANGE OF ENTITY|CHANGE OF CORPORATE|ENTITY CHANGE|CHANGE OF FORM" "TRANSFORMATION" "ARTICLES OF INCORPORATION|CERTIFICATE OF INCORPORATION|CHANGE OF INCORPORATION" "CHANGE OF STATE|CHANGE OF COUNTRY|DOMESTICATION" "CERTIFICATE OF AMENDMENT|ARTICLES OF AMENDMENT" "CHANGE OF CITIZENSHIP|CHANGE STATE OF INCORP"
conv_group == security interest [88,332 (11.22%) rf_ids] 1. Matching one of the following options from PTO-1594 cover sheet (paper or electronic) [70,399
(8.95%) rf_ids] "SECURITY AGREEMENT" "SECURITY INTEREST" "LIEN" "MORTGAGE"
2. Matching one of the following frequently observed strings [7,390 (0.94%) rf_ids] "TRADEMARK SECURITY AGREEMENT" "NOTICE OF GRANT OF SECURITY INTEREST" "NOTICE OF GRANT OF SECURITY INTEREST IN TRADEMARKS" "INTELLECTUAL PROPERTY SECURITY AGREEMENT" "GRANT OF SECURITY INTEREST" "AS SECURITY FOR OBLIGATIONS RECITED ASSIGNOR HEREBY GRANTS A SECURITY INTEREST UNDER SAID MARK SUBJECT TO AGREEMENT RECITED SEE RECORD" "ASSIGNMENT OF SECURITY INTEREST" "GRANT OF TRADEMARK SECURITY INTEREST" "SECOND LIEN TRADEMARK SECURITY AGREEMENT"
3. Matching by the following regular expressions [10,543 (1.34%) rf_ids] "SECURITY" "COLLATERAL" "LIEN" "MORTGAGE" "UCC FINANC" "PLEDGE"

81
conv_group: merger [49,020 (6.23%) rf_ids] 1. Matching the following option from PTO-1594 cover sheet (paper or electronic) [18,908 (2.40%)
rf_ids] "MERGER"
2. Matching one of the following frequently observed strings [20,996 (2.67%) rf_ids]
"MERGER EFFECTIVE" "MERGER EFFECTIVE IN DELAWARE" "MERGER AND CHANGE OF NAME EFFECTIVE IN DELAWARE" "MERGER AND CHANGE OF NAME" "MERGER EFFECTIVE IN NEW YORK" "MERGER EFFECTIVE IN CALIFORNIA" "MERGER AND CHANGE OF NAME EFFECTIVE IN OHIO"
3. Matching by the following regular expressions [9,116 (1.16%) rf_ids]
"MERGER" "AMALGAMATION" "CONSOLIDATION" "REORGANIZATION"
All rf_ids with conveyance indicating merger and name change were designated as merger only.
conv_group: release [36,681 (4.66%) rf_ids] 1. Matching the following option from PTO-1594 cover sheet (paper or electronic) [15,188 (1.93%)
rf_ids] "RELEASE BY SECURED PARTY"
2. Matching one of the following frequently observed strings [11,160 (1.42%) rf_ids]
"RELEASE OF SECURITY INTEREST" "RELEASE" "RELEASE OF SECURITY AGREEMENT" "RELEASE OF SECURITY INTEREST IN TRADEMARKS" "TERMINATION OF SECURITY INTEREST" "TERMINATION AND RELEASE OF SECURITY INTEREST IN TRADEMARKS" "RELEASE OF SECURITY INTEREST RECORDED AT REELFRAME" "RELEASE BY SECURED PARTY OF A SECURITY AGREEMENT RECORDED AT REEL FRAME" "TERMINATION OF SECURITY INTEREST IN TRADEMARKS" "RELEASE AND REASSIGNMENT"
3. Matching by the following regular expressions [10,333 (1.31%) rf_ids] "RELEASE" "TERMINATION|TERMINAT" "DISSOLUTION" "RELEASE"
All rf_ids with conveyance indicating release and assignment or security interest were designated as release only.
conv_group: correction [20,167 (2.56%) rf_ids] 1. Matching the following option from PTO-1594 cover sheet (paper or electronic) [151 (0.02%)
rf_ids] "CORRECTIVE ASSIGNMENT"
2. Matching one of the following frequently observed strings [3,832 (0.49%) rf_ids] "CORRECTIVE ASSIGNMENT TO CORRECT THE NAME OF THE ASSIGNEE FILED ON RECORDED ON REEL FRAME ASSIGNOR HEREBY CONFIRMS THE ASSIGNMENT OF THE ENTIRE INTEREST" "CORRECTIVE ASSIGNMENT TO CORRECT THE ASSIGNEES NAME PREVIOUSLY RECORDED AT REEL FRAME" "DOCUMENT PREVIOUSLY RECORDED AT REEL FRAME CONTAINED AN ERROR IN PROPERTY NUMBER DOCUMENT RERECORDED TO CORRECT ERROR ON STATED REEL"
3. Matching by the following regular expressions [16,184 (2.06%) rf_ids] "CORRECTIVE ASSIGNMENT|TO CORRECT|CORRECTION|CORRECTING|CORRECTIVE DOCUMENT" "DOCUMENT PREVIOUSLY RECORDED" "RERECORD"

82
"TO AMEND|AMENDED AND RESTATED|AMENDING|AMENDMENT TO ASSIGNMENT" "INVALID|ERROR" "DUPLICAT"
All rf_ids with conveyance indicating correction and assignment, name change, security interest, or merger were designated as correction only.
conv_group: other [14,049 (1.79%) rf_ids] 1. Matching one of the following options from PTO-1594 cover sheet (paper or electronic) [1,280
(0.16%) rf_ids] "LICENSE" "OPTION" "DECREE OF DISTRIBUTION" "LETTERS OF TESTAMENTARY" "LETTERS OF ADMINISTRATION" "COURT APPOINTMENT OF TRUSTEE"
2. Matching by the following regular expressions [2,519 (0.32%) rf_ids]
"LICENSE|LICENSING|FRANCHIS" "LETTERS TESTAMENTARY" "TRUSTEE|TRUST" "LETTERS OF ADMINISTRATION" "DECREE OF DISTRIBUTION" "^ESTATE$| ESTATE" "BANKRUPTCY" "COURT ORDER|JUDGMENT" "WILL AND TESTAMENT|^WILL$" "DEATH CERTIFICATE" "^DECLARATION$|^AFFIDAVIT$"
3. No unique conveyance identified [10,250 (1.30%) rf_ids]
conv_group: no conveyance recorded [4,289 (0.55%) rf_ids]