the use of unmanned aircraft systems (uas) for resource ... · •uas imagery can be used to...
TRANSCRIPT
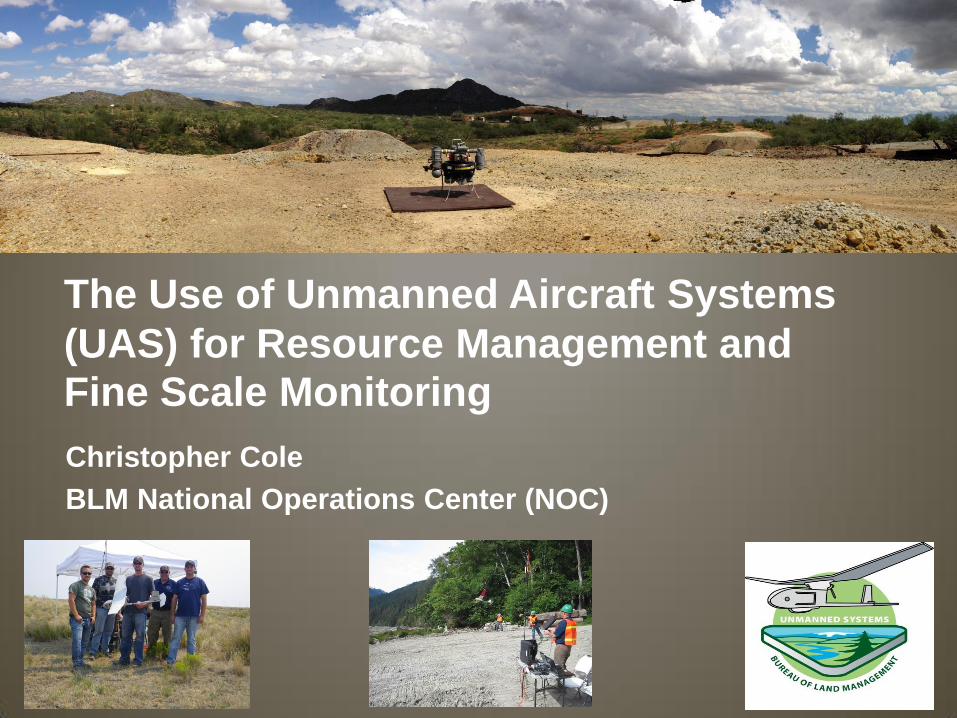
Christopher Cole
BLM National Operations Center (NOC)
The Use of Unmanned Aircraft Systems
(UAS) for Resource Management and
Fine Scale Monitoring
• The BLM is a leader in the use of emerging Unmanned
Aircraft System (UAS) technologies for managing
natural and cultural resources on public lands
• The BLM is producing fine scale, high quality geospatial
products for multiple study sites using UAS
• We are actively pursuing the use of UAS to derive select
AIM core terrestrial indicators (i.e., cover type and
percentage cover)
• UAS-derived indicators supplement and enhance
existing sample collection efforts, and can help
facilitate effective resource management
2
Introduction
• Provide an overview of UAS technologies, and their
relevance for resource management
• Describe some of the geospatial products which can be
derived using UAS
• Highlight selected resource management applications
and completed projects
• Discuss a photogrammetric point cloud classification
study which has relevance for fine scale monitoring
using UAS
3
Presentation Objectives
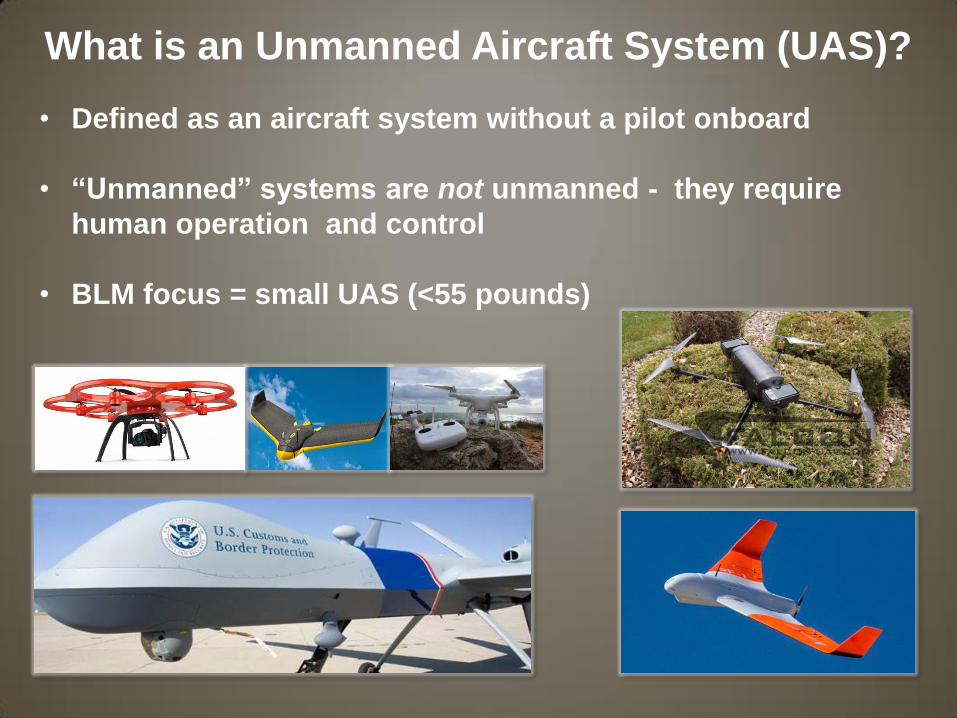
• Defined as an aircraft system without a pilot onboard
• “Unmanned” systems are not unmanned - they require
human operation and control
• BLM focus = small UAS (<55 pounds)
What is an Unmanned Aircraft System (UAS)?
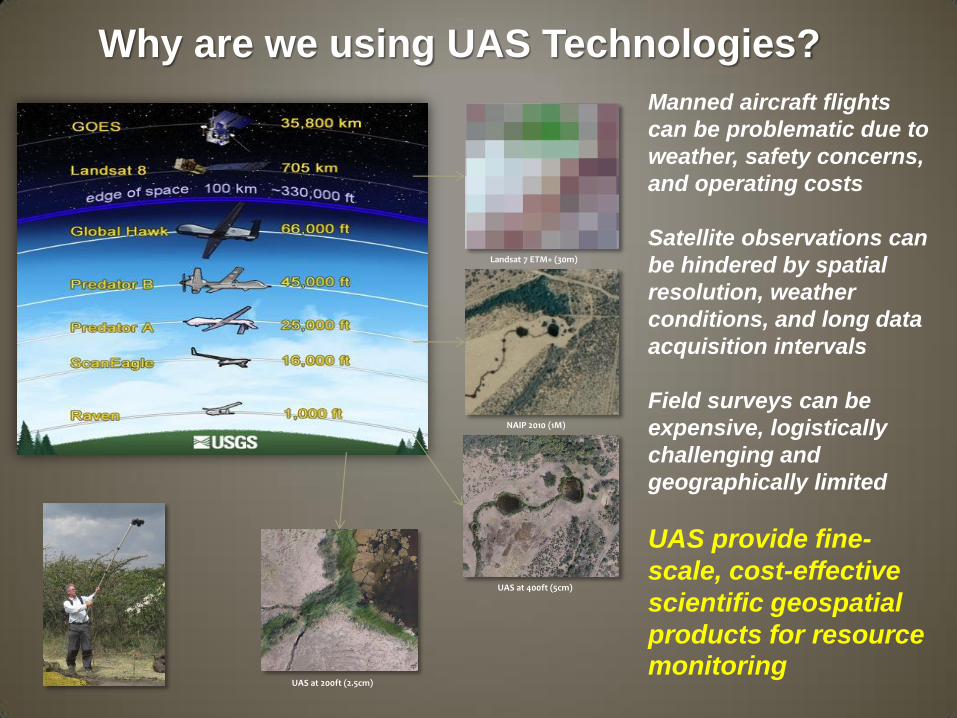
Manned aircraft flights
can be problematic due to
weather, safety concerns,
and operating costs
Satellite observations can
be hindered by spatial
resolution, weather
conditions, and long data
acquisition intervals
Field surveys can be
expensive, logistically
challenging and
geographically limited
UAS provide fine-
scale, cost-effective
scientific geospatial
products for resource monitoring
Why are we using UAS Technologies?
Landsat 7 ETM+ (30m)
NAIP 2010 (1M)
UAS at 400ft (5cm)
UAS at 200ft (2.5cm)
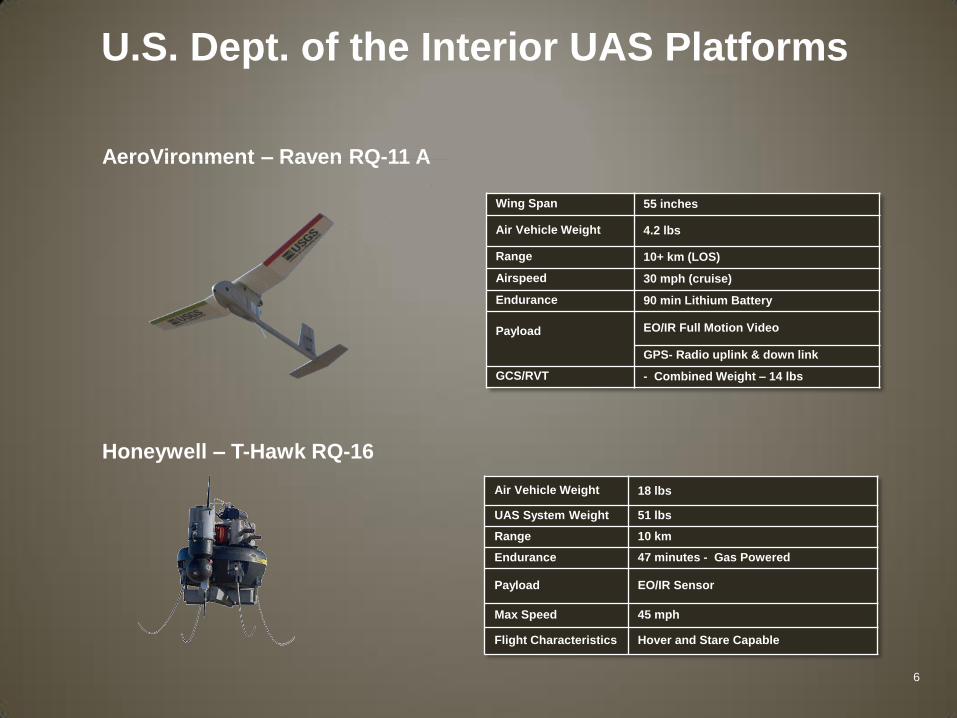
U.S. Dept. of the Interior UAS Platforms
AeroVironment – Raven RQ-11 A
Wing Span 55 inches
Air Vehicle Weight 4.2 lbs
Range 10+ km (LOS)
Airspeed 30 mph (cruise)
Endurance 90 min Lithium Battery
Payload
EO/IR Full Motion Video
GPS- Radio uplink & down link
GCS/RVT - Combined Weight – 14 lbs
Air Vehicle Weight 18 lbs
UAS System Weight 51 lbs
Range 10 km
Endurance 47 minutes - Gas Powered
Payload EO/IR Sensor
Max Speed 45 mph
Flight Characteristics Hover and Stare Capable
Honeywell – T-Hawk RQ-16
6
7
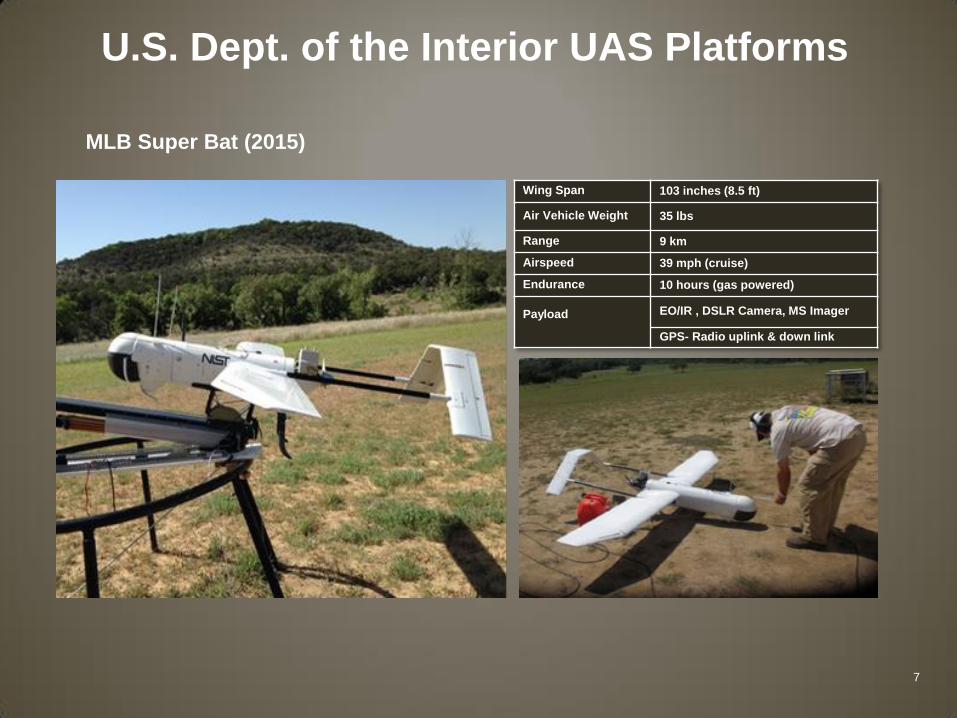
MLB Super Bat (2015)
U.S. Dept. of the Interior UAS Platforms
Wing Span 103 inches (8.5 ft)
Air Vehicle Weight 35 lbs
Range 9 km
Airspeed 39 mph (cruise)
Endurance 10 hours (gas powered)
Payload
EO/IR , DSLR Camera, MS Imager
GPS- Radio uplink & down link
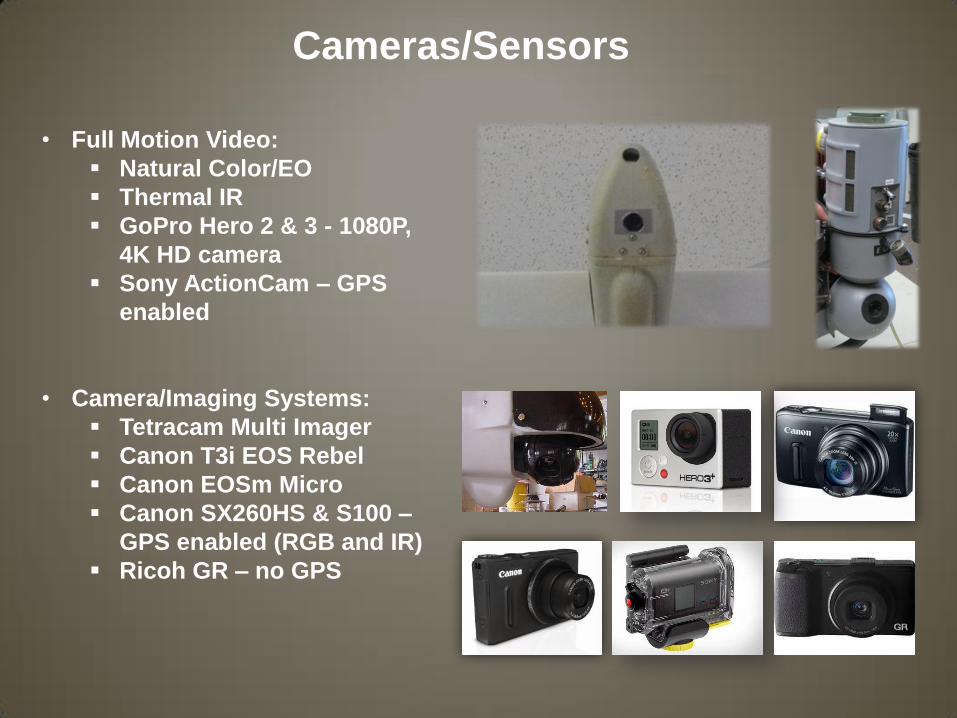
Cameras/Sensors
• Full Motion Video:
Natural Color/EO
Thermal IR
GoPro Hero 2 & 3 - 1080P,
4K HD camera
Sony ActionCam – GPS
enabled
• Camera/Imaging Systems:
Tetracam Multi Imager
Canon T3i EOS Rebel
Canon EOSm Micro
Canon SX260HS & S100 –
GPS enabled (RGB and IR)
Ricoh GR – no GPS
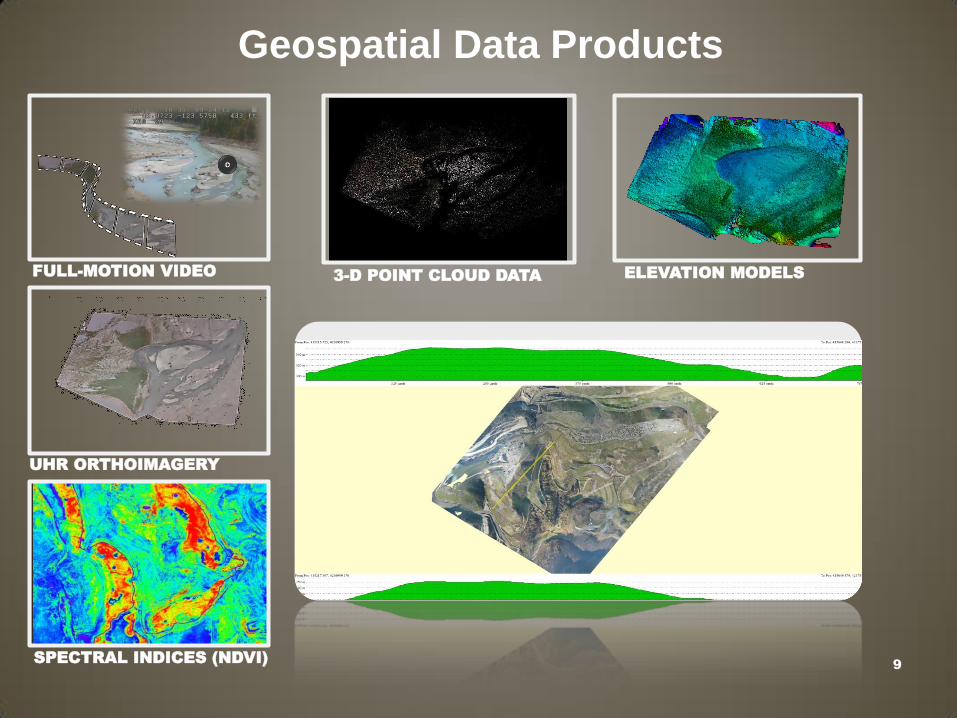
UHR ORTHOIMAGERY
3-D POINT CLOUD DATA ELEVATION MODELS FULL-MOTION VIDEO
SPECTRAL INDICES (NDVI)
Geospatial Data Products
9
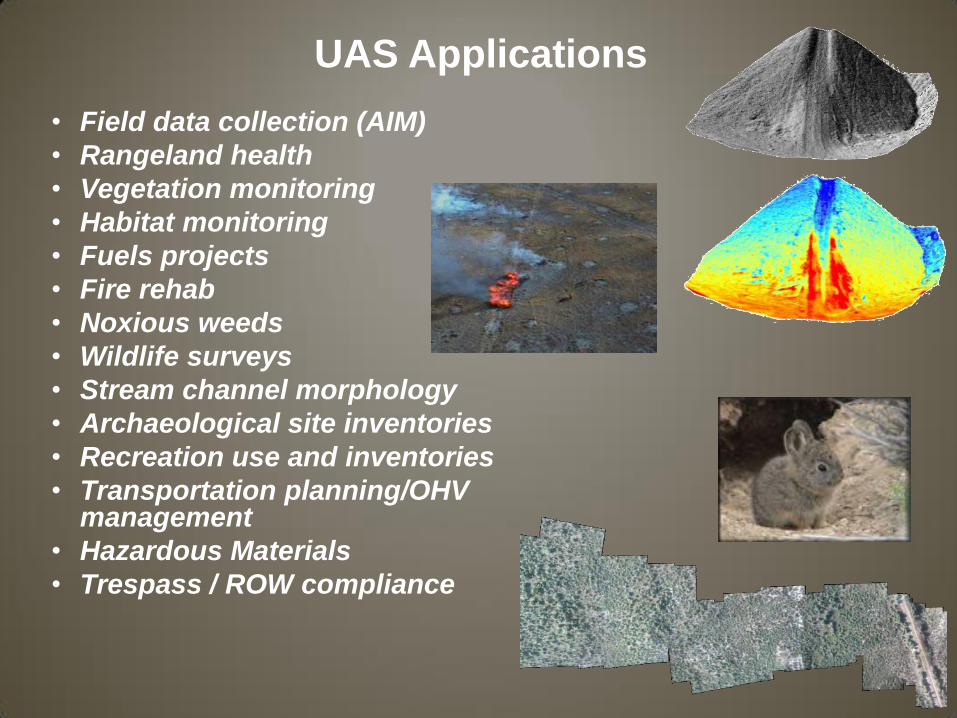
• Field data collection (AIM)
• Rangeland health
• Vegetation monitoring
• Habitat monitoring
• Fuels projects
• Fire rehab
• Noxious weeds
• Wildlife surveys
• Stream channel morphology
• Archaeological site inventories
• Recreation use and inventories
• Transportation planning/OHV management
• Hazardous Materials
• Trespass / ROW compliance
UAS Applications
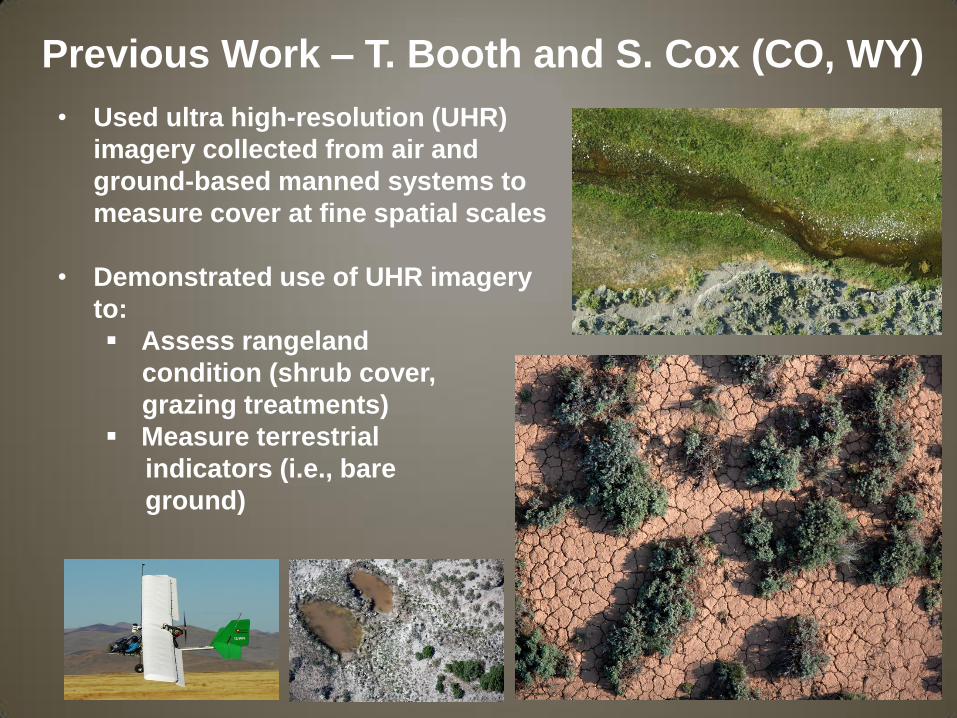
• Used ultra high-resolution (UHR)
imagery collected from air and
ground-based manned systems to
measure cover at fine spatial scales
• Demonstrated use of UHR imagery
to:
Assess rangeland
condition (shrub cover,
grazing treatments)
Measure terrestrial
indicators (i.e., bare
ground)
11
Previous Work – T. Booth and S. Cox (CO, WY)
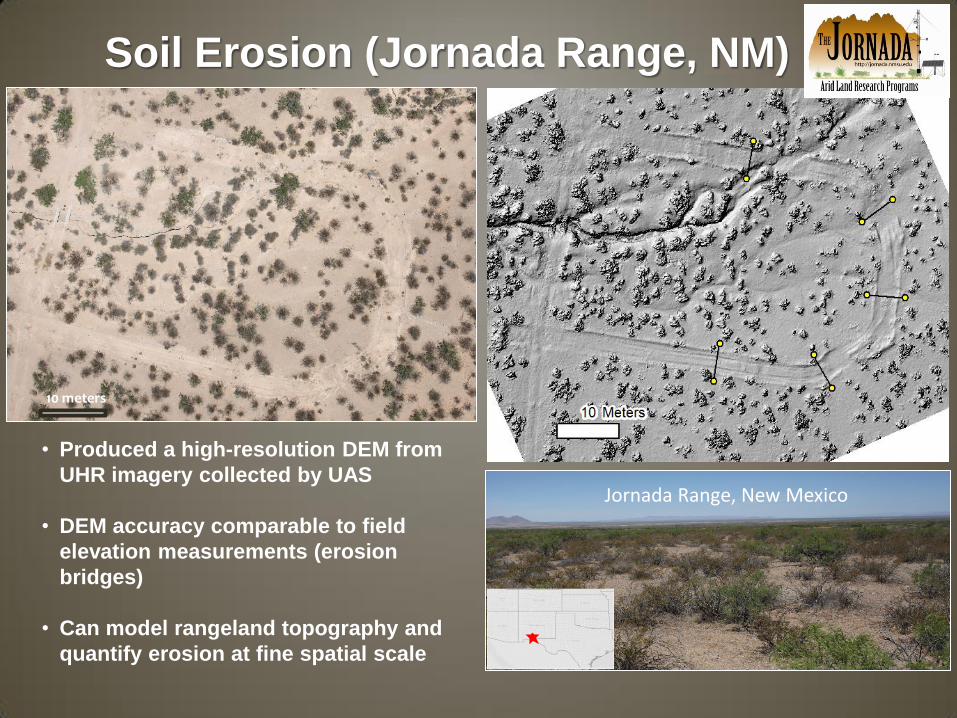
• Produced a high-resolution DEM from
UHR imagery collected by UAS
• DEM accuracy comparable to field
elevation measurements (erosion
bridges)
• Can model rangeland topography and
quantify erosion at fine spatial scale
10 meters
Soil Erosion (Jornada Range, NM)
Jornada Range, New Mexico
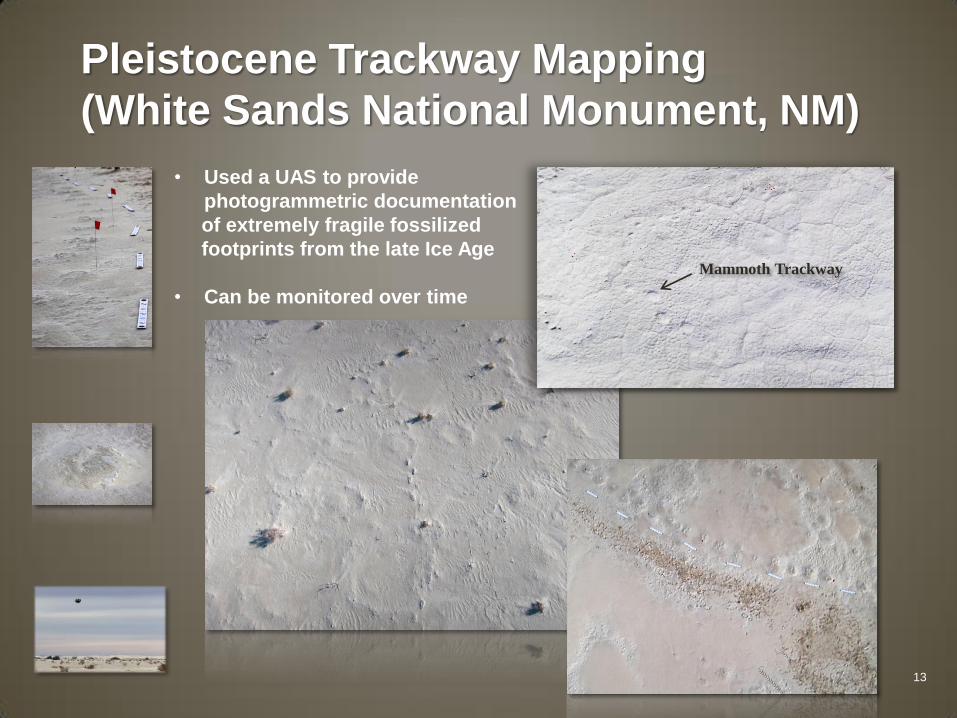
Mammoth Trackway
• Used a UAS to provide
photogrammetric documentation
of extremely fragile fossilized
footprints from the late Ice Age
• Can be monitored over time
Pleistocene Trackway Mapping
(White Sands National Monument, NM)
13
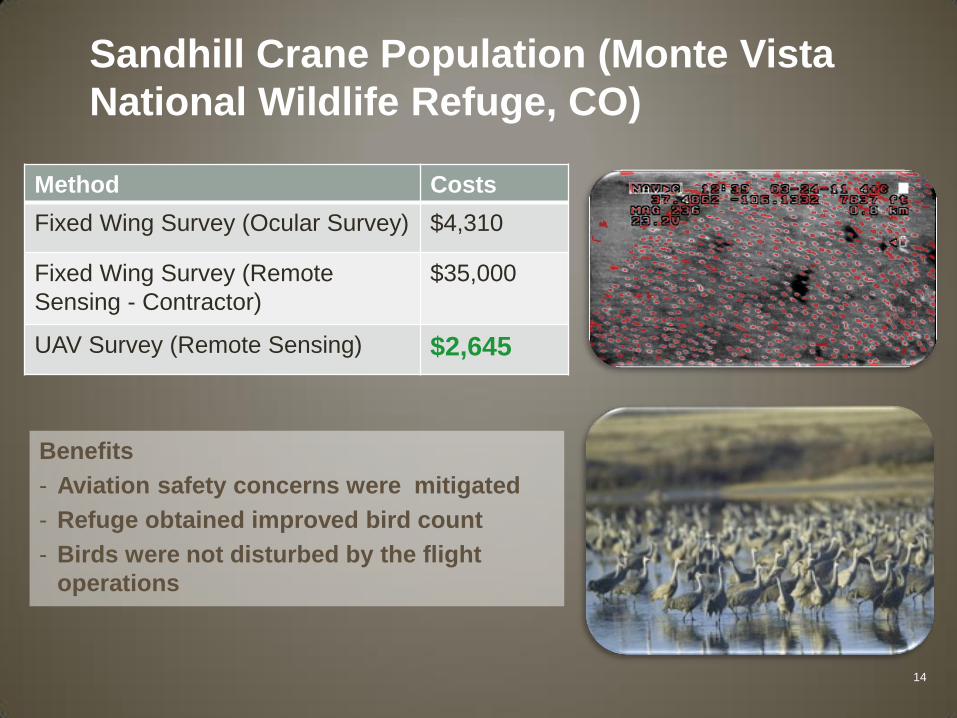
Benefits
- Aviation safety concerns were mitigated
- Refuge obtained improved bird count
- Birds were not disturbed by the flight
operations
Sandhill Crane Population (Monte Vista
National Wildlife Refuge, CO)
Method Costs
Fixed Wing Survey (Ocular Survey) $4,310
Fixed Wing Survey (Remote
Sensing - Contractor)
$35,000
UAV Survey (Remote Sensing) $2,645
14
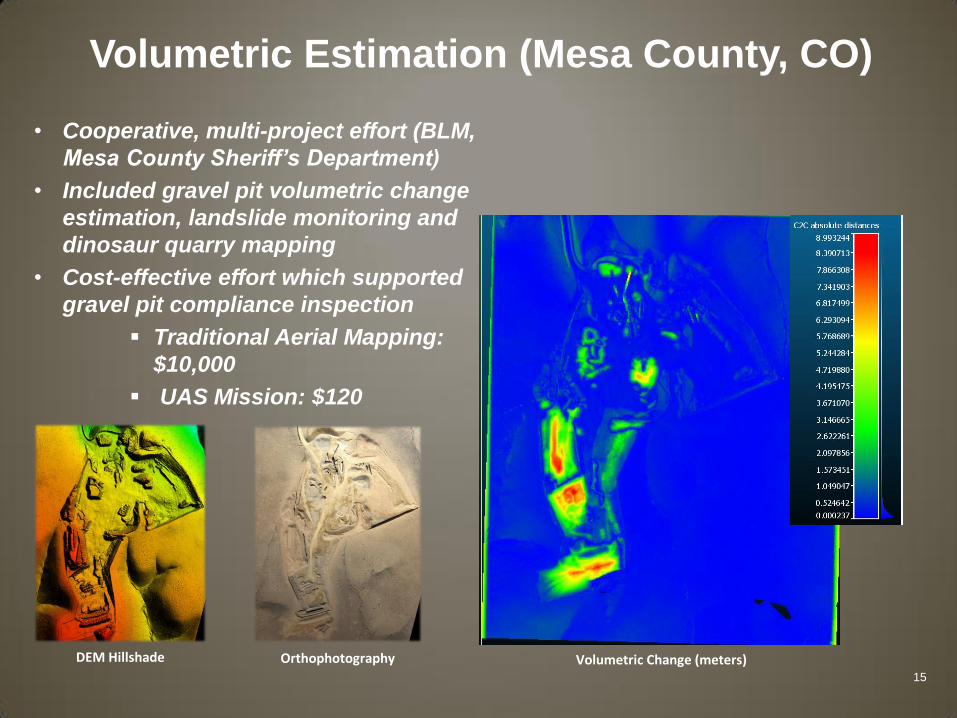
• Cooperative, multi-project effort (BLM,
Mesa County Sheriff’s Department)
• Included gravel pit volumetric change
estimation, landslide monitoring and
dinosaur quarry mapping
• Cost-effective effort which supported
gravel pit compliance inspection
Traditional Aerial Mapping:
$10,000
UAS Mission: $120
DEM Hillshade Orthophotography Volumetric Change (meters)
Volumetric Estimation (Mesa County, CO)
15
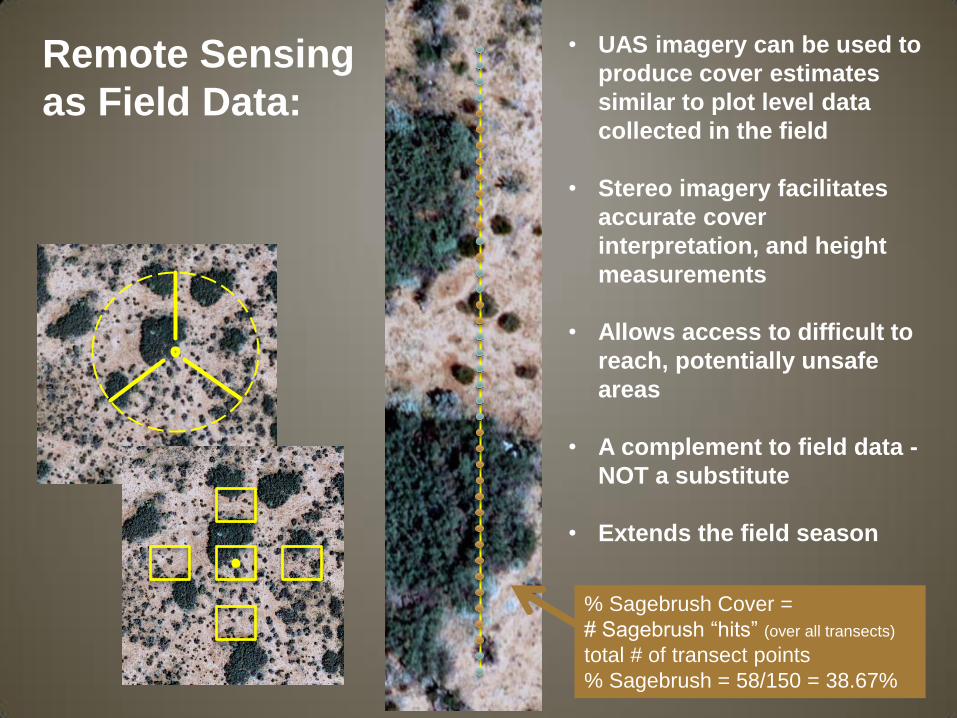
• UAS imagery can be used to
produce cover estimates
similar to plot level data
collected in the field
• Stereo imagery facilitates
accurate cover
interpretation, and height
measurements
• Allows access to difficult to
reach, potentially unsafe
areas
• A complement to field data -
NOT a substitute
• Extends the field season
% Sagebrush Cover =
# Sagebrush “hits” (over all transects)
total # of transect points
% Sagebrush = 58/150 = 38.67%
Remote Sensing
as Field Data:
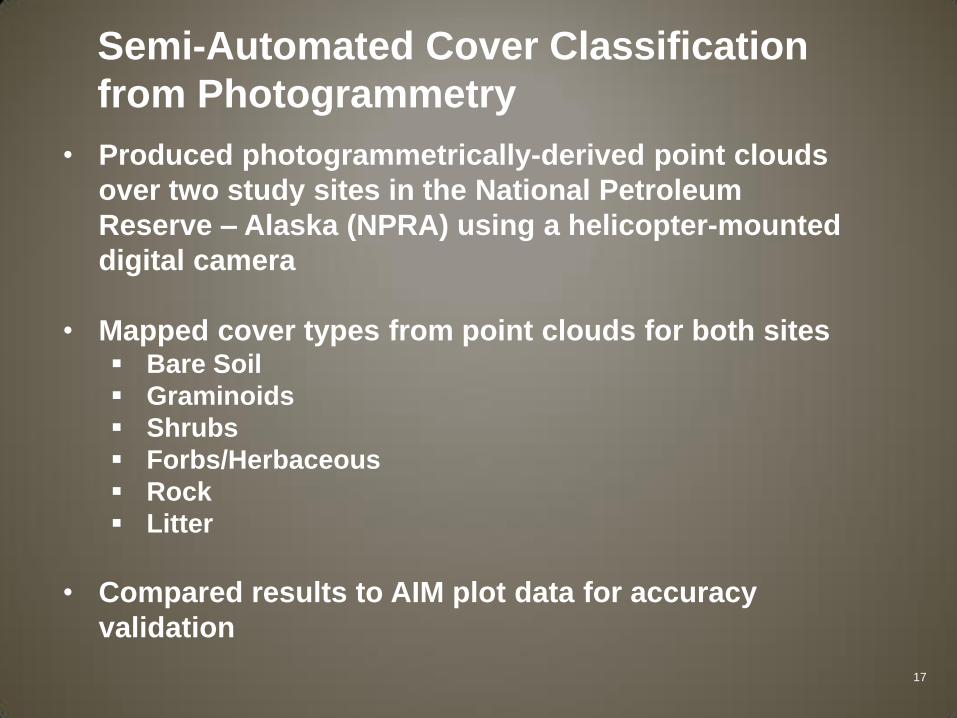
• Produced photogrammetrically-derived point clouds
over two study sites in the National Petroleum
Reserve – Alaska (NPRA) using a helicopter-mounted
digital camera
• Mapped cover types from point clouds for both sites Bare Soil
Graminoids
Shrubs
Forbs/Herbaceous
Rock
Litter
• Compared results to AIM plot data for accuracy
validation
17
Semi-Automated Cover Classification
from Photogrammetry
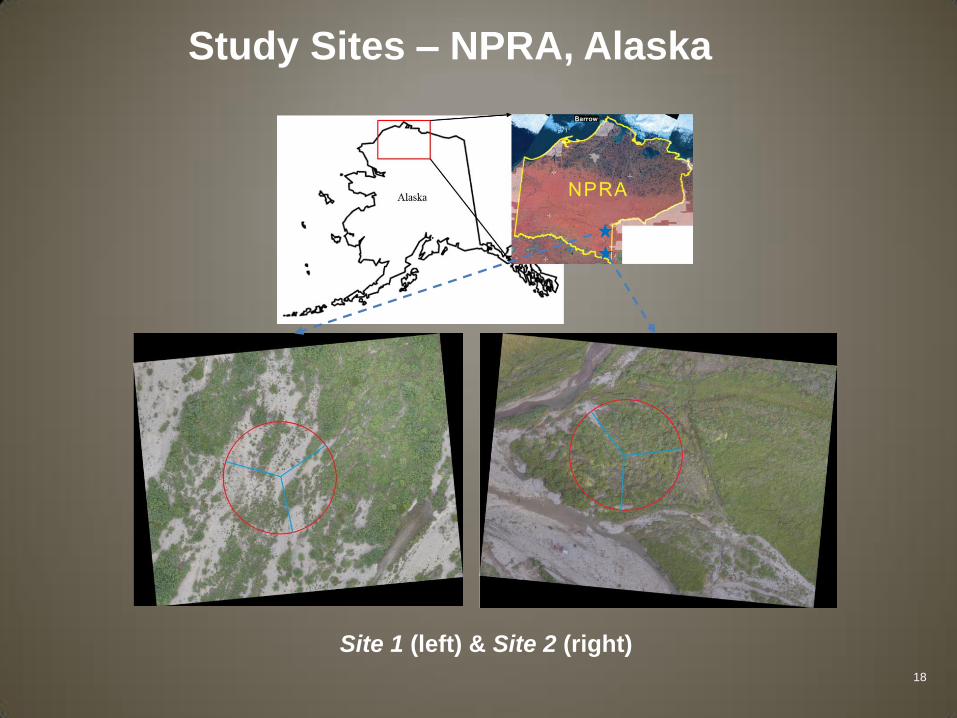
Site 1 (left) & Site 2 (right)
Study Sites – NPRA, Alaska
18
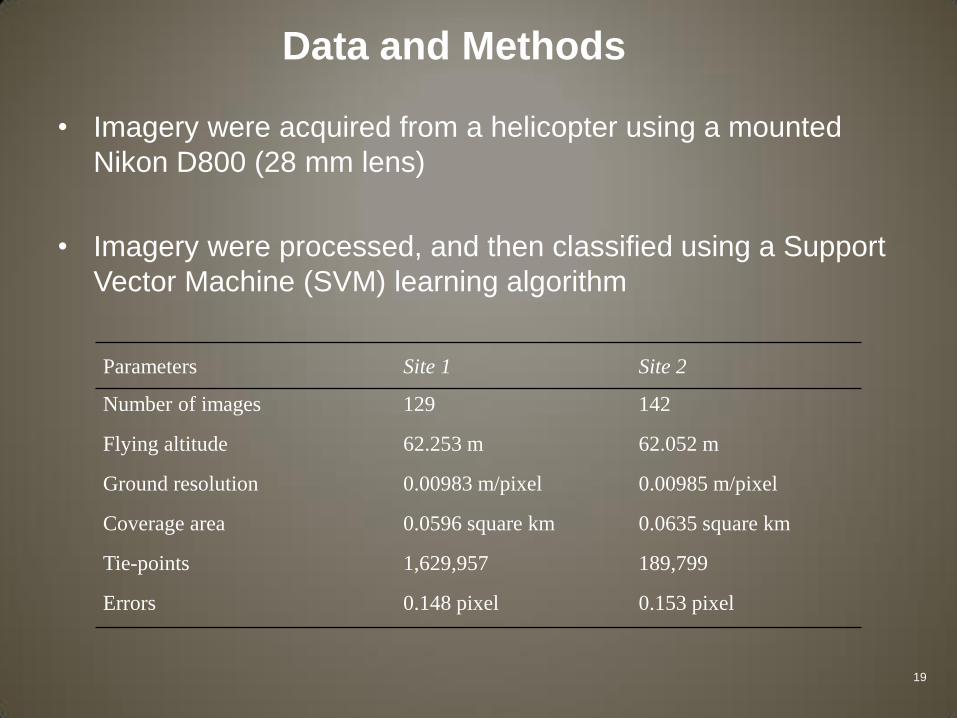
Parameters Site 1 Site 2
Number of images 129 142
Flying altitude 62.253 m 62.052 m
Ground resolution 0.00983 m/pixel 0.00985 m/pixel
Coverage area 0.0596 square km 0.0635 square km
Tie-points 1,629,957 189,799
Errors 0.148 pixel 0.153 pixel
• Imagery were acquired from a helicopter using a mounted
Nikon D800 (28 mm lens)
• Imagery were processed, and then classified using a Support
Vector Machine (SVM) learning algorithm
Data and Methods
19
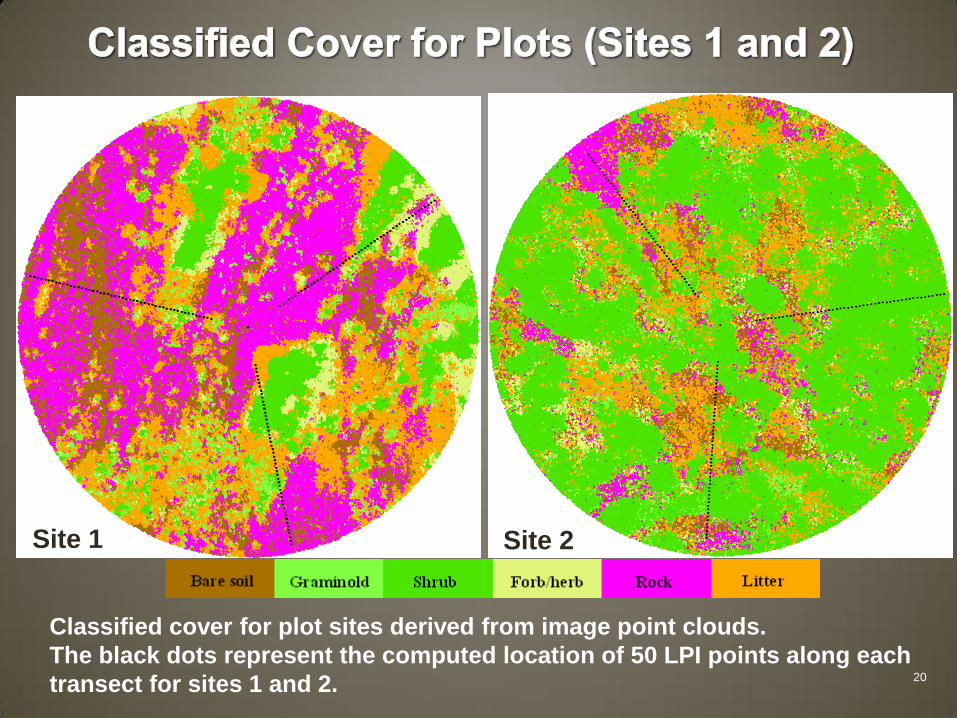
Classified cover for plot sites derived from image point clouds.
The black dots represent the computed location of 50 LPI points along each
transect for sites 1 and 2.
Site 1 Site 2
20
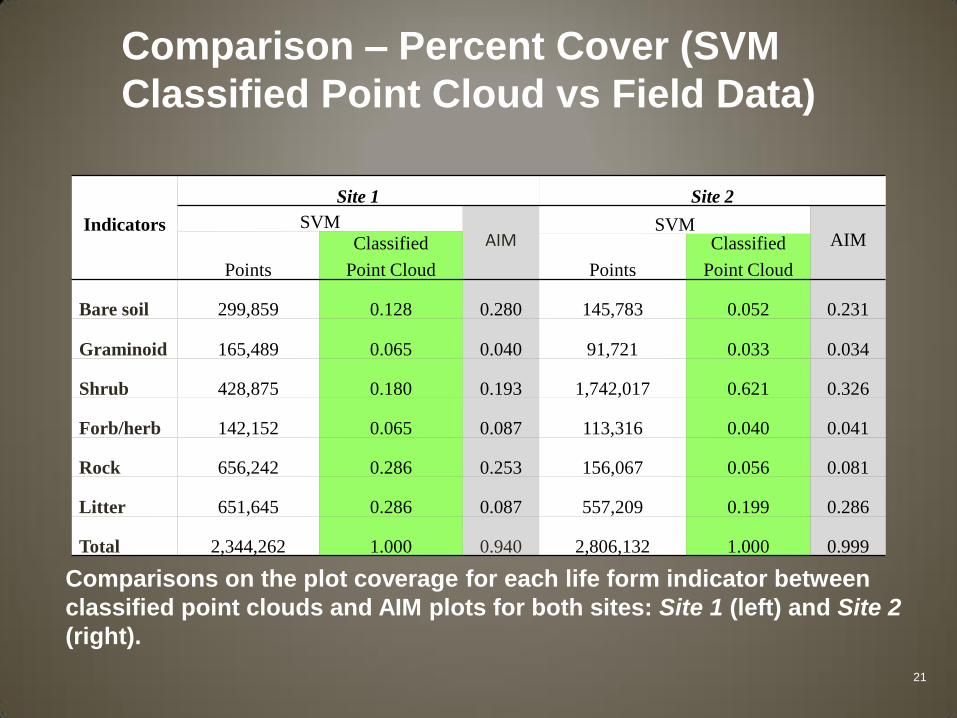
Indicators
Site 1 Site 2
SVM AIM
SVM AIM
Points
Classified
Point Cloud Points
Classified
Point Cloud
Bare soil 299,859 0.128 0.280 145,783 0.052 0.231
Graminoid 165,489 0.065 0.040 91,721 0.033 0.034
Shrub 428,875 0.180 0.193 1,742,017 0.621 0.326
Forb/herb 142,152 0.065 0.087 113,316 0.040 0.041
Rock 656,242 0.286 0.253 156,067 0.056 0.081
Litter 651,645 0.286 0.087 557,209 0.199 0.286
Total 2,344,262 1.000 0.940 2,806,132 1.000 0.999
Comparison – Percent Cover (SVM
Classified Point Cloud vs Field Data)
Comparisons on the plot coverage for each life form indicator between
classified point clouds and AIM plots for both sites: Site 1 (left) and Site 2
(right).
21
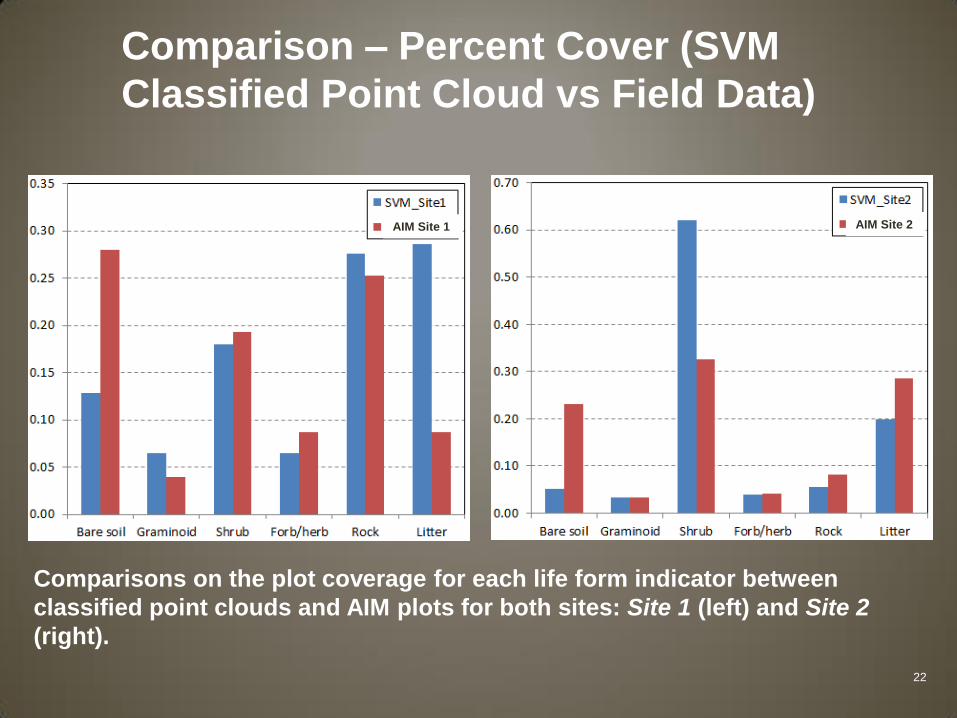
Comparisons on the plot coverage for each life form indicator between
classified point clouds and AIM plots for both sites: Site 1 (left) and Site 2
(right).
Comparison – Percent Cover (SVM
Classified Point Cloud vs Field Data)
AIM Site 1 AIM Site 2
22
• UAS technologies are being used by the BLM for
many resource management applications
• UAS-based indicator products supplement, not
replace, existing field techniques
• Results and methods described in the
photogrammetric point cloud classification study
could be obtained using UAS technologies
23
Conclusions
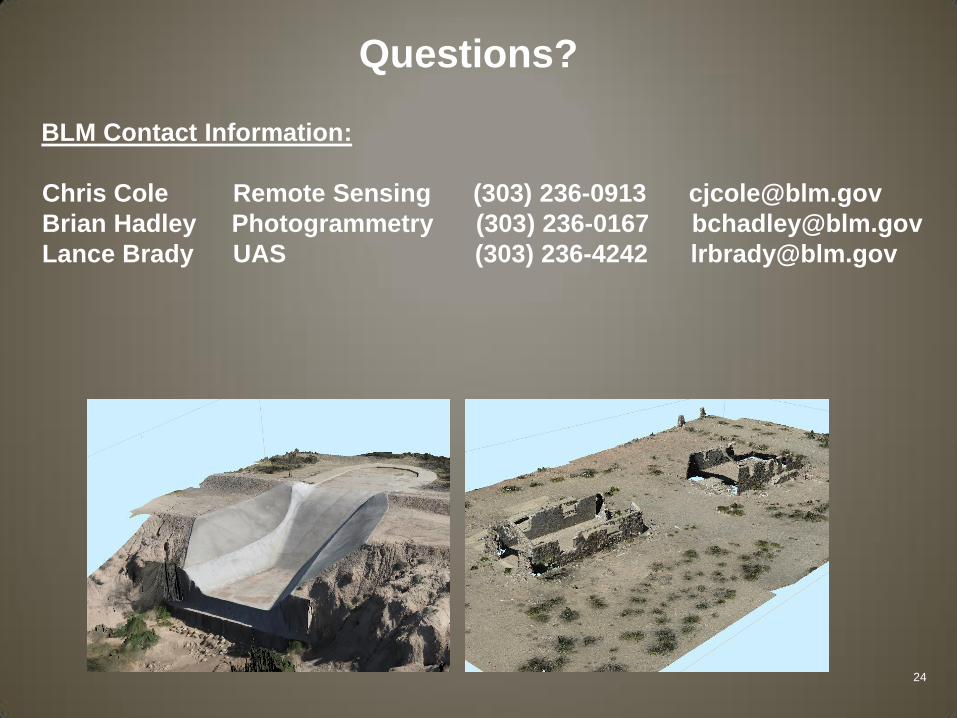
Questions?
BLM Contact Information:
Chris Cole Remote Sensing (303) 236-0913 [email protected]
Brian Hadley Photogrammetry (303) 236-0167 [email protected]
Lance Brady UAS (303) 236-4242 [email protected]
24