the use of thermal infra-red imaging to reveal muscle ... · muscle injuries caused by physically...
TRANSCRIPT

Faculdade de Engenharia da Universidade do Porto
The Use of Thermal Infra-red Imaging to Reveal Muscle Injuries Caused by Physically Demanding
Jobs in Industrial Operations
Selma Renata Almeida Pinho
Dissertação realizada no âmbito do
Mestrado de Engenharia Biomédica
Orientador: Prof. Doutor Paulo José Cerqueira Gomes da Costa
Setembro de 2016

© Selma Pinho, 2016

iii

iv

v
Resumo
As Lesões Musculosqueléticas (LME) podem afetar diversas partes do corpo e quando surgem
através da atividade profissional são designadas por Lesões musculosqueléticas relacionadas
com o trabalho (LMERT). Pretende-se avaliar a possibilidade de usar a termografia como uma
ferramenta de diagnóstico preliminar na deteção e monitorização de trauma e ocorrência de
lesões.
O aparelho utilizado foi uma camara térmica, em que consegue detetar o calor produzido
pelo corpo humano. A partir desta camara adquiriu-se várias imagens térmicas. As imagens
foram processadas em software Matlab, com recurso a operações de binarização e de
morfologia. Todas as implementações foram realizadas em MATLAB com 26 casos reais de
imagens térmicas com lesões musculosqueléticas variáveis e 26 casos reais de imagens térmicas
sem qualquer tipo de lesão.
Foi realizada uma análise entre os diagnósticos obtidos pelo enfermeiro, pelo programa
desenvolvido em Matlab, e pelo enfermeiro observando as imagens térmicas não processadas.
Verificou-se concordância dos diagnósticos entre o programa desenvolvido em Matlab e o
diagnóstico do enfermeiro olhando para as imagens térmicas não processadas.
Os resultados obtidos são gratificantes e demonstram o potencial da termografia como
ferramenta de apoio ao diagnóstico do enfermeiro.
Palavras-chave: Termografia infravermelha, lesões musculosqueléticas relacionadas com o
trabalho, operações industriais, imagens térmicas, processamento de imagem.

vi

vii
Abstract
The musculoskeletal injuries (MSIs) can affect various parts of the body and when they arise
through professional activity are called work-related musculoskeletal disorders (WMSDs). It is
intended to assess the possibility of using thermography as a primary diagnostic tool in
detecting and monitoring the occurrence of trauma and lesions.
The device used was a thermal camera, which can detect the heat produced by the human
body. From this chamber was acquired several thermal images. The images were processed
using Matlab software, using binarization and morphological operations. All implementations
were done in MATLAB with 26 actual cases of thermal images with musculoskeletal injuries
variables and 26 real cases of thermal images without any injury.
An analysis of the diagnoses obtained by the nurse was done, the program developed in
Matlab, and the nurse watching the unprocessed thermal images. There was agreement
between the diagnostic program developed in Matlab and the nurse's diagnosis looking for
unprocessed thermal images.
The results are gratifying and demonstrate the potential of thermography as a support tool
for the diagnosis of nurses.
Keywords: Infrared thermography, work-related musculoskeletal disorders, industrial
operations, thermal imaging, image processing.

viii

vii
Index
1. Introduction ........................................................................... 1
1.1 - Problem Description ........................................................................ 1
1.2 - Framework .................................................................................... 1
1.3 - Goals ........................................................................................... 3
1.4 - Work Organization ........................................................................... 3
2. State of the Art ....................................................................... 5
2.1 - Ergonomics .................................................................................... 5
2.2 - Musculoskeletal Injuries .................................................................... 7
2.2.1 – Work-Related Musculoskeletal Disorders ................................................ 8 2.2.2 – Incidence of work-related musculoskeletal disorders at a world level ............ 9 2.2.3 – Main Types of Work-Related Musculoskeletal Disorders ............................ 10 2.2.4 – Risk Factors ................................................................................. 13
2.3 - Thermography .............................................................................. 15
2.4 - Types of Thermography .................................................................. 18
2.4.1 – Liquid Crystal Thermography ............................................................ 18 2.4.2 – Microwave Thermography ................................................................ 18 2.4.3 - Infrared Thermography ................................................................... 20
2.5 - Thermography and Work-Related Musculoskeletal Disorders ...................... 28
2.5.1 – Thermography as a Diagnostic Tool .................................................... 28 2.5.2 – Thermography as an Evaluation Tool of Exposure to Risk Factors for Development
of Work‐Related Musculoskeletal Disorders............................................. 29
2.6 - Conclusions ................................................................................. 36
3. Processing and Image Analysis .................................................... 37
3.1 - Morphological Operations ................................................................ 37
3.1.1 – Function bwmorph ........................................................................ 38 3.1.2 – Edge Detection using Function Edge ................................................... 40 3.1.3 – Function Regionprops ..................................................................... 45
3.2 - Conclusions ................................................................................. 47
4. Methodological Procedures ....................................................... 49
4.1 - Operational Definition of Variables .................................................... 49
4.2 - Materials and Methods .................................................................... 49
4.2.1 – Population and Sample .......................................................................... 50 4.2.2 – Methods for Collection of Data ................................................................ 50

viii
4.2.3 – Environmental Preparation Protocol and Patient .......................................... 51 4.2.4 – Materials Used .................................................................................... 51 4.2.5 – Acquisition and Processing of Thermal Images ............................................. 54 4.2.6 – Software Features ............................................................................... 55
5. Results ................................................................................ 57
5.1 - Patient Diagnosis .......................................................................... 57
5.2 - Human Intervention ....................................................................... 64
5.2.1 – Images Unprocessed ............................................................................. 64
5.3 - Automatic Processing ..................................................................... 74
5.3.1 – Experimental Group ............................................................................. 75 5.3.2 – Control Group ..................................................................................... 82
5.4 - Statistical Analysis ........................................................................ 84
5.5 - Conclusions ................................................................................. 85
5.6 - Discussion of Results ...................................................................... 85
6. Conclusions ........................................................................... 88
6.1 - Proposal for Future Research ............................................................ 89
References .................................................................................. 95

ix

x
List of Figures
Figure 2.1 - Factors contributing to the success of an ergonomics program [19]. ................ 6
Figure 2.2 - Proportion of occupational diseases in Europe workers in 2005 [31]. ................ 9
Figure 2.3 - Percentage share of workers reporting health problems [31]. ...................... 10
Figure 2.4 - Pressured at carpal ligament [35]. ....................................................... 12
Figure 2.5 – Muscle Injury [46]. ........................................................................... 13
Figure 2.6 - Risk factors for MSIs [31]. .................................................................. 14
Figure 2.7 - Body temperature in: a) a cold environment; b) in the warm [55]. ................ 16
Figure 2.8 - IR image of healthy knee: a) anterior aspect; b) posterior aspect [61]. .......... 17
Figure 2.9 - Prototype clinical MWT equipment [69]. ................................................ 19
Figure 2.10 - Medical imaging techniques within the electromagnetic spectrum [61]. ........ 20
Figure 2.11 - The thermal detector in an IR camera converts photon energy from a target
surface into a thermal image that can be displayed on a computer monitor. Each colour hue on
the thermal image corresponds to a certain temperature interval [70]. .......................... 21
Figure 2.12 - Temperature scales of thermograms: a) colour scale; b) colour scale strong-
contrast; c) grey tones [71]. ............................................................................... 22
Figure 2.13 - Thermal Transfer Processes [74]. ....................................................... 22
Figure 2.14 - IRT images showing examples of varicose and superficial veins [76]. ............ 23
Figure 2.15 - Comparison of the pre-training and 24h post-training thermal image. (1) Subject
of the control group, pre-training; (2) subject of the control group, 24h post-training; (3)
subject of the experimental group, pre-training; and (4) subject of the experience. .......... 24
Figure 2.16 - Representation of the classification of IRT-related factors in humans [76]. .... 25
Figure 2.17 - IR and adjacent spectral regions and expanded view of the so-called thermal IR.
This is the region where IR imaging systems for shortwave (SW), midwave (MW), or long-wave
(LW) cameras exist. Special systems have extended MW or SW ranges [82]. ..................... 26
Figure 2.18 – Planck Curve [86]. ......................................................................... 27
Figure 2.19 – Procedure for the production of a thermal image: a) Object; b) IR Camera Flir;
c) Thermal image [90,91]. ................................................................................. 28
Figure 2.20 - Tsk measurements by IRT during running exercise [106]. .......................... 32
Figure 2.21 - IRT of right and left knees: a) before; b) after race for the participant with right
knee OA [75]. ................................................................................................. 33
Figure 2.22 - Medial aspect of the left leg in the control (above) and experimental (below)
groups, before (left) and after (right) whole body vibration [107]. ................................ 34
Figure 2.23 - The image is represented 2 and 3 a guy after fiddling with the shoulder at rest
and images 4 and 5 without shoulder be at rest [108]. ............................................... 35
Figure 2.24 - The effects of stress on hand thermogram (A) 10 min full recovery from the
normal 1 min immersion in water at 20 ◦C; (B) in a patient with Raynaud's phenomenon after
10 min. (C); (D) Examples of hand arm vibration injury to certain fingers, showing d ......... 35
Figure 2.25 - The Vibration Provocation Test (VPT) diagram [110]. ............................... 36

xi
Figure 3.1 - Noisy fingerprint image. Opening followed by closing [112]. ........................ 39
Figure 3.2 – Fingerprint image from Fig. 9.11 thinned once. (b) Image thinned twice. (c) Image
thinned until stability [112]. ............................................................................... 39
Figure 4.1 – Camera Sony [117]. .......................................................................... 52
Figure 4.2 – Hygrometer and tape measure [118]. .................................................... 52
Figure 4.3 – Thermal Camera Gobi-384 Industrial (Xenics) [119]. .................................. 53
Figure 4.4 – Thermal Camera Fluke Ti25 [120]. ....................................................... 53
Figure 5.1 - Main complaints in 2015 at Continental Mabor [121]. ................................. 58
Figure 5.2- Processed images the experimental group. .............................................. 82
Figure 5.3 - Processed images the control group. ..................................................... 84
xii
List of Tables
Table 2.1- Different classifications adopted in different countries [4]. ............................ 8
Table 2.2 – WMSDs grouped by affected anatomical areas [2, 4]. .................................. 11
Table 2.3 - WMSDs grouped by type of pathology [2, 4]. ............................................ 11
Table 2.4 - Risk factors for the occurrence of MSIs [3]. .............................................. 14
Table 2.5 - Some studies that was used as thermography as a diagnostic tool [94-96]. ....... 29
Table 2.6 - Some studies in which the thermography was used as an evaluation tool of exposure
to risk factors for development of MSIs [98-101]....................................................... 30
Table 3.1 – Operations supported by function bwmorph [110]...................................... 38
Table 3.2 – Edge detectors available in function edge [110]. ....................................... 42
Table 3.3 – Regional descriptors computed by function regionprops [110]. ...................... 46
Table 4.1 – Characteristics of thermal camera Gobi-384 Industrial (Xenics) [117]. ............. 53
Table 4.2 – Characteristics of thermal camera Fluke Ti25 [118]. .................................. 54
Table 4.3 - Characteristics of the 52 tested images. ................................................. 55
Table 5.1 – Patient Diagnosis. ............................................................................. 58
Table 5.2 – Imagens unprocessed with injury and uninjured. ....................................... 64
Table 5.3 Results of Diagnosis. ........................................................................... 84
Table 5.4 – Test Statistics McNemar. .................................................................... 85

xiii

xiv
Abbreviations, Acronyms and Symbols
List of abbreviations and acronyms
CTD Cumulative Trauma Disorder
CTS Carpal Tunnel Syndrome
DGS Directorate General of Health
ESWC European Survey on working Conditions
EU European Union
EU-OSHA European Agency for Safety and Health at work
EWA Ergonomic Workplace Analysis
FDI First Dorsal Interosseous
FPA Focal Plane Arrays
HRM Highly Repetitive Movements
IACT International Academy of Clinical Thermology
IEA International Ergonomics Association
IPT Image Processing Toolbox
IR Infrared
IRT Infrared Thermography
LART Lesion Atribuable aus Trauvaux Répétitifes
LCT Liquid Crystal Thermography
LoG Laplacian of a Gaussian
LW Long-Wave
MDT Mean Dorsal Skin Temperature
MSIs Musculoskeletal Injuries
MW Midwave
MWT Microwave Thermography
OA Osteoarthritis
OOS Occupational Overuse Syndrome
QNM Nordic Questionnaire Musculoskeletal
RBV Relative Blood Volume
RSI Repetitive Strain Injuries
SW Shortwave
TMS Troubles Musculosquelettiques
Tsk Skin Temperature
UEMSD Upper Extremity Musculoskeletal Disorder
UL Upper Limbs
US United States

xv
USA United States of America
VPT Vibration Provocation Test
WMSDs Work-Related Musculoskeletal Disorders
List of symbols
ε Emissivity
σ Stephan-Boltzmann constant
T Cutaneous Absolute Temperature
K Boltzmann Constant
h Planck Constant
c Speed of Light
B Spectral Radiance
W Radiant Energy Flux Emitted
f Imput image
g Image logic


1
Chapter 1
1. Introduction
1.1 - Problem Description
Currently, skeletal muscle injuries are a major public health problem that affect millions
of workers all over the world. These lesions are of great concern because they affect workers
health and increase business and social costs. In the present study we give attention to
musculoskeletal injuries (MSIs), studding them in enterprise environment because theses is the
ambience where workers are constantly subjected to very demanding efforts, hence, resulting,
very often, in pathologies such as lumbago, shoulder pain, neck pain, knee pain and many
others. Diagnosing these diseases is not always an easy task, and even harder is to identify the
exact point of the lesion without the help of technological equipment. In order to help health
professionals to overcome these difficulties is, many times, used Infrared thermography (IRT),
a technology that helps minimize absenteeism and increase the success rates of lesion
treatments.
1.2 - Framework
Muscle injuries are very common in athletes, labourers, individuals that perform repetitive
movements or in physically active persons, and they are characterized as a type of MSIs. These
lesions have to be treated, and the treatment depends on the diagnosis and monitoring the
state of the lesion.
Muscle damage is now very common and usually happens because the muscle was stretched
beyond its limits, or because he was forced to borrow heavily. These lesion arises due, for
example, to muscle overload and occur at high speed and load muscles and tendons, leg
(quadriceps), spine and biceps [1].
The WMSDs acquired a lot of notoriety all over the world because it affects millions of
workers in different sectors of activity. In the United States (US) about 60 million operators
have symptoms of this type of injury, and in Europe it is considered one of the 10 most prevalent
diseases of occupational origin [2].
These lesions require great attention because, as already mentioned, in addition to
affecting the worker health it also affect the company, reducing productivity and increasing
2 Introduction
absenteeism [3]. It is important to note that millions of European workers affected by MSIs,
costs billions of euros in lost of productivity and social costs [4].
These workers are from various sectors, but one that has greater risk is the industry sector
because it is a professional area that demands de moving of loads, such as vehicles, furniture
and textiles [2].
Of all Member States of the European Union (EU), Greece is the only country that overcomes
Portugal in regards to the eminence of workers with spine pain and UL. The MSIs of the spine
and the UL, currently have a very significant importance [5]. In 1998, the most industrialized
districts of Portugal were Lisbon, Porto and Setubal, and, in these regions, MSIs occupied the
first place in the occupational diseases [6].
Thermography may have an important role and a great clinical application in the assessment
of individual muscle injuries, which are difficult to diagnose. These technique can offer two
types of important information when it comes to evaluate a muscle injury: it can locate an area
of inflammation associated with a muscle or muscle group and it can illustrate atrophy well
before it becomes apparent clinically [7].
IRT is a simple, non-invasive and inexpensive technique that provides valuable information
to determine whether to continue with more specific studies [8,9]. This technique does not use
radiation of any kind, so it can be used in children and pregnant women without any risk. In
addition, it can be repeated as often as necessary, with assurances regarding the repeatability
of results.
The IRT differs from usual radiographic studies of image that show structural abnormalities
because it t allows the expression of physical and functional changes that justify the patient's
symptoms. The type of thermal change depends on the intensity of the biological phenomenon
that is occurring, and the size and depth of the tissue involved [8].
Originally, thermography was developed for military purposes but, currently, it is widely
used for engineering applications and, in the last 50 years it’s also used for medical imaging
[10].
IRT has also been used as an adjunctive assessment method in several cases, such as WMSDs
[11], muscle damage induced by exercise [12], ulcer prevention study by pressure, prevention,
detection and tracking of injury gymnasts [13].
It is believed that in recent years the presence of injuries in the workers muscles has
increased, due to limited information on the topic. Therefore, this study aims to contribute to
the knowledge of the actual scale of the problem, and the data prevalence beyond muscle
injuries in workers caused by physically demanding jobs in industrial operations.
The image of use in medicine is currently considered an important resource in the
development of medical diagnostics. The processing and image analysis focuses on developing
procedures for extracting information of an image appropriately for their computer processing
[14].
According to health authorities representing that represent company’s, there are several
operators with symptoms of muscle injuries, mainly in the arms and spine, but it is unknown to
what extent is the severity of an injury. These injuries occur because the workers are constantly
subjected to repetitive movements, the movement of heavy loads and awkward postures while
working. Thus, we intend to proceed with the use of thermography as a preliminary diagnostic
tool in detecting and monitoring this type of lesions. For that it becomes necessary to initiate
an improvement of the thermal images with MSIs in order to facilitate observation of medical
and other technical detection.

Goals 3
1.3 - Goals
According to the topic of the present thesis “The use of thermal infra-red imaging to reveal
muscle injuries caused by physically demanding jobs in industrial operations” the objective of
the project is to evaluate the possibility of using thermography as a preliminary diagnostic tool
in detecting and monitoring trauma and injury occurrences. It’s also our aim to sustain that is
a simple, compact and cost-effective technique, that is suitable for a clinical environment and
many advantages such as being reliable and of straightforward interpretation, allowing real-
time monitoring during the diagnosis.
It is expected that tasks such as hardware selection, setup, image processing, clinical trials
are accomplished along this project.
1.4 - Work Organization In the following chapter, State of the Art, the prominent issue is the MSIs. In this chapter
we are going to make a theoretical review of the subject and also a general review to consider
these injuries in a worldwide perspective. After this first approach it will be presented the
thermography as the solution to the problem. Deepening the theme of thermography we also
are going to present their types, giving more emphasis to IRT because it is used in this work. At
the end of the chapter, is made the description the use of thermography in two different ways
and presented some applications of IRT, as in WMSDs, muscle injuries and physical exercise.
The third chapter is fully devoted to image processing and analysis, covering the algorithms
used in this project.
In the fourth chapter presents the methodological procedure, which is displayed throughout
the procedure performed in this work.
The main results obtained and discussion in the practical component are presented in the
fifth chapter.
Finally, on the sixth presents the conclusions and future work proposals.


5
Chapter 2
2. State of the Art
In the present chapter the prominent issue is the MSIs. In order to fully analyse it we present
a theoretical review about the theme also considering an Ergonomics and Ergonomic Workplace
Analysis, in the beginning of the chapter, as a way to fulfil the need of broad understanding of
the main theme.
The MSIs and WMSDs is presented in section 2.2 and at 2.3 we are going to grapple
Thermography presenting it as the solution to the problem. Still in this chapter we address to
Thermography considering the concept of Liquid crystal thermography (LCT), Microwave
thermography (MWT) and IRT. Section 2.5 is about Thermography and WMSDs and highlight the
connection between the two main concepts. In the end of the chapter, section 2.6, conclusions
are made.
Ergonomics
The word ergonomics comes from the Greek, ergo, meaning work, and nomos, as the Greek
word for laws or rules. Considering its etiology we can synthesize ergonomics as the laws
governing work [15]. Nowadays there are various definitions for ergonomics, but some of them
can lead us to a wrong interpretation because, sometimes it also refers to the "human factors
engineering" or simply "human factors" [16,17]. In August 2000, the International Ergonomics
Association (IEA) presented the official definition of ergonomics, describing it as "scientific
discipline related to the understanding of interactions among humans and other elements or
systems, and the application of theories, principles, data and methods, projects to optimize
human well-being and overall system performance” [16].
The Ergonomics is defined by many authors as a set of scientific knowledge relating to man
and necessary for the design of tools, machines, device and environment that can be used with
the maximum comfort, safety and efficiency in their jobs. As a science it involves the
application of knowledge of anatomy, physiology, psychology, biomechanics and anthropometry
and can be stated as the solutions arisen from this relationship, it is concerned primarily with
the physiological aspects of project work and with the human body and how it should adjust to
the environment [17, 18]. In this sense, ergonomics studies aspects such as posture and body
movements (sitting, standing, pushing, pulling and lifting weights); environmental factors
(noise, vibration, lighting, thermal environments, chemicals); information (captured by vision,

6 State of the Art
hearing and other senses) and tasks. The correct combination of these factors represented in
the figure 2.1, contributed to the success of any ergonomics program, as it enables , healthy,
comfortable, efficient and safe working environments.
Figure 2.1 - Factors contributing to the success of an ergonomics program [19].
The IEA divides ergonomics in three areas of expertise. Therefore we have Physical
Ergonomics consisting on characteristics of human anatomy, anthropometry, biomechanics and
physiology of physical activity. It includes material handling, physical arrangement of
workstations, work demands and factors such as repetition, vibration, strength and static
posture related MSIs.
It also features the Cognitive Ergonomics that is related to the mental processes such as
perception, memory, reasoning and motor response that affect the interactions of humans and
other elements of a system that includes mental load, monitoring, decision making,
performance skills, human error, human-computer interaction and training. And finally, it the
area of Organizational Ergonomics with refers to the optimization of socio-technical systems
including shift work, work schedule, job satisfaction, motivational theory, supervision,
teamwork, teleworking and ethics [20].
Ergonomics can be applied in various sectors of activity. Everyday household is an example
of that, such as industry, education, services and transportation. Currently, the word
ergonomics is used to describe the science of designing a task that suits the worker, instead of
forcing the worker to adapt to the task.
Ergonomic Workplace Analysis
One of the methods most used today is the EWA that consist in a realistic analysis of the
work, in order to identify and evaluate the action of the main conditions that may affect the
work, the worker and the organizational context.

Ergonomics 7
The EWA unfolds in three stages: first, the analysis of demand, secondly the analysis of the
task and, finally, the analysis of the activities. The analysis of demand is the first phase of the
EWA process, and aims to define with perspicuity the problem to be analysed doing so starting
from a negotiation with the various actors involved (managers, supervisors, workers,
ergonomists) [21]. The conditions of the work environment, such as environmental
temperature, postural conditions for workers and the noise level, can be checked from this
analysis. On the other hand, we have the ergonomic analysis of the task consisting in the
analysis of work, technical and organizational environment. Finally, the ergonomic analysis of
activity that corresponds to the analysis of the behaviour of human beings at work (gestural,
informational, regulatory and cognitive). No worker should be exposed for more than 50
minutes without break to recovery, after that period of time. And it’s important that 10 minutes
are devoted to recovery in order to avoid future health problems. WMSDs arise in individuals
who are exposed to repetitive and continuous activities. These group of workers often presents
complaints of pain, which mainly affect the UL. MSIs are already considered a major public
health problem, and, in the workplace, is considered the most serious one, affecting workers
all around the world. The change of function or worker's departure from his job can contribute
to a healthy recovery when the worker accuses injuries of this type. The ergonomic intervention
focused only on work organization is not the best option to solve the workers health problem
[18].
A good job helps prevent fatigue and musculoskeletal disorders that may be followed by
more generalized fatigue and postural distortions that results from bodily adjustments made to
achieve better visualization of components placed inappropriately [17].
Musculoskeletal Injuries
The musculoskeletal system of the human body consists of several organs and tissues which
function is to promote movement and locomotion. When there’s a malfunction MSIs can occur.
The MSIs lead to inflammatory and degenerative diseases, and can be conceptualized as a
disorder of the musculoskeletal tissues, such as muscles, joints, tendons, ligaments, nerves and
bones. It also relates to localized diseases of the circulatory system. These injuries are often
associated with temperature changes on the skin surface (inflammation, pathological or
vasoconstriction vasodilation, paresis or plagiarise, atrophy, etc.) [22, 23].
The presence of a pathology may affect the thermal balance in place, increasing (e.g.
inflammation contraction or muscle) or decreasing (e.g. reduced blood flow or decrease in
muscle activity) Tsk. It also exists a condition where there is asymmetry of more than 0.7ºC
[24].
The MSIs are recognized by the EU as one of the main causes of poor living quality and
absenteeism. Currently physical factors in the workplace have been linked to this type of injury
as well as leading to several consequences on the enterprise level, such as an increase in costs,
a loss of productivity in the labour field and competitiveness [25, 26].

8 State of the Art
2.2.1- Work-Related Musculoskeletal Disorders
WMSDs has not always been a subject of attention or importance by the occupational health
community in fact until the first half of the twentieth century little or nothing was known about
this type of injury [5]. However, nowadays, it is considered the main factor behind injuries that
cause disabilities, work absences and extreme care needs. The increase of company’s
competitiveness, and the highlighting of productivity with lower costs, came to emphasize the
problem and promote the development of studies in order to surpass it, so that the capitalized
industries could obtain gains in the work pace and long shifts, bypassing ergonomically
unsuitable environments [27, 28].
The WMSDs as mentioned above, affects the "work force" and represents one of the largest
categories of occupational diseases. The relationship between MSIs and work is already formally
recognized, and keeps as a mainstream subject to scientific community, because the
relationship between the appearance of diseases and the ergonomic on the work place is not
always very clear [23,26].
The lesions we have been taken in consideration are defined by the European Agency for
Safety and Health at Work (EU-OSHA) as an organic structure of injuries such as muscles, joints,
tendons, ligaments, nerves, bones and localized circulatory diseases caused or especially
aggravated by occupation, and by the effects of the immediate environment where this activity
takes place [3].
According to the General Health Department of Portugal, the WMSDs can be described as
injuries that result from the action of professionals risk factors which occurs repeatability, and
also results from a bad posture adopted during work, having also to be considered factors as
duration, frequency and intensity (magnitude). Repeatability, as a matter of fact, is a major
factor in de increasing of WMSDs rates. This factor relates to the fact of an individual being
performing repeatability identical movements for over two to four times per minute, over 50%
of the work cycle time for a total of 8h, which corresponds to one working day, in our country.
The symptoms of WMSDs may be pain, numbness, feeling of heaviness, fatigue and feeling
of loss of strength. These symptoms are most evident on the worker at the end of a working
day or even in production peaks.
The problem with this type of injury is that, at an early stage, symptoms are not
perceivable. Instead, when the development is detected, because injuries are already installed,
there are not much to do in order to avoid the problem. Injuries are there and, more often,
affect the spinal column, also, the knee and the ankle [29]. After a literature review, it was
concluded that there are several classifications to these lesions, depending on the country, as
we can see in Table 2.1.
Table 2.1- Different classifications adopted in different countries [4].
Country Nomenclature
United States of America (USA) Comulative Trauma Disorders (CTD)
United Kingdom Repetitive Strain Injury (RSI) or WMSD
Sweden Occupational Cervicobrachial Disorder
Brazil Lesões por Esforços Repetitivos (LER)
Distúrbios Osteomusculares Relacionados com o Trabalho (DORT)

Musculoskeletal Injuries 9
Australia Occupational Overuse Syndrome (OOS)
France Lésion Attribuable aus Trauvaux Répétitifes (LART)
Canada Repetitive Strain Injuries
Troubles Musculosquelettiques (TMS)
Portugal Lesões Músculo-esqueléticas Relacionadas com o Trabalho (LMERT)
2.2.2- Incidence of work-related musculoskeletal disorders at a world level
The WMSDs acquired a very important patency in the world, affecting millions of workers
from different sectors of activity. In the US, about 60 million operators feature symptoms of
this type of injury, and in Europe these disease is considered one of the 10 most prevalent
disorder with occupational origin [2]. Neurological diseases, lung diseases, diseases of the
sensory organs, and skin diseases are some examples of other health disorders that have high
prevalence rates in the EU (Figure 2.2).
Figure 2.2 - Proportion of occupational diseases in Europe workers in 2005 [30].
These lesions require great attention, because as already mentioned, in addition to
affecting the workers health they also affect the company, reducing productivity and increasing
absenteeism [3]. Thus, it is important to note that millions of European workers affected by
MSIs, costs Europe billions of euros in lost productivity and social costs [4], these workers are
from various sectors, but the industry that represents the greater risk is the one that demands
the move of loads, such as vehicles, furniture and textiles [2].
The US, Nordic countries and Japan are the countries that have a longer track record of
occupational diseases worldwide, about one-third. Comparing the developed countries with the
developing countries, it appears that WMSDs in developed countries account for about 3.4% of
total global professional illnesses unlike developing countries that account for about 1.7%. It is
assumed that one of the reasons for these figures is the fact that in developed countries there
is a greater knowledge and greater awareness of workers and health professionals [6].Of all

10 State of the Art
members of the EU States, Greece overcomes Portugal, regarding the eminence of workers with
spine pain and UL. The MSIs of the spine and the UL, currently, have a very significant
importance [5]. In Portugal, the low spine pain has a share of 2.85% and 3.66% in the
construction industry and lesions in the UL (shoulder and wrist) contain a percentage of 1.5%,
16.2% and 2:43% in the electrical industry, electronics and automotive [31]. In 1998, the most
industrialized districts of Portugal were Lisbon, Porto and Setubal, where MSIs occupied the
first place in the occupational diseases [6]. In the figure 2.3, we can see that the workers
consider that work affects health in a meaningful way, being the spine pain and muscle pain
the most significant health problem among these population [30].
Figure 2.3 - Percentage share of workers reporting health problems [30].
As mentioned earlier, the industrial workers are those with an increased risk of developing
WMSDs due to the heavy and repetitive work. A study has shown that 92% of these risk group is
suffering from this type of injury in any region of the body, being the lumbar region the one
that is most prevalent, presenting an affected rate of 54%, then the neck, 43%, and, finally,
shoulders with 42% [32]. Currently, there is still much research in this area to be made, either
at national and international level, in order to try to better statistics.
2.2.3- Main Types of Work-Related Musculoskeletal Disorders
The WMSDs are associated with a group of pathologies of lower evolution and manifest
themselves in terms of tendons, muscles, nerves, joints, and vascular system [27]. These
lesions, that are associated with occupational activities, may occur due to a repetitive work,
postural maintenance and/or manual inappropriate loads over a prolonged period of time. The
main lesions affecting workers exposed to repetitive work, postural maintenance and/or
handling charges are the neck pain, spine pain and injuries in the UL and lower limbs [3].
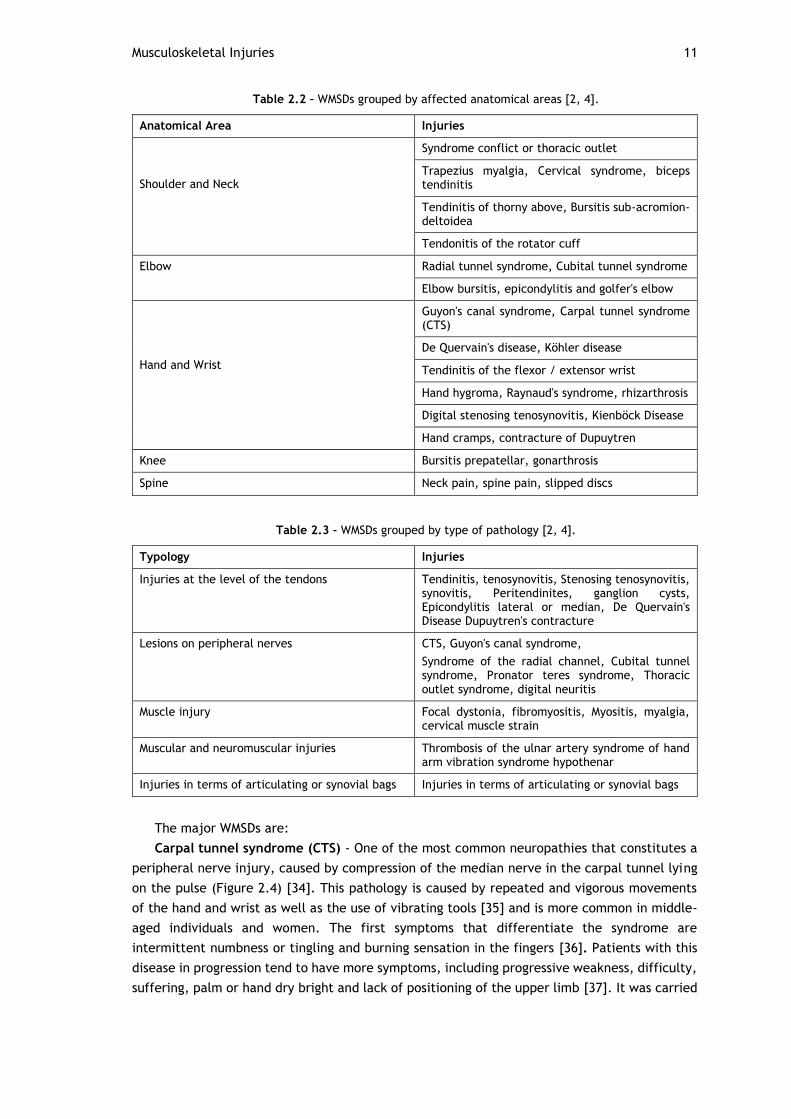
The main WMSDs, shown in Tables 2.2 and 2.3, can be grouped by affected anatomical areas
(such as shoulder / neck, spine, knee, elbow, hand and wrist) and type of pathology [29, 33].
% w
ork
ers
Musculoskeletal Injuries 11
Table 2.2 – WMSDs grouped by affected anatomical areas [2, 4].
Anatomical Area Injuries
Shoulder and Neck
Syndrome conflict or thoracic outlet
Trapezius myalgia, Cervical syndrome, biceps tendinitis
Tendinitis of thorny above, Bursitis sub-acromion-deltoidea
Tendonitis of the rotator cuff
Elbow Radial tunnel syndrome, Cubital tunnel syndrome
Elbow bursitis, epicondylitis and golfer's elbow
Hand and Wrist
Guyon's canal syndrome, Carpal tunnel syndrome (CTS)
De Quervain's disease, Köhler disease
Tendinitis of the flexor / extensor wrist
Hand hygroma, Raynaud's syndrome, rhizarthrosis
Digital stenosing tenosynovitis, Kienböck Disease
Hand cramps, contracture of Dupuytren
Knee Bursitis prepatellar, gonarthrosis
Spine Neck pain, spine pain, slipped discs
Table 2.3 - WMSDs grouped by type of pathology [2, 4].
Typology Injuries
Injuries at the level of the tendons Tendinitis, tenosynovitis, Stenosing tenosynovitis, synovitis, Peritendinites, ganglion cysts, Epicondylitis lateral or median, De Quervain's Disease Dupuytren's contracture
Lesions on peripheral nerves CTS, Guyon's canal syndrome,
Syndrome of the radial channel, Cubital tunnel syndrome, Pronator teres syndrome, Thoracic outlet syndrome, digital neuritis
Muscle injury Focal dystonia, fibromyositis, Myositis, myalgia, cervical muscle strain
Muscular and neuromuscular injuries Thrombosis of the ulnar artery syndrome of hand arm vibration syndrome hypothenar
Injuries in terms of articulating or synovial bags Injuries in terms of articulating or synovial bags
The major WMSDs are:
Carpal tunnel syndrome (CTS) - One of the most common neuropathies that constitutes a
peripheral nerve injury, caused by compression of the median nerve in the carpal tunnel lying
on the pulse (Figure 2.4) [34]. This pathology is caused by repeated and vigorous movements
of the hand and wrist as well as the use of vibrating tools [35] and is more common in middle-
aged individuals and women. The first symptoms that differentiate the syndrome are
intermittent numbness or tingling and burning sensation in the fingers [36]. Patients with this
disease in progression tend to have more symptoms, including progressive weakness, difficulty,
suffering, palm or hand dry bright and lack of positioning of the upper limb [37]. It was carried

12 State of the Art
out a study among industrial workers that stated a prevalence of CTS 9,4 cases per 100
employees [38].
Figure 2.4 - Pressured at carpal ligament [34].
Tendonitis - Tendonitis is an inflammation of the joint area between the muscle and the
tendon [2] and may occur in the hand, wrist, elbow or shoulder. When there is excessive
carrying out work, such as repetitive flexion/extension of the wrist and fingers, the tendon
tends to be excessively exerted, and that will cause swelling due to inflammation [29].Later
tendinitis generates a local sensitivity in the flashpoint and when joint movements are affected
it generates a sharp pain [36].
Tendonitis of the rotator cuff - Is the most common of shoulder disorders [38]. It appears
as a result of the practice of activities that require high sustained or repeated UL at shoulder
level or above it, circumduction movements with the arms high and static contraction of the
muscles of the shoulders will also trigger this disease [29].
Epicondylitis – This disease is characterized as an elbow tendinitis that causes intermittent
pain [39]. The epicondylitis can be side (if the pain is at the point of insertion of the wrist
extensors), or median (if the pain is in the wrist flexors), and appears in response to the
overload of the elbow or/and repetitive gestures and as a manifestation of poorly distributed
excessive loads [40, 41].
In a study accomplished among industrial workers, it was found a prevalence rate of
epicondylitis (average and lateral) of 5 cases per 100 [38].The lateral epicondylitis is an injury
that occurs more frequently than the average and is the result of follows execution moves to
tighten or hold with full flexion of the fingers repetitive sequence. The median epicondylitis
may arise in the event of pronation of the wrist, the palmar flexion of fingers and wrists and
palmar flexion with ulnar or radial tilt of the hand.
Rachialgia- According to the Direção Geral de Saúde (DGS), the Portuguese government
institution for public health, the rachialgias are characterized by a severe pain in the spine that
appears in consequence of an osteo-articular and/or muscle damage. This is one of the diseases
that more often is associated with work, and its symptoms can vary because they depend on
the affected area of the spine: cervical, lumbar or dorsal. The cervical and lumbar regions are
more affected because they are the most mobile [29].
The more relevant MSIs among Workers in the industrial sector in Portugal, are the
rachialgias with prevalence values for low spine pain of 2.3%, and for neck and spine pain 1.1%
0.8% [31].

Musculoskeletal Injuries 13
Muscle Injury-The skeletal muscle, one of the most abundant tissues in the human body, is
constantly exposed to various types of injuries [42]. Muscles are able to provide body balance,
strength, flexibility and proprioception [43], they are specialized tissues formed by tiny protein
structures (myosin actin), that grows in order to become larger and larger structures,
microfibers, fibres, fasciculus and muscle group [44].
Muscle damage is very common, and usually happens because the muscle was stretched
beyond its limits. (Figure 2.5). These lesions occur at high speed in load muscles and tendons,
leg (quadriceps) and spine (the spine injuries are termed e.g. by rachialgias as mentioned
previously) and biceps [1].
Figure 2.5 – Muscle Injury [45].
2.2.4- Risk Factors
A work that can cause the opposite effect on muscle is a risk factor (negative) [29] and
increase the likelihood of developing a disease or injury [46].
There are several factors that contribute to the development of MSIs. Some examples are
the manual handling of loads, repetitive movements, static or awkward postures, vibration,
insufficient breaks, low temperatures, organizational factors, high demands and low job control
[33]. According to a study by the European Survey on Working Conditions (ESWC) the stance of
maintaining standing or in uncomfortable positions, repetitive work or with display screen
equipment, and manual handling of loads, Figure 2.6, are strong reasons for the appearance of
the disease [30].

14 State of the Art
Figure 2.6 - Risk factors for MSIs [30].
These factors can be divided into 3 groups (Table 2.4): risk factors related to physical
activity – These are risk factors emanating from the realization processes of work activity [4,
30]; risk factors organizational and psychosocial -These are risk factors related to work but
without biomechanical nature. These factor is connected with the subjective perception that
employees have on aspects related to the organization of work [3]. The third group is related
to individual factors, constituting a subgroup not work-related that includes personal
characteristics [46].
Table 2.4 - Risk factors for the occurrence of MSIs [3].
Classification Risk factors
Related factors with the work activity
or Physical
Force application, such as lifting, carrying, pulling, pushing or using tools.
Repetitive movements
Forced postures or static, for example, hands above the level of the shoulders or sitting or standing for a long period of time.
Located compression exerted by tools and surfaces.
Vibes
Cold or Excessive Heat
Lighting
High noise levels
Psychosocial and Organizational Factors
Demanding work
Lack of support from colleagues, supervisors and managers
Low levels of job satisfaction
% w
ork
ers
expose
d
(1/4
of
the
work
ing

Thermography 15
Monotonous, repetitive and with a fast paced work.
Individual factors
Age
Obesity
Smoking
Physical Ability
Thermography
Thermography is a non-invasive technology that measures the variations in Tsk across the
surface of the body through infrared (IR) and thermal imaging [47], a technology that stands in
the principle that an object with a temperature above absolute zero emits IR radiation or
thermal radiation.
The IR image or thermography is a method that captures and measures radiation emitted
by the body, thus allowing an image of the thermal distribution on the skin surface. This
radiation is detected by an IR camera, and the emitted radiation intensity is converted to a
temperature measurement. From the thermographic inspection, the observed temperature
distribution differentials, provides information related to a process that is occurring inside the
organism.
According to the International Academy of Clinical Thermology (IACT), thermography is a
comfortable and safe procedure [48].It is a promptly, painless exam, that doesn’t involve
radiation or contrast substances [49].
The thermographic technique lends itself to countless applications in biology, thanks to its
versatility, lack of invasiveness and high sensitivity. It is widely used in medical, chiropractic
and veterinary areas [47, 50]. An example of its application is the assessment of the
vascularization of solid organs and pathologies in soft tissues, thus establishing, a diagnostic
aid component. It can identify thermal and vascular abnormalities, and is very suitable for
studies relating to pain, which can be measured following therapeutic procedures for
immediate review or long-term treatments [48].
The ease of use of the high thermal resolution (few centimes of Celsius degree depending
on detector used), together with the fact of being non-invasive in terms os opportunities of
use, have made thermography a technique widely used as a diagnostic tool [50]. Clinically,
thermography can be used as a diagnostic tool, as an enhancer of the physical examination
(because the camera is at least 10 times more sensitive than the clinician’s hand), or as a
method to detect inflammatory situations [51].
Despite all the mentioned advantages this is an unfit technique to provide information about
the ethology of diseases and cannot give any anatomical details on deeper organs and structures
because of the general difficulty of heat diffusion through the fatty tissue and bones. However,
it provides information on the location of pathological changes and physiological temperature.
Thermography is particularly useful on diseases that lead to alterations of the normal
control of the body temperature, such as changes in the microcirculation, inflammation,
trauma, metabolism and efficiency of the thermoregulatory systems [48]. It can identify and
locate the anatomical region affected by lesions by pointing out a temperature difference of 1
ºC (Figure 2.7) [52, 53].

16 State of the Art
Figure 2.7 - Body temperature in: a) a cold environment; b) in the warm [54].
Thermography has been applied in some studies, as cancer diagnosis, muscle damage
diagnosis, diagnosis of ischemia, in diabetic patients and evaluation of muscle recovery [55].
Clinical thermography has been in use since the 1960s and detects temperature variation
on the surface of the skin. In the case of in breast cancer, thermography involves using a
thermal imaging device to detect and record the heat pattern of the breast surface.
Thermography does not provide information on the morphological characteristics of the breast,
rather it provides functional information on thermal and vascular conditions of the tissue. The
role of thermography is considered to be a complement to other techniques, as it is a test of
physiology, this alone is not sufficient for medical practitioners to make or confirm a diagnosis
[56].
This technique may not always provide specific pathology detail.
However, it assists in defining the localization of increased inflammation and/or injury
area. The inflammatory response is characterized by the increase of the permeability of the
blood vessels which results in the raise of the blood flow that alters the heat pattern.
Therefore, variation in superficial thermal patterns resulting from changes in blood flow will
alter the amount of radiated heat that may be identified without difficulty by thermography
and may relate to inflammation of tissues underlying the appearance of changes in the
metabolic activity [57].
As already mentioned before, this is a method used to record patterns of thermal gradients
in the body and can be used to measure the thermal radiation (heat) emitted by the body.
Considering this characteristics it may, therefore, be used in the process of diagnosing lesions
caused by physical exercise. The thermography has been used, among other things, for
example, to determine injuries of the musculoskeletal system [58].
It can be repeated as often as necessary because there is no risk or pain to the patient. The
skin contains a thermal symmetry indicative of normalcy (Figure 2.8), when it is detected an
asymmetric it means that there is a change in the organism. An increase in temperature
indicates an increase of blood circulation, which is usually a process associated to pain,
inflammation or other causes [59]. Figure 2.8 represents an example of a symmetrical
temperature distribution of the knees from a healthy subject. In Figure 2.8a is represented the
a) b)

Thermography 17
anterior view, where the patella appears as a cold shield due to bony structure. The muscles
of the upper and lower leg represent hot areas due to high metabolic activity in the muscles.
The posterior aspect of the knee (Figure 2.8b) shows high temperature in the popliteal fossa
because of the popliteal arteries and veins [60].
Figure 2.8 - IR image of healthy knee: a) anterior aspect; b) posterior aspect [60].
Thermography is a process in which temperature differences can be mapped in a two-
dimensional image. The process detects electromagnetic radiation emitted by a body or liquids
that are at a higher temperature and takes advantage of Stefan-Boltzmann’s law, which states
that the thermal radiation emitted by a body is proportional to the difference between the
fourth power of the body and the fourth power of its surroundings [59].
W= εσT4 , (2.1)
where W is the radiant energy flux emitted by a surface area W / cm2, ε emissivity, 0,978, σ
Stephan-Boltzmann constant, 5,673x10-12 W/Kx cm-2, and T cutaneous absolute temperature, K
(Kelvin) [61].
This makes thermography a powerful tool to detect even the smallest differences in
temperature.
There are three types of thermography: LCT; IRT and MWT, which will be discussed in detail
later. While LCT on takes advantage of the fact that certain organic compounds are optically
anisotropic in the liquid phase and a colour change is associated with a change in temperature,
IRT and MWT, on the other hand, allow observation and detection of light emitted from warm
objects in the IR and microwave regions of the electromagnetic spectrum [59].
The main advantage of using thermography is that non-invasive and accurate measurements
on many subjects can be taken in rapid succession [57]. However, thermography has more very
significant advantages, as the absence of ionizing radiation, the safety and the low cost. The
patient has no pain, there is no physical contact, the ability to provide temperatures of a real-
time image surface, non-intrusiveness, possibility of locating the lesion, ability to demonstrate
metabolic and physiological changes in a functional examination and lastly, it can be used a
portable device [62].
Popliteal
Fossa
Patella

18 State of the Art
Types of Thermography
Thermography is a non-invasive technique in which temperatures are monitored, recorded
and displayed in a two-dimensional image, allowing visualization of both thermal equilibrium
and transient heating patterns. LCT and IRT are used to map surface temperatures, whereas
MWT can map subcutaneous temperatures [61]. IRT and MWT, on the other hand, allow
observation and detection of light emitted from warm objects in the IR and microwave regions
of the electromagnetic spectrum, respectively. This makes IRT most suitable to record the
temperature differences in clinical practice [59].
2.4.1- Liquid Crystal Thermography
Liquid Crystal Thermography (LCT) is a type of thermography relatively recent and widely
used for clinical evaluation because is inexpensive, semi quantitative, and represents a contact
method using liquid crystals [63, 64].
This thermal imaging method is a method of contact, as shown above, that allows the
measurement of temperatures on skin surface [64].
The term “liquid crystal” denotes a state of aggregation of molecules that is intermediate
between the crystalline solid and the amorphous liquid. In this state, a substance is strongly
anisotropic in some of its properties, yet, at the same time, it exhibits a certain degree of
fluidity, comparable, in many cases, to that of an ordinary liquid. An essential requirement
that substances must fulfil to achieve a mesomorphic state (state of matter intermediate
between a solid and liquid) is that their molecules must be highly anisotropic in their
geometrical shape, (i.e. rod or disk shapes) [65].
Liquid crystals are applied to the area of interest and after placement, the crystal changes
its neutral colour at room temperature, in response to the temperature of the body surface
with which they come into contact. The resulting colour display is then photographed using
Polaroid photography, giving a hard copy of the snapshot. It is this photography that shapes the
thermogram, which is then used for the diagnostic assessment [64].
The liquid crystals used for thermal imaging are organic compounds that reflect the visible
light in a narrow range, temperature-dependent wavelengths. The LCT system is simple,
portable, commercially available and inexpensive. Biomedical applications include breast
cancer detection and imaging of spinal root compression syndromes [61].
2.4.2- Microwave Thermography
MWT is the detection of microwave radiation from the human body. This procedure
measures the emission of natural radiation in the microwave region of the electromagnetic
spectrum [66, 67]. It can be repeated as many times as desired, without detrimental effects.
Initial clinical assessments of MWT have been performed in breast cancer detection [66].
The technique was first described in 1975, being, at that time, used in joint disease. Some
studies in the area of joint disease show that is easy to use this technique, and that it does not
require a temperature controlled environment [67].

Types of Thermography 19
Unlike IRT and LCT, MWT enables reception of signals arising from thermal subsurface tissue
[61]. There are some important and fundamental differences between IRT and MWT. The first
technique uses wavelengths of 10 cm while the MWT uses longer wavelengths, typically 1-20
cm.
The microwave radiation can penetrate human tissue, therefore the emission will provide
information relating to conditions within the subcutaneous body. The IR radiation is incapable
of such penetration and thus, refers to conditions primarily at the surface.
Regarding the emission intensity of microwave, it is linearly proportional to the
temperature transmitter. A measure of the emission can be easily connected with the emitter
temperature. In a less direct manner IR intensity measurements can also be related to
temperature.
The spatial resolution is also different in the two techniques: for microwaves it is around 1
cm, whereas the IRT typically conceived spatial resolutions of the order of 1 mm [66].
MWT attempts to directly observe the thermal radiation due to internal sources of the body,
minimizing skin tissue contribution. The technique is, therefore, much less dependent on the
measurement environment, and, in practice, it has been found possible to do entirely
satisfactory measurements in normal clinical environment without the need for special
facilities.
Thermography systems consists of a radiation receiving antenna that may be placed in
contact with the surface, and a microwave radiometer receiver with is used for measuring the
power of the thermal signal. To provide useful information in medicine, the MWT equipment
must have a temperature resolution of about 0.1 º C and a stability measurement order of some
tenths of Celsius degree. The equipment is portable, easy to use and suitable for routine use in
a wide variety of clinical applications. This equipment was used to demonstrate that the MWT
(Figure 2.9) can, simply and safely, provide clinically valuable information about disease
activity by measuring the internal body temperature patterns. Both the detector LCT and the
microwave require contact with the skin, which can change the thermal conditions of its surface
[68].
Figure 2.9 - Prototype clinical MWT equipment [68].

20 State of the Art
2.4.3- Infrared Thermography
IRT is a simple technique, also non-invasive and inexpensive, that provides valuable
information to determine whether to continue with more specific studies. The IRT measures
emitted IR radiation and displays the information as a pictorial representation, called
thermogram, the surface temperature of an object [8, 9]. The spectral bands 3-5 µm and 8-12
µm are used for IRT, because this minimizes absorption in air (Figure 2.10) [61].
Figure 2.10 - Medical imaging techniques within the electromagnetic spectrum [60].
This technique does not use extra radiation of any kind, so it can be used in children and
pregnant women without any risk. In addition, it can be repeated as often as necessary, with
assurances in what regards to the repeatability of the results. This is a complementary
technique that provides a more functional professional information regarding the disease or
injuries suffered by patients.
IRT allows, with a simple gesture of taking a picture or video, the saving of energy when it
comes to register the radiating of the human body. This technique was first used in the medical
field in the 60s, but, due to a poor performance as a diagnostic tool, the lack of standardized
protocols, and the appearance of more accurate diagnostic techniques it ceased to be used.
In order to describe the performance of this technique is important to state that IR radiation
emitted by the bodies under temperature is captured and quantified by sensors that detect this
type of radiation and convert it into electronic images that can be viewed, scanned and
recorded.
A thermographic camera is a device that, without contact with the object detects IR energy
and convert it into an electrical signal which is then processed in a thermal image on a monitor

Types of Thermography 21
for analysis of different temperatures (Figure 2.11). The image obtained in the IRT can be
considered as a heat map of the studied area, revealing the pathophysiological conditions
associated with different disorders. Its medical use is based on human thermal physiology and
the pathophysiology of skin thermoregulation [69].
Figure 2.11 - The thermal detector in an IR camera converts photon energy from a target surface into a
thermal image that can be displayed on a computer monitor. Each colour hue on the thermal image
corresponds to a certain temperature interval [69].
Two aspects may be assessed: qualitative and quantitative variations in physiological
thermal patterns. Qualitative variations are thermal symmetry changes that characterize the
physiological thermal pattern; quantitative variations requires the determination of the
temperature of the studied area and the existence of a temperature exceed 0.2-0.3 ºC over the
thermal area around the location under observation.
The IRT differs from radiographic studies because this last one is used to show structural
abnormalities, while IRT allows for the physical expression of functional changes that justify
the patient's symptoms. The type of thermal change depends on the intensity of the biological
phenomenon that is occurring, also depending on the size and depth of the tissue involved [8].
As mentioned above, the IRT measures the emitted IR radiation and displays the information
as a pictorial representation of the temperature on the surface of the object through the
thermogram. Each pixel in the thermogram represents the measured temperature surface of
an object. The information can be displayed in colour scale (Figure 2.12a), in colour scale of
strong-contrast (Figure 2.12b) and or as grey tones (Figure 2.12c). The colour scale contains
the hotter and cooler areas in which the warmer areas are exposed in white or red and colder
areas are displayed in blue or black [70].

22 State of the Art
Figure 2.12 - Temperature scales of thermograms: a) colour scale; b) colour scale strong-contrast; c) grey tones [70].
Sometimes there are changes in skin temperature. They occur in there is a registration of
variations in the thermal pattern (colour) that reflect thermal gradients. Patient conditions
may not always be analysed in depth by thermography, however, this system helps to set the
location of the area of inflammation and / or injury [57].
The infectious or inflammatory response is characterized by increased permeability of blood
vessels, resulting in increased blood flow, which leads to a localized increase of the surface of
the affected areas that changes the heat pattern of the area [57, 71]. Therefore, variation in
superficial thermal patterns, resulting from changes in blood flow, will alter the amount of
radiated heat that may be easily identified by thermography and may relate to inflammation
on the tissues underlying that point or alterations in the metabolic activity [57].
The advantage of using IRT technique, compared to alternative methods that requires a
contact between the object and the sensor, lies in the fact that the Tsk is not influenced by
the presence of any probes that could modify the temperature variation of the surface through
conduction (through direct contact between objects, molecular transference of heat energy)
or through radiation (heat generated from within the body is given-off to the surrounding
atmosphere) (Figure 2.13) [72].
Figure 2.13 - Thermal Transfer Processes [73].
IRT was originally developed for military purposes, about 50 years ago, but is currently
used, with widely expression, for engineering applications and as a medical imaging technique.
A thermal imager is used for IRT to measure the heat pattern of the object surface or human
skin and to detect the IR radiation [10].
Thermography has some very important advantages. Such as being a non-contact process,
and, therefore, a hygienic reliable procedure that presents no risk to the patient, it is also
c) a) b)

Types of Thermography 23
applicable in real-time and dynamically, thanks to the advanced image processing software
that exists nowadays. Another advantage is the fact that this technique is able to track
evolutionary processes and as a high portability profile [8, 10].
Several studies concerning IRT special characteristics state that we can get additional
information about the skin's thermal aspect and about the complex thermoregulatory process,
The IRT is very useful in sporting activity because it allows to detect the possible injury or
dysfunction, measuring the temperature of the skin over the inflamed joints: lesions or
dysfunctions often impossible to been shown by conventional methods. IRT can be a new, e.g.
diagnostic tool for detecting knee pathology, because it shows physiological changes, rather
than anatomical changes [10].
A review of the literature on this topic demonstrated that IRT can be very important,
because it is a particularly useful assessment tool for physicians who manage MSIs (i.e., physical
therapists, physiatrists, and doctors of chiropractic). IRT is also useful in the diagnosis of
pediatric MSIs in order to reduce the use of X-rays emitting ionizing radiation as much as
possible [71].
Bone fractures often trigger an inflammatory response, and as it was mentioned earlier,
when there is this type of response that there is a significant increase in Tsk in the affected
area. The IRT is a useful addition to the diagnostic tools available to the physician since it can
detect localized temperature variations such as occur when there is a fracture [9].
IRT is not the only technique that can be used to measure the Tsk, there are also thermal
contact sensors (such as thermistors and thermocouples) which are an equally promising
technique. However, the thermal interaction between the sensor and the atmosphere can
reduce the reliability of the measurement. In case of wireless sensors, they provide great
mobility and it does not interfere with physical activity. These sensors provide a continuous
record of temperature in situations of high-dynamic or below or between layers of clothing
[74].
IRT has been successfully applied for many clinical purposes (Figure 2.14). It has become
more popular in recent years in research about sports physiology due to its non-contact and
non-invasive nature (Figure 2.15) [75, 76].
Figure 2.14 - IRT images showing examples of varicose and superficial veins [75].

24 State of the Art
Figure 2.15 - Comparison of the pre-training and 24h post-training thermal image. (1) Subject of the control group, pre-training; (2) subject of the control group, 24h post-training; (3) subject of the experimental group, pre-training; and (4) subject of the experience.
To obtain a correct value of Tsk by quantifying the emitted radiation, the emissivity of the
measured surface must be known. Scientific studies that determine the emissivity of the human
skin, mostly agreed that the emissivity was 0.978 [10].
2.4.3.1 - Factors Influencing Infrared Thermography
When working with the IRT we have to take into account certain factors, that can influence
the assessment or interpretation of thermal images.
These factors will be divided into three main groups (Figure 2.16): Environmental factors,
individual factors and technical factors. Individual factors, in its turn, are divided into intrinsic
factors and extrinsic factors.
Environmental factors are those related to the location (natural features of the
environment) in which the assessment is held. Some examples of these factors are:
compartment size and room temperature, which is very important for most IRT applications.
After a review of the literature, it was found that the ideal temperature stands between 18 º
C to 25 º C and if the temperature is lower the patient may begin to tremble and becoming
sweaty ever since the opposite occurs, that is, the temperature becomes high.
The ideal temperature is 21 º C since it is the temperature to which the skin IR emission
values are higher; with relative humidity; correct atmospheric pressure. In this case, is given
more emphasis to the temperature, because it is easier to control factor.
Individual factors are those that are related to the subject being evaluated and the personal
characteristics that could influence Tsk. They are the most controllable and are divided into
intrinsic factors - related to the biological and anatomical parameters, and extrinsic factors -
those that affect the temperature of the human skin for a certain period of time. Intrinsic
factors are: gender, age, anthropometry, height, weight, heart rate, hair density, emissivity of
the skin, medical history, metabolic rate, skin blood flow, genetics and emotions. Extrinsic
factors, are considered to be the admission factors affecting the Tsk or emissivity due to
consumption or intake of medicinal products, beverages or other products that could
temporarily influence the temperature of the skin, and also the application factors which are

Types of Thermography 25
the products applied directly to the skin that affect the flow of blood or emissivity of the skin,
including cosmetics, ointments and radiation.
The last group of factors, the technical ones, are connected to the equipment used during
the evaluation of IRT. The validity, reliability, protocol, camera characteristics, and statistical
analysis programs are examples of such factors.
We can see that there are a large number of factors affecting the Tsk in humans, and is
very complicated to control all them, but the fact that we have knowledge about these factors
can help to prevent their influence or, at least, help in the recognition of their importance,
thus ensuring the correct use of IRT [75].
Figure 2.16 - Representation of the classification of IRT-related factors in humans [75].
2.4.3.2 - Infrared Radiation
IR Radiation were discovered in 1790 by M. Pitke and in the very beginning of the XIX century
(1800) the English astronomer Sir William Herschel, reminisced it while trying to figure out
which colours were responsible for heating the objects. This astronomer believed that there
are two kinds of radiation, light and heat radiation, sustaining that below the visible, red found
exists a very powerful invisible radiation of calorific levels, that became known as IR radiation
[77].
IR radiation is the region of the electromagnetic spectrum between visible light and
microwaves, containing radiation with wavelengths ranging from 0.75 to 10 mm [78].
26 State of the Art
All objects in the universe, including human beings, produce IR radiation, but the human
body is not only a source of such radiation, it also absorbs it very easily. IR has strong
penetrability and is readily absorbed by objects, in which it is transformed into internal energy
[80]. The human eye detects only a small part of the electromagnetic spectrum, the eye only
detect a wavelength that stands between 0.4 µm and 0.7 µm (Figure 2.17) [80].
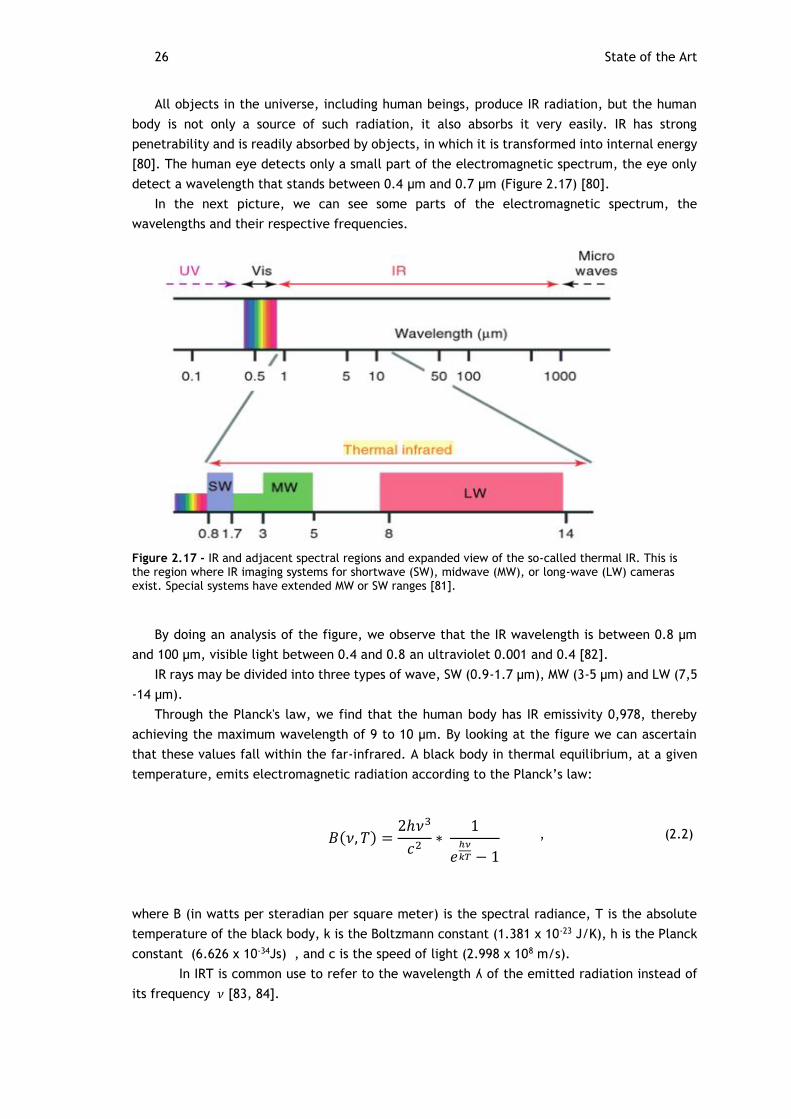
In the next picture, we can see some parts of the electromagnetic spectrum, the
wavelengths and their respective frequencies.
Figure 2.17 - IR and adjacent spectral regions and expanded view of the so-called thermal IR. This is the region where IR imaging systems for shortwave (SW), midwave (MW), or long-wave (LW) cameras exist. Special systems have extended MW or SW ranges [81].
By doing an analysis of the figure, we observe that the IR wavelength is between 0.8 µm
and 100 µm, visible light between 0.4 and 0.8 an ultraviolet 0.001 and 0.4 [82].
IR rays may be divided into three types of wave, SW (0.9-1.7 µm), MW (3-5 µm) and LW (7,5
-14 µm).
Through the Planck's law, we find that the human body has IR emissivity 0,978, thereby
achieving the maximum wavelength of 9 to 10 µm. By looking at the figure we can ascertain
that these values fall within the far-infrared. A black body in thermal equilibrium, at a given
temperature, emits electromagnetic radiation according to the Planck’s law:
, (2.2)
where B (in watts per steradian per square meter) is the spectral radiance, T is the absolute
temperature of the black body, k is the Boltzmann constant (1.381 x 10⁻²³ J/K), h is the Planck
constant (6.626 x 10⁻³⁴Js) , and c is the speed of light (2.998 x 10⁸ m/s).
In IRT is common use to refer to the wavelength ʎ of the emitted radiation instead of
its frequency 𝜈 [83, 84].
𝐵(𝜈, 𝑇) =2ℎ𝜈3
𝑐2∗
1
𝑒ℎ𝜈
𝑘𝑇 − 1

Types of Thermography 27
Through the Planck curve, demonstrate in the next figure 2.18, we can see that for human
skin, a temperature range from 30 to 34ºC, the region will emit radiation at wavelengths
between 7.5 to 14 micrometre ( more precisely between 9.57 to 9.41 µm).
Figure 2.18 – Planck Curve [85].
Wavelengths 3-5 µm would be more suitable for bodies at temperatures above 100ºC and
not to study the human body [85].
IR radiation emitted by a surface depends on the experimental conditions such as moisture,
airflow and surrounding temperature [60].
2.4.3.3 - Infrared Camera
IR cameras utilize a sensor responsive to the IR range in order to convert the thermal
radiation emitted by the skin surface into electrical signals, which are processed and digitized.
These signs will be quantized at an appropriate levels scale of grey and then presented in a
digital medical image. In that image, there are the hotter regions and colder regions, where
the bright regions are represented in clear shades of grey, and the colder regions are
represented in dark shades of grey. The grey scale is somewhat difficult to interpret, to
facilitate this pseudo-colour interpretation it was attributed to this scale a colour image [7].
There are two general types of IRT systems, scanning systems and staring systems. Scanning
systems are used to measure surface radiation point by point. Staring systems use IR sensor
arrays or focal-plane arrays. With this arrangement, every element of the object is transferred
to a corresponding sensor of the focal plane.
IR camera systems generally operate over one of three different wavelength regions or
bands of the IR wavelength band, as it exists as a part of the electromagnetic spectrum [86].
Before the 90s, the IR cameras contained a comparatively small number of photosensitives
detectors i.e., from 1 to 180 individual detectors. Cameras were heavy and consumed a lot of
energy in its manufacture process, being extremely expensive. In order to overcome this hurdle
Em
itância
Radia
nte
Rela
tiva
Wavelength (microns)

28 State of the Art
more efficient and less expensive IR cameras were developed into a chamber focal plane arrays
type (FPA).
An IR camera is a device that converts infrared radiation emitted by the body surface into
electrical impulses. The basic components of an IR camera are: optics, electronic systems,
image viewer, alimentation and accessories [87].
There are various models of IR cameras. In the next figure we present one example that
has proven to be ultra-portable and that can obtain detailed picture and one optimal
performance (Figure 2.19).
Figure 2.19 – Procedure for the production of a thermal image: a) Object; b) IR Camera Flir; c) Thermal image [88,89].
Thermography and Work-Related Musculoskeletal Disorders
The main functions of the musculoskeletal system, constituted by many organs and tissues,
in the human body movement and mobility.
The MSIs are often associated with temperature changes on the skin surface, manifested by
warmth, pain, redness, swelling and abnormal function [22]. Temperature is usually the main
signal, due to metabolic rate increased and vasodilation, since that occurrences are able to
alter the temperature gradient between the body and its environment [90]. This temperature
variation is visible with the use of IRT and the vision listed consists of a medical imaging method
that detects thermal radiation (IR radiation) emitted from the surface of objects.
The concepts mentioned in the present line have already been explore in the curse of our
investigation but we intend to deepen their conceptualization taking in account articles and
scientific publications that took this technology in order to perform medical diagnostics, as an
summarized systematic review, compiled in a spread sheet (tables 2.5 and 2.6).
2.5.1- Thermography as a Diagnostic Tool
Thermography can be used as a diagnostic tool, being non-invasive, non-ionizing, fast,
objective and able to monitoring a large area of interest in real time [91, 92].
a) c) b)

Thermography and Work-Related Musculoskeletal Disorders 29
IRT has been widely used since the early 1960s in different areas. During the first decades
after its development, research into the use of IRT in humans was mainly focused on its
applications as a diagnostic tool [78].
Studies published to the present date indicate that, IRT can be successfully used for
diagnosis of breast cancer, diabetes, dentistry, diabetic neuropathy, and so on. This is a
technology that also allows the diagnosis of problems related to tendons, ligaments, joints,
muscles and bones, even if covered by thin musculature [93].
Table 2.5 - Some studies that was used as thermography as a diagnostic tool [94-96].
Paper Objective Conclusion
Assessment of Piano-Related Injuries using Infrared Imaging
In this paper, we used statistical analysis to examine the difference in hand and arm temperatures of pianists with pain and pianists without pain related to piano-playing.
They found that there was a correlation between heat and pain due to piano playing, which showed in the difference in the mean temperature of the hands between pianists with pain and pianists without pain. IR imaging would be a good way to detect these problems early on and prevent serious pain or injuries in the future.
Skin temperature in the dorsal hand of office workers and severity of upper extremity musculoskeletal disorders
This study aimed to examine the suitability of using mean dorsal (hand) skin temperature (MDT) before and after a short typing task as an indicator of upper extremity musculoskeletal disorder (UEMSD) severity.
This study has demonstrated a reliable physiologic method of determining UEMSD severity in office workers through the measurement of dorsal hand temperature using IRT under a controlled ambient environment (18–22ºC recommended).
Infrared Thermography for examination of skin temperature in the dorsal hand of office workers
The study objective was to characterize potential differences in cutaneous temperature, among three groups of office workers assessed by dynamic thermography following a 9-min typing challenge.
Post-typing differences in Tsk in response to a 9-min typing challenge were detectable through IRT in three groups of office workers. IRT appears to distinguish between the three groups of subjects, with keyboard-induced cold hand symptoms presumably due, at least partially, to reduce blood flow.
2.5.2- Thermography as an Evaluation Tool of Exposure to Risk Factors for Development of Work‐Related Musculoskeletal Disorders
Recent research on thermography had illustrated that it is an effective diagnostic and,
potentially, evaluative tool for assessment of task demands on physiological responses believed
to be directly related to WMSD development [97].

30 State of the Art
Table 2.6 - Some studies in which the thermography was used as an evaluation tool of exposure to risk factors for development of MSIs [98-101].
Paper Objective Conclusion
Skin temperature and muscle blood volume changes in the hand after typing
Examine the correlation between mean skin temperature (THand), and relative blood volume (RBV) in the first dorsal interosseous muscle as measured through near infrared spectroscopy in the hand after a 9-min typing task in healthy subjects and the effect of typing speed on the physiological measures was determined.
THand and RBV in the first dorsal interosseous (FDI) appear to be moderately correlated after a typing task of 9-min in asymptomatic office workers.
This suggests that Tsk may be indicative of underlying muscle perfusion.
With regard to industry, in this case, we conclude that the reduced blood flow has been implicated in MSI pathophysiology.
Analysis of Temperature on the Surface of the Wrist in Individuals Emulating an Operation with Highly Repetitive Movements Using Sensory Thermography
This study focuses on the application of sensory thermography, as a non-invasive method to evaluate the MSIs that industry operators performing Highly Repetitive Movements (HRM) may acquire, which could enhance the pathological understanding of the Cumulative Trauma Disorder (CTD).
The sensory thermography offers the early detection of cumulative trauma disorders and with it, it would be possible to prevent further injuries, and perhaps prevent Cumulative Trauma Disorder CTD’s from occurring. Disorders like the Carpal tunnel disorder or tendinitis could be avoided by using an early monitoring system like the sensory thermography.
Infrared imaging of the anterior deltoid during overhead static exertions
The objective of this study was to quantify surface temperature changes over the anterior deltoid and evaluate efficacy of thermography as an assessment tool.
Infrared imaging has been used to detect the presence of neuromuscular disorders of the cervical spine and upper extremities.
Thermography was sensitive to changes in task loadings, illustrating its potential use for risk assessment.
Efficacy of using thermography to assess shoulder loads during overhead intermittent work
This study was designed to evaluate the effects of task parameters on middle deltoid and trapezius thermal images during simulated work tasks.
Results showed that thermography readings are sensitive to task demands on the musculature during dynamic tasks.
Thermography was found to be sensitive to changes in task parameters, providing preliminary evidence that thermography may be useful in quantifying work task demands.
2.5.3 – Applications of Infrared Thermography
The applications of IRT have been growing over the years. It is a technique widely used by
the military, aviation, transportation, construction and manufacturing industries, research and
the medical and veterinary professions. One example of its use is the fact that it is very useful
for firefighters because it allows them to see throughout smoke-filled rooms.

Thermography and Work-Related Musculoskeletal Disorders 31
In regard to the area of human medicine, thermal imaging has some advantages over other
imaging techniques because it is non-invasive and very fast. The IRT does not expose the patient
to harmful x-ray radiation.
Some anomalies cause an increase in temperature and shows hot spots as standards or as
an asymmetric IR thermogram, these abnormalities are malignant diseases, inflammations and
infections located [60]. Even if the anomaly is not specific, IRT will be able to detect it, because
this technique is a very powerful detector of problems that affect the physiology of the patient
[93].
IRT has also been used as an adjunctive assessment method in several cases: WMSDs [11],
muscle damage induced by exercise [12], ulcer prevention study by pressure, prevention,
detection and tracking of injury gymnasts [13]. It is necessary to take in to account some
procedures before starting an IR images diagnosis process such as the adjustment of the room
temperature and room humidity [102,103].
As said before thermography can be widely used and, this vast set also includes the WMSDs
and the possibility of beem taken during physical exercise, as we are going to see hereafter.
In concern to exercise, the thermal interaction of human body and the environment during
running activity is an important mechanism that may affect the athletic performance. In the
figure presented next, the Tsk response to running exercise has been tested by IR
thermographic imaging, a highly reliable method for diagnoses performed in real time. In this
image are represented typical examples of Tsk modifications, on the previous body regions,
during the graded and constant load treadmill exercises [104].

32 State of the Art
Figure 2.20 - Tsk measurements by IRT during running exercise [104].
When comparing Figure 2.20a and 2.20b, corresponding to different speed steps, we find
that further reductions occur the exercise progresses. In the images 2.20c and 2.20d load keeps
always constant, and, as this happens, the temperature distribution over the skin surface is still
uneven. Anyways mages taken at different intervals from the start of the exercise only show
minor differences in temperature levels over the body surface [104].
Humans throughout the day participate in various activities, due to this fact the knee is
susceptible to many diseases and injuries such as osteoarthritis (OA) that is a degeneration of
a particular cartilage without infection or inflammation can lead to a more or less rapid
destruction of cartilage. With IRT is possible to detect trauma or disorders that cannot be
displayed by conventional methods. This technology can measure the temperature of the skin
over the inflamed joints and, for that reason, it might be consider a plus tool in the diagnose
of knee pathology that present physiological changes, rather than anatomical changes. The
objective is to evaluate the utility of the IRT in knee OA detection (Figure 2.21) and to assess
the relationship between the intensity of pain and the measurement of Tsk.

Thermography and Work-Related Musculoskeletal Disorders 33
Figure 2.21 - IRT of right and left knees: a) before; b) after race for the participant with right knee OA [74].
Comparing figure 2.21a to figure 2.21b, it is seen that the load on the knee, over the
thermal zone is increased. This happens due to excessive use of the knee and repetitive stress
injury during vibration exercise that has been increasing in popularity both in leisure, sport and
clinical settings.
In this way, a survey was conducted with the aim to study the impact of acute exposure to
whole body vibration in the Tsk and thermal symmetry of the lower extremities in healthy
subjects (Figure 2.22) [105].

34 State of the Art
Figure 2.22 - Medial aspect of the left leg in the control (above) and experimental (below) groups, before (left) and after (right) whole body vibration [105].
Looking at the picture above, it can concluded that isometrically maintaince of the position
of 45 º of knee flexion for 5 minutes is enough to significantly decrease Tsk in the previous
aspect of the knee, anterior aspect of the lower leg, anterior aspect of the ankle, dorsal aspect
of the thighs, dorsal aspect of the lower legs and medial and lateral aspects of the ankles.
However, it is still necessary to deepen the research to reinforce the results obtained.
Concerning to thermography and MSIs in concret we are now presenting some studies, with
the respective images of some types of MSIs where thermography is applied.
Starting with muscle injuries, a type of musculoskeletal injury, we performed a study in
which we assessed the muscle injuries in musicians. Musicians, especially those using
instruments like the violin and the flute, often suffer from health problems due to inadequate
body positions. To detect the most critical zones, it was used IRT. It is anticipated that the
warmer areas, i.e. more active and more vascularized, are the region’s most exposure to risk
of overuse and pain.
These areas are highlighted in Figure 2.23 with a darker colour [106].

Thermography and Work-Related Musculoskeletal Disorders 35
Figure 2.23 - The image is represented 2 and 3 a guy after fiddling with the shoulder at rest and images 4 and 5 without shoulder be at rest [106].
Another case of MSIs is to hand-arm vibration syndrome, which remains a major problem in
occupational health. In some circulatory disturbances, such as Raynaud's phenomenon, or hand
arm vibration syndrome (Figure 2.24), damage to small blood vessels, from exposure to
vibrating machinery and the effect of the local blood circulation on Tsk, can be assessed by
thermal imaging. The hand-arm vibration syndrome is caused by repeated and frequent use of
vibrating tools like, drills, saws, jackhammers, among others. It can also be caused by
exploration or operating machinery that vibrates.
The nerves are affected first, leading to changes in sensitivity. This can be followed by
Raynaud's phenomenon, resulting from changes in the blood vessels, ensuing in a white finger.
Raynaud's phenomenon comes in crisis or attacks that are trigger by cold weather or touching
a cold object [107,108].
Figure 2.24 - The effects of stress on hand thermogram (A) 10 min full recovery from the normal 1 min immersion in water at 20 ◦C; (B) in a patient with Raynaud's phenomenon after 10 min. (C); (D) Examples of hand arm vibration injury to certain fingers, showing delayed recovery after vibration and thermal stress have been applied. The affected fingers are cooler [107].
In the figure 2.25, it is described the process that was used.

36
Figure 2.25 - The Vibration Provocation Test (VPT) diagram [108].
2.6 - Conclusions
WMSDs take place in people who are exposed to repetitive and continuous activities during
their work. As a result of this practices pain becomes a constant complaint. These workplace
injuries are considered to affect workers of all countries. Besides affecting workers, the
company is also affected by the reducing of productivity and the increase of absenteeism.
These lesions can be of various types, since tendonitis, epicondylitis and muscle injury.
The thermography has been widely used for clinical purposes, for example, in the diagnosis
of musculoskeletal injury. There are three types of thermography, namely LCT, IRT and MWT,
the most relevant for this project is IRT.
IRT technique is a simple, non-invasive and low cost diagnosis technique that also doesn’t
use any type of radiation, and, therefore, may be used in pregnant women and in children. This
technique shows physiological changes instead of anatomical changes, hence may be a novel
diagnostic tool in, for example, detecting pathologies of the knee. In MSIs caused by work or in
sports, this technique has also been applied very successfully.
Over the years, various studies have been conducted where the application of thermography
has been essential.

37
Chapter 3
3. Processing and Image Analysis
The image use in medicine is currently considered an important resource in the
development of medical diagnostics. The processing and image analysis focuses on developing
procedures for extracting information from an image using computer processing [14].
In recent years, the techniques responsible for processing and image analysis have had a
tremendous growth. Medicine is one of the areas that has most benefited from the interaction
with the computer, especially on analyzing and processing images, mainly for diagnostic
analysis.
The image analysis area is a field of study that aims to develop techniques that allow the
extraction of information from images, and allows people and machines to acquire a greater
power of analysis, resulting in greater support diagnosis [109].
Analysis techniques aided by computer have been proposed in order to offer better
parameters for the development of a more careful diagnosis, indicating suspicious areas [14].
In the present chapter the prominent issue is the processing and image analysis.
Morphological operations used in this project are presented in Section 3.1 and in Section 3.2
the findings are mentioned.
3.1 - Morphological Operations
Morphological operations are used in MATLAB provide a systematic geometric change of
image content while maintaining stability of the important geometric features.
Generally, morphological operators transform the original image into a smaller image size
and certain forms, is known as the structuring element. The geometric characteristics of the
image that are similar in shape and size to the structuring element are preserved, while other
features are suppressed. Morphological operations can simplify the image data, preserving their
characteristic forms and eliminating irrelevancies. Morphological operations can be used for
many purposes, including the detection of edge, segmentation, enhancement of images,
reconstruction and others [110].
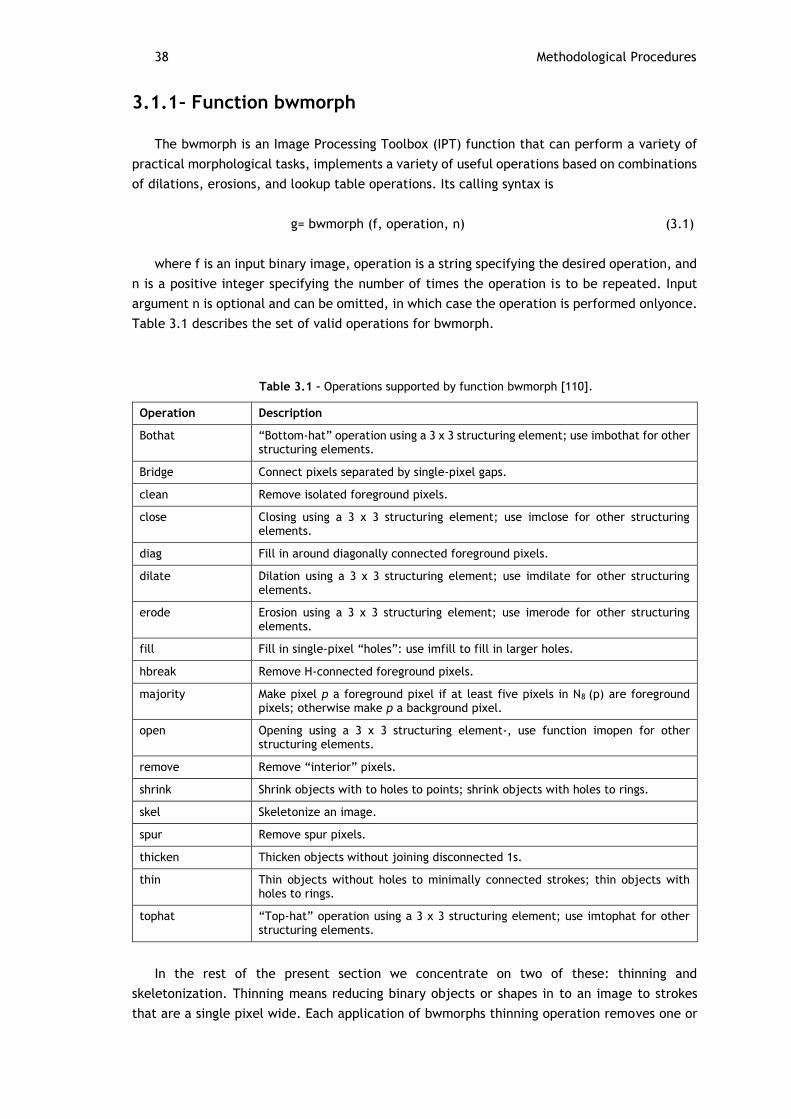
38 Methodological Procedures
3.1.1 – Function bwmorph
The bwmorph is an Image Processing Toolbox (IPT) function that can perform a variety of
practical morphological tasks, implements a variety of useful operations based on combinations
of dilations, erosions, and lookup table operations. Its calling syntax is
g= bwmorph (f, operation, n) (3.1)
where f is an input binary image, operation is a string specifying the desired operation, and
n is a positive integer specifying the number of times the operation is to be repeated. Input
argument n is optional and can be omitted, in which case the operation is performed onlyonce.
Table 3.1 describes the set of valid operations for bwmorph.
Table 3.1 – Operations supported by function bwmorph [110].
Operation Description
Bothat “Bottom-hat” operation using a 3 x 3 structuring element; use imbothat for other structuring elements.
Bridge Connect pixels separated by single-pixel gaps.
clean Remove isolated foreground pixels.
close Closing using a 3 x 3 structuring element; use imclose for other structuring elements.
diag Fill in around diagonally connected foreground pixels.
dilate Dilation using a 3 x 3 structuring element; use imdilate for other structuring elements.
erode Erosion using a 3 x 3 structuring element; use imerode for other structuring elements.
fill Fill in single-pixel “holes”: use imfill to fill in larger holes.
hbreak Remove H-connected foreground pixels.
majority Make pixel p a foreground pixel if at least five pixels in N8 (p) are foreground pixels; otherwise make p a background pixel.
open Opening using a 3 x 3 structuring element-, use function imopen for other structuring elements.
remove Remove “interior” pixels.
shrink Shrink objects with to holes to points; shrink objects with holes to rings.
skel Skeletonize an image.
spur Remove spur pixels.
thicken Thicken objects without joining disconnected 1s.
thin Thin objects without holes to minimally connected strokes; thin objects with holes to rings.
tophat “Top-hat” operation using a 3 x 3 structuring element; use imtophat for other structuring elements.
In the rest of the present section we concentrate on two of these: thinning and
skeletonization. Thinning means reducing binary objects or shapes in to an image to strokes
that are a single pixel wide. Each application of bwmorphs thinning operation removes one or

Morphological Operations 39
two pixels from the thickness of binary image objects. The following commands, for example,
display the results of applying the tinning operation one and two times.
>> f = imread (‘fingerprint_cleaned.tif’);
>> g1 = bwmorph (f, ‘thin’, 2);
>> imshow (g1), figure, imshow (g2)
Figures 3.2 is a fingerprint image from Figure 3.1, figure 3.2(a) and 3.2(b), respectively,
show the results.
Figure 3.1 - Noisy fingerprint image. Opening followed by closing [110].
Figure 3.2 – Fingerprint image from Figure 3.1 thinned once. (b) Image thinned twice. (c) Image thinned until stability [110].
Skeletonization is another way to reduce binary objects image to a set of thin strokes that
retain important information about the shapes of the original objects. Function bwmorph
performs skeletonization when operation is set to 'skel'. Let f denote the image of the boonelike
object as in Figure 3.3 (a). To compute its skeleton, we call bwmorph, with n=Inf:
>> fs = bwmorph(f, ‘skel’, Inf);
>> imshow(f), figure, imshow(fs)
a) b) c)

40 Methodological Procedures
Figure 3.3 – (a) Bone image. (b) Skeleton obtained using function bwmorph. (c) Resulting skeleton after
pruning with function endpoints [110].
Skeletonization and thinning often produce short extraneous spurs, sometimes called
parasitic components. The process of cleaning up (or removing) these spurs is called pruning.
Function endpoints can be used for this purpose. The method is to iteratively identify and
remove endpoints. The following simple commands, for example, port processes the skeleton
image fs through five iterations of endpoint removals:
>> for k = 1:5
>> Fs = fs & ~endpoints(fs);
>> End
3.1.2 – Edge Detection using Function Edge
Edge detection is the process of localizing pixel intensity transitions. The edge detection
has been used by object recognition, target tracking, segmentation, and so on. Therefore, the
edge detection is one important parts of image processing.
There is a several range of edge detection methods (Sobel, Prewitt, Roberts, Canny). These
methods have been proposed for detecting transitions in images. Early methods determined the
best gradient operator to detect sharp intensity variations.
Edge detection is an important concept, both in the area of image processing and in the
area of object recognition. Without being able to determine where the edges of an object fall
a machine would be unable to determine many things about an object such as shape, volume,
area and so forth.
The goal of edge detection is to mark the points in a digital image at which the luminous
intensity changes sharply. Edge detection of an image reduces significantly the amount of data
and filters out information that may be regarded as less relevant, preserving the important
structural properties of an image.
Although point and line detection certainly are important in any discussion about image
segmentation, edge detection is by far the most common approach for detecting meaningful
discontinuities in intensity values. Such discontinuities are detected by using first- and second-
order derivatives. The first-order derivative of choice in image processing is the gradient. We
a) b) c)

Morphological Operations 41
repeat the pertinent equations here for convenience. The gradient of a 2-D function, f (x,y), is
defined as the vector
∇𝑓 = [𝐺𝑥
𝐺𝑦] = [
𝜕𝑓
𝜕𝑥𝜕𝑓
𝜕𝑦
] , (3.2)
the magnitude of this vector is
∇𝑓 = 𝑚𝑎𝑔(∇𝑓) = [ 𝐺𝑥2 + 𝐺𝑦
2]1/2
= [(∂f/ ∂x)2 + (∂f/ ∂y)2]1
2 , (3.3)
To simplify computation, this quantity is approximated sometimes by omitting the square-
root operation,
∇𝑓 ≈ 𝐺𝑥2 + 𝐺𝑦
2 , (3.4)
or by using absolute values,
∇𝑓 ≈ |𝐺𝑥| + |𝐺𝑦| , (3.5)
These approximations still perform the role of derivatives; that is, they are zero in areas of
constant intensity and their values are proportional to the degree of intensity change in areas
whose pixels values are variable. It is a common practice to refer to the magnitude of the
gradient or its approximations simply as "the gradient."
A fundamental property of the gradient vector is that it points in the direction of the
maximum rate of change of its coordinates (x,y). The angle at which this maximum rate of
change occurs is
∝ (𝑥, 𝑦) = tan−1(𝐺𝑦
𝐺𝑥) , (3.6)
One of the key issues is how to estimate the derivatives Gx and Gy digitally. The various
approaches used by function edge are discussed later in this section.
Second-order derivatives in image processing are generally computed using the Laplacian.
That is, the Laplacian of a 2-D function f(x,y) is formed from second-order derivatives, as
follows:
∇2𝑓(𝑥, 𝑦) = 𝜕2𝑓(𝑥,𝑦)
𝜕𝑥2 + 𝜕2𝑓(𝑥,𝑦)
𝜕𝑦2 , (3.7)
There are two important general criteria used in the idea behind edge detection that is to
find places in an image where the intensity changes rapidly:
1. Find places where the first derivative of the intensity is greater in magnitude than a
specified threshold.
2. Find places where the second derivative of the intensity has a zero crossing.
The general syntax for this function is
[g, t] = edge(f, ‘method’, parameters) (3.8)
where f is the input image, this method is one of the approaches listed in Table 10.1, and
parameters are additional parameters explained in the following discussion. In the output, g is
a logical array with 1s at the locations where edge points were detected in f and 0s elsewhere.
Parameter t is optional; it gives the threshold used by edge to determine which gradient values
are strong enough to be called edge points [110].

42 Methodological Procedures
3.1.2.1 - Edge Detection Algorithms
Edge detection is the process of determining where the boundaries of objects fall within an
image. There are several algorithms that exist to date that are able to detect edges (table 3.2).
Roberts Cross was the first technique used and is thus the fasted and simplest to implement.
Lastly, there is the Canny edge detection algorithm. This uses several steps to detect edges in
an image. However, sometimes this algorithm can be slow due to its higher degree of
complexity.
Table 3.2 – Edge detectors available in function edge [110].
Edge Detector Basic Properties
Sobel Finds edges using the Sobel approximation to the derivatives.
Prewitt Finds edges using the Prewitt approximation to the derivatives.
Roberts Finds edges the Roberts approximation to the derivatives.
Laplacian of a Gaussian (LoG) Finds edges by looking for zero crossings after filtering f (x,y) with a Gaussian filter.
Zero crossings Finds edges by looking for zero crossings after filtering f(x,y) with a user-specified filter.
Canny Finds edges by looking for local maxima of the gradient of f (x,y). The gradient is calculated using the derivative of a Gaussian filter. The method uses two thresholds to detect strong and weak edges, and includes the weak edges in the output only if they are connected to strong edges. Therefore, this method is more likely to detect true weak edges.
Roberts Edge Detector
Roberts operator makes the cross gradient, that is, instead of calculating the differences in
brightness values in the vertical and horizontal direction, do it in a direction rotated 45 º [110].
The Roberts edge detector uses the masks in Figure 3.3 to approximate digitally the first
derivatives Gx and Gy [110].
(3.9)
Its general calling syntax is
[g, t] = edge(f, ‘roberts’, T, dir) (3.10)
The parameters of this function are identical to the Sobel parameters. The Roberts detector
is one of the oldest edge detectors in digital image processing, and as Figure 3.4 shows, it is
also the simplest [110].
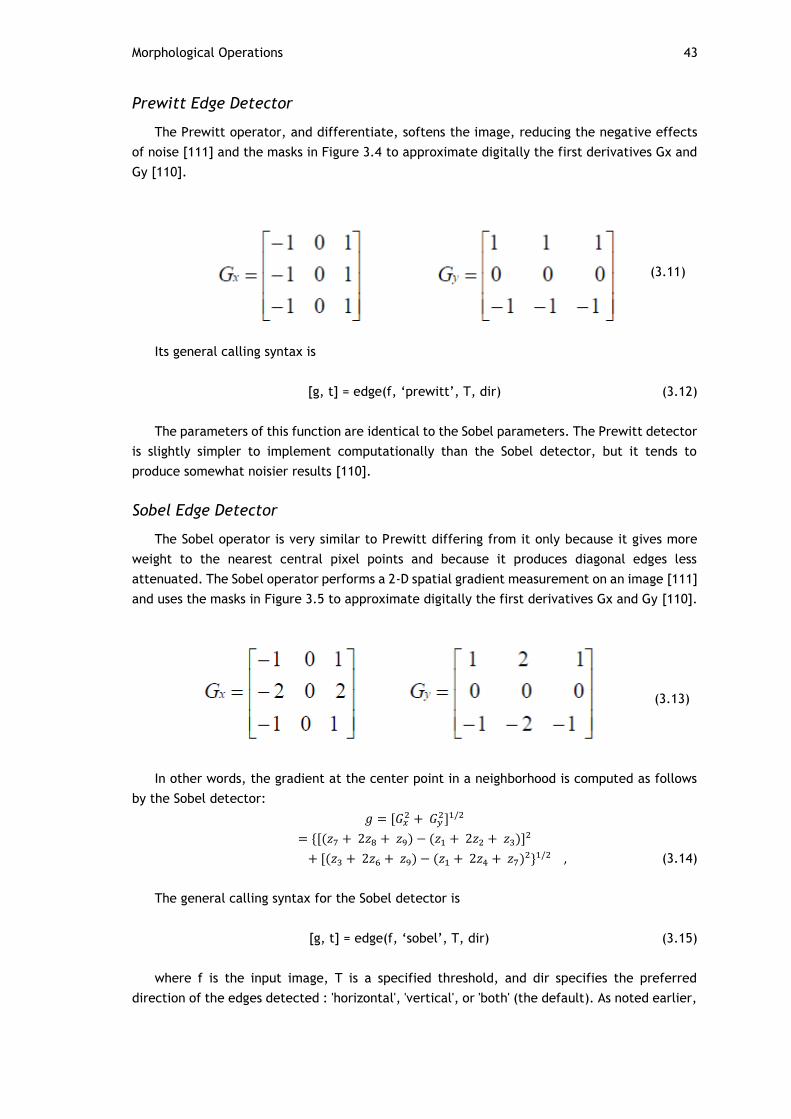
Morphological Operations 43
Prewitt Edge Detector
The Prewitt operator, and differentiate, softens the image, reducing the negative effects
of noise [111] and the masks in Figure 3.4 to approximate digitally the first derivatives Gx and
Gy [110].
(3.11)
Its general calling syntax is
[g, t] = edge(f, ‘prewitt’, T, dir) (3.12)
The parameters of this function are identical to the Sobel parameters. The Prewitt detector
is slightly simpler to implement computationally than the Sobel detector, but it tends to
produce somewhat noisier results [110].
Sobel Edge Detector
The Sobel operator is very similar to Prewitt differing from it only because it gives more
weight to the nearest central pixel points and because it produces diagonal edges less
attenuated. The Sobel operator performs a 2-D spatial gradient measurement on an image [111]
and uses the masks in Figure 3.5 to approximate digitally the first derivatives Gx and Gy [110].
(3.13)
In other words, the gradient at the center point in a neighborhood is computed as follows
by the Sobel detector:
𝑔 = [𝐺𝑥2 + 𝐺𝑦
2]1/2
= {[(𝑧7 + 2𝑧8 + 𝑧9) − (𝑧1 + 2𝑧2 + 𝑧3)]2
+ [(𝑧3 + 2𝑧6 + 𝑧9) − (𝑧1 + 2𝑧4 + 𝑧7)2}1/2 , (3.14)
The general calling syntax for the Sobel detector is
[g, t] = edge(f, ‘sobel’, T, dir) (3.15)
where f is the input image, T is a specified threshold, and dir specifies the preferred
direction of the edges detected : 'horizontal', 'vertical', or 'both' (the default). As noted earlier,

44 Methodological Procedures
g is a logical image containing 1s at locations where edges were detected and 0s elsewhere.
Parameter t in the output is optional. It is the threshold value used bye the edge. If T is
specified, then t=T. Otherwise, if T is not specified (or is empty, []), edge sets t equal to a
threshold it determines automatically and then uses for edge detection. One of the principal
reason for including t in the output argument is to get an initial value for the threshold.
Function edge uses the Sobel detector as a default if the syntax g=edge, or [g, t] = edge(f), is
used [110].
Laplacian of a Gaussian (LoG) Detector
Consider the Gaussian Function
ℎ(𝑟) = −𝑒−
𝑟2
2𝜎2 , (3.16)
where r2 = x2 + y2 and σ is the standard deviation. This is a smoothing function which, if
convolved with an image, will blur it. The degree of blurring is determined by the value of σ.
The Laplacian of this function (the second derivative with respect to r) is
∇2ℎ(𝑟) = − [𝑟2− 𝜎2
𝜎4 ] 𝑒𝑟2
2𝜎2 , (3.17)
We convolve the image with ∇2ℎ(𝑟) , knowing that it has two effects: it smoothes the image
(thus reducing noise), and it computes the Laplacian, which yields a double-edge image.
Locating edges then consists of finding the zero crossings between the double edges.
The general calling syntax for the LoG detector is
[g, t] = edge(f, ‘log’, T, sigma) (3.18)
where sigma is the standard deviation and the other parameters are as explained previously.
The default value for sigma is 2. As before, edge ignores any edges that are not stronger than
T. If T is not provided, or it is empty, [], edge chooses the value automatically. Setting T to 0
produces edges that are closed contours, a familiar characteristics of the LoG method [110].
Zero-Crossings Detector
This detector is based on the same concept as the LoG method, but the convolution is
carried out using a specified filter function, H. The calling syntax is
[g, t] = edge(f, ‘zerocross’, T, H) (3.19)
The order parameters are as explained for the LoG detector [110].
Canny Edge Detector
The Canny is an operator that is little affected by noise and allows the detection of contours
by maximizing the signal ratio / noise gradient contour location factor which ensures that the
detected contour is the most suitable possible and minimizing the number of responses to a

Morphological Operations 45
single contour [112]. In this method, initially is applyed a Gaussian filter, and then applies the
Canny operator gradient.
The Canny detector is the most powerful edge detector provided by function edge. The
method can be summarized as follows:
1. The image is smoothed using a Gaussian filter with a specified standard deviation, σ, to
reduce noise.
2. The loal gradient, 𝑔(𝑥, 𝑦) = [𝐺𝑥2 + 𝐺𝑦
2]1/2, and edge direction, 𝛼(𝑥, 𝑦) = tan−1(𝐺𝑦/𝐺𝑥) ,
are computed at each point. Any of the first three techniques in TABLE 10.1 can be used to
compute Gx and Gy. An edge point is defined to be a point whose strength is locally maximum
in the direction of the gradient.
3. The edge points determined in (2) give rise to ridges in the gradient magnitude image.
The algorithm then tracks along the top of these ridges and sets to zero all pixels that are not
actually on the ridge top so as to give a thin line in the output, a process known as nonmaximal
suppression. The ridge pixels are then thresholded using two thresholds, T1 and T2, with T1<T2.
Ridge pixels with values greater than T2 are said to be "strong" edge pixels. Ridge pixels with
values between T1 and T2 are said to be "weak" edge pixels.
4. Finally, the algorithm performs edge linking by incorporating the weak ixels that are 8-
connected to the strong pixels.
The syntax for the Canny edge detector is
[g, t] = edge(f, ‘canny’, T, sigma) (3.20)
where T is a vector, T=[T1, T2], containing the two thresholds explained in step 3 of the
preceding procedure, and sigma is the standard deviation of the smoothing filter. If t is included
in the output argument, it is a two-element vector containing the two threshold values used by
the algorithm. The rest of the syntax is as explained for the other methods, including the
automatic computation of thresholds if T is not supplied. The default value for sigma is 1 [110].
3.1.3 – Function Regionprops
Function regionprops is IPTs principal tool for computing region descriptors. This function
has the syntax
D = regionprops(L, properties) (3.21)
where L is a label matrix and D is a structure array of length max (L(:)). The fields of the
structure denote different measurements for each region, as specified by properties. Argument
properties can be a comma-separated list of strings, a cell array containing strings, the single
string 'all', or the string 'basic'. Table 11.1 lists the set of valid property strings.
If properties is the string 'all', then all the descriptors in Table 3.3 are computed. If
properties is not specified or if it is the string 'basic', then the descriptors computed are 'Area',
'Centroid', and 'BoundingBox'. Keep in mind that IPT uses x and y to indicate horizontal and
vertical coordinates, respectively, with the origin being located in the top, left. Coordinates x
and y increase to the right and downward from the origin, respectively. For the purposes of our
discussion, on pixels are valued 1 while off pixels are valued 0 [110].

46 Methodological Procedures
Table 3.3 – Regional descriptors computed by function regionprops [110].
Valid Strings for properties Explanation
‘Area’ The number of pixels in a region.
‘BoundingBox’ 1 x 4 vector defining the smallest rectangle containing a region. BoundingBox is defined by [ul_corner width], where ul_corner is in the form [x y] and specifies the upper-left corner of the bounding box, and width is in the form [x_width y_width] and specifies the width of the bounding box along each dimension.
‘Centroid’ 1 x 2 vector; the center of mass of the region.
‘ConvexArea’ Scalar; the number of pixels in ‘ConvexImage’.
‘ConvexHull’ P x 2 matrix; the smallest convex polygon that can contain the region.
‘ConvexImage’ Binary image; the convex hull, with all pixels within the hull filled in (i.e., set to on). The image is the size of the bounding box of the region.
‘Eccentricity’ Scalar; the eccentricity of the ellipse that has the same second moments as the region. The eccentricity is the ratio of the distance between the foci of the ellipse and its major axis length. The value is between 0 and 1, with 0 and 1 being degenerate cases (an ellipse whose eccentricity is 0 is a circle, while an ellipse with an eccentricity of 1 is a line segment).
‘EquivDiameter’ Scalar; the diameter of a circle with the same areas as the region. Computed as sqrt (4*Area/pi).
‘EulerNumber’ Scalar; equal to the number of objects in the region minus the number of holes in those objects.
‘Extent’ Scalar; the proportion of the pixels in the bounding box that are also in the region. Computed as Area divided by the area of the bounding box.
‘Extrema’ 8 x 2 matrix; the extremal points in the region. Each row of the matrix countains the x- and y-coordinates of one of the points.
‘FilledArea’ The number of on pixels in FilledImage.
‘FilledImage’ Binary image of the same size as the bounding box of the region. The on pixels correspond to the region, with all holes filled.
‘Image’ Binary image of the same size as the bounding box of the region; the on pixels correspond to the region, and all other pixels are off.
‘MajorAxisLength’ The length (in pixels) of the major axis of the ellipse that has the same second moments as the region.
‘MinorAxisLength’ The length (in pixels) of the minor axis of the ellipse that has the same second moments as the region.
‘Orientation’ The angle (in degrees) between the x-axis and the major axis of the ellipse that has the same second moments as the region.
‘PixelList’
A matrix whose roes are the [x , y] coordinates of the actual pixels in the region.
‘Solidity’ Scalar; the proportion of the pixels in the convex hull that are also in the region.

Conclusions 47
3.2 - Conclusions The image processing focuses on developing procedures to extract information from an
image appropriately for computational processing. The image analysis area is a field of study
that aims to develop techniques that allow you to extract information from images, and allows
people and machines to acquire greater power analysis, resulting in a greater support diagnosis.
The concepts and techniques presented in this chapter constitute a powerful set of tools
from which we can extract features of an image, as is the function of the case bwmorph that
implements a variety of useful operations based on combinations of dilations, erosions, and
table lookup operations.
The edge detection algorithms, is based on a drastic change in value from one spot to the
next in either an image or in one's own eyes. There are several algorithms that are able to
detect edges and in this chapter they were presented. However, only one of these algorithms
has used in this project, the Sobel Edge Detector. Finally, regionprops function is also used,
this function has several regional descriptors computed, but used was bweuler function which
is the Euler's number, Area and PixelList.


49
Chapter 4
4. Methodological Procedures
In the present chapter it is presented the methodological procedures of this project. The
chapter starts with the operational definition of Variables and followed is presented the
materials and methods section 4.2, this same section divided into subsections 5.
4.1 - Operational Definition of Variables
Injuries Musculoskeletal - are disorders of muscles, tendons, fascia’s (band of fibrous tissue
that lines the muscles) and nerves in the upper limb caused by repetitive movements that result
in pain, numbness, decreased range of motion, and, in consequence, temporary incapacitation,
reaching the disability. Usually located in the upper limb and spine these kind of injuries may
occur in other locations, such as the knees or ankles, depending on the area of the body
affected. These are injuries that have a close relation to the activity developed by a worker,
once its appearance and degree of intensity depends on it.
Thermography - is a non-invasive, simple and low cost technique that measures the
amount of infrared radiation emitted by the body, providing the value of its surface
temperature and, soon after, processing the results in a, display that appears in the form of
images.
4.2 - Materials and Methods
To conduct a study of a scientific nature is necessary to opt for a particular research
methodology that adapts to the reality to be studied. In this sense, there was a research study
at a tire company, Continental Mabor, SA, in Vila Nova de Famalicão. This study was of
qualitative and quantitative nature, through an exploratory process. Its implementation
deepens the level of knowledge by description and / or interpretation of the data obtained, so
that one can understand the phenomenon under study.
The present research project is of a cross observational descriptive comparison type, we
are going to analyse and compare simultaneously the patient's exposure to hazardous situations
and the results in terms of health, in two samples over a given period of time.

50 Methodological Procedures
4.2.1 – Population and Sample
The study universe corresponds to all workers of the production sector of the refferd
company. All subjects of the sample are male.
All participants were informed concerning the objectives of the study and they where also
told that all the information collected would be treated anonymously and confidentially.
The study sample comprises 52 male workers from the production area. All of them are
more than18 years old. This sample contains 26 injured workers (experimental group) and 26
healthy workers (control group). Lesions considered in this project are mainly focused on the
knee, feet, spine and UL, which are areas where the lesions were more prevalent.
The control group selection was easily accomplished, and all patients who appeared in
clinical enterprise services for any reason not being musculoskeletal complaints lesions where
also envited to be a part of our sample, as a member of the control group.
On the day of evaluation it was required to the participant to sign an informed consent form
(Appendix A), and to complete a questionnaire (Appendix B), followed by a period of thermal
acclimation to the examination room and image acquisition. It is important to note that this
research was completely safe and painless, did not present any risk to the individual, and all
data collected were confidential.
4.2.2 – Methods for Collection of Data
The instruments used in data collection were a questionnaire (Appendix B) for assemblage
of information on musculoskeletal symptoms reported by workers.
This questionnaire (Appendix B) consisted in 8 questions and for their preparation, we had
taken into account the objectives of the study and the existing research on the subject.
The questionnaire is provided by the Nordic Questionnaire Musculoskeletal (QNM) in the
version translated and validated for the Portuguese population [113], to assess health aspects.
The questionnaire was organized in three thematic groups: sociodemographic questions;
questions on health issues and about the job itself. The answers to the questions where
dichotomous (yes / no), polychotomous, or presented in an ordinal scale (Likert).
The questionnaire had good internal consistency and high repeatability and was considered
valid, reliable and moderately sensitive method for assessment of musculoskeletal symptoms
[114].
The initial questions were of more personal origin, enquiring the worker's sex, age and shift.
Then it where made questions about the job, about laterality, and about physical activity. In
another group of the questionnaire questions where made in relation to MSIs. It was asked if
there where a recent musculoskeletal injury of any kind suffered inside or outside the
workplace.
There are some factors that can influence the temperature of the body, so it was asked to
the employee if he had, smoked, drinked alcohol, tea / coffee, if he practiced a physical
activity or used some cosmetic / ointment on his skin, the last two hours. Finally the respondent
was asked to signalize the injury point looking for a figure on paper and indicating the intensity
of his pain. A numerical scale was included for rating pain intensity in the different regions,

Materials and Methods 51
measured on an ordinal scale from 0 to 5 values, where 0 represented no pain and 5 represented
maximum pain.
During this project were acquired thermal images in two different ways, in workers with
MSIs (experimental group) and workers without any lesions (comparative group). This images
that captures the division was performed in order to be able to make the comparison and see
if in fact if there are differences in the images of a patient with lesion and the one without
injury.
4.2.3 – Environmental Preparation Protocol and Patient
There are some factors that can influence the examination of thermography as this requires
some specific conditions, as the place where the examination will be performed. The
environment must be controlled, the room temperature should be maintained between 18ºC to
23ºC, being 21 º C the ideal, and the relative humidity is also a factor to be controlled.
Before the examination be performed, the patient should strip the area where the affected
zone is located and wait for 15 minutes for your body to adapt to room temperature. This should
not contain drafts and heat sources such as sunlight and incandescent bulbs.
The patient fill out a questionnaire where he was asked if he smoked, drank coffee / tea /
alcohol, if he used lotion or moisturizing cream in the precedent two hours because all these
types of behaviours are factors that can influence the temperature of the skin. Artefacts
resulting from thermal clothes or the external environment have been eliminated because
temperature change will occur on the body surface very slowly and evenly.
Images can be viewed through a computer, so the doctor can acquire images from different
regions, and identified them if they are cold or hot (hyperthermic - high blood flow zone). A
professional in this field will be able to identify various diseases, in this case MSIs.
4.2.4 – Materials Used
In this research the materials used were as follows:
Informed consent
Quiz
Camera
The Sony camera (figure 4.1) was used to get a photo of the exact location where the
patient feelt pain.

52 Methodological Procedures
Figure 4.1 – Camera Sony [115].
Pen and paper
Hygrometer and tape measure (Figure 4.2)
Figure 4.2 – Hygrometer and tape measure [116].
Tripod
Thermal camera Gobi-384 Industrial (Xenics)
Thermal images were recorded with a thermal camera (figure 4.3). The main features of
this thermal camera are showned in table 4.1.

Materials and Methods 53
Figure 4.3 – Thermal Camera Gobi-384 Industrial (Xenics) [117].
Table 4.1 – Characteristics of thermal camera Gobi-384 Industrial (Xenics) [117].
Camera Specifications Gobi-384
Focal length 18 mm f/1,HFOV 38º, standard manual focus
Window of interest Minimum size 160 x 80
Power consumption 3.6 W
Power supply 12 V DC
Ambient operating temperature 0º C to 50º C
Weight camera head <500 g (Lens not included)
Spectral band 8 µm to 14 µm
Pixels 384 x 288
Thermal camera Fluke Ti25
Access to this chamber was scarcer, it was only used to calibrate the camera described
above (figure 4.4). The main features of this thermal camera are shown in table 4.2.
Figure 4.4 – Thermal Camera Fluke Ti25 [118].

54 Methodological Procedures
Table 4.2 – Characteristics of thermal camera Fluke Ti25 [118].
Camera specifications Fluke Ti25
Range of temperature measurement (Uncalibrated below -10º C)
-20 º C to + 350º C (two ranges)
Precision ± 2º C or 2 % (whichever is greater)
Emissivity correction on the screen Yes
Window of interest 25º x 17º
Spectral band of infrared 7,5 µm to 14 µm
Camera visual images Resolution 640 x 480
Pallets Reddish tones, Blue-red, High contrast, Amber, Hot metal, Gray
Operating temperature 10º C to 50º C (14º F to 122º F)
Storage temperature -20º C to +50º C
Weight 1,2 Kg (2,65 Ib)
Computer
4.2.5 – Acquisition and Processing of Thermal Images
The thermal images were acquired at Continental Mabor SA - Tire Industry. The acquisition
of thermal images requires accuracy, and so the examination room should be prepared in
accordance with the rules and the patient must follow the necessary procedures in order to
obtain an accurate diagnosis, as already indicated above.
The test room was maintained closed throughout the realization of the data collection and
was maintained at a constant temperature of 21ºC, with a variation of + - 1 º C and relative
humidity between 50% and 70%. The focal distance was 1 meter and the emissivity of the patient
was set to 0.98.
As stated above, the patient had to remove the garment in the affected region and stand
about 15 minutes to allow thermal equilibrium with the ambient room temperature before
starting the examination. After 15 minutes it was captured an image with the photographic
camera only of the area that the patient indicates as a pain zone, so we can compare it and
gage to see if it coincides with the heat zone that thermal camera indicates. The time to
acquire thermal images was about 2 minutes as they were taken 4 images for each patient,
thus giving an interval of about 30 seconds per image. The images were acquired by a thermal
camera fixed to a tripod and the patients were positioned at 1 meter of distance from it and in
different positions according to MSIs. The capture of thermal imaging was performed through a
Gobi-384 of Infaimon Camara. A sotware Xeneth 2.5 - Xenics Graphical User Interface was used
to transfer the images to the computer. The software was also used to convert temperature
pixels in Digital 16 bits Numbers.
Calibration of Gobi-384 camera it could be performed through the use the Fluke Ti25
thermal camera, this camera provides a calibrated image.
The following table 4.3 are the features of all tested images represented that is the 26
actual cases of patients with injury and 26 real cases of patients without injury.
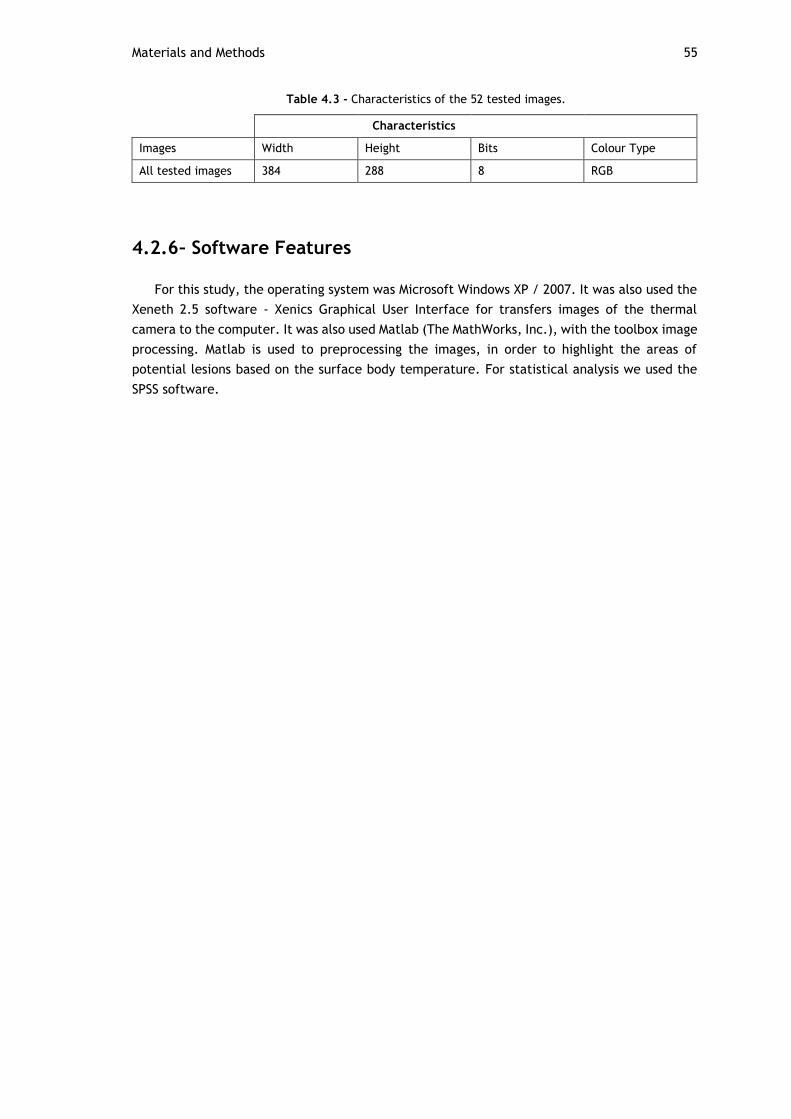
Materials and Methods 55
Table 4.3 - Characteristics of the 52 tested images.
Characteristics
Images Width Height Bits Colour Type
All tested images 384 288 8 RGB
4.2.6 – Software Features
For this study, the operating system was Microsoft Windows XP / 2007. It was also used the
Xeneth 2.5 software - Xenics Graphical User Interface for transfers images of the thermal
camera to the computer. It was also used Matlab (The MathWorks, Inc.), with the toolbox image
processing. Matlab is used to preprocessing the images, in order to highlight the areas of
potential lesions based on the surface body temperature. For statistical analysis we used the
SPSS software.

56

57
Chapter 5
5. Results
In this chapter it is presented a description of the different methodologies implemented in
study and its results. The techniques were implemented in MATLAB with 26 actual cases of
thermal images with MSIs (experimental group) and 26 real thermal imaging cases without any
injury (control group). These 26 injuries cases are variable, although all patients had their MSIs
in key areas of the body with increased risk (UL, spine and lower limbs). All images were
acquired through the Gobi-384 thermal camera and always in a controlled environment of 21º
C.
At first we present the results of the Patient Diagnosis, that was mad by a health
professional (nurse Continental Mabor - Industry S.A. tires).
In a second step, we present the thermal image of the experimental group and the control
group. At this time it will also be presented the results from processed images.
Lastly, automatic processing achieved for all thermal images using morphological
algorithms. The statistical analysis was also evaluated.
5.1 - Patient Diagnosis
There are many MSIs, but some of them are key injuries in the context of the present study
such as lumbago, omalgias, contractures, tendinitis, among others. These lesions are,
sometimes, difficult to detect, and, therefore also difficult to be diagnosed in a more specific
and detailed way. The injuries we focused have in common the fact of occurring very frequently
during industrial operations because workers are continuously exposed to very demanding
efforts and repetitive movements. These is a very common scenario in Continental Company as
we can see in Figure 5.1 where are represented the main complaints of workers MSIs of the last
year (2015).

58 Results
Figure 5.1 - Main complaints in 2015 at Continental Mabor [119].
Health professionals had a crucial participation in our study because they did the
appreciation and pointed the correct diagnosis of each patient.
Next, in Table 5.1, will be presented the diagnose of each worker, or an indication of the
musculoskeletal injury and a photo of the area where the patient felt pain. It is important to
underline that we don’t have pictures of all the patients because some of the subjects of the
study didn’t felt free to take pictures.
Table 5.1 – Patient Diagnosis.
Reference Image Diagnosis
Trapezius – 21/04/2016 Trapezius muscle contracture - right side
Shoulder – 29/04/2016 Tendinosis of the above-espinhal- left side
Foot – 02/05/2016 Bruising traumatic foot - right side
Fist – 02/015/2016 Ulnar Tendinitis - left side
Fist – 04/05/2016 Wrist strain - right side
Back – 04/05/2016 Muscle contracture in the back / lower back - center
Foot 1 – 05/05/2016 Fracture of the 5th finger - left side
Back – 05/05/2016 Muscle contracture in the back / lower back - right side
0100200300400500600700800900
Syn
dro
me
flu
/ f
eve
r
Wo
un
ds
oro
ph
aryn
geal
…
low
bac
k p
ain
pai
n in
th
e sh
ou
lde
r
oth
ers
gast
roin
test
inal
…
nec
k p
ain
do
rsal
gia
hea
dac
he
foo
t ac
he
Kn
ee
pai
n
wri
st p
ain
bu
rns
eye
dis
ord
er
han
d p
ain
elb
ow
pai
n
pai
n in
th
e le
g /
thig
h
pai
n in
th
e ar
m a
nd
…
gen
era
l an
d s
pec
ific
trau
ma
/ in
jury
mu
scu
losk
ele
tal…
oth
er…
fore
ign
bo
dy
in t
he
…
trau
ma
oth
er t
rau
ma
Work
ers
tim
e)

Patient Diagnosis 59
Foot 2 – 05/05/2016
Plantar fasciitis - right side
Back 1 – 06/05/2016
Non-specific low back stress (patient with degenerative diseases background) - center

60 Results
Back 2 – 06/05/2016
Non-specific low back stress - center
Back – 10/05/2016
Non-specific low back pain (pyramidal muscles) - center
Knee – 13/05/2016
Tendinitis tendon above - left front

Patient Diagnosis 61
Shoulder – 13/05/2016
Tendonitis of the rotators of the hood - left side
Trunk – 17/05/2016
Diffuse pain in the trunk - right side
Back – 18/05/2016
Low back pain - left side
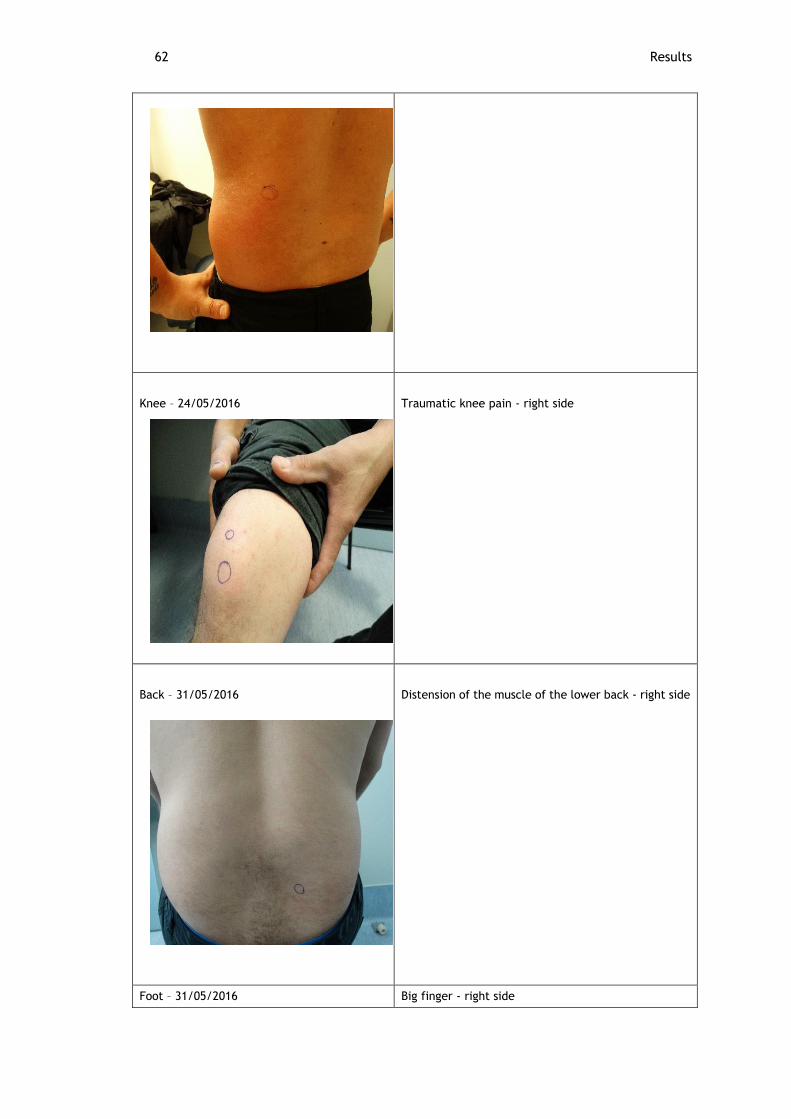
62 Results
Knee – 24/05/2016
Traumatic knee pain - right side
Back – 31/05/2016
Distension of the muscle of the lower back - right side
Foot – 31/05/2016 Big finger - right side

Patient Diagnosis 63
Trapezius – 31/05/2016
Contracture of the upper trapezius muscle - right side
Shoulder – 01/06/2016 Omalgia by inflammation of the rotator of the hood - left side
Foot – 01/06/2016 Sprain tibio-tarsal - right side
Trapezius – 15/06/2016 Trapezius muscle contracture - left side
Back – 16/06/2016 Non-specific low back pain - center
Shoulder – 28/06/2016
Omalgia by inflammation of the rotator of the hood - left side
Back – 20/07/2016
Non-specific low back pain - right side
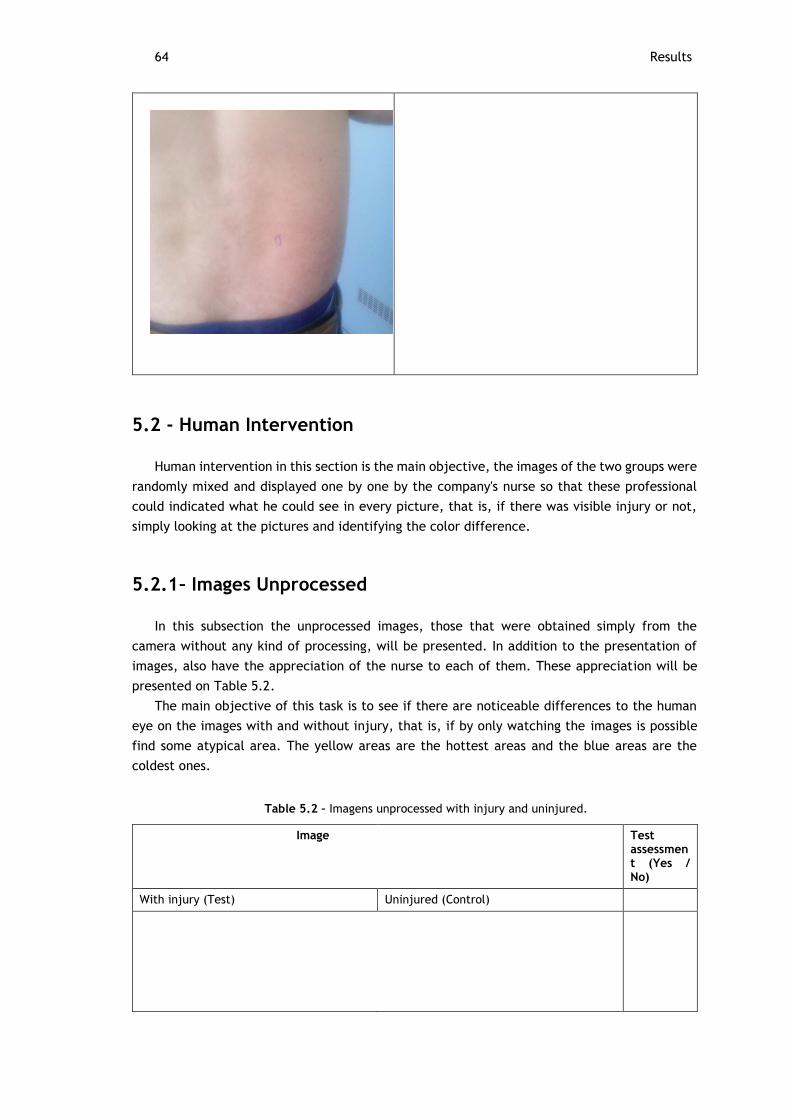
64 Results
5.2 - Human Intervention
Human intervention in this section is the main objective, the images of the two groups were
randomly mixed and displayed one by one by the company's nurse so that these professional
could indicated what he could see in every picture, that is, if there was visible injury or not,
simply looking at the pictures and identifying the color difference.
5.2.1 – Images Unprocessed
In this subsection the unprocessed images, those that were obtained simply from the
camera without any kind of processing, will be presented. In addition to the presentation of
images, also have the appreciation of the nurse to each of them. These appreciation will be
presented on Table 5.2.
The main objective of this task is to see if there are noticeable differences to the human
eye on the images with and without injury, that is, if by only watching the images is possible
find some atypical area. The yellow areas are the hottest areas and the blue areas are the
coldest ones.
Table 5.2 – Imagens unprocessed with injury and uninjured.
Image Test assessment (Yes / No)
With injury (Test) Uninjured (Control)

Human Intervention 65
Trapezius – 21/04/2016
06/06/2016
Yes
Shoulder – 29/04/2016
25/05/2016
No
Foot – 02/05/2016
1 – 29/07/2016
No

66 Results
Fist – 02/05/2016
06/06/2016
No
Fist – 04/05/2016
25/05/2016
No
Back – 04/05/2016
31/05/2016
Yes

Human Intervention 67
Foot 1 – 05/05/2016
25/05/2016
Yes
Back – 05/05/2016
1 – 08/06/2016
No
Foot 2 – 05/05/2016
29/07/2016
Yes

68 Results
Back 1 – 06/05/2016
2 – 08/06/2016
Yes
Back 2 – 06/05/2016
17/06/2016
No

Human Intervention 69
Back – 10/05/2016
25/05/2016
Yes
Knee – 13/05/2016
08/06/2016
No
Shoulder – 13/05/2016
Temperatura
Yes

70 Results
Trunk – 17/05/2016
29/06/2016
Yes
Back – 18/05/2016
2 – 31/05/2016
No
Knee – 24/05/2016
08/06/2016
Yes

Human Intervention 71
Back – 31/05/2016
1 – 31/05/2016
Yes
Foot – 31/05/2016
2 – 29/07/2016
Yes

72 Results
Trapezius – 31/05/2016 2 – 31/05/2016
Yes
Shoulder – 01/06/2016
25/05/2016
Yes
Foot – 01/06/2016
1 – 29/07/2016
Yes

Human Intervention 73
Trapezius – 15/06/2016
06/06/2016
No
Back – 16/06/2016
17/06/2016
Yes
Shoulder – 28/06/2016
25/05/2016
No

74 Results
5.3 - Automatic Processing
As in the previous subsection, here presented thermal images acquired by the same way:
the experimental group and the control group. The white areas are the possible injuries.
The processing and image analysis was performed using morphological algorithms, such as
the bwmorph and edge detection algorithms Sobel and regionprops. This is accompanied by
other MATLAB functions, such as Area, EulerNumber and PixelList. The morphological operators
were used to determine the region of interest in which the lesion is found. The developed
algorithm follows the following structure:
Back – 20/07/2016
27/05/2016
No

Human Intervention 75
5.3.1 – Experimental Group
In this subsection, thermal images was showed in Figure 5.2 with injury and their respective
processed images. Nevertheless, only 20 images are presented within the 26 real cases, because
in 6 images the program has not identified any injury.

76 Results
Trapezius – 21/04/2016
Foot – 02/05/2016
Fist – 04/05/2016
Back – 04/05/2016

Automatic Processing 77
Foot 1 – 05/05/2016
Foot 2 – 05/05/2016

78 Results
Back 1 – 06/05/2016
Back 2 – 06/05/2016
Back – 10/05/2016
Shoulder – 13/05/2016

Automatic Processing 79
Trunk – 17/05/2016
Back – 18/05/2016
Knee – 24/05/2016

80 Results
Back – 31/05/2016
Foot – 31/05/2016

Automatic Processing 81
Trapezius – 31/05/2016
Shoulder – 01/06/2016
Foot – 01/06/2016
Back – 16/06/2016

82 Results
Shoulder – 28/06/2016
5.3.2 – Control Group
The images of the control group, are images of participants that did not (supposedly)
contain any kind of injury. However, after the images are subject to the program, 4 potential
injuries in 4 patients have been identified. In this section, these images are displayed (Figure
5.3) and the respective processed image.
Trapezius - 06/06/2016
Figure 5.2- Processed images the experimental group.
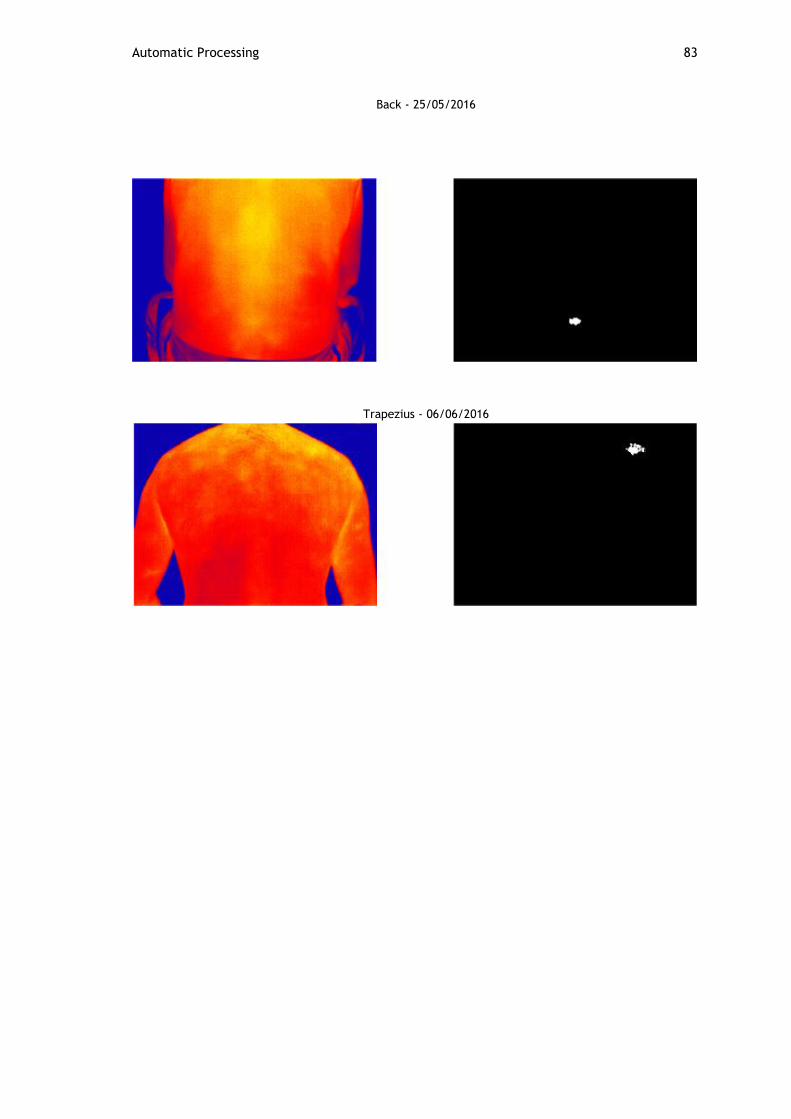
Automatic Processing 83
Back - 25/05/2016
Trapezius - 06/06/2016

84
Foot 1 – 29/07/2016
5.4 - Statistical Analysis
This section will display the statistical analysis of this project, where McNemar test was
used. This test is executed to analyze the difference between two paired variables of nominal
type. In present analysis three sets of paired variables were used: (1) Diagnosis & Diagnosis
Based on Thermal Images; (2) Diagnosis and Thermal Imaging Processed; (3) Diagnosis Based on
Thermal Images & Thermal Imaging Proceeded. Each variable contain the result (positive or
negative) from diagnosis (Table 5.3). The test statistic results are presented in Table 5.4.
Table 5.3 Results of Diagnosis.
Diagnosis Diagnosis Based on Thermal Images
Diagnosis of Thermal Imaging Processed
Injury Injury Injury
Injury Without injury Without injury
Injury Without injury Without injury
Injury Without injury Without injury
Injury Without injury Without injury
Injury Injury Injury
Injury Injury Injury
Injury Without injury Without injury
Injury Injury Injury
Figure 5.3 - Processed images the control group.

Statistical Analysis 85
Injury Injury Injury
Injury Without injury Without injury
Injury Injury Injury
Injury Without injury Injury
Injury Injury Injury
Injury Injury Injury
Injury Without injury Injury
Injury Injury Injury
Injury Injury Injury
Injury Injury Injury
Injury Injury Injury
Injury Injury Injury
Injury Injury Injury
Injury Without injury Injury
Injury Injury Injury
Injury Without injury Injury
Injury Without injury Injury
Table 5.4 – Test Statistics McNemar.
Diagnosis and Diagnosis Based on Thermal Images
Diagnosis and Thermal Imaging Processed
Diagnosis based on thermal images and Thermal Imaging Processed
N 26 26 26
Exact Significance (2-tailed) 0,001a 0,031a 0,063a
a. Binomial distribution used.
5.5 - Discussion of Results
In this chapter, it is presented a discussion regarding the results described in Chapter 5.
In first place, it will be made an analysis to the intervention of the health professional to
whom fell the task of identifying in every image the existence of a musculoskeletal injury.
In the first column of table 5.1 there’s a representation of images with lesion (experimental
group) and, in the second column of the same table was presented images that resulted from
control group that, as we know didn’t have any kind of musculoskeletal injury. The third column
represents the nurse appreciation regarding the obtained image with lesion.
As we observed all the images from first column have a lesion according to the subject
complaint and in acquiescence of the health professional.
To each thermal image with injury was associated a control image where in the body region
was the same but in different patients. These association was made in order to facilitate the

86 Results
nurse visualization task of the images. The images were shown to the nurse side by side, one
with the lesion and the other one without it, so the professional could indicate is expert input
at a naked eye. In short the nurse had the task of identifying, or not, a lesion, simple based on
colour differences. It was possible for the nurse to identify the images prevenient from the
workers with lesions and the control images.
These professional did not knew which of the images contained the injury but still he
managed to assess the patient's image and the control ones. From his evaluation it can be stated
that, according to the provided appreciation, not all the thermal images have lesions and that
founding came to be a contradiction to the worker complaint and even to the diagnosis
presented in section 5.1.
Yet, based on the results arising from the questionnaires there are very factors to be taken
in account as if the worker had a smoke in the previous two hours, drank alcohol, or a tea, or
coffee, if he practiced a physical activity or used some cosmetic / ointment on his skin in the
same period of time. After verifying that the nurse couldn’t identify lesions through the direct
observational process of the images, the relation of the images to the questioners was made.
Then it is found in the group of images where nurse said there were no injuries, the worker had
done some of the described activities that, as is know from literature, have influence on body
temperature.
From the appliance of all the procedures of our study we found an exceptional case that
was named the “back – 18/05/2016” case. In the image correspondent to this case it was found
a lesion but not in the region the worker had indicated and the nurse made the diagnose. The
situation seems to be related to the fact of treatment of the injury had been made before the
image was taken. In that treatment it was used a medical spray that is able to lower the body
temperature of the affected region. As the main characteristic of the camera is the detection
of body heat, and since affected regions are the warmer ones, the equipment couldn´t detect
anything, and so, instead of having an image with yellow colour, an image with purple colour
was collected.
All pictures in the experimental group were processed using Matlab software to verify
whether the processing is useful in these cases, these results are given in section 5.3 of the
previous section. The bwmorph function was used in order to determine the skeleton of the
image obtained at the end, which gave us an approximate outline of the original image using
the Sobel method. At last we use the regionprops algorithm that is accompanied by other Matlab
functions. The goal is to detect polygon whose area (in pixels - number of pixels defined by
nodes) is greater than 30 pixels.
As mentioned before this algorithm is accompanied by other Matlab functions as shown in
the table 3.3, but we only used some as the Area function because this is the one that lets us
know the number of pixels of a region, the EulerNumber that identifies the number of objects
that exist and subtracts those in the middle, and the PixelList whose function is to extract the
coordinates of an image of a particular region.
In section 5.3 it was shown the original and processed images as well as the images that
resulted from the preceding processing. From these task we came to the conclusion that the
use of thermal imaging could be useful to support the identification of injuries.
Regarding the control images there were 4 cases of workers that drew our attention. From
these cases we verified that, despite the fact that there was no pain or injury complain in the
beginning of the process, we were able to detect injuries from the evaluation of the obtained
images. From the analysis of the thermal image we verify that may exist an injury in the body

Discussion of Results 87
region the camera point to be hotter. In order to test these findings we made, in section 5.4,
the processing of the images of these 4 patients, always applying the algorithms previously
referenced. The same procedures were taken in the control images but we couldn’t identify
anything so we gave up presenting the images, considering they were completed black.
Despite the fact that we came to prove efficient in the studied method it is not possible to
firm the exact conviction that the worker as, in fact, an injury, and, for the scientific
establishment of that it is necessary to made a clinical exam in a credentialed hospital.
For the statistical analysis of the results obtained through the image processing are
according to the assessment made by the nurse based on thermal imaging. By the same analysis
verifies that the diagnosis is different from the diagnosis based on the images and also the
results of the processed images, that is there is a difference in the first group (diagnosis and
diagnosis based on thermal images) and second group (Diagnostic and processed thermal
imaging). This difference may be due to the fact that the nurse did not have access to any
confirmation tool or support the development donates patient diagnosis.
Thus, thermal imaging can contribute in order to bridge an existing fault, requiring extra
exams.
5.6 - Conclusions
In this work was presented the nursing diagnosis for each patient as well as the picture of
the spot of the lesion. All 52 cases of thermal images were exposed and processed yet not every
one of them were showed in the study because they didn´t had any lesion to show and, for that
reason, the program developed the image in black. Therefor only 26 images were used and
processed being that 20 of them are images that correspond to the experimental group and 4
correspond to the control group. In all pictures the procedure was carried out through several
morphological algorithms. In these study it were used the functions bwmorph and edge, that
many algorithms, the Sobel algorithm came to be the most effective one in relation to the
objective of our study. Lastly is necessary to mention that algorithm regionprops also was used.
Specifically, the used function were Area, EulerNumber and PixelList.
All techniques were implemented in MATLAB as a computational tool in order to test its
effectiveness.

88
Chapter 6
6. Conclusions
The job environment should helps prevent fatigue and the occurrence of musculoskeletal
injuries thus preventing excessive overloading, repetitive motion and stress in the workplace.
Work related musculoskeletal injuries are one of the main causes of absenteeism at work,
and the most common problem of occupational health in Europe. These lesions affect different
regions of the human body, particularly the spine and upper limbs due to repeatability,
overloading and improper postures at work.
Infrared thermography can be used as an adjuvant evaluation method in many cases, as is
the case of MSIs related to work.
So, in this presented a study of thermography and musculoskeletal injuries and the
relationship between them, to try to make thermography a diagnostic tool musculoskeletal
injuries in an industrial activity sector in which the work is very demanding. The fact that
infrared thermography is a non-invasive technology and has no risk for the patient, makes
possible the conduction of multiple exams and leads us to the conclusion that in regarding the
MSIs problem a very efficient solution seems to be the use of thermography.
A set of thermal images with and without injuries, acquired through a thermal camera which
detects the heat produced by the human body, were user used to diagnose the presence and
location of muscular lesions either through a human expert and some image processing.
These cameras have some limitations like in the case “back– 18/05/2016” where a spray
for the treatment of the lesion was previously used serving as an external disturbance factor
for the diagnosis.
The evaluation to all the 52 cases analysed can sustain that the results were very satisfying
since it has possible to show that improved images through algorithms became an added value
not only for health professionals but also for patients, allowing a faster medical or therapeutic
intervention.
For some cases there are differences in the diagnosis of nurses and diagnosis based on the
images and also the results of the processed images. However this diagnostic difference may
be due to the technical fact contain no confirmation tool or support the preparation of the
patient's diagnosis.

Discussion of Results 89
6.1 - Proposal for Future Research
For future work it is intended the use any other diagnostic test (for example radiography)
beyond thermography in order to be able to identify exactly if there is damage in the muscular
system of a worker. These proposal is sustained in the fact that, as it was found, thermography
by itself, and even with nurse diagnosis, can, sometimes fail. One limitation that was found is
that, it’s important to have in mind that these process requires specific conditions, like a
thermal chamber, that many company’s may not have, so it was important to find other
methods of diagnosing muscular injuries. More test cases is intended to improve monitoring of
the conditions of purchase, and track clinical cases recording a history that might give more
clues to the diagnostics.

90
Appendix

Appendix A – Informed Consent

Appendix B – Nordic Musculoskeletal Questionnaire
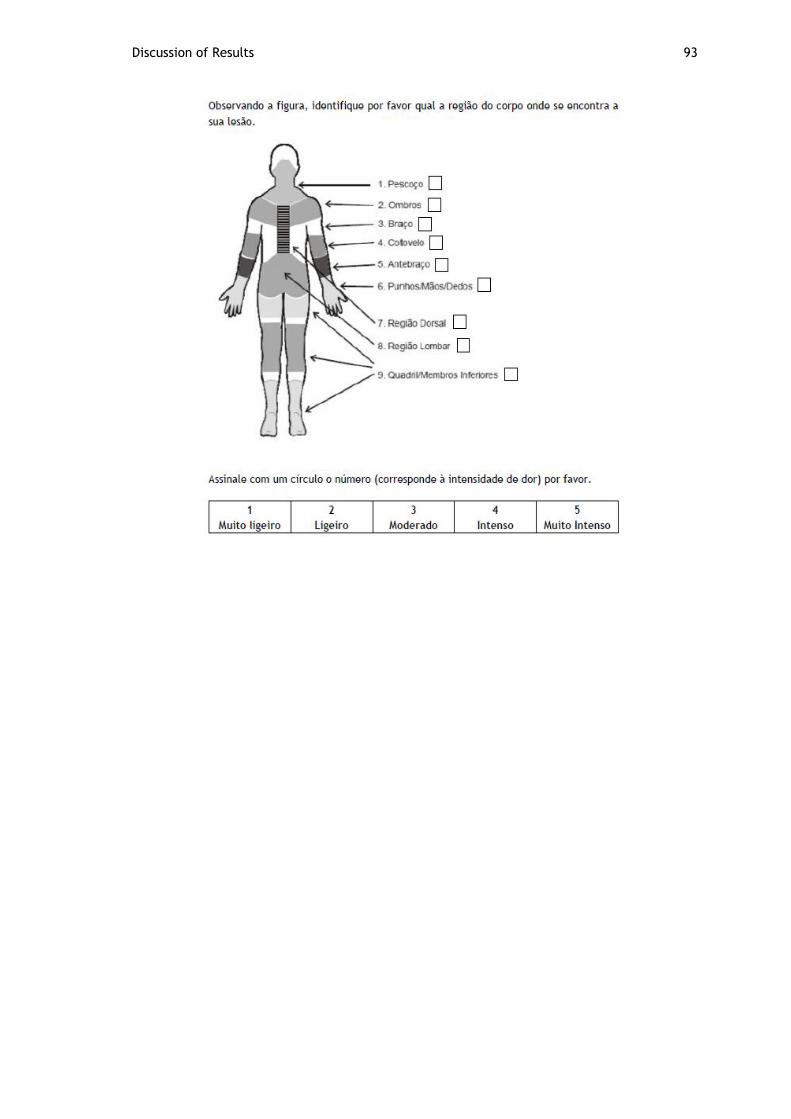
Discussion of Results 93


95
References
[1] G. C. Barroso and E. S. Thiele, “Muscle injuries in athletes”, vol. 46, no. 4, pp. 354–358,
2011.
[2] I. L. Nunes, and P. M. Bush, “Work-Related Musculoskeletal Disorders Assessment and
Prevention,” Ergon. Syst. Approach, pp. 1–31, 2011.
[3] European Agency for Safety and Health at Work, “Introduction to work - related
musculoskeletal disorders,” Facts, vol. 71, 2007.
[4] F. Serranheira, F. Lopes, and A. S. Uva, “Lesões Musculo-Esqueleticas (LME) e Trabalho:
Uma associação muito frequente.,” Saúde & Trabalho, pp. 59–88, 2005.
[5] D. Colombini and E. Occhipinti, “Preventing upper limb work-related musculoskeletal
disorders ( UL-WMSDS ): New approaches in job ( re ) design and current trends in
standardization”, vol. 37, pp. 441–450, 2006.
[6] Eurostat, Health and safety at work in Europe (1999–2007), Belgium: Publications Office
of the European Union, 2010.
[7] N. A. Diakides and J. D. Bronzino, Medical Infrared Imaging. CRC Press, 2008.
[8] E. Hidalgo Salvador, F. Álvarez González, and A. Salvador Luna, “Aplicación de la
termografía infrarroja en medicina legal . ¿ Prueba válida para la objetivación de los
síndromes dolorosos ? Disfunción temporomandibular Application of Infrared
thermography in legal medicine . Is it a valid test for an objective assessm,” Cuad Med
Forense, vol. 20, pp. 77–84, 2014.
[9] E. Sanchis-Sánchez, R. Salvador-Palmer, P. Codoñer-Franch, J. Martín, C. Vergara-
Hernández, J. Blasco, E. Ballester, E. Sanchis, R. González-Peña, and R. Cibrián,
“Infrared thermography is useful for ruling out fractures in paediatric emergencies,” Eur.
J. Pediatr., vol. 174, no. 4, pp. 493–499, 2015.
[10] J. I. Quesada, N. M. Guillamón, R. M. Anda, A. Psikuta, S. Annaheim, R. M. Rossi, M. C.
Salvador, P. Pérez-soriano, and R. S. Palmer, “Effect of perspiration on skin temperature
measurements by infrared thermography and contact thermometry during aerobic
cycling”, INFRARED Phys. Technol., 2015.
[11] C. Hildebrandt, K. Zeilberger, E. Francis, J. Ring, and C. Raschner, “The Application of
Medical Infrared Thermography in Sports Medicine,” 2007.
[12] M. L. Brioschi, A. J. Cherem, R. C. Ruiz, J. J. S. João, and F. M. R. M. Silva, “O uso da
termografia infravermelha na avaliação do retorno ao trabalho em programa
rehabilitation program ( PRA ),” Acta Fisiatr, vol. 16, no. 2, pp. 87 – 92, 2009.
[13] H. H. Al-Nakhli, J. S. Petrofsky, M. S. Laymon, and L. S. Berk, “The Use of Thermal Infra-
Red Imaging to Detect Delayed Onset Muscle Soreness,” J. Vis. Exp., no. January, pp. 1–
9, 2012.
[14] G. H. Neto, G. C. Ribeiro, and F. V. Valeri, “Processamento e Segmentação de
Mamogramas Digitais”, pages 1-6, n.d.

96 References
[15] G. Pretti, Direito do trabalho para concursos. IESDE Brasil S.A, 2011, pp.357.
[16] L. Guimarães and S.Grubits, Série saúde mental e trabalho. São Paulo: Casa do Psicólogo,
2004, pp.183-201.
[17] W. Marques, Diário de um Empreendedor. Brasil: Cianorte, 1994, pp. 320.
[18] P. Reis and A. Maro, Risco Ergonomico do Trabalho Repetitivo. Paco Editorial, 2014,
chapter 1.
[19] M. Rebelo, Ergonomia. 2005, pp. 1-5.
[20] J. Pereira, O CBMDF do Futuro. Brasilia: Clube de Autores, 2011, pp.147.
[21] M. Machado and C. Junior, “Demanda Ergonômica : O Caso Da Divisão De Integração E
Ensaios – Aie / Iae Do Centro Técnico Aeroespacial – Cta , Em São José Dos Campos" ,
2007.
[22] M. Tkáčová, P. Foffová, J. Živčák, and R. Hudák, “The methodics of medical
thermography in the diagnostics of the human body musculoskeletal system,” SAMI 2010 -
8th Int. Symp. Appl. Mach. Intell. Informatics, Proc., pp. 275–277, 2010.
[23] J. Aguiar, “Análise da fiabilidade e repetibilidade de ferramenta de análise ergonómica:
o exemplo simplificado do RULA”, p. 84, 2009.
[24] C. Hildebrandt, K. Zeilberger, E. Francis, J. Ring, and C. Raschner, “The Application of
Medical Infrared Thermography in Sports Medicine”, 2007.
[25] K. B. Hagen, P. E. R. Magnus, and K. Vetlesen, “Neck / shoulder and low-back disorders
in the forestry industry : relationship to work tasks and perceived psychosocial job
stress”, vol. 43, pp. 1510-1518, 1998.
[26] P. M. Arezes, J. S. Baptista, M. P. Barroso, P. Carneiro, P. Cordeiro, N.Costa, R. B. Melo,
A. S. Miguel, and G. Perestrelo, Occupational Safety and Hygiene - SHO2013, Portuguese
Society of Occupational Safety and Hygiene (SPOSHO), 2013, pp.32-111.
[27] M. Aptel, A. Aublet-Cuvelier, and J. C. Cnockaert, “Work-related musculoskeletal
disorders of the upper limb”, Jt. Bone Spine, vol. 69, no. 6, pp. 546–555, 2002.
[28] R. B. Fisioter and R. B. De Fisioterapia, “A look into Repetitive Strain Injury / Work-
Related Musculoskeletal Disorders within physical therapists ’ clinical context Um olhar
sobre as LER / DORT no contexto clínico do fisioterapeuta”, vol. 12, no. 1, pp. 49–56,
2008.
[29] A. S. Uva, F. Carnide, F. Serranheira, L. C. Miranda, and M. F. Lopes, “Lesões Músculo-
esqueléticas Relacionadas com o trabalho- Guia de Orientação para a Prevenção",
Portugal: Direcção Geral de Saúde, 2008.
[30] E. Schneider, X. Irastorza, and S. Copsey, "OSH in figures: Work-related musculoskeletal
disorders in the EU-Facts and figures", 2010.
[31] L. Cunha-Miranda, F. Carnide, and M. Lopes, “Prevalence of rheumatic occupational
diseases-PROUD study.,” Acta Reum Port, vol. 35, pp. 215–226, 2010.
[32] B. Widanarko, S. Legg, M. Stevenson, J. Devereux, A. Eng, A. T. Mannetje, S. Cheng, J.
Douwes, L. Ellison-Loschmann, D. McLean, and N. Pearce, “Prevalence of
musculoskeletal symptoms in relation to gender, age, and occupational/industrial
group,” Int. J. Ind. Ergon., vol. 41, no. 5, pp. 561–572, 2011.
[33] B. P. Bernard, M. D., M. P. H., “Musculoskeletal disorders and workplace factors: a
critical review of epidemiologic evidence for work-related musculoskeletal disorders of
the neck, upper extremity and low back”, Natl. Inst. Occup. Saf. Heal., no. July 1997,
1997.

References 97
[34] J. Živčák, L. Madarász, and R. Hudák, “Application of medical thermography in the
diagnostics of Carpal tunnel syndrome”, 12th IEEE Int. Symp. Comput. Intell. Informatics,
CINTI 2011 - Proc., pp. 535–539, 2011.
[35] K. T. Palmer, M. A. Dm, F. Ffom, and M. Mrc, “UKPMC Funders Group Carpal tunnel
syndrome : The role of occupational factors”, Best Pr. Res Clin Rheumatol, vol. 25, no. 1,
pp. 15–29, 2011.
[36] I. L. Nunes, and P. M. Bush, "Work-Related Musculoskeletal Disorders Assessment and
Prevention". Available http://www.intechopen.com/books/ergonomics-asystems-
approach/work-related-musculoskeletal-disorders-assessment-and-prevention. Acess
08/07/2016, 2012.
[37] K. T. Palmer, "Carpal tunnel syndrome: The role of occupational factors", Best Practice
& Research Clinical Rheumatology, pp. 15-29, 2011.
[38] D.A. Coelho, A.C. Harris, T.M. Lima, I. Janowitz, and D.M. Rempel, "Correlation between
different hand force assessment methods from an epidemiological study", Human Factors
and Ergonomics in Manufacturing & Service Industries, 2011.
[39] K. Ammer, L. Boltzmann, and P. Diagnostik, “Thermal Evaluation of Tennis Elbow”, no.
6, pp. 214–219.
[40] G. Y. Park, S. M. Lee, and M. Y. Lee, “Diagnostic Value of Ultrasonography for Clinical
Medial Epicondylitis”, Arch. Phys. Med. Rehabil., vol. 89, no. April, pp. 738–742, 2008.
[41] R. Shiri, E. Viikari-juntura, H. Varonen, and M. Helio, “Original Contribution Prevalence
and Determinants of Lateral and Medial Epicondylitis : A Population Study”, vol. 164, no.
11, pp. 1065–1074, 2006.
[42] J. De Souza and C. Gottfried, “Muscle injury: review of experimental models.”, J.
Electromyogr. Kinesiol., vol. 23, no. 6, pp. 1253–60, 2013.
[43] S.W.F. Middleton and J.E. Smith, “Muscle injuries”, Trauma, vol. 9, no. 1, pp. 5–11,
2007.
[44] T. A. H. Järvinen, T. L. N. Järvinen, M. Kääriäinen, H. Kalimo, and M. Järvinen, “Muscle
injuries: biology and treatment.”, Am. J. Sports Med., vol. 33, no. 5, pp. 745–64, 2005.
[45] Patient Education Center. Available
http://www.patienteducationcenter.org/articles/muscle-strain/. Acess
14/Jeneiro/2016.
[46] S. Stock, C. Dion-hubert, and S. Paquette, “Work-related Musculoskeletal Disorders
Guide and Tools for Modified Work”, pp. 1–63, 2005.
[47] A. I. Adebiyi, P. L. Parker, and L. L. Crumpton-young, “Using Thermography to Document
Pressure Points", Mississippi State University, pp. 5–7.
[48] A. B. Heberle, S. M. Ichisato, and P. Nohama, “Avaliação da mama na lactação por
termografia e presença de dor,” vol. 28, no. 3, pp. 256–263, 2015.
[49] M. Pavelski, E. Busato, and P. T. Dornbusch, “Infrared thermography evaluation from the
back region of healthy horses in controlled temperature room,” pp. 1274–1279, 2015.
[50] V. Redaelli, N. Ludwig, L. N. Costa, L. Crosta, J. Riva, and F. Luzi, “ Potential
application of thermography (IRT) in animal production and for animal welfare. A case
report of working dogs”,vol. 50, no.2, pp. 142–152, 2014.
[51] T. Turner, J. Pansch, and J. Wilson, “Thermographic assessment of racing
Thoroughbreds”, 47th Annual Conventional, vol. 47, pp. 344–346, 2001.
[52] T.A. Turner, “Diagnostic thermographic assessment of racing Thoroughbreds”, Vet. Clin.
North Am. Equine Pract., vol. 17,no. 1, pp. 95–113, 2001.

98 References
[53] S.E. Palmer, “Use of the portable infrared thermometer as a means of measuring limb
surface temperature in the horse”, Am. J. Vet. Res., vol. 42,no. 1, pp. 105–8, 1981.
[54] Dr Sircus.com. Available http://drsircus.com/medicine/low-body-temperature-
symptoms-causes-treat/. Access 21/Janeiro/2016.
[55] E. B. Neves, J. Vilaça-alves, C. Rosa, and V. M. Reis, “Thermography in Neurologic
Practice”, no. 1, pp. 24–27, 2015.
[56] A. Fitzgerald and J. B. Shaw, "Thermography as a screening and diagnostic tool: a
systematic review", The New Zealand Medical Journal, vol. 125, no. 1350, pp. 1–9, 2012.
[57] M. Alsaaod, A. Schaefer, W. Büscher, and A. Steiner, “The Role of Infrared Thermography
as a Non-Invasive Tool for the Detection of Lameness in Cattle,” Sensors, vol. 15, no. 6,
pp. 14513–14525, 2015.
[58] F. Bandeira, M. A. de Moura, M. A. de Souza, P. Nohama, and E. B. Neves, “Can
Thermography Aid in the Diagnosis of Muscle Injuries in Soccer Athletes?,” Rev. Bras.
Med. Do Esporte, vol. 18, no. 4, pp. 246–251, 2012.
[59] A. K. Saxena and G. H. Willital, “Infrared thermography : Experience from a decade of
pediatric imaging,” pp. 757–764, 2008.
[60] D. G. Aggelis, E. Z. Kordatos, D. V Soulioti, and T. E. Matikas, “Combined use of
thermography and ultrasound for the characterization of subsurface cracks in concrete,”
Constr. Build. Mater., vol. 24, no. 10, pp. 1888–1897, 2010.
[61] R. W. Waynant, Lasers in Medicine. Taylor & Francis Group, 2001, pp.325.
[62] M. Schaap, A. M. R. Schilham, K. J. Zuiderveld, M. Prokop, E.-J. Vonken, and W. J.
Niessen, “Fast noise reduction in computed tomography for improved 3-D visualization.,”
IEEE Trans. Med. Imaging, vol. 27, no. 8, pp. 1120–9, 2008.
[63] L. Bata, Advances in Liquid Crystal Research and Applications. Springer Sciense Business
Media, vol. 2, 1979, pp. 1305.
[64] A. G. Ghom, Textbook of Oral Radiology, Elsevier, pp. 665, 2008.
[65] J. Atlet and A. Rubio, Thermal Testing of Integrated Circuits, Springer Sciense Business
Media, 2002, pp. 201.
[66] A. H. Barrett, P. C. Myers, and N. L. Sadowsky, “Microwave thermography in the
detection of breast cancer”, Am. J. Roentgenol., vol. 134, no. 2, pp. 365–368, 1980.
[67] A. G. MacDonald, D. V Land, and R. D. Sturrock, “Microwave thermography as a
noninvasive assessment of disease activity in inflammatory arthritis.”, Clin. Rheumatol.,
vol. 13, no. 4, pp. 589–92, 1994.
[68] D. Land, “A clinical microwave thermography system”, IEE Proc. A Phys. Sci. Meas.
Instrumentation, Manag. Educ. Rev., vol. 134, no. 2, pp. 193–200, 1987.
[69] H. Fikackova, E. Ekberg, and C. Republic, “Can infrared thermography be a diagnostic
tool for arthralgia of the temporomandibular joint ?”, pp. 643–650, 2004.
[70] C. Hildebrandt, K. Zeilberger, E. Francis, J. Ring, and C. Raschner, “The Application of
Medical Infrared Thermography in Sports Medicine”, 2007.
[71] M. Alsaaod, C. Syring, J. Dietrich, M. G. Doherr, T. Gujan, and A. Steiner, “A field trial of
infrared thermography as a non-invasive diagnostic tool for early detection of digital
dermatitis in dairy cows”, Vet. J., vol. 199, no. 2, pp. 281–285, 2014.
[72] N. Ludwig, D. Formenti, M. Gargano, and G. Alberti, “Skin temperature evaluation by
Infrared Thermography: Comparison of Image Analysis Methods”, INFRARED Phys.
Technol., 2013.

References 99
[73] World Health Orgnatization, “Thermal Protection of the Newborn: a practical guide”.
Maternal and Safe Motherhood Programme, 1997.
[74] A. Arfaoui, M. A. Bouzid, H. Pron, R. Taiar, and G. Polidori, “Application of Infrared
Thermography as a Diagnostic Tool of Knee Osteoarthritis”, J. Therm. Sci. Technol., vol.
7, no. 1, pp. 227–235, 2012.
[75] I. Fernández-Cuevas, J. C. Bouzas Marins, J. Arnáiz Lastras, P. M. Gómez Carmona, S.
Piñonosa Cano, M. Á. García-Concepción, and M. Sillero-Quintana, “Classification of
factors influencing the use of infrared thermography in humans: A review”, Infrared
Phys. Technol., vol. 71, pp. 28–55, 2015.
[76] F. Bandeira, M. A. de Moura, M. A. de Souza, P. Nohama, and E. B. Neves, “Can
Thermography Aid in the Diagnosis of Muscle Injuries in Soccer Athletes?”, Rev. Bras.
Med. Do Esporte, vol. 18, no. 4, pp. 246–251, 2012.
[77] P. Marcos, L. Brioschi, P. Dra, and L. Tchia, “Diagnóstico Avançado em Dor por Imagem
Infravermelha e Outras Aplicações”, Medicine (Baltimore)., no. January 2016, pp. 93–98,
2007.
[78] L. V. Mendonça, M. M. Amaral, and P. S. Catarino, "A termografia por infravermelhos
como ferramenta para auxilio à inspecção e manutenção dos edifícios".
[79] M. . Clark, D. . McCann, and M. . Forde, “Application of infrared thermography to the
non-destructive testing of concrete and masonry bridges”, NDT E Int., vol. 36, no. 4, pp.
265–275, 2003.
[80] M. A. Bramson, Infrared Radiation: A Handbook for Applications, Springer Science
Business Media, pp. 615, 1968.
[81] M. Vollmer and K. -P. Mollmann, Infrared thermal Imaging: Fundamentals, Research and
Applications. Weinheim:Wiley-Vch Verlag CmbH & Co., 2010, pp. 1-25.
[82] X. Shen, G. Ding, J. Wei, L. Zhao, Y. Zhou, H. Deng, and L. Lao, “An infrared radiation
study of the biophysical characteristics of traditional moxibustion”, Complement. Ther.
Med., vol. 14, no. 3, pp. 213–219, 2006.
[83] E. B. Jones ans B. E. Noltingk, Instrument Tecnology: Measurement of temperature and
chemical composition, 4.e.d, Edit by B. E. Noltingk vol. 2, 1985.
[84] A. Irace, “Infrared Thermography application to functional and failure analysis of
electron devices and circuits”, Microelectron. Reliab., vol. 52, no. 9–10, pp. 2019–2023,
2012.
[85] InfraRedMed, "Fisica do Infravermelho".
[86] R. M. Plum, Fatigue crack detection on structural steel members by using ultrasound
excited thermography. Scientific Publishing, 2015, pp. 5 -94.
[87] M. Diakides, J. D. Bronzino, and D. R. Peterson, Medical Infrared Imaging: Principles and
Practices. New York: CRC Press, 2012, chapter 1.
[88] FLIR. Available http://www.flir.eu/home/. Access 21/Janeiro/2016.
[89] L. Madarász and J. Živčák, Aspects of Computational Intelligence: Theory and
Applications. New York: Springer-Verlag, 2013, pp.385.
[90] R. R. Seeley, P. Tate, and T. D. Stephens, Anatomy and Physiology, Eight. McGraw-Hill,
p. 1116, 2008.
[91] B. B. Lahiri, S. Bagavathiappan, T. Jayakumar, and J. Philip, “Medical applications of
infrared thermography: A review”, Infrared Phys. Technol., vol. 55, no. 4, pp. 221–235,
2012.

100 References
[92] A. Arfaoui, G. Polidori, R. Taiar, and C. Popa, “Infrared Thermography in Sports
Activity”. Infrared Thermogr., 2012.
[93] B. B. Lahiri, S. Bagavathiappan, T. Jayakumar, and J. Philip, “Medical applications of
infrared thermography: A review,” Infrared Phys. Technol., vol. 55, no. 4, pp. 221–235,
2012.
[94] S. Mohamed, M. Frize, and G. Comeau, “Assessment of piano-related injuries using
infrared imaging.”, Conf. Proc. IEEE Eng. Med. Biol. Soc., vol. 2011, pp. 4901–4, 2011.
[95] J. E. Gold, M. Cherniack, A. Hanlon, J. T. Dennerlein, and J. Dropkin, “Skin temperature
in the dorsal hand of office workers and severity of upper extremity musculoskeletal
disorders.”, Int. Arch. Occup. Environ. Health, vol. 82, no. 10, pp. 1281–92, 2009.
[96] J. E. Gold, M. Cherniack, and B. Buchholz, “Infrared thermography for examination of
skin temperature in the dorsal hand of office workers”, Eur. J. Appl. Physiol., vol. 93,
no. 1–2, pp. 245–251, 2004.
[97] N. K. Govindu and K. Babski-Reeves, “Reliability of thermal readings of the skin surface
over the anterior deltoid during intermittent, overhead tapping tasks”, Int. J. Ind.
Ergon., vol. 42, no. 1, pp. 136–142, 2012.
[98] J. E. Gold, M. Cherniack, A. Hanlon, and B. Soller, “Skin temperature and muscle blood
volume changes in the hand after typing”, Int. J. Ind. Ergon., vol. 40, no. 2, pp. 161–164,
2010.
[99] C. Paper and B. California, “Analysis of Temperature on the Surface of the Wrist in
Individuals Emulating an Operation with Highly Repetitive Movements Using Sensory
Thermographyn,o. JULY 2014, 2015.
[100] I. Bertmaring, K. Babski-reeves, and M. A. Nussbaum, “Infrared imaging of the anterior
deltoid during overhead static exertions”, pp. 37–41, 2014.
[101] L. M. Barker, L. E. Hughes, and K. L. Babski-Reeves, “Efficacy of Using Thermography
to Assess Shoulder Loads during Overhead Intermittent Work”, Proc. Hum. Factors Ergon.
Soc. Annu. Meet., vol. 50, no. 13, pp. 1313–1317, 2006.
[102] W. A. Sands, J. R. Mcneal, and M. H. Stone, “Thermal Imaging and Gymnastics Injuries :
a Means of Screening and Injury Identification”, Sci. Gymnast. J. online, vol. 3, no. 2,
pp. 5 – 12, 2011.
[103] A. C. de C. Andrade Filho, “Teletermografia: princípios físicos, fisiológicos e
fisiopatológicos da produção da imagem e suas indicações na clínica de dor e
reabilitação”, Acta Fisiátrica, vol. 6, no. 2, pp. 55–59, 1999.
[104] G. Tanda, “Skin temperature measurements by infrared thermography during running
exercise”, Exp. Therm. Fluid Sci., vol. 71, pp. 103–113, 2015.
[105] A. Seixas, A. Silva, J. Gabriel, and R. Vardasca, “The Effect of Whole-body Vibration in
the skin Temperature of Lower Extremities in Healthy Subjects”, 2012.
[106] M. Podnar and M. A. Bertsch, “Infrared thermography as diagnostic tool for
physiotherapeutic taping support of musicians”, Int. Symp. Perform. Sci., no. Bertsch
2011, pp. 505–510, 2013.
[107] T. Review, “Infrared thermal imaging in medicine”, vol. 33, 2012.
[108] R. Vardasca, E. Ring, P. Plassmann, C. D. Jones, J. Gabriel, “Using Clinical
Thermography as Diagnostic Complementary Procedure for Hand Arm Vibration
Syndrome”, 2012.
[109] R. Gonzalez, and R. Woods, “Processamento de Imgens Digitais”, Edgar Blucher, São
Paulo, 2000.

References 101
[110] R. C. Gonsalez, R. E. Woods and S. L. Eddins, Digital Image Processing Using MATLAB.
Pearson Prentice Hall, 2004, pp. 356-465.
[111] T. Sousa, and S. Correia, “Estudo de Técnicas de Realce de Imagens Digitais e suas
Aplicações”, 2007.
[112] T. Acharya, and AK. Ray , “Image Enhancement and Restoration”, Image Processing –
Principles an applications, pp. 105-128, 2005.
[113] C. Mesquita, J. Ribeiro, & P. Moreira, "Portuguese version of the standardized Nordic
musculoskeletal questionnaire: Cross cultural and reliability". Journal of Public Health,
vol. 18, no. 5, pp. 461-466. doi: 10.1007/s10389-010-0331-0, 2010.
[114] I.H. Reininga, M. el Moumni, S.K. Bulstra, M.G. Olthof, K.W. Wendt, & M. Stevens,
"Cross-cultural adaptation of the Dutch Short Musculoskeletal Function Assessment
Questionnaire (SMFA-NL): Internal consistency, validity, repeatability and
responsiveness". Injury, vol. 43, no. 6, pp. 726-733, 2012.
[115] Staples. Available http://www.staples.pt . Access 18/Julho/2016.
[116] Leroy Merlin. Available http://www.leroymerlin.pt . Access 18/Julho/2016.
[117] Xenics . Available
http://www.bockoptronics.ca/bockoptronics/pdf/xenics/gobi_384_industrial.pdf . Acess
20/Julho/2016.
[118] Fluke. Available http://www.fluke.com . Access 20/Julho/2016.
[119] Continental Mabor, Continental Mabor, Lousado, Portugal, 2016.