the use of single-specimen techniques for measuring upper
TRANSCRIPT

OPEN REPORT SCKbullCEN-BLG-1016
The Use of Single-Specimen Techniques for Measuring Upper Shelf Toughness Properties under Impact Loading Rates
Convention TRACTEBELSCKbullCEN 2005 Task 115
E Lucon
September 2005
SCKbullCEN Boeretang 200 2400 Mol Belgium
OPEN REPORT OF THE BELGIAN NUCLEAR RESEARCH CENTRE SCKbullCEN-BLG-1016
The Use of Single-Specimen Techniques for Measuring Upper Shelf Toughness Properties under Impact Loading Rates
Convention TRACTEBELSCKbullCEN 2005 Task 115
E Lucon
September 2005 Status Unclassified ISSN 1379-2407
SCKbullCEN Boeretang 200 2400 Mol Belgium
Name Institute Number E Lucon SCKbullCEN RMO 1
J-L Puzzolante SCKbullCEN RMO 1
J Schuurmans SCKbullCEN RMO 1
M Scibetta SCKbullCEN RMO 1
E van Walle SCKbullCEN RMO 1
Secretariaat RMO 3
R Geacuterard Tractebel Engineering 3
copy SCKbullCEN Belgian Nuclear Research Centre Boeretang 200 2400 Mol Belgium Phone +32 14 33 21 11 Fax +32 14 31 50 21 httpwwwsckcenbe Contact Knowledge Centre librarysckcenbe
RESTRICTED
All property rights and copyright are reserved Any communication or reproduction of this document and any communication or use of its content without explicit authorization is prohibited Any infringement to this rule is illegal and entitles to claim damages from the infringer without prejudice to any other right in case of granting a patent or registration in the field of intellectual property SCKbullCEN Studiecentrum voor KernenergieCentre dEtude de lEnergie Nucleacuteaire Stichting van Openbaar Nut ndash Fondation dUtiliteacute Publique - Foundation of Public Utility Registered Office Avenue Herrmann Debroux 40 ndash B-1160 Brussel Operational Office Boeretang 200 2400 Mol Belgium
BLG 1016 - Page 1 of 24
Table of contents Table of contents 1 Abstract 1 Keywords 1 1 Introduction 2 2 Materials and experimental 3 3 Single-specimen analyses of low-blow tests8
31 Pre-treatment of the forcedeflection traces double fitting procedure 8 32 The Normalization Data Reduction (NDR) technique9
321 Discussion 12 33 Analytical 3-parameter approach (Schindlers Key-Curve method) 12
331 Discussion 15 34 Chaouadis approach15
341 Discussion 20 4 Overall comparative analysis and conclusions20 Acknowledgments23 References 23
BLG 1016 - Page 1 of 24
Abstract The multiple-specimen method (low-blow or stop-block tests) is the conventional approach for measuring the upper shelf fracture toughness of metallic materials under impact loading rates typically fatigue precracked Charpy specimens tested on an instrumented pendulum machine The method is fairly simple but requires a relatively large number of specimens Nowadays several single-specimen methods are available which are purely based on the analysis of the instrumented forcedisplacement trace they dont need any dedicated instrumentation for the measurement of crack extension during the test Three of these techniques have been applied in this work to low-blow tests performed at different temperatures on two significantly different RPV steels (20MnMoNi55 and JSPS) the Normalization Data Reduction (NDR) technique Schindlers Analytical 3-Parameter Approach and Chaouadis method Analyses have been performed after applying a double fitting approach to the raw test data which allows selecting a limited set of forcedisplacement data which are representative of the whole instrumented trace Results show that all three methods provide acceptable accuracy in terms of both ductile crack initiation and resistance to crack propagation (tearing modulus) However for this type of analysis we recommend the use of the more widely accepted NDR technique which is described in detail in the ASTM E1820-01 standard (although the limitations on data smoothness presently enforced in the standard seem incompatible with the oscillations of a typical dynamic PCCv curve)
Keywords
Multiple-specimen method low-blow tests upper shelf toughness precracked Charpy specimens instrumented impact tests single-specimen methods Normalization Data Reduction Schindlers key curve Chaouadis approach tearing modulus
BLG 1016 - Page 2 of 24
1 Introduction The knowledge of dynamic mechanical properties is useful in all circumstances where strain rate sensitivity of a metallic material is an issue and whenever the actual loading conditions for a structure (either in normal operation or under accidental circumstances) are different from static Furthermore in some investigations increasing the strain (loading) rate in a mechanical test is used to simulate other embrittling mechanisms such as heat treatments or exposure to neutron irradiation The instrumentation of the pendulum striker in a Charpy test allows measuring dynamic fracture toughness on fatigue precracked specimens and consequently use the results for structural integrity assessments For a precracked Charpy (PCCv) specimen with aW asymp 05 tested at 15 ms the corresponding loading rate expressed in terms of increase of stress
intensity factor Kbull
is of the order of 105 MParadicms As far as fracture toughness test standards are concerned most documents nowadays contain provisions for testing at loading rates above the so-called quasi-static regime If we limit ourselves to current ASTM standards we note the following as a function of the mechanical response of the tested material
rarr Brittle behaviour (lower shelf) both the E399-90 and the E1820-01 standards prescribe a range of increase of stress intensity factor between 055 and 275 MParadicms Above this upper limit the user is redirected to Annex A7 (E399) or Annex A13 (E1820) but in both cases the requirements given do not include impact or quasi-impact testing (free-falling or swinging masses)
rarr Ductile-to-brittle transition regime the current version of E1921 (2005) limits the loading rate to 2 MParadicms below this limit the influence of loading rate on the reference temperature is expected to be less than 10 degC No specific provisions are given for higher loading rates although an Annex is currently in preparation within the responsible ASTM committee which should eventually cover high-rate tests (including precracked Charpy tests) Several investigations [123] have shown that the Master Curve analysis is however fully applicable to fracture toughness data obtained under dynamic conditions a semi-empirical correlation between the increase of To and the loading rate has also been established [1]
rarr Ductile behaviour (upper shelf) the E1820-01 standard contains an Annex (A14) titled Rapid-load J-integral Fracture Toughness Testing which is applicable when the loading rate exceeds the value allowed for conventional (static) testing which corresponds to reaching the load Pf (used for fatigue precracking) in 01 min However limitations are imposed to the maximum tolerable oscillations in the elastic portion of the forcedisplacement trace which are generally incompatible with an actual instrumented impact test on a precracked Charpy specimen
Two other widely used fracture toughness test standards cannot in principle be applied to impact-tested PCCv specimens ISO 121352002 (which is restricted to quasi-static loading rates up to 3 MParadicms) and BS 7448 Part 3 (which can be used for loading rates up to 3000 MParadicms) In the upper shelf regime the most commonly used method for determining ductile crack initiation and the crack resistance curve is the multiple-specimen technique whereby each
BLG 1016 - Page 3 of 24
sample provides one J-∆a point and the different specimens are tested up to varying amounts of ductile crack extension Two approaches can be used for obtaining different degrees of crack propagation bull the low-blow test in which each specimen is tested at a different velocity and with different
potential energy but in all cases such as not to fully break the sample bull the stop block test where the different amounts of crack extension are obtained by varying the
arrest position of the striker but again avoiding complete fracture of the specimen Both these techniques are described in the Test Procedure which is being developed by the ESIS Technical Committee 5 [4] The multiple-specimen technique is regarded as the reference method Because of the nature of the impact test itself the use of more conventional single-specimen techniques such as Unloading Compliance or Potential Drop is not feasible However new analytical approaches to the analysis of an individual forcedeflection trace have recently surfaced
rarr the Normalization Data Reduction (NDR) technique which is fully described in Annex A15 of E1820-01 and Annex 4 of the ESIS TC5 Test Procedure
rarr the Analytical 3-Parameter Approach proposed by Schindler and included in Annex 4 of the ESIS TC5 Test Procedure
rarr a model proposed by R Chaouadi and developed in 2003 for the TractebelSCKbullCEN Convention
The purpose of this investigation is to assess the applicability and reliability of these analytical single-specimen techniques for the determination of upper shelf dynamic toughness properties based on the comparison with results obtained using the more conventional multiple-specimen (low-blow test) technique Indeed it is desirable to validate a single-specimen technique which would be effectively applicable to dynamic J-R measurements in the upper shelf regime without having to use the material-consuming multiple-specimen approach
2 Materials and experimental Two well characterized RPV steels with clearly different mechanical properties have been selected for this investigation The DIN 20MnMoNi55 steel comes from a forged boiler bottom segment and its chemical composition (shown in Table 1) is similar to A533B Cl1 Its main mechanical properties [5] are given in Table 2
Table 1 - Chemical composition of 20MnMoNi55 (weight - Fe balance)
C Si Mn S P Cr V Cu Al Ni Mo Sn Co As Sb Ti 019 02 129 0008 0007 012 002 011 0015 08 053 0012 0014 003 003 005
Table 2 - Main mechanical properties of 20MnMoNi55 [5]
Rp02 (MPa)
Rm (MPa)
εu ()
εt ()
RA ()
T41J (degC)
T68J (degC)
USE (J)
FATT (degC)
T089mm (degC)
To (degC)
429 576 11 22 73 -76 -58 181 -24 -68 -126
LEGEND Rp02 Rm εu εt RA = yield strength tensile strength uniform elongation total elongation and reduction of area (at RT)
BLG 1016 - Page 4 of 24
T41J T68J FATT T089mm = temperatures corresponding to 41J and 68J absorbed energy 50 shear fracture appearance and 089 mm lateral expansion from Charpy tests To = quasi-static reference temperature measured on PCCv specimens with the Master Curve methodology
The other material JSPS is a Japanese RPV steel of the A533B type deliberately embrittled by increasing the concentration of S and P to simulate the degradation in toughness caused by neutron exposure This steel was used by the Japan Society for the Promotion of Science (hence the name) in a Round-Robin exercise on fracture toughness measurements using Compact Tension specimens [6] Its chemical composition and main mechanical properties are shown in Table 3 and Table 4 respectively
Table 3 - Chemical composition of JSPS (weight - Fe balance)
C Si Mn S P Cr Cu Ni Mo 024 041 152 0023 0028 008 019 043 049
Table 4 - Main mechanical properties of JSPS [6]
Rp02 (MPa)
Rm (MPa)
εu ()
εt ()
RA ()
T41J (degC)
T68J (degC)
USE (J)
FATT (degC)
T089mm (degC)
To (degC)
461 639 11 18 59 34 101 72 43 40 -7 For both materials low-blow impact tests have been performed on fatigue precracked Charpy specimens using an instrumented striker conforming to the ISO 145562000 standard (tup radius = 2 mm) Tests have been executed at two different temperatures RT (23 degC) and 290 degC for 20MnMoNi55 100 and 290 degC for JSPS All tested specimens were plain-sided Individual test results are collected in Table 5 for 20MnMoNi55 and Table 6 for JSPS Annex 1 and Annex 2 contain the instrumented Charpy reports
Table 5 - Results of the low-blow tests performed on PCCv specimens of the 20MnMoNi55 steel
Specimen code
T (degC)
B (mm)
W (mm)
ao (mm)
vo (ms)
Ep (J)
KV (J)
∆a (mm)
J (kJmsup2)
Ji
[kJ(msup2s)]
MMN-1113-L 9919 9957 5038 099 1001 913 0256 36917 1045E+5 MMN-1009-R 9914 9953 5112 120 1494 1387 0368 55817 1380E+5 MMN-1006-R 9900 9936 5251 140 2004 1864 0535 77472 1679E+5 MMN-1009-L 9956 9967 5202 157 2502 2342 1050 91663 1728E+5 MMN-1114-L 9904 9934 5172 172 2998 2813 1302 108812 1915E+5 MMN-1007-R 9931 9945 5300 180 3314 3143 1605 120873 1871E+5 MMN-1002-R 9926 9967 5043 188 3614 3430 1787 123520 1925E+5 MMN-1111-R
23
9940 9923 5439 199 4015 3897 2452 142851 1506E+5 MMN-1003-L 9867 9940 5026 099 997 949 0347 37219 0897E+5 MMN-1007-L 9928 9962 5281 122 1507 1445 0539 57769 1136E+5 MMN-1002-L 9913 9936 5018 140 2004 1924 0601 74170 1435E+5 MMN-1112-R 9909 9952 5261 157 2502 2403 0871 97015 1674E+5 MMN-1113-R 9942 9957 5164 171 2992 2893 1238 111106 1759E+5 MMN-1006-L 9898 9956 4908 185 3472 3354 1608 121762 1710E+5 MMN-1003-R
290
9886 9932 5128 192 3765 3677 2412 134786 1463E+5
BLG 1016 - Page 5 of 24
Table 6 - Results of the low-blow tests performed on PCCv specimens of the JSPS steel
Specimen code
T (degC)
B (mm)
W (mm)
ao (mm)
vo (ms)
Ep (J)
KV (J)
∆a (mm)
J (kJmsup2)
Ji
[kJ(msup2s)]
JSP6_1 9945 10002 5401 089 808 743 0511 31193 0823E+5 JSP6_2 9932 10080 5309 109 1206 1116 0573 45046 1085E+5 JSP6_3 9946 9973 5457 125 1596 1538 1781 56970 0860E+5 JSP6_4
100
9935 10000 5360 140 2008 1974 2855 64493 0650E+5 JSPS-4-2-25-A 9966 10069 5656 078 619 949 0351 25109 0606E+5 JSPS-1-1-27-A 10000 10002 4929 089 802 1445 0587 27774 0697E+5 JSPS-4-2-1-A 9885 9943 5347 089 802 1924 1011 30366 0702E+5
JSPS-4-2-20-A 10050 10050 5459 109 1206 2403 1561 43427 0748E+5 JSPS-502-L 9897 9940 5149 120 1494 1435 2036 51537 0813E+5 JSPS-506-L 9945 9962 5294 130 1731 1680 2206 58816 0842E+5 JSPS-507-L
290
9837 9919 5181 134 1840 1798 2789 60659 0707E+5
LEGEND B W ao = specimen thickness specimen width and initial crack length vo = impact velocity Ep = potential energy KV = absorbed energy ∆a = measured ductile crack extension J =
value of J-integral at test termination Ji
= loading rate obtained dividing J by the time at test termination
Test results have been analyzed in accordance with the ASTM E1820-01 standard for the obtainment of the critical J-integral value at initiation and the crack resistance curve In the analyses a correction for crack growth has been applied to the multiple-specimen J values for consistency with single-specimen techniques (incremental formula for calculating J) For this purpose use has been made of a recent proposal by K Wallin [7] which should be incorporated in the forthcoming revision of E1820 In the analysis of dynamic data tensile properties measured from dynamic tensile tests at relevant strain rates have been used The results of the multispecimen analyses are given in Table 7 (critical J values ndash J02mm and JQ) and Figure 1 to Figure 4 (J-R curves) In both the Table and the Figures a comparison is presented between dynamic and quasi-static J-R curves for the different materials and temperatures the static curves were obtained using the Unloading Compliance method An increase of initiation toughness and tearing resistance with increasing loading rate is quite visible in all instances as expected on the basis of available literature on the topic [8] A tendency of loading rate effects to be more pronounced at higher temperatures is also observed attempting an interpretation of this trend is however outside the scope of this work The results presented fully confirm the large difference in upper shelf toughness between the two RPV steels Annex 3 (20MnMoNi55) and Annex 4 (JSPS) report detailed J-integral calculations for all specimens tested Table 7 - Critical J-integral values obtained from the analysis of multiple-specimen (dynamic low-blow) and single-specimen (quasi-static) tests
Material T (degC)
Loading rate
J02mm (kJmsup2)
JQ (kJmsup2)
Dynamic 3762 9218 23 Quasi-static 2599 5939 Dynamic 3144 11173 20MnMoNi55
290 Quasi-static 2117 3313
BLG 1016 - Page 6 of 24
Material T (degC)
Loading rate
J02mm (kJmsup2)
JQ (kJmsup2)
Dynamic 2658 3661 100 Quasi-static 1703 2107 Dynamic 1729 2532 JSPS
290 Quasi-static 688 792
0
250
500
750
1000
1250
1500
0 05 1 15 2 25 3 35
Crack extension (mm)
J-in
tegr
al (k
Jm
sup2)
JQst
JQdyn
Figure 1 - Dynamic (red) and quasi-static (blue) J-R curves obtained on 20MnMoNi55 at RT
0
300
600
900
1200
1500
1800
0 05 1 15 2 25 3 35
Crack extension (mm)
J-in
tegr
al (k
Jm
sup2)
JQst
JQdyn
Figure 2 - Dynamic (red) and quasi-static (blue) J-R curves obtained on 20MnMoNi55 at 290 degC
BLG 1016 - Page 7 of 24
0
100
200
300
400
500
600
700
800
0 05 1 15 2 25 3 35 4
Crack extension (mm)
J-in
tegr
al (k
Jm
sup2)
JQst
JQdyn
Figure 3 - Dynamic (red) and quasi-static (blue) J-R curves obtained on JSPS at 100 degC
0
100
200
300
400
500
600
700
0 05 1 15 2 25 3 35 4 45 5
Crack extension (mm)
J-in
tegr
al (k
Jm
sup2)
JQst
JQdyn
Figure 4 - Dynamic (red) and quasi-static (blue) J-R curves obtained on JSPS at 290 degC
Among the low-blow tests reported in Table 7 only those with ductile crack growth larger than sim12 mm have been analyzed using the single-specimen methods described in the following chapter
BLG 1016 - Page 8 of 24
3 Single-specimen analyses of low-blow tests
31 Pre-treatment of the forcedeflection traces double fitting procedure In order for an instrumentred trace to be amenable to the calculations detailed below and minimise the noise on the resulting J-R curve a limited number of forcedeflection data pairs must be selected for the analysis and the dynamic oscillations superimposed to the trace have to be smoothed out For this purpose the instrumented trace of each test has been replaced by an idealized forcedeflection diagrams obtained through the following steps
(a) the linear elastic portion has been fitted by a straight line up to the force at general yield Fgy not accounting for the initial inertia peak
(b) the subsequent part of the curve (from Fgy to the data point corresponding to zero velocity) has been fitted by a fourth-order1 polynomial
(c) a discrete number of data points to be used for further analysis have been selected on the two fitting lines namely rarr 4 data points2 in the linear elastic portion equi-spaced between 0 and Fgy (the last one
coinciding with Fgy) rarr 40 data points2 in the plastic part of the curve equi-spaced between Fgy and the end of
the test (corresponding to v = 0)
An illustration of the procedure described above is shown in Figure 5
y = 16659x
y = -0002x4 + 00561x3 - 06039x2 + 21152x + 39274
0
1
2
3
4
5
6
7
8
0 1 2 3 4 5 6 7 8
Deflection (mm)
Forc
e (k
N)
Figure 5 - Specimen MMN-1111_R (20MnNiMo55 RT) selection of the data points for the single-specimen analyses
1 In a few cases polynomials of higher order (up to 6th) had to be used to obtain a satisfactory fitting 2 The choice of 4 data points in step 1 and 40 in step 2 is purely arbitrary A smaller or higher number of data points is not expected to influence the end results
BLG 1016 - Page 9 of 24
32 The Normalization Data Reduction (NDR) technique The NDR technique allows deriving a J-R curve directly from a forcedisplacement record together with initial and final crack size measurements taken from the specimen fracture surface It is particularly suited to instances where crack size monitoring during the tests (for example via compliance measurements) is not feasible such as tests at high loading rates It is based on the principle of load separation developed by Ernst et al [9] and has been exaustively described and validated for quasi-static upper shelf toughness tests on both C(T) and PCCv specimens in a previous investigation [10] The methodology cannot be used on fully broken specimens ie when (W ndash ao) = 0 since normalized force values would tend to infinite as a consequence dynamic J-R curves can only be obtained from low-blow (or stop block) tests The results obtained using the NDR technique on selected specimens are given in Table 8 (critical J-integral values) and Figure 6 to Figure 9 (single-specimen J-R curves compared with the multi-specimen J-R curve) Detailed analyses performed using the NDR method are reported in Annex 5 (20MnMoNi55) and Annex 6 (JSPS) Table 8 - Critical J-integral values obtained from the NDR analysis of selected low-blow tests compared with the outcome of the multiple-specimen analysis
Material T (degC)
Specimen code
∆a (mm)
J02mm (kJmsup2)
JQ (kJmsup2)
MMN_1114_L 1302 4801 10163 MMN_1007_R 1605 5950 11189 MMN_1002_R 1787 5853 10820 MMN_1111_R 2452 4165 9227
Average Standard deviation
5192 8601
10350 8604
23
Multiple-specimen 3762 9218 MMN_1113_R 1238 6160 10892 MMN_1113_R 1608 4376 11756 MMN_1003_R 2412 3860 9252
Average Standard deviation
4799 12069
10633 12717
20MnMoNi55
290
Multiple-specimen 3144 11173 JSP6_3 1781 2495 3500 JSP6_4 2855 2710 3659
Average 2602 3579 100
Multiple-specimen 2658 3661 4-2-20-A 1561 1602 2323
502_L 2036 1898 2717 506_L 2206 2129 3270 507_L 2789 1902 2876
Average Standard deviation
1883 2158
2796 3923
JSPS
290
Multiple-specimen 1729 2532
BLG 1016 - Page 10 of 24
0
300
600
900
1200
1500
1800
0 05 1 15 2 25 3 35
Crack extension (mm)
J-in
tegr
al (k
Jm
sup2)
Multi-specimen (low blow tests)MMN_1114_L (1302 mm)MMN_1007_R (1605 mm)MMN_1002_R (1787 mm)MMN_1111_R (2452 mm)
02mm
Figure 6 - Comparison between multiple-specimen (low-blow) and single-specimen (NDR) J-R curves for 20MnMoNi55 at RT
0
300
600
900
1200
1500
1800
0 05 1 15 2 25 3 35
Crack extension (mm)
J-in
tegr
al (k
Jm
sup2)
Multi-specimen (low blow tests)
MMN_1113_R (1238 mm)
MMN_1006_L (1608 mm)
MMN_1003_R (2412 mm)
02mm
Figure 7 - Comparison between multiple-specimen (low-blow) and single-specimen (NDR) J-R curves for 20MnMoNi55 at 290 degC
BLG 1016 - Page 11 of 24
0
100
200
300
400
500
600
700
800
0 05 1 15 2 25 3 35
Crack extension (mm)
J-in
tegr
al (k
Jm
sup2)
Multi-specimen (low blow tests)
JSP6_3 (1781 mm)
JSP6_4 (2855 mm)
02mm
Figure 8 - Comparison between multiple-specimen (low-blow) and single-specimen (NDR) J-R curves for JSPS at 100 degC
0
100
200
300
400
500
600
700
800
0 05 1 15 2 25 3 35
Crack extension (mm)
J-in
tegr
al (k
Jm
sup2)
Multi-specimen (low blow tests)4-2-20-A (1561 mm)502_L (2036 mm)506_L (2206 mm)507_L (2789 mm)
02mm
Figure 9 - Comparison between multiple-specimen (low-blow) and single-specimen (NDR) J-R curves for JSPS at 290 degC
BLG 1016 - Page 12 of 24
321 Discussion The agreement between multiple (low blow) and single (NDR) specimen results ranges from acceptable (20MnMoNi55 at RT Figure 6) to very good (JSPS at 100 degC Figure 8) In terms of initiation parameters (JQ) and considering mean values for the NDR analyses differences range from -49 to +123 Moreover the multiple-specimen value is always within plusmn1σ (σ = standard deviation) from the average value of the single-specimen analyses The NDR technique therefore appears to be an effective method for deriving single-specimen J-R curves under dynamic loading conditions
33 Analytical 3-parameter approach (Schindlers Key-Curve method) An estimation method for the J-R curve based on a continuous force-displacement diagram has been proposed by Schindler [1011] and is presently included in the latest draft of the ESIS TC5 Test Procedure [4] The J-R curve is given by
( )( )
22 1
121
pp p pI
t mppo
KJ W W aE p B W a
ην minus+
⎛ ⎞= sdot minus + sdot sdot sdot sdot∆⎜ ⎟
minus⎝ ⎠ (1)
with
1 2 2 3 4
3 2
26591090 1735 82 1418 1457gy i i i i i
IN
F S a a a a aKW W W W WBB W
⎡ ⎤sdot sdot ⎛ ⎞ ⎛ ⎞ ⎛ ⎞ ⎛ ⎞ ⎛ ⎞= sdot sdot minus sdot + sdot minus sdot + sdot⎢ ⎥⎜ ⎟ ⎜ ⎟ ⎜ ⎟ ⎜ ⎟ ⎜ ⎟⎝ ⎠ ⎝ ⎠ ⎝ ⎠ ⎝ ⎠ ⎝ ⎠⎢ ⎥⎣ ⎦
(2)
and
13 14
mp
t
Wp
W
minus⎛ ⎞
= sdot +⎜ ⎟⎝ ⎠
(3)
where Wt = total fracture energy Wmp = plastic component of the energy up to maximum force S = specimen span ai = current crack size (ai = ao + ∆a) Besides sample dimensions this approach only requires knowlegde of Fgy Wt and Wmp (3-parameter approach) Eqs(1-3) have been applied to the same low-blow tests already treated using the NDR technique However since the methodology is in principle applicable to fully broken specimens (unlike the NDR technique as previously mentioned) an additional test on a fully broken specimen (4-2-2-A JSPS 290 degC) has been analysed Results compared to multiple-specimen data are reported in Table 9 (initiation values) and Figure 10 to Figure 13 (J-R curves) Detailed analyses are given in Annex 7 (20MnMoNi55) and Annex 8 (JSPS)
BLG 1016 - Page 13 of 24
Table 9 - Critical J-integral values obtained from the application of Schindlers 3-parameter approach to selected low-blow tests compared with the outcome of the multiple-specimen analysis
Material T (degC)
Specimen code
∆a (mm)
J02mm (kJmsup2)
JQ (kJmsup2)
MMN_1114_L 1302 3763 7570 MMN_1007_R 1605 4033 8748 MMN_1002_R 1787 4020 8697 MMN_1111_R 2452 3801 9307
Average Standard deviation
3939 1522
8338 6661
23
Multiple-specimen 3762 9218 MMN_1113_R 1238 3560 8268 MMN_1113_R 1608 3517 8501 MMN_1003_R 2412 3586 9603
Average Standard deviation
3539 303
8384 1648
20MnMoNi55
290
Multiple-specimen 3144 11173 JSP6_3 1781 1645 2389 JSP6_4 2855 1883 2922
Average 1764 2656 100
Multiple-specimen 2658 3661 4-2-20-A 1561 1160 1969
502_L 2036 1514 2061 506_L 2206 1632 2361 507_L 2789 1584 2752
4-2-2-A () 4745 1558 2124 Average
Standard deviation 1473 2139
2286 3529
JSPS
290
Multiple-specimen 1729 2532
NOTE ndash () Fully broken specimen (impact velocity 157 ms)
0
300
600
900
1200
1500
1800
0 05 1 15 2 25 3 35
Crack extension (mm)
J-in
tegr
al (k
Nm
)
Multi-specimen (low-blow tests)
MMN-1114_L (1302 mm)
MMN-1007_R (1605 mm)
MMN-1002_R (1787 mm)
MMN-1111_R (2452 mm)
02mm
Figure 10 - Comparison between J-R curves obtained from the multiple-specimen (low-blow) and single-specimen (Schindlers key curve) approaches for 20MnMoNi55 at RT
BLG 1016 - Page 14 of 24
0
300
600
900
1200
1500
1800
0 05 1 15 2 25 3 35
Crack extension (mm)
J-in
tegr
al (k
Nm
)
Multi-specimen (low-blow tests)
MMN-1113_R (1238 mm)
MMN-1006_L (1608 mm)
MMN-1003_R (2412 mm)
02mm
Figure 11 - Comparison between J-R curves obtained from the multiple-specimen (low-blow) and single-specimen (Schindlers key curve) approaches for 20MnMoNi55 at 290 degC
0
100
200
300
400
500
600
700
800
900
0 05 1 15 2 25 3 35
Crack extension (mm)
J-in
tegr
al (k
Nm
)
Multi-specimen (low-blow tests)
JSP6_3 (1781 mm)
JSP6_4 (2855 mm)
02mm
Figure 12 - Comparison between J-R curves obtained from the multiple-specimen (low-blow) and single-specimen (Schindlers key curve) approaches for JSPS at 100 degC
BLG 1016 - Page 15 of 24
0
100
200
300
400
500
600
700
800
0 05 1 15 2 25 3 35
Crack extension (mm)
J-in
tegr
al (k
Nm
)
Multi-specimen (low-blow tests)4-2-20-A (1561 mm)502_L (2036 mm)506_L (2206 mm)507_L (2789 mm)4-2-2-A (4745 mm - full blow)
02mm
Figure 13 - Comparison between J-R curves obtained from the multiple-specimen (low-blow) and single-specimen (Schindlers key curve) approaches for JSPS at 290 degC
331 Discussion For Schindlers key curve approach the overall agreement with the multiple-specimen results is good although a tendency to underestimation is visible particularly in the ductile initiation region In terms of JQ the differences between multiple-specimen and single-specimen (mean value) range from -95 to -275 The slope of the multiple-specimen crack resistance curve is better reproduced for 20MnMoNi55 than for JSPS the scatter is somewhat lower than for the NDR technique This analytical method seems to provide a reasonable tendentially conservative approximation of the toughness properties measured with the multiple-specimen approach
34 Chaouadis approach Another analytical approach has been proposed by Chaouadi in the framework of the 2003 TractebelSCKbullCEN Convention [12] Like Schindlers method it is purely based on the analysis of the forcedisplacement test record and can be in principle applied to any specimen geometry and loading rate At any point on the forcedisplacement trace crack extension is related to the absorbed energy E via the following quadratic relationship
2
i
p t i
E Waa W W
⎛ ⎞minus∆= ⎜ ⎟∆ minus⎝ ⎠
(4)
BLG 1016 - Page 16 of 24
where ∆ap is the measured total crack extension Wt is the total absorbed energy and Wi is the absorbed energy at initiation The evaluation of this latter parameter is based on the assumption that on the forcedisplacement trace the onset of ductile tearing is located approximately
midway between general yield and maximum force (Figure 14) In other words 2
gy mi
F FF
+asymp
[13] The absorbed energy corresponding to Fi is obviously Wi to be used in eq (4)
Figure 14 - Onset of ductile crack initiation on a generic forcedisplacement record [1213]
The crack resistance curve can be expressed as
i tJ J J a= + ∆ (5) where Ji the initiation toughness is given by
( )i
io
WJB W a
η sdot=
minus (6)
and Jt the tearing resistance corresponds to
( )( )
t it
o p
W WJ
B W a aη sdot minus
=minus ∆
(7)
Note that eq(5) is not corrected for crack extension thus to make it consistent with the remaining multiple- or single-specimen analyses the following expression has been adopted
( ) ( )075 11i t
o
aJ J J a
W aη⎡ ⎤minus ∆
= + ∆ sdot minus⎢ ⎥minus⎣ ⎦ (8)
BLG 1016 - Page 17 of 24
where the term between square brackets is the crack growth correction factor used in the ESIS P2-92 test procedure [14] Note also that with respect to the analytical approaches previously described Chaouadis method assumes a fixed value (05) for the power law exponent of the J-R curve plus an offset (Ji) The same tests already analysed according to Schindlers key curve have been considered including the fully broken specimen from JSPS tested at 290 degC Results are presented in Table 10 (initiation values) and Figure 15 to Figure 18 (J-R curves) More details on the calculations performed are given in Annex 9 (20MnMnMo55) and Annex 10 (JSPS) Table 10 - Critical J-integral values obtained from the application of Chaouadis method to selected low-blow tests compared with the outcome of the multiple-specimen analysis
Material T (degC)
Specimen code
∆a (mm)
J02mm (kJmsup2)
JQ (kJmsup2)
MMN_1114_L 1302 5358 9143 MMN_1007_R 1605 5889 9773 MMN_1002_R 1787 5816 9658 MMN_1111_R 2452 5706 10316
Average Standard deviation
5687 2879
9525 3355
23
Multiple-specimen 3762 9218 MMN_1113_R 1238 5253 10522 MMN_1113_R 1608 5334 10400 MMN_1003_R 2412 5115 9772
Average Standard deviation
5293 568
10461 864
20MnMoNi55
290
Multiple-specimen 3144 11173 JSP6_3 1781 2615 3632 JSP6_4 2855 2814 3852
Average 2715 3742 100
Multiple-specimen 2658 3661 4-2-20-A 1561 2046 2829
502_L 2036 2157 3001 506_L 2206 2504 3617 507_L 2789 2424 3450
4-2-2-A () 4745 2883 3769 Average
Standard deviation 2283 2169
3224 3701
JSPS
290
Multiple-specimen 1729 2532
NOTE ndash () Fully broken specimen
BLG 1016 - Page 18 of 24
0
300
600
900
1200
1500
1800
0 05 1 15 2 25 3 35
Crack extension (mm)
J-in
tegr
al (k
Nm
)
Multi-specimen (low-blow tests)
MMN-1114_L (1302 mm)
MMN-1007_R (1605 mm)
MMN-1002_R (1787 mm)
MMN-1111_R (2452 mm)
02mm
Figure 15 - Comparison between J-R curves obtained from the multiple-specimen (low-blow) and single-specimen (Chaouadis method) approaches for 20MnMoNi55 at RT
0
300
600
900
1200
1500
1800
0 05 1 15 2 25 3 35
Crack extension (mm)
J-in
tegr
al (k
Nm
)
Multi-specimen (low-blow tests)
MMN-1113_R (1238 mm)
MMN-1006_L (1608 mm)
MMN-1003_R (2412 mm)
02mm
Figure 16 - Comparison between J-R curves obtained from the multiple-specimen (low-blow) and single-specimen (Chaouadis method) approaches for 20MnMoNi55 at 290 degC
BLG 1016 - Page 19 of 24
0
100
200
300
400
500
600
700
800
900
0 05 1 15 2 25 3 35
Crack extension (mm)
J-in
tegr
al (k
Nm
)
Multi-specimen (low-blow tests)
JSP6_3 (1781 mm)
JSP6_4 (2855 mm)
02mm
Figure 17 - Comparison between J-R curves obtained from the multiple-specimen (low-blow) and single-specimen (Chaouadis method) approaches for JSPS at 100 degC
0
100
200
300
400
500
600
700
800
0 05 1 15 2 25 3 35
Crack extension (mm)
J-in
tegr
al (k
Nm
)
Multi-specimen (low-blow tests)4-2-20-A (1561 mm)502_L (2036 mm)506_L (2206 mm)507_L (2789 mm)4-2-2-A (4745 mm - full blow)
02mm
Figure 18 - Comparison between J-R curves obtained from the multiple-specimen (low-blow) and single-specimen (Chaouadis method) approaches for JSPS at 290 degC
BLG 1016 - Page 20 of 24
341 Discussion A fair agreement with the multiple-specimen results has been observed for the materials and temperatures investigated The method seems however to provide non-conservative estimations of the critical parameters and the resistance curve The fixed value of the J-R curve exponent appears to be a limitation which can yield significant discrepancies especially in the early stages of crack propagation (see for example 20MnMoNi55 at RT Figure 15 and the values of J02mm in Table 10) In a couple of circumstances the single-specimen and the multiple-specimen curves cross each other nearby the region where engineering initiation is defined (02 mm offset from the construction line) hence the very good agreement in terms of JQ which appears however coincidental see for instance Figure 15 and Figure 16 The overall scatter of the results seems to be smaller than for the other techniques investigated
4 Overall comparative analysis and conclusions In order to obtain an overall perspective of how effectively the individual single-specimen methods described in this report can represent the upper shelf behaviour under dynamic (impact) loading rates we will consider not only critical the J-integral values (J02mm and JQ) but also another parameter which is related to the resistance of the material to crack propagation A parameter which can give an indication of the relative stability of crack extension is the tearing modulus TR which is related to the slope of the J-R curve at a given value of ∆a It can be expressed in dimensionless terms as [15]
R
y
E dJTdaσ
⎛ ⎞= ⎜ ⎟⎝ ⎠
(9)
with E = plane strain Youngs modulus TR normally calculated at the point on the J-R curve which corresponds to JQ Since we will be comparing values of TR for the same materials and temperatures eq(9) can be simplified to
Qa
dJTda ∆
= (10)
where ∆aQ is the crack extension corresponding to JQ and T is usually expressed in MPa
In this analysis like everywhere else in this report the results of the multiple-specimen method will be assumed as the reference
The comparisons between multiple and single-specimen approaches for the materials and temperatures investigated are shown in Figure 19 for J02mm Figure 20 for JQ and Figure 21 for T
BLG 1016 - Page 21 of 24
100
200
300
400
500
600
700
100 200 300 400 500 600 700
J02mm from multiple-specimen technique (kNm)
J 02
mm
from
sin
gle-
spec
imen
tech
niqu
es (k
Nm
)
Normalization Data Reduction
Schindlers Key Curve
Chaouadis approachJSPS290 degCJSPS
100 degC
20MnMoNi55RT
20MnMoNi55290 degC
Figure 19 - Comparison between multiple and single-specimen results in terms of J02mm
200
300
400
500
600
700
800
900
1000
1100
1200
200 400 600 800 1000 1200
JQ from multiple-specimen technique (kNm)
J Q fr
om s
ingl
e-sp
ecim
en te
chni
ques
(kN
m)
Normalization Data ReductionSchindlers Key CurveChaouadis approach
JSPS100 degC
JSPS290 degC
20MnMoNi55RT
20MnMoNi55290 degC
Figure 20 - Comparison between multiple and single-specimen results in terms of JQ
BLG 1016 - Page 22 of 24
200
300
400
500
600
200 300 400 500 600
T from multiple-specimen technique (MPa)
T R fr
om s
ingl
e-sp
ecim
en te
chni
ques
(MP
a)
Normalization Data ReductionSchindlers Key CurveChaouadis approach
JSPS
20MnMoNi55
Figure 21 - Comparison between multiple and single-specimen results in terms of tearing modulus TR
Its not easy to pinpoint clear systematics in the results shown in Figure 19 to Figure 21 However the following can be remarked (a) J02mm (Figure 19) the performance of the single-specimen approaches is better for the low
toughness JSPS than for the high toughness 20MnMoNi55 for which the predictions are systematically higher than the reference Schindlers key curve tends to provide lower end values opposite to Chaouadis method which shows a tendency to overestimation the NDR method is located somewhat in-between
(b) JQ (Figure 20) the accuracy of the single-specimen methods is acceptable for both materials although the scatter for the high toughness 20MnMoNi55 is significant For this latter material its the NDR technique which delivers the highest results Schindlers key curve remains the most conservative
(c) TR (Figure 21) accuracy is quite poor for 20MnMoNi55 in that resistance to crack extension appears seriously underestimated for the single-specimen methods Conversely for JSPS the overall impression is a slight non-conservatism of the predicition although within an acceptable scatterband Consistently with what we remarked for initiation toughness values Schindlers key curve tends to provide the steeper J-R curves
The bottom line is that all three single-specimen approach are easily applicable to the analysis of the force-displacement curve of a PCCv specimen tested with an instrumented impact pendulum They represent an acceptable alternative to the simpler but more material-consuming multiple-specimen method (low-blow or stop-block tests) However in view of the experimental and analytical uncertainties it is advisable to perform the analysis on a minimum of three specimens tested under the same conditions A general tendency to overestimation for Chaouadis approach and to underestimation for Schindlers key curve has been observed For this reason and because of its more robust theoretical background the use of the Normalization Data Reduction technique is recommended
BLG 1016 - Page 23 of 24
This approach will therefore be employed in the future for the analysis of dynamic toughness tests performed in upper shelf conditions in the framework of the Tractebel Convention andor the advanced analysis of Belgian surveillance capsules
Acknowledgments My thanks to Jean-Louis Puzzolante for performing the dynamic toughness tests and to Rachid Chaouadi and Marc Scibetta for several interesting and fruitful discussions
References [1] K Wallin Effect of Strain Rate on the Fracture Toughness Reference Temperature To for
Ferritic Steels in Recent Advances in Fracture RK Mahidhara et al Eds The Minerals Metals amp Materials Society 1997
[2] E Lucon and R Chaoaudi Radiation Damage Assessment by the Use of Dynamic Toughness Measurements on Pre-Cracked Charpy Specimens in Effects of Radiation on Materials 20th International Symposium ASTM STP 1405 ST Rosinski ML Grossbeck TR Allen and AS Kumar Eds ASTM 2001 pp68-78
[3] JB Hall and KKYoon Quasi-static Loading Rate Effect on the Master Curve Reference Temperature of Ferritic Steels and Implications Proceedings of the 2003 ASME Pressure Vessels and Piping Conference July 28-31 2003 Cleveland
[4] ESIS Technical Committee 5 Proposed Standard Methods for Instrumented Pre-cracked Charpy Impact Testing of Steels Draft 19 April 2005
[5] E Lucon M Scibetta and R Chaouadi Applicability of the Master Curve Approach to a RPVS with Various Types of Cleavage Initiators 20MnMoNi55 SCKbullCEN Report R-3398 February 2000 (restricted)
[6] R Chaouadi M Scibetta and K Onizawa On the Use of the Master Curve Concept and Charpy Size Specimen to Characterize Fracture Toughness in the Transition Regime ndash Part II RPV Steel with Low Upper Shelf ndash A533B Cl1 (JSPS) SCKbullCEN Report R-3326 March 1999 (restricted)
[7] K Wallin and A Laukkanen Improved Crack Growth Corrections for JndashR-curve Testing Engineering Fracture Mechanics Vol 71 Issue 11 July 2004 pp 1601-1614
[8] CSNI Specialist Meeting on Instrumented Precracked Charpy Testing EPRI NP-2102-LD November 1981
[9] H Ernst PC Paris M Rossow and JW Hutchinson Analysis of Load-Displacement Relationship to Determine J-R Curve and Tearing Instability Material Properties in Fracture Mechanics ASTM STP 677 CW Smith Ed ASTM 1979 pp 581-599
[10] E Lucon M Scibetta and E van Walle Applying the Normalization Technique for Measuring the Upper Shelf Toughness Properties of RPV Steels SCKbullCEN Report BLG-915 September 2002 (unclassified)
[11] HJ Schindler Estimation of the Dynamic J-R-curve from a Single Impact Bending Test Proceedings of the 11th European Conference on Fracture ECF11 Poitiers (France) 1996 EMAS Publisher pp2007-2012
[12] HJ Schindler Estimation of Fracture Toughness from Charpy Tests ndash Theoretical Relations in Pendulum Impact Testing A Century of Progress ASTM STP 1380 T Siewert and MP Manahan Sr Eds ASTM West Conshohocken 1999 pp 337-353
[13] R Chaouadi Crack Resistance Determination from the Load-Displacement Test Record SCKbullCEN Report R-3712 March 2003 (restricted)
BLG 1016 - Page 24 of 24
[14] R Chaouadi and A Fabry On the Utilization of the Instrumented Charpy Impact Test for Characterizing the Flow and Fracture Behaviour of Reactor Pressure Vessel Steels in From Charpy to Present Impact Testing D Franccedilois and A Pineau Eds Elsevier Science Ltd and ESIS 2002 pp 103-117
[15] ESIS P2-92 ESIS Procedure for Determining the Fracture Behaviour of Materials January 1992
[16] TL Anderson Fracture Mechanics ndash Fundamentals and Applications Second Edition CRC Press 1995

BLG 1016 - Page 1 of 24
Abstract The multiple-specimen method (low-blow or stop-block tests) is the conventional approach for measuring the upper shelf fracture toughness of metallic materials under impact loading rates typically fatigue precracked Charpy specimens tested on an instrumented pendulum machine The method is fairly simple but requires a relatively large number of specimens Nowadays several single-specimen methods are available which are purely based on the analysis of the instrumented forcedisplacement trace they dont need any dedicated instrumentation for the measurement of crack extension during the test Three of these techniques have been applied in this work to low-blow tests performed at different temperatures on two significantly different RPV steels (20MnMoNi55 and JSPS) the Normalization Data Reduction (NDR) technique Schindlers Analytical 3-Parameter Approach and Chaouadis method Analyses have been performed after applying a double fitting approach to the raw test data which allows selecting a limited set of forcedisplacement data which are representative of the whole instrumented trace Results show that all three methods provide acceptable accuracy in terms of both ductile crack initiation and resistance to crack propagation (tearing modulus) However for this type of analysis we recommend the use of the more widely accepted NDR technique which is described in detail in the ASTM E1820-01 standard (although the limitations on data smoothness presently enforced in the standard seem incompatible with the oscillations of a typical dynamic PCCv curve)
Keywords
Multiple-specimen method low-blow tests upper shelf toughness precracked Charpy specimens instrumented impact tests single-specimen methods Normalization Data Reduction Schindlers key curve Chaouadis approach tearing modulus
BLG 1016 - Page 2 of 24
1 Introduction The knowledge of dynamic mechanical properties is useful in all circumstances where strain rate sensitivity of a metallic material is an issue and whenever the actual loading conditions for a structure (either in normal operation or under accidental circumstances) are different from static Furthermore in some investigations increasing the strain (loading) rate in a mechanical test is used to simulate other embrittling mechanisms such as heat treatments or exposure to neutron irradiation The instrumentation of the pendulum striker in a Charpy test allows measuring dynamic fracture toughness on fatigue precracked specimens and consequently use the results for structural integrity assessments For a precracked Charpy (PCCv) specimen with aW asymp 05 tested at 15 ms the corresponding loading rate expressed in terms of increase of stress
intensity factor Kbull
is of the order of 105 MParadicms As far as fracture toughness test standards are concerned most documents nowadays contain provisions for testing at loading rates above the so-called quasi-static regime If we limit ourselves to current ASTM standards we note the following as a function of the mechanical response of the tested material
rarr Brittle behaviour (lower shelf) both the E399-90 and the E1820-01 standards prescribe a range of increase of stress intensity factor between 055 and 275 MParadicms Above this upper limit the user is redirected to Annex A7 (E399) or Annex A13 (E1820) but in both cases the requirements given do not include impact or quasi-impact testing (free-falling or swinging masses)
rarr Ductile-to-brittle transition regime the current version of E1921 (2005) limits the loading rate to 2 MParadicms below this limit the influence of loading rate on the reference temperature is expected to be less than 10 degC No specific provisions are given for higher loading rates although an Annex is currently in preparation within the responsible ASTM committee which should eventually cover high-rate tests (including precracked Charpy tests) Several investigations [123] have shown that the Master Curve analysis is however fully applicable to fracture toughness data obtained under dynamic conditions a semi-empirical correlation between the increase of To and the loading rate has also been established [1]
rarr Ductile behaviour (upper shelf) the E1820-01 standard contains an Annex (A14) titled Rapid-load J-integral Fracture Toughness Testing which is applicable when the loading rate exceeds the value allowed for conventional (static) testing which corresponds to reaching the load Pf (used for fatigue precracking) in 01 min However limitations are imposed to the maximum tolerable oscillations in the elastic portion of the forcedisplacement trace which are generally incompatible with an actual instrumented impact test on a precracked Charpy specimen
Two other widely used fracture toughness test standards cannot in principle be applied to impact-tested PCCv specimens ISO 121352002 (which is restricted to quasi-static loading rates up to 3 MParadicms) and BS 7448 Part 3 (which can be used for loading rates up to 3000 MParadicms) In the upper shelf regime the most commonly used method for determining ductile crack initiation and the crack resistance curve is the multiple-specimen technique whereby each
BLG 1016 - Page 3 of 24
sample provides one J-∆a point and the different specimens are tested up to varying amounts of ductile crack extension Two approaches can be used for obtaining different degrees of crack propagation bull the low-blow test in which each specimen is tested at a different velocity and with different
potential energy but in all cases such as not to fully break the sample bull the stop block test where the different amounts of crack extension are obtained by varying the
arrest position of the striker but again avoiding complete fracture of the specimen Both these techniques are described in the Test Procedure which is being developed by the ESIS Technical Committee 5 [4] The multiple-specimen technique is regarded as the reference method Because of the nature of the impact test itself the use of more conventional single-specimen techniques such as Unloading Compliance or Potential Drop is not feasible However new analytical approaches to the analysis of an individual forcedeflection trace have recently surfaced
rarr the Normalization Data Reduction (NDR) technique which is fully described in Annex A15 of E1820-01 and Annex 4 of the ESIS TC5 Test Procedure
rarr the Analytical 3-Parameter Approach proposed by Schindler and included in Annex 4 of the ESIS TC5 Test Procedure
rarr a model proposed by R Chaouadi and developed in 2003 for the TractebelSCKbullCEN Convention
The purpose of this investigation is to assess the applicability and reliability of these analytical single-specimen techniques for the determination of upper shelf dynamic toughness properties based on the comparison with results obtained using the more conventional multiple-specimen (low-blow test) technique Indeed it is desirable to validate a single-specimen technique which would be effectively applicable to dynamic J-R measurements in the upper shelf regime without having to use the material-consuming multiple-specimen approach
2 Materials and experimental Two well characterized RPV steels with clearly different mechanical properties have been selected for this investigation The DIN 20MnMoNi55 steel comes from a forged boiler bottom segment and its chemical composition (shown in Table 1) is similar to A533B Cl1 Its main mechanical properties [5] are given in Table 2
Table 1 - Chemical composition of 20MnMoNi55 (weight - Fe balance)
C Si Mn S P Cr V Cu Al Ni Mo Sn Co As Sb Ti 019 02 129 0008 0007 012 002 011 0015 08 053 0012 0014 003 003 005
Table 2 - Main mechanical properties of 20MnMoNi55 [5]
Rp02 (MPa)
Rm (MPa)
εu ()
εt ()
RA ()
T41J (degC)
T68J (degC)
USE (J)
FATT (degC)
T089mm (degC)
To (degC)
429 576 11 22 73 -76 -58 181 -24 -68 -126
LEGEND Rp02 Rm εu εt RA = yield strength tensile strength uniform elongation total elongation and reduction of area (at RT)
BLG 1016 - Page 4 of 24
T41J T68J FATT T089mm = temperatures corresponding to 41J and 68J absorbed energy 50 shear fracture appearance and 089 mm lateral expansion from Charpy tests To = quasi-static reference temperature measured on PCCv specimens with the Master Curve methodology
The other material JSPS is a Japanese RPV steel of the A533B type deliberately embrittled by increasing the concentration of S and P to simulate the degradation in toughness caused by neutron exposure This steel was used by the Japan Society for the Promotion of Science (hence the name) in a Round-Robin exercise on fracture toughness measurements using Compact Tension specimens [6] Its chemical composition and main mechanical properties are shown in Table 3 and Table 4 respectively
Table 3 - Chemical composition of JSPS (weight - Fe balance)
C Si Mn S P Cr Cu Ni Mo 024 041 152 0023 0028 008 019 043 049
Table 4 - Main mechanical properties of JSPS [6]
Rp02 (MPa)
Rm (MPa)
εu ()
εt ()
RA ()
T41J (degC)
T68J (degC)
USE (J)
FATT (degC)
T089mm (degC)
To (degC)
461 639 11 18 59 34 101 72 43 40 -7 For both materials low-blow impact tests have been performed on fatigue precracked Charpy specimens using an instrumented striker conforming to the ISO 145562000 standard (tup radius = 2 mm) Tests have been executed at two different temperatures RT (23 degC) and 290 degC for 20MnMoNi55 100 and 290 degC for JSPS All tested specimens were plain-sided Individual test results are collected in Table 5 for 20MnMoNi55 and Table 6 for JSPS Annex 1 and Annex 2 contain the instrumented Charpy reports
Table 5 - Results of the low-blow tests performed on PCCv specimens of the 20MnMoNi55 steel
Specimen code
T (degC)
B (mm)
W (mm)
ao (mm)
vo (ms)
Ep (J)
KV (J)
∆a (mm)
J (kJmsup2)
Ji
[kJ(msup2s)]
MMN-1113-L 9919 9957 5038 099 1001 913 0256 36917 1045E+5 MMN-1009-R 9914 9953 5112 120 1494 1387 0368 55817 1380E+5 MMN-1006-R 9900 9936 5251 140 2004 1864 0535 77472 1679E+5 MMN-1009-L 9956 9967 5202 157 2502 2342 1050 91663 1728E+5 MMN-1114-L 9904 9934 5172 172 2998 2813 1302 108812 1915E+5 MMN-1007-R 9931 9945 5300 180 3314 3143 1605 120873 1871E+5 MMN-1002-R 9926 9967 5043 188 3614 3430 1787 123520 1925E+5 MMN-1111-R
23
9940 9923 5439 199 4015 3897 2452 142851 1506E+5 MMN-1003-L 9867 9940 5026 099 997 949 0347 37219 0897E+5 MMN-1007-L 9928 9962 5281 122 1507 1445 0539 57769 1136E+5 MMN-1002-L 9913 9936 5018 140 2004 1924 0601 74170 1435E+5 MMN-1112-R 9909 9952 5261 157 2502 2403 0871 97015 1674E+5 MMN-1113-R 9942 9957 5164 171 2992 2893 1238 111106 1759E+5 MMN-1006-L 9898 9956 4908 185 3472 3354 1608 121762 1710E+5 MMN-1003-R
290
9886 9932 5128 192 3765 3677 2412 134786 1463E+5
BLG 1016 - Page 5 of 24
Table 6 - Results of the low-blow tests performed on PCCv specimens of the JSPS steel
Specimen code
T (degC)
B (mm)
W (mm)
ao (mm)
vo (ms)
Ep (J)
KV (J)
∆a (mm)
J (kJmsup2)
Ji
[kJ(msup2s)]
JSP6_1 9945 10002 5401 089 808 743 0511 31193 0823E+5 JSP6_2 9932 10080 5309 109 1206 1116 0573 45046 1085E+5 JSP6_3 9946 9973 5457 125 1596 1538 1781 56970 0860E+5 JSP6_4
100
9935 10000 5360 140 2008 1974 2855 64493 0650E+5 JSPS-4-2-25-A 9966 10069 5656 078 619 949 0351 25109 0606E+5 JSPS-1-1-27-A 10000 10002 4929 089 802 1445 0587 27774 0697E+5 JSPS-4-2-1-A 9885 9943 5347 089 802 1924 1011 30366 0702E+5
JSPS-4-2-20-A 10050 10050 5459 109 1206 2403 1561 43427 0748E+5 JSPS-502-L 9897 9940 5149 120 1494 1435 2036 51537 0813E+5 JSPS-506-L 9945 9962 5294 130 1731 1680 2206 58816 0842E+5 JSPS-507-L
290
9837 9919 5181 134 1840 1798 2789 60659 0707E+5
LEGEND B W ao = specimen thickness specimen width and initial crack length vo = impact velocity Ep = potential energy KV = absorbed energy ∆a = measured ductile crack extension J =
value of J-integral at test termination Ji
= loading rate obtained dividing J by the time at test termination
Test results have been analyzed in accordance with the ASTM E1820-01 standard for the obtainment of the critical J-integral value at initiation and the crack resistance curve In the analyses a correction for crack growth has been applied to the multiple-specimen J values for consistency with single-specimen techniques (incremental formula for calculating J) For this purpose use has been made of a recent proposal by K Wallin [7] which should be incorporated in the forthcoming revision of E1820 In the analysis of dynamic data tensile properties measured from dynamic tensile tests at relevant strain rates have been used The results of the multispecimen analyses are given in Table 7 (critical J values ndash J02mm and JQ) and Figure 1 to Figure 4 (J-R curves) In both the Table and the Figures a comparison is presented between dynamic and quasi-static J-R curves for the different materials and temperatures the static curves were obtained using the Unloading Compliance method An increase of initiation toughness and tearing resistance with increasing loading rate is quite visible in all instances as expected on the basis of available literature on the topic [8] A tendency of loading rate effects to be more pronounced at higher temperatures is also observed attempting an interpretation of this trend is however outside the scope of this work The results presented fully confirm the large difference in upper shelf toughness between the two RPV steels Annex 3 (20MnMoNi55) and Annex 4 (JSPS) report detailed J-integral calculations for all specimens tested Table 7 - Critical J-integral values obtained from the analysis of multiple-specimen (dynamic low-blow) and single-specimen (quasi-static) tests
Material T (degC)
Loading rate
J02mm (kJmsup2)
JQ (kJmsup2)
Dynamic 3762 9218 23 Quasi-static 2599 5939 Dynamic 3144 11173 20MnMoNi55
290 Quasi-static 2117 3313
BLG 1016 - Page 6 of 24
Material T (degC)
Loading rate
J02mm (kJmsup2)
JQ (kJmsup2)
Dynamic 2658 3661 100 Quasi-static 1703 2107 Dynamic 1729 2532 JSPS
290 Quasi-static 688 792
0
250
500
750
1000
1250
1500
0 05 1 15 2 25 3 35
Crack extension (mm)
J-in
tegr
al (k
Jm
sup2)
JQst
JQdyn
Figure 1 - Dynamic (red) and quasi-static (blue) J-R curves obtained on 20MnMoNi55 at RT
0
300
600
900
1200
1500
1800
0 05 1 15 2 25 3 35
Crack extension (mm)
J-in
tegr
al (k
Jm
sup2)
JQst
JQdyn
Figure 2 - Dynamic (red) and quasi-static (blue) J-R curves obtained on 20MnMoNi55 at 290 degC
BLG 1016 - Page 7 of 24
0
100
200
300
400
500
600
700
800
0 05 1 15 2 25 3 35 4
Crack extension (mm)
J-in
tegr
al (k
Jm
sup2)
JQst
JQdyn
Figure 3 - Dynamic (red) and quasi-static (blue) J-R curves obtained on JSPS at 100 degC
0
100
200
300
400
500
600
700
0 05 1 15 2 25 3 35 4 45 5
Crack extension (mm)
J-in
tegr
al (k
Jm
sup2)
JQst
JQdyn
Figure 4 - Dynamic (red) and quasi-static (blue) J-R curves obtained on JSPS at 290 degC
Among the low-blow tests reported in Table 7 only those with ductile crack growth larger than sim12 mm have been analyzed using the single-specimen methods described in the following chapter
BLG 1016 - Page 8 of 24
3 Single-specimen analyses of low-blow tests
31 Pre-treatment of the forcedeflection traces double fitting procedure In order for an instrumentred trace to be amenable to the calculations detailed below and minimise the noise on the resulting J-R curve a limited number of forcedeflection data pairs must be selected for the analysis and the dynamic oscillations superimposed to the trace have to be smoothed out For this purpose the instrumented trace of each test has been replaced by an idealized forcedeflection diagrams obtained through the following steps
(a) the linear elastic portion has been fitted by a straight line up to the force at general yield Fgy not accounting for the initial inertia peak
(b) the subsequent part of the curve (from Fgy to the data point corresponding to zero velocity) has been fitted by a fourth-order1 polynomial
(c) a discrete number of data points to be used for further analysis have been selected on the two fitting lines namely rarr 4 data points2 in the linear elastic portion equi-spaced between 0 and Fgy (the last one
coinciding with Fgy) rarr 40 data points2 in the plastic part of the curve equi-spaced between Fgy and the end of
the test (corresponding to v = 0)
An illustration of the procedure described above is shown in Figure 5
y = 16659x
y = -0002x4 + 00561x3 - 06039x2 + 21152x + 39274
0
1
2
3
4
5
6
7
8
0 1 2 3 4 5 6 7 8
Deflection (mm)
Forc
e (k
N)
Figure 5 - Specimen MMN-1111_R (20MnNiMo55 RT) selection of the data points for the single-specimen analyses
1 In a few cases polynomials of higher order (up to 6th) had to be used to obtain a satisfactory fitting 2 The choice of 4 data points in step 1 and 40 in step 2 is purely arbitrary A smaller or higher number of data points is not expected to influence the end results
BLG 1016 - Page 9 of 24
32 The Normalization Data Reduction (NDR) technique The NDR technique allows deriving a J-R curve directly from a forcedisplacement record together with initial and final crack size measurements taken from the specimen fracture surface It is particularly suited to instances where crack size monitoring during the tests (for example via compliance measurements) is not feasible such as tests at high loading rates It is based on the principle of load separation developed by Ernst et al [9] and has been exaustively described and validated for quasi-static upper shelf toughness tests on both C(T) and PCCv specimens in a previous investigation [10] The methodology cannot be used on fully broken specimens ie when (W ndash ao) = 0 since normalized force values would tend to infinite as a consequence dynamic J-R curves can only be obtained from low-blow (or stop block) tests The results obtained using the NDR technique on selected specimens are given in Table 8 (critical J-integral values) and Figure 6 to Figure 9 (single-specimen J-R curves compared with the multi-specimen J-R curve) Detailed analyses performed using the NDR method are reported in Annex 5 (20MnMoNi55) and Annex 6 (JSPS) Table 8 - Critical J-integral values obtained from the NDR analysis of selected low-blow tests compared with the outcome of the multiple-specimen analysis
Material T (degC)
Specimen code
∆a (mm)
J02mm (kJmsup2)
JQ (kJmsup2)
MMN_1114_L 1302 4801 10163 MMN_1007_R 1605 5950 11189 MMN_1002_R 1787 5853 10820 MMN_1111_R 2452 4165 9227
Average Standard deviation
5192 8601
10350 8604
23
Multiple-specimen 3762 9218 MMN_1113_R 1238 6160 10892 MMN_1113_R 1608 4376 11756 MMN_1003_R 2412 3860 9252
Average Standard deviation
4799 12069
10633 12717
20MnMoNi55
290
Multiple-specimen 3144 11173 JSP6_3 1781 2495 3500 JSP6_4 2855 2710 3659
Average 2602 3579 100
Multiple-specimen 2658 3661 4-2-20-A 1561 1602 2323
502_L 2036 1898 2717 506_L 2206 2129 3270 507_L 2789 1902 2876
Average Standard deviation
1883 2158
2796 3923
JSPS
290
Multiple-specimen 1729 2532
BLG 1016 - Page 10 of 24
0
300
600
900
1200
1500
1800
0 05 1 15 2 25 3 35
Crack extension (mm)
J-in
tegr
al (k
Jm
sup2)
Multi-specimen (low blow tests)MMN_1114_L (1302 mm)MMN_1007_R (1605 mm)MMN_1002_R (1787 mm)MMN_1111_R (2452 mm)
02mm
Figure 6 - Comparison between multiple-specimen (low-blow) and single-specimen (NDR) J-R curves for 20MnMoNi55 at RT
0
300
600
900
1200
1500
1800
0 05 1 15 2 25 3 35
Crack extension (mm)
J-in
tegr
al (k
Jm
sup2)
Multi-specimen (low blow tests)
MMN_1113_R (1238 mm)
MMN_1006_L (1608 mm)
MMN_1003_R (2412 mm)
02mm
Figure 7 - Comparison between multiple-specimen (low-blow) and single-specimen (NDR) J-R curves for 20MnMoNi55 at 290 degC
BLG 1016 - Page 11 of 24
0
100
200
300
400
500
600
700
800
0 05 1 15 2 25 3 35
Crack extension (mm)
J-in
tegr
al (k
Jm
sup2)
Multi-specimen (low blow tests)
JSP6_3 (1781 mm)
JSP6_4 (2855 mm)
02mm
Figure 8 - Comparison between multiple-specimen (low-blow) and single-specimen (NDR) J-R curves for JSPS at 100 degC
0
100
200
300
400
500
600
700
800
0 05 1 15 2 25 3 35
Crack extension (mm)
J-in
tegr
al (k
Jm
sup2)
Multi-specimen (low blow tests)4-2-20-A (1561 mm)502_L (2036 mm)506_L (2206 mm)507_L (2789 mm)
02mm
Figure 9 - Comparison between multiple-specimen (low-blow) and single-specimen (NDR) J-R curves for JSPS at 290 degC
BLG 1016 - Page 12 of 24
321 Discussion The agreement between multiple (low blow) and single (NDR) specimen results ranges from acceptable (20MnMoNi55 at RT Figure 6) to very good (JSPS at 100 degC Figure 8) In terms of initiation parameters (JQ) and considering mean values for the NDR analyses differences range from -49 to +123 Moreover the multiple-specimen value is always within plusmn1σ (σ = standard deviation) from the average value of the single-specimen analyses The NDR technique therefore appears to be an effective method for deriving single-specimen J-R curves under dynamic loading conditions
33 Analytical 3-parameter approach (Schindlers Key-Curve method) An estimation method for the J-R curve based on a continuous force-displacement diagram has been proposed by Schindler [1011] and is presently included in the latest draft of the ESIS TC5 Test Procedure [4] The J-R curve is given by
( )( )
22 1
121
pp p pI
t mppo
KJ W W aE p B W a
ην minus+
⎛ ⎞= sdot minus + sdot sdot sdot sdot∆⎜ ⎟
minus⎝ ⎠ (1)
with
1 2 2 3 4
3 2
26591090 1735 82 1418 1457gy i i i i i
IN
F S a a a a aKW W W W WBB W
⎡ ⎤sdot sdot ⎛ ⎞ ⎛ ⎞ ⎛ ⎞ ⎛ ⎞ ⎛ ⎞= sdot sdot minus sdot + sdot minus sdot + sdot⎢ ⎥⎜ ⎟ ⎜ ⎟ ⎜ ⎟ ⎜ ⎟ ⎜ ⎟⎝ ⎠ ⎝ ⎠ ⎝ ⎠ ⎝ ⎠ ⎝ ⎠⎢ ⎥⎣ ⎦
(2)
and
13 14
mp
t
Wp
W
minus⎛ ⎞
= sdot +⎜ ⎟⎝ ⎠
(3)
where Wt = total fracture energy Wmp = plastic component of the energy up to maximum force S = specimen span ai = current crack size (ai = ao + ∆a) Besides sample dimensions this approach only requires knowlegde of Fgy Wt and Wmp (3-parameter approach) Eqs(1-3) have been applied to the same low-blow tests already treated using the NDR technique However since the methodology is in principle applicable to fully broken specimens (unlike the NDR technique as previously mentioned) an additional test on a fully broken specimen (4-2-2-A JSPS 290 degC) has been analysed Results compared to multiple-specimen data are reported in Table 9 (initiation values) and Figure 10 to Figure 13 (J-R curves) Detailed analyses are given in Annex 7 (20MnMoNi55) and Annex 8 (JSPS)
BLG 1016 - Page 13 of 24
Table 9 - Critical J-integral values obtained from the application of Schindlers 3-parameter approach to selected low-blow tests compared with the outcome of the multiple-specimen analysis
Material T (degC)
Specimen code
∆a (mm)
J02mm (kJmsup2)
JQ (kJmsup2)
MMN_1114_L 1302 3763 7570 MMN_1007_R 1605 4033 8748 MMN_1002_R 1787 4020 8697 MMN_1111_R 2452 3801 9307
Average Standard deviation
3939 1522
8338 6661
23
Multiple-specimen 3762 9218 MMN_1113_R 1238 3560 8268 MMN_1113_R 1608 3517 8501 MMN_1003_R 2412 3586 9603
Average Standard deviation
3539 303
8384 1648
20MnMoNi55
290
Multiple-specimen 3144 11173 JSP6_3 1781 1645 2389 JSP6_4 2855 1883 2922
Average 1764 2656 100
Multiple-specimen 2658 3661 4-2-20-A 1561 1160 1969
502_L 2036 1514 2061 506_L 2206 1632 2361 507_L 2789 1584 2752
4-2-2-A () 4745 1558 2124 Average
Standard deviation 1473 2139
2286 3529
JSPS
290
Multiple-specimen 1729 2532
NOTE ndash () Fully broken specimen (impact velocity 157 ms)
0
300
600
900
1200
1500
1800
0 05 1 15 2 25 3 35
Crack extension (mm)
J-in
tegr
al (k
Nm
)
Multi-specimen (low-blow tests)
MMN-1114_L (1302 mm)
MMN-1007_R (1605 mm)
MMN-1002_R (1787 mm)
MMN-1111_R (2452 mm)
02mm
Figure 10 - Comparison between J-R curves obtained from the multiple-specimen (low-blow) and single-specimen (Schindlers key curve) approaches for 20MnMoNi55 at RT
BLG 1016 - Page 14 of 24
0
300
600
900
1200
1500
1800
0 05 1 15 2 25 3 35
Crack extension (mm)
J-in
tegr
al (k
Nm
)
Multi-specimen (low-blow tests)
MMN-1113_R (1238 mm)
MMN-1006_L (1608 mm)
MMN-1003_R (2412 mm)
02mm
Figure 11 - Comparison between J-R curves obtained from the multiple-specimen (low-blow) and single-specimen (Schindlers key curve) approaches for 20MnMoNi55 at 290 degC
0
100
200
300
400
500
600
700
800
900
0 05 1 15 2 25 3 35
Crack extension (mm)
J-in
tegr
al (k
Nm
)
Multi-specimen (low-blow tests)
JSP6_3 (1781 mm)
JSP6_4 (2855 mm)
02mm
Figure 12 - Comparison between J-R curves obtained from the multiple-specimen (low-blow) and single-specimen (Schindlers key curve) approaches for JSPS at 100 degC
BLG 1016 - Page 15 of 24
0
100
200
300
400
500
600
700
800
0 05 1 15 2 25 3 35
Crack extension (mm)
J-in
tegr
al (k
Nm
)
Multi-specimen (low-blow tests)4-2-20-A (1561 mm)502_L (2036 mm)506_L (2206 mm)507_L (2789 mm)4-2-2-A (4745 mm - full blow)
02mm
Figure 13 - Comparison between J-R curves obtained from the multiple-specimen (low-blow) and single-specimen (Schindlers key curve) approaches for JSPS at 290 degC
331 Discussion For Schindlers key curve approach the overall agreement with the multiple-specimen results is good although a tendency to underestimation is visible particularly in the ductile initiation region In terms of JQ the differences between multiple-specimen and single-specimen (mean value) range from -95 to -275 The slope of the multiple-specimen crack resistance curve is better reproduced for 20MnMoNi55 than for JSPS the scatter is somewhat lower than for the NDR technique This analytical method seems to provide a reasonable tendentially conservative approximation of the toughness properties measured with the multiple-specimen approach
34 Chaouadis approach Another analytical approach has been proposed by Chaouadi in the framework of the 2003 TractebelSCKbullCEN Convention [12] Like Schindlers method it is purely based on the analysis of the forcedisplacement test record and can be in principle applied to any specimen geometry and loading rate At any point on the forcedisplacement trace crack extension is related to the absorbed energy E via the following quadratic relationship
2
i
p t i
E Waa W W
⎛ ⎞minus∆= ⎜ ⎟∆ minus⎝ ⎠
(4)
BLG 1016 - Page 16 of 24
where ∆ap is the measured total crack extension Wt is the total absorbed energy and Wi is the absorbed energy at initiation The evaluation of this latter parameter is based on the assumption that on the forcedisplacement trace the onset of ductile tearing is located approximately
midway between general yield and maximum force (Figure 14) In other words 2
gy mi
F FF
+asymp
[13] The absorbed energy corresponding to Fi is obviously Wi to be used in eq (4)
Figure 14 - Onset of ductile crack initiation on a generic forcedisplacement record [1213]
The crack resistance curve can be expressed as
i tJ J J a= + ∆ (5) where Ji the initiation toughness is given by
( )i
io
WJB W a
η sdot=
minus (6)
and Jt the tearing resistance corresponds to
( )( )
t it
o p
W WJ
B W a aη sdot minus
=minus ∆
(7)
Note that eq(5) is not corrected for crack extension thus to make it consistent with the remaining multiple- or single-specimen analyses the following expression has been adopted
( ) ( )075 11i t
o
aJ J J a
W aη⎡ ⎤minus ∆
= + ∆ sdot minus⎢ ⎥minus⎣ ⎦ (8)
BLG 1016 - Page 17 of 24
where the term between square brackets is the crack growth correction factor used in the ESIS P2-92 test procedure [14] Note also that with respect to the analytical approaches previously described Chaouadis method assumes a fixed value (05) for the power law exponent of the J-R curve plus an offset (Ji) The same tests already analysed according to Schindlers key curve have been considered including the fully broken specimen from JSPS tested at 290 degC Results are presented in Table 10 (initiation values) and Figure 15 to Figure 18 (J-R curves) More details on the calculations performed are given in Annex 9 (20MnMnMo55) and Annex 10 (JSPS) Table 10 - Critical J-integral values obtained from the application of Chaouadis method to selected low-blow tests compared with the outcome of the multiple-specimen analysis
Material T (degC)
Specimen code
∆a (mm)
J02mm (kJmsup2)
JQ (kJmsup2)
MMN_1114_L 1302 5358 9143 MMN_1007_R 1605 5889 9773 MMN_1002_R 1787 5816 9658 MMN_1111_R 2452 5706 10316
Average Standard deviation
5687 2879
9525 3355
23
Multiple-specimen 3762 9218 MMN_1113_R 1238 5253 10522 MMN_1113_R 1608 5334 10400 MMN_1003_R 2412 5115 9772
Average Standard deviation
5293 568
10461 864
20MnMoNi55
290
Multiple-specimen 3144 11173 JSP6_3 1781 2615 3632 JSP6_4 2855 2814 3852
Average 2715 3742 100
Multiple-specimen 2658 3661 4-2-20-A 1561 2046 2829
502_L 2036 2157 3001 506_L 2206 2504 3617 507_L 2789 2424 3450
4-2-2-A () 4745 2883 3769 Average
Standard deviation 2283 2169
3224 3701
JSPS
290
Multiple-specimen 1729 2532
NOTE ndash () Fully broken specimen
BLG 1016 - Page 18 of 24
0
300
600
900
1200
1500
1800
0 05 1 15 2 25 3 35
Crack extension (mm)
J-in
tegr
al (k
Nm
)
Multi-specimen (low-blow tests)
MMN-1114_L (1302 mm)
MMN-1007_R (1605 mm)
MMN-1002_R (1787 mm)
MMN-1111_R (2452 mm)
02mm
Figure 15 - Comparison between J-R curves obtained from the multiple-specimen (low-blow) and single-specimen (Chaouadis method) approaches for 20MnMoNi55 at RT
0
300
600
900
1200
1500
1800
0 05 1 15 2 25 3 35
Crack extension (mm)
J-in
tegr
al (k
Nm
)
Multi-specimen (low-blow tests)
MMN-1113_R (1238 mm)
MMN-1006_L (1608 mm)
MMN-1003_R (2412 mm)
02mm
Figure 16 - Comparison between J-R curves obtained from the multiple-specimen (low-blow) and single-specimen (Chaouadis method) approaches for 20MnMoNi55 at 290 degC
BLG 1016 - Page 19 of 24
0
100
200
300
400
500
600
700
800
900
0 05 1 15 2 25 3 35
Crack extension (mm)
J-in
tegr
al (k
Nm
)
Multi-specimen (low-blow tests)
JSP6_3 (1781 mm)
JSP6_4 (2855 mm)
02mm
Figure 17 - Comparison between J-R curves obtained from the multiple-specimen (low-blow) and single-specimen (Chaouadis method) approaches for JSPS at 100 degC
0
100
200
300
400
500
600
700
800
0 05 1 15 2 25 3 35
Crack extension (mm)
J-in
tegr
al (k
Nm
)
Multi-specimen (low-blow tests)4-2-20-A (1561 mm)502_L (2036 mm)506_L (2206 mm)507_L (2789 mm)4-2-2-A (4745 mm - full blow)
02mm
Figure 18 - Comparison between J-R curves obtained from the multiple-specimen (low-blow) and single-specimen (Chaouadis method) approaches for JSPS at 290 degC
BLG 1016 - Page 20 of 24
341 Discussion A fair agreement with the multiple-specimen results has been observed for the materials and temperatures investigated The method seems however to provide non-conservative estimations of the critical parameters and the resistance curve The fixed value of the J-R curve exponent appears to be a limitation which can yield significant discrepancies especially in the early stages of crack propagation (see for example 20MnMoNi55 at RT Figure 15 and the values of J02mm in Table 10) In a couple of circumstances the single-specimen and the multiple-specimen curves cross each other nearby the region where engineering initiation is defined (02 mm offset from the construction line) hence the very good agreement in terms of JQ which appears however coincidental see for instance Figure 15 and Figure 16 The overall scatter of the results seems to be smaller than for the other techniques investigated
4 Overall comparative analysis and conclusions In order to obtain an overall perspective of how effectively the individual single-specimen methods described in this report can represent the upper shelf behaviour under dynamic (impact) loading rates we will consider not only critical the J-integral values (J02mm and JQ) but also another parameter which is related to the resistance of the material to crack propagation A parameter which can give an indication of the relative stability of crack extension is the tearing modulus TR which is related to the slope of the J-R curve at a given value of ∆a It can be expressed in dimensionless terms as [15]
R
y
E dJTdaσ
⎛ ⎞= ⎜ ⎟⎝ ⎠
(9)
with E = plane strain Youngs modulus TR normally calculated at the point on the J-R curve which corresponds to JQ Since we will be comparing values of TR for the same materials and temperatures eq(9) can be simplified to
Qa
dJTda ∆
= (10)
where ∆aQ is the crack extension corresponding to JQ and T is usually expressed in MPa
In this analysis like everywhere else in this report the results of the multiple-specimen method will be assumed as the reference
The comparisons between multiple and single-specimen approaches for the materials and temperatures investigated are shown in Figure 19 for J02mm Figure 20 for JQ and Figure 21 for T
BLG 1016 - Page 21 of 24
100
200
300
400
500
600
700
100 200 300 400 500 600 700
J02mm from multiple-specimen technique (kNm)
J 02
mm
from
sin
gle-
spec
imen
tech
niqu
es (k
Nm
)
Normalization Data Reduction
Schindlers Key Curve
Chaouadis approachJSPS290 degCJSPS
100 degC
20MnMoNi55RT
20MnMoNi55290 degC
Figure 19 - Comparison between multiple and single-specimen results in terms of J02mm
200
300
400
500
600
700
800
900
1000
1100
1200
200 400 600 800 1000 1200
JQ from multiple-specimen technique (kNm)
J Q fr
om s
ingl
e-sp
ecim
en te
chni
ques
(kN
m)
Normalization Data ReductionSchindlers Key CurveChaouadis approach
JSPS100 degC
JSPS290 degC
20MnMoNi55RT
20MnMoNi55290 degC
Figure 20 - Comparison between multiple and single-specimen results in terms of JQ
BLG 1016 - Page 22 of 24
200
300
400
500
600
200 300 400 500 600
T from multiple-specimen technique (MPa)
T R fr
om s
ingl
e-sp
ecim
en te
chni
ques
(MP
a)
Normalization Data ReductionSchindlers Key CurveChaouadis approach
JSPS
20MnMoNi55
Figure 21 - Comparison between multiple and single-specimen results in terms of tearing modulus TR
Its not easy to pinpoint clear systematics in the results shown in Figure 19 to Figure 21 However the following can be remarked (a) J02mm (Figure 19) the performance of the single-specimen approaches is better for the low
toughness JSPS than for the high toughness 20MnMoNi55 for which the predictions are systematically higher than the reference Schindlers key curve tends to provide lower end values opposite to Chaouadis method which shows a tendency to overestimation the NDR method is located somewhat in-between
(b) JQ (Figure 20) the accuracy of the single-specimen methods is acceptable for both materials although the scatter for the high toughness 20MnMoNi55 is significant For this latter material its the NDR technique which delivers the highest results Schindlers key curve remains the most conservative
(c) TR (Figure 21) accuracy is quite poor for 20MnMoNi55 in that resistance to crack extension appears seriously underestimated for the single-specimen methods Conversely for JSPS the overall impression is a slight non-conservatism of the predicition although within an acceptable scatterband Consistently with what we remarked for initiation toughness values Schindlers key curve tends to provide the steeper J-R curves
The bottom line is that all three single-specimen approach are easily applicable to the analysis of the force-displacement curve of a PCCv specimen tested with an instrumented impact pendulum They represent an acceptable alternative to the simpler but more material-consuming multiple-specimen method (low-blow or stop-block tests) However in view of the experimental and analytical uncertainties it is advisable to perform the analysis on a minimum of three specimens tested under the same conditions A general tendency to overestimation for Chaouadis approach and to underestimation for Schindlers key curve has been observed For this reason and because of its more robust theoretical background the use of the Normalization Data Reduction technique is recommended
BLG 1016 - Page 23 of 24
This approach will therefore be employed in the future for the analysis of dynamic toughness tests performed in upper shelf conditions in the framework of the Tractebel Convention andor the advanced analysis of Belgian surveillance capsules
Acknowledgments My thanks to Jean-Louis Puzzolante for performing the dynamic toughness tests and to Rachid Chaouadi and Marc Scibetta for several interesting and fruitful discussions
References [1] K Wallin Effect of Strain Rate on the Fracture Toughness Reference Temperature To for
Ferritic Steels in Recent Advances in Fracture RK Mahidhara et al Eds The Minerals Metals amp Materials Society 1997
[2] E Lucon and R Chaoaudi Radiation Damage Assessment by the Use of Dynamic Toughness Measurements on Pre-Cracked Charpy Specimens in Effects of Radiation on Materials 20th International Symposium ASTM STP 1405 ST Rosinski ML Grossbeck TR Allen and AS Kumar Eds ASTM 2001 pp68-78
[3] JB Hall and KKYoon Quasi-static Loading Rate Effect on the Master Curve Reference Temperature of Ferritic Steels and Implications Proceedings of the 2003 ASME Pressure Vessels and Piping Conference July 28-31 2003 Cleveland
[4] ESIS Technical Committee 5 Proposed Standard Methods for Instrumented Pre-cracked Charpy Impact Testing of Steels Draft 19 April 2005
[5] E Lucon M Scibetta and R Chaouadi Applicability of the Master Curve Approach to a RPVS with Various Types of Cleavage Initiators 20MnMoNi55 SCKbullCEN Report R-3398 February 2000 (restricted)
[6] R Chaouadi M Scibetta and K Onizawa On the Use of the Master Curve Concept and Charpy Size Specimen to Characterize Fracture Toughness in the Transition Regime ndash Part II RPV Steel with Low Upper Shelf ndash A533B Cl1 (JSPS) SCKbullCEN Report R-3326 March 1999 (restricted)
[7] K Wallin and A Laukkanen Improved Crack Growth Corrections for JndashR-curve Testing Engineering Fracture Mechanics Vol 71 Issue 11 July 2004 pp 1601-1614
[8] CSNI Specialist Meeting on Instrumented Precracked Charpy Testing EPRI NP-2102-LD November 1981
[9] H Ernst PC Paris M Rossow and JW Hutchinson Analysis of Load-Displacement Relationship to Determine J-R Curve and Tearing Instability Material Properties in Fracture Mechanics ASTM STP 677 CW Smith Ed ASTM 1979 pp 581-599
[10] E Lucon M Scibetta and E van Walle Applying the Normalization Technique for Measuring the Upper Shelf Toughness Properties of RPV Steels SCKbullCEN Report BLG-915 September 2002 (unclassified)
[11] HJ Schindler Estimation of the Dynamic J-R-curve from a Single Impact Bending Test Proceedings of the 11th European Conference on Fracture ECF11 Poitiers (France) 1996 EMAS Publisher pp2007-2012
[12] HJ Schindler Estimation of Fracture Toughness from Charpy Tests ndash Theoretical Relations in Pendulum Impact Testing A Century of Progress ASTM STP 1380 T Siewert and MP Manahan Sr Eds ASTM West Conshohocken 1999 pp 337-353
[13] R Chaouadi Crack Resistance Determination from the Load-Displacement Test Record SCKbullCEN Report R-3712 March 2003 (restricted)
BLG 1016 - Page 24 of 24
[14] R Chaouadi and A Fabry On the Utilization of the Instrumented Charpy Impact Test for Characterizing the Flow and Fracture Behaviour of Reactor Pressure Vessel Steels in From Charpy to Present Impact Testing D Franccedilois and A Pineau Eds Elsevier Science Ltd and ESIS 2002 pp 103-117
[15] ESIS P2-92 ESIS Procedure for Determining the Fracture Behaviour of Materials January 1992
[16] TL Anderson Fracture Mechanics ndash Fundamentals and Applications Second Edition CRC Press 1995
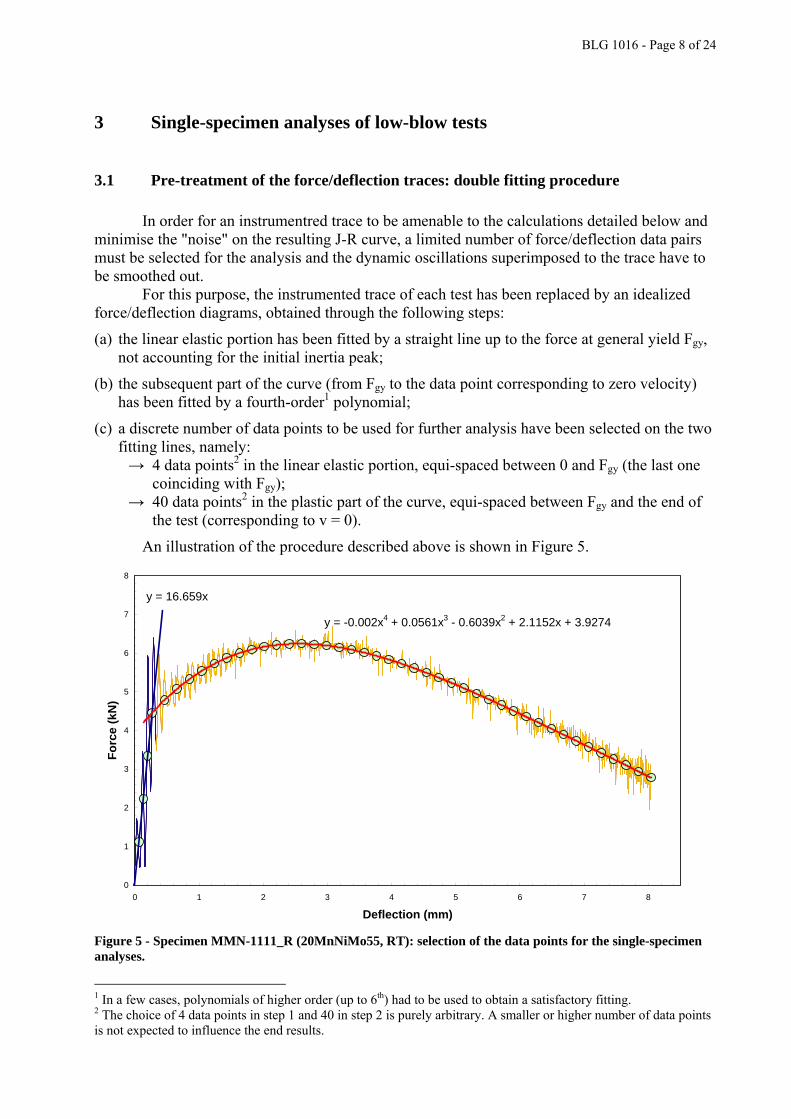
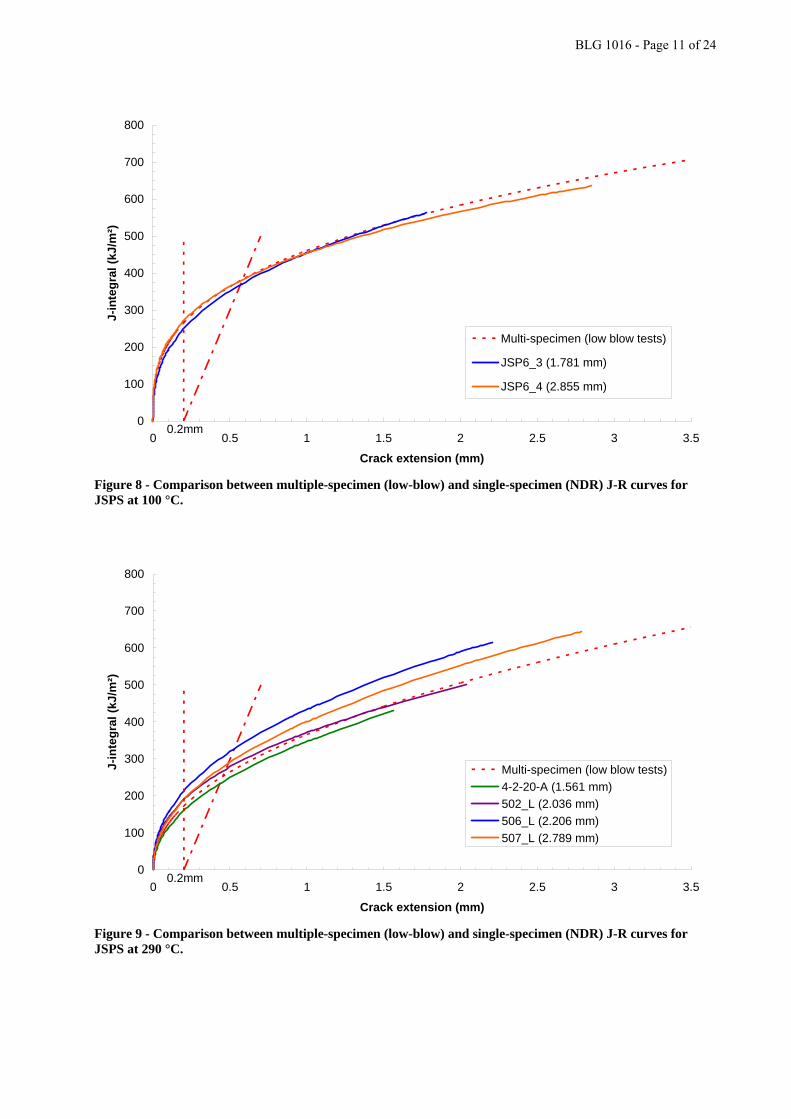
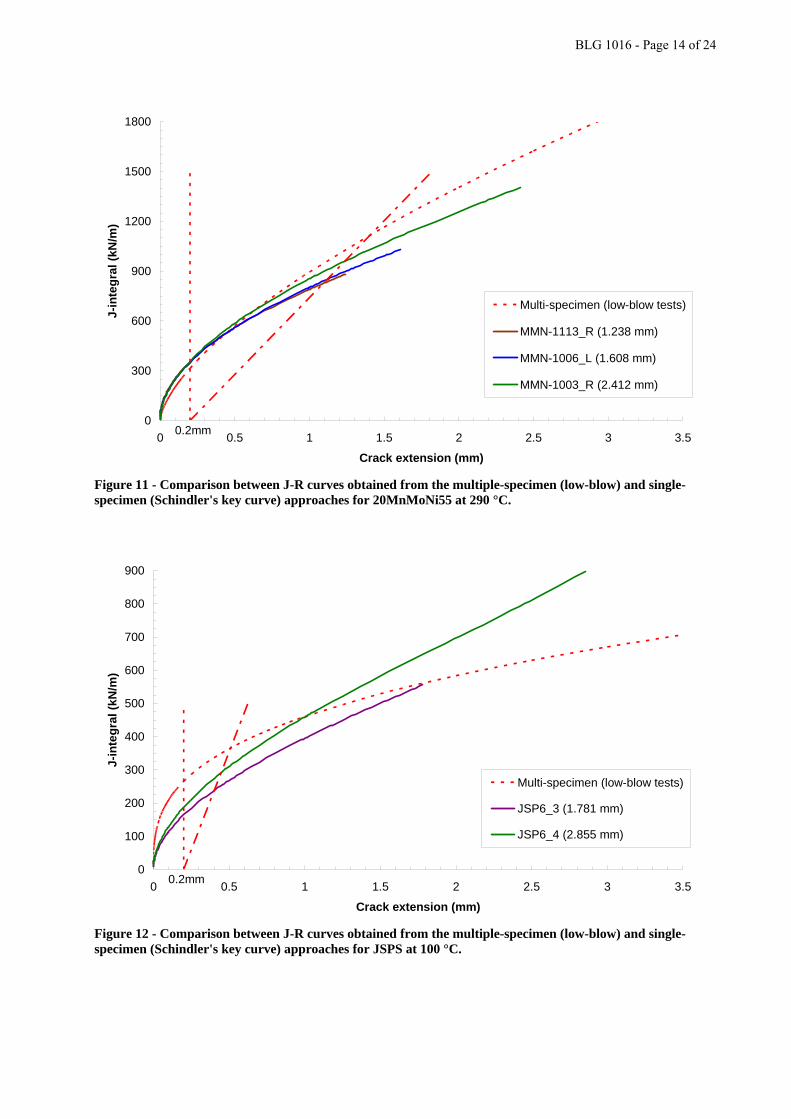
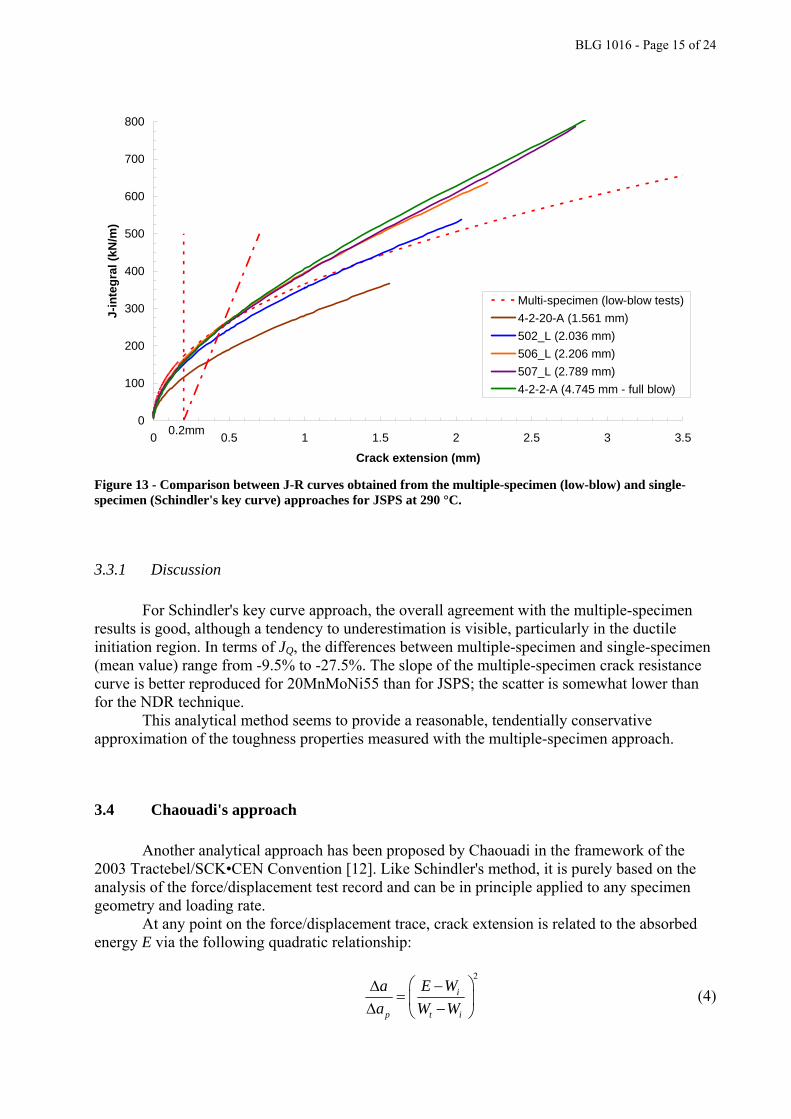
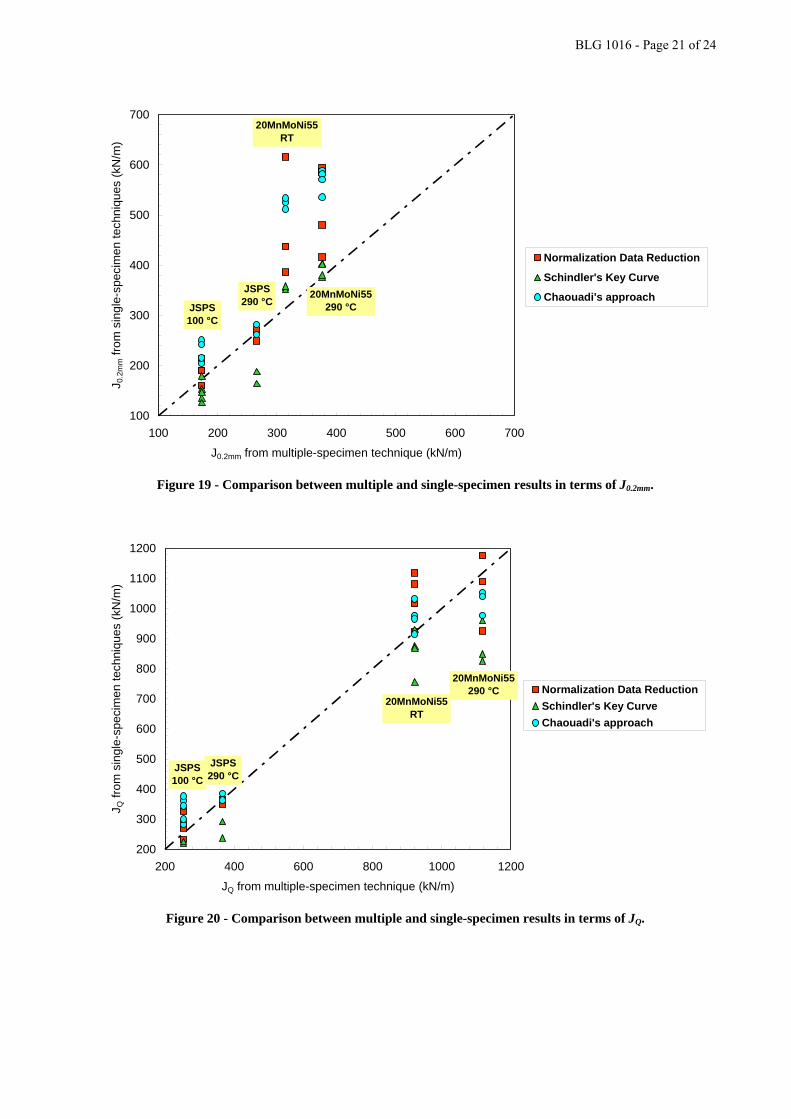