the use of satellite data for drought ... - un-spider
TRANSCRIPT
Sergii Skakun1,2, Nataliia Kussul1,2, Felix Kogan3, Tatiana Adamenko4, Oleksii Kravchenko1, Andrii Shelestov1,2,5, Olga Kussul2, Andrii Kolotii1,2 1Space Research Institute NASU-NSAU 2National Technical University of Ukraine “KPI” 3National Oceanic and Atmospheric Administration 4Ukrainian Hydrometeorological Center 5National University of Life and Environmental Sciences of Ukraine Under support of the US CRDF grant “Analysis of climate change & food security based on remote sensing & in situ data sets” (no. UKB2-2972-KV-09)
The use of satellite data for drought monitoring & food security in Ukraine in the context of climate change

Content
• Objective of the study • Climate in Ukraine • Methodology
– VHI for drought monitoring – Empirical regression models – Crop growth simulation model (WOFOST)
• Results • Discussion & conclusions

Objective of the study
• The two main components of crop production monitoring are – crop yield forecasting and – crop area estimation.
• Accurate crop yield forecasts several months in advance of the harvest is crucial at global, national and region scale
• Yield is an indicator of droughts • Ukraine
– 8th largest exporter and 10th largest producer of wheat in the world in 2011, world leader producer of sunflower oil
• Objectives – to assess relative efficiency of using satellite data for winter
wheat yield forecasting for Ukraine at oblast level – to compare performance of regression models to crop growth
simulation

1960-2010 Average Annual Temperature (deg C) - Mean for UKRAINE
T/50y growth (Degree C) Annual 1.45 Warm M 1.10 Cold M 1.35 Min 2.80 Global 0.74/130y
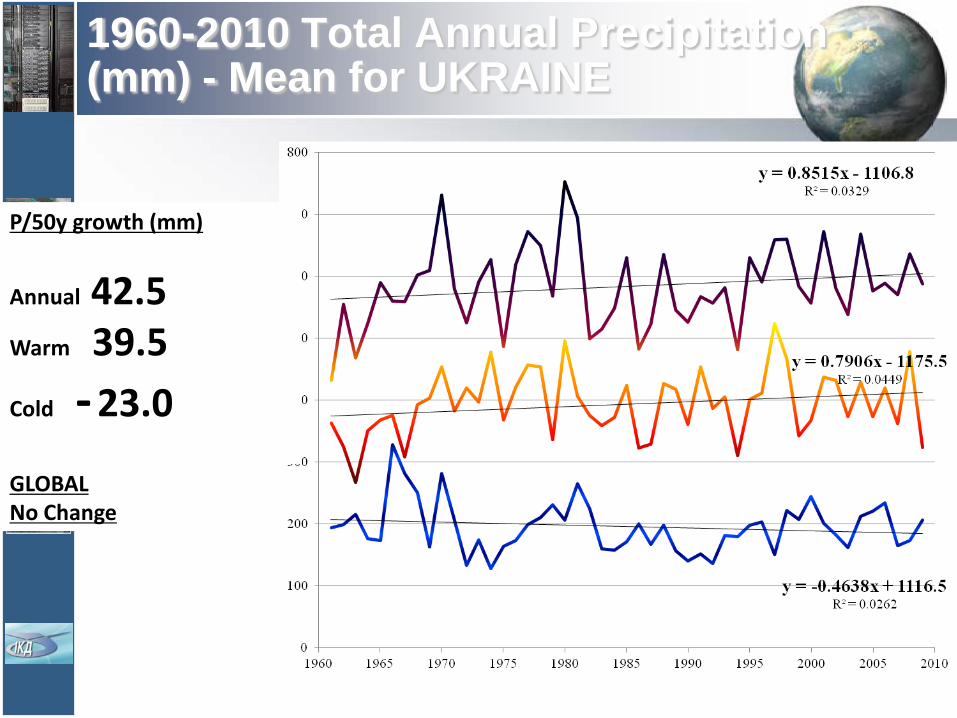
1960-2010 Total Annual Precipitation (mm) - Mean for UKRAINE
P/50y growth (mm)
Annual 42.5 Warm 39.5 Cold - 23.0
GLOBAL No Change

CHANGES /Per 50-y
SNOW: -10 cm reduction TAbs.Min +1.5 deg C increase WW kill Area -10% reduction
Snow Depth (a), Abs Min Winter T in Deg C (b) & % Winter Wheat Kill Area (c), UKRAINE
(a)
(b)
(c)

7
Dynamics: Drought Detection & Monitoring 2010, RUSSIA, UKRAINE
AFFECTED * Air pollution I(ntensive & long Smog)
* Crop losses * Swamps Burning * Grain exports restriction * International grain price * Human health * Tourism * River shipping
The method is based on estimation of green canopy stress/no stress from indices, characterizing moisture (M) and thermal (T) conditions of vegetation canopy (Kogan 1990, 1997). These conditions are derived from the reflectance/emission in the red (R), near infrared (NIR) and infrared (IR, 10.3-11.3 µm) parts of solar spectrum measured by the Advanced Very High Resolution Radiometer (AVHRR) flown on the NOAA afternoon polar-orbiting satellites since 1981.

Percent Drought Area & Intensity 2001-2011

Existing approaches to yield forecasting • Empirical models
– connect crop yield with some selected predictors (vegetation indices, meteorological observations)
– Pros • require little data inputs • easy to implement
– Cons • lack robustness and generalization ability • data-driven, i.e. their performance strongly depends on
available datasets • Crop growth models
– simulate the growth of crops to retrieve biophysical crop parameters such as crop production, biomass, water use, etc.
– Pros • quite generic and robust
– Cons • numerous input parameters to run the model • proper adaptation still needed

Data used
• MOD13 product (NDVI) at the 250 m resolution for 2000-2011
• ESA Global Land Cover map (GlobCover) at the 300 m resolution for 2008
• Monthly meteorological observations from 180 stations in Ukraine for 2000-2011
• Official statistics of winter wheat yield for Ukraine at oblast level for 2000-2011

Methodology
• Empirical regression-based model that uses as a predictor 16-day NDVI composites derived from MODIS – NDVI averaged for oblasts by crop masks – trend eliminated from yield – robust regression – model specific for each oblast
• Adapted for Ukraine Crop Growth Monitoring System (CGMS) that is based on WOFOST crop growth simulation model and meteorological parameters [UHMI]

Methodology – cont’
• Empirical regression-based model that uses as predictors meteorological parameters – parameters
• Maximum temperature • Minimum temperature • Average temperature • Precipitation • Soil moisture
– 0-20 cm depth – Available for months: Sept, Oct, Apr, May, June
– Non-linear multivariate regression – Gaussian process

Efficiency assessment
• Cross-validation – leave-one-out cross-validation (LOOCV) – using a single observation from the original sample
as the testing data, and the remaining observations as the training data
• Criteria – RMSE on testing data
• Pi and Oi are predicted and observed winter wheat yields
• Relative efficiency
– dYi deviation from trend
( )∑ −=i
ii OPn
RMSE 21
( )2
21
)()(
Rel.eff.RMSE
dYn
YVYV i
i
satellite
sample∑
==

Results for NDVI regression model – cont’ • Relative efficiency and coefficient of
determination of the regression model for different agro-climatic zones averaged by oblasts

Results for NDVI regression model – cont’

Comparison of models
• All three approaches were used to forecast winter wheat yield for independent data sets for 2010 and 2011, – i.e. on data that were not used within model
calibration process

Comparison of models – cont’
• Histogram of the RMSE values for winter wheat yield forecasting for 2010 (A) and 2011 (B)

Winter wheat forecast for 2012
• Operational forecasting of winter wheat yield in Ukraine for 2012 based on Earth observation
Winter wheat forecasts for Ukraine for 2012 as of 2 June 2012

Conclusions
• NDVI-based regression model was effective in producing yield forecasts in April-May, i.e. 2-3 months prior to harvest
• Relative efficiency of NDVI-based model was dependent on agro-climatic zones ranging from 1.2 to 1.9
• The sign of errors for all three approaches was the same
• Drought area in Ukraine does not experience any trend after 2000, although the last 50-year country average annual temperature increased 1.45°C (twice above the global increase)
• Total annual precipitation increased by 40 mm offsetting drought intensification due to a warmer climate.

Thank you!