the use of quantitative and qualitative survey … · 2007-11-17 · the use of quantitative and...
TRANSCRIPT

THE USE OF QUANTITATIVE AND QUALITATIVE SURVEY RESULTS TO INFLUENCE POLICY: THE CASE OF PARTICIPATORY SERVICE DELIVERY (PSDA) IN ZANZIBAR
SLAUS T. MWISOMBA DAR ES SALAAM, TANZANIA Email: [email protected]
Q-squared • Centre For International Studies • University Of Toronto 1 Devonshire Place, Toronto ON M5S 3K7 Canada
t: 416-885-7721 • f: 416-652-1678 • e: [email protected]
Q-Squared Working Paper No. 50 November 2007

Introduction
When the Revolutionary Government of Zanzibar (RGOZ) was reviewing its first generation Zanzibar
Poverty Reduction Plan (PRSP) in its Swahili acronym MKUZA, it was found out that its M&E could
only track inputs, outputs, outcome and impact. Inputs are the resources that are needed to implement plan
activities. Outputs include those achievements derived directly from the management of inputs. The
activities that are implemented lead to activity output like the number of workshops conducted, the
number of staff trained and so on. In turn, a series of activities outputs, if implemented correctly, should
lead to some results or outcome. How the results are going to be achieved is reflected by the activities. In
the long run, changes in outcome should lead to achieve the intended impact. However, to achieve the
intended impact, the process should be implemented correctly. The current system of mid term evaluation
and end of term evaluation miss a lot of opportunities within each year. Yearly resources committed are
not seriously followed to see whether the resources and activities are actually in line with the intended
outcomes. How then can the M&E system check that the annual activities are being implemented as
desired and the resources are being rightfully used to reach the targets?
In this paper, the aim is to:
• Inform that the ZSGRP has adopted the CRC as a yearly monitoring tool because developing
country citizens need to develop a culture of evaluating the quality of services they receive.
• Show how the results were taken on board by the government to institute cost sharing for water
supply.
• Advice how developing countries with second generation PRSPs can adopt the CRC in their wings
at the sub national levels as a poverty monitoring tool that would assess the quality and value of
services of different providers.
1

Background and Justification
One requirement under the implementation of the Zanzibar Poverty Reduction Plan (ZPRP) was that the
implementation and management of the programmes and policies set out in the ZPRP were to be carried
out with the full involvement of the peoples of Zanzibar. PRSP review also recommended that the RGOZ
must regularly undertake social audits of their services to gather the opinion of their citizens on access to
and quality of services. Hence, these two demands called for the adoption of a tool within the M&E setup,
to also monitor and evaluate implementation process yearly, while the M&E system continues also to
traditionally monitor and evaluate intermediate outputs and outcomes as well as impact. It was at this
juncture that the RGOZ sanctioned to pilot how to monitor the annual implementation process by using
the Public Service Delivery Assessment (PSDA), which is a form of Citizen Report Card (CRC), in two
districts and including two sectors; Drinking Water and Primary Education services by soliciting the
impressions of those who receive these services.
PSDA ensures an explicit focus on public service delivery, quality of, access to and satisfaction with
services being delivered. Public Service Delivery Assessment is a major performance tool, it is simple and
entails users of services themselves engaging with service providers to define issues and problems related
to service delivery and propose solutions together.
In developing countries, good governance has become as imperative to poverty reduction as it has become
to development more generally. Good governance is variously described as governance that is
accountable, transparent, follows the rule of law and allows for participation or citizen voices to be heard
and considered (Casson, K. 2001; Donahue,J., and Joseph, N. 2003). It is all too clear that when a
government performs poorly, resources are wasted, services go undelivered, and citizens are denied social,
legal and economic protection. There should be a way that the government is informed about citizen
perceptions.
2

Participation is a central element of democracy and increasingly, citizen participation in economic policy
is advocated as a way to make government spending more pro-poor. Getting good governance calls for
improvements that touch virtually all aspects of the public sector from institutions that set the rules for
economic and political interaction, to organizations that manage administrative systems and deliver goods
and services to citizens, to the interface of officials and citizens in political and bureaucratic arenas.
Efforts to date suggest important lessons about how government capacity can be improved and how the
role of the civil society in building more effective and responsive government can be strengthened. In this
brief, we consider the participation of civil society and the poor in improving government effectiveness
and responsiveness through Participatory Service Delivery Assessment Surveys (PSDA).
PSDA ensures an explicit focus on public service delivery, quality of, access to, satisfaction with services
being delivered. Public service delivery is a major performance tool, it is simple and entails users of
services themselves engaging with service providers to define issues and problems related to service
delivery and propose solutions together.
The Definition of Participatory Service Delivery Assessment (PSDA).
This method has a fairly recent history in statistical dealings in the developing world. The Survey uses the
Citizen Report Card (CRC) to elicit feedback through sample surveys on specific aspects of service
quality that users know best, and enable public agencies to identify strengths and weaknesses in their
work. The CRC provides an empirical bottom-up assessment of the reach and benefit of pro-poor services.
It as well serves to identify the key constraints that citizens –especially the poor and underserved- face in
accessing public services, benchmark the quality and adequacy of these services as well as the
effectiveness of the staff providing the services. These insights help generate recommendations on sector
policies, programme strategy and management of service delivery, to address these constraints as well as
improve service delivery.
3

Why conduct stakeholders’ perceptions
1) Gain an understanding of service consumers perception between rural/urban as regards evaluation
of services rendered by the LGC as well as obtain relevant data for measurement of perception
indicators relevant to LGC service delivery in the communities.
2) To establish a basis for designing an appropriate strategy on service delivery in line with
stakeholders interests in that community of sub national level.
3) Determine the appropriate reform measures in service delivery.
Historical Origin
The Citizen Report Card concept was first introduced in Bangalore, India, in 1993, through the efforts of
the Public Affairs Centre, (McGee and Norton, 2000; Goetz and Gaventa, 2001), as a public feedback
mechanism both to enable citizens to signal service providers about their performance and to stimulate
providers to respond to these signals. This led to a positive impact on the citizen’s awareness of the city’s
public service problems and the citizen’s ability to assess the performance of the public services in the
city. The report card gives the service providers the kind of information they need to seek reform in
specific activities and for the citizens to demand greater public accountability.
The successful experience with the report cards in Bangalore, led the World Bank to pilot the citizen
report card on Pro-Poor services assessment of the performance of selected government services based on
client experience. The World Bank piloted the citizen report card on Pro-Poor services assessment in
Philippines where it sought feedback of ordinary citizens on public services in the country. In Kenya, the
citizen report scorecard has been used in the Kenya Urban Bribery Survey, in order to assess the corrupt
practices in urban areas and thereby help inform strategies to increase transparency and accountability at
4

the local level. The Citizen Report Card has also been used in Bangladesh about the services being
provided by the local governments.
Zanzibar Experience
One requirement under the implementation of the Zanzibar Poverty Reduction Plan (ZPRP) is that the
implementation and management of the programmes and policies set out in the ZPRP are to be carried out
with the full involvement of the peoples of Zanzibar. PSDA is a tool that was meant to gain insights into a
community’s reaction to organization practices and goals. The PSDA on the Pro-Poor services assessed
the performance of selected government services based on client experience. This signifies the
commitment of the Revolutionary Government of Zanzibar (RGOZ) to move away from past practices
that development activities were planned and implemented without much consultation with the citizens on
their relevance and impact, to a new approach where participation and consultation are the norm. Within
this new approach, the RGOZ has committed itself to facilitate a process of participatory monitoring and
evaluation of poverty reduction efforts with the beneficiaries. This called for the adoption of the PSDA
tool to monitor and evaluate implementation process. Several other surveys like Household Budget Survey
(HBS), Demographic and Health Survey (DHS), Labour Force Survey (LFS) and Agricultural Survey
have been identified to generate indicators for the ZPRP. PSDA ensures an explicit focus on public service
delivery, quality of, access to, satisfaction with services being delivered. Public service delivery is a major
service performance monitoring tool, it is simple and entails users of services themselves engaging with
service providers to define issues and problems related to service delivery and seek solution together.
The PSDA using the Citizen Report Cards is meant to supplement other surveys and not meant to be a go
alone endevour. There is emphasis on user feedback related to performance of public services, especially
those pro-poor ones, through which feedback on experiences with public services is collected, analyzed
and disseminated in a systematic and transparent manner. After all, the citizen’s voice matter a lot in the
5

design, delivery and assessment of public services. The user feedback, when converted into voice backed
by large number of people, can stimulate governments to redesign services and rectify the problems faced
by the people and reported in the survey results.
The catch in adopting and internalizing the PSDA results in planning and decision making, rests on how it
is carried out and who are involved from the inception stage. The involvement of all stakeholders is
essential because the method, the process and the results must be accepted and eventually used by all
parties in the development field in the area concerned. For this to be practical, the selection of the sample
must also follow the system used in the data collection system in the country. This will allow
comparability as well as accepting the results as a form of an alternative source. This was also followed in
Zanzibar.
Quantitative approaches apply mainly statistical analysis to data collected by standardized questionnaires
through survey methods that have been numerically transformed and comes from sampling frame that
indicates it is representative of a broader population. Qualitative approaches are mainly narrative analysis
focusing on data that is usually collected by conversation, semi-structured interviews, observation,
participatory methods of focus group discussions, much of which is non-numerical and mostly not being
representative of a broader population.
The results from CRC can shed light on the issues that constrain the poor from assessing and using the
services like availability of facilities, quality of services being provided, costs of using the services and the
behaviour of the staff in these service provider institutions. Apart from exploring the possible ways of
improving the services by listening to the voices of the poor users, the findings can as well be used to
compare with some of the conclusions reached from other analytical studies.
6

The Pilot
Participatory Service Delivery Assessment was undertaken in the West district in Unguja and Chake
Chake District in Pemba on a Pilot exploratory basis in early January 2004 covering public service
provision in two sectors of Primary education and Drinking water. These two districts, which display both
rural and urban characteristics, were purposefully selected to represent Zanzibar. The pilot survey was
undertaken to get a glimpse of how beneficiaries evaluate the services so that there can be in place a
credible system of dialogue between service providers and beneficiaries as well as provide a viable tool
that can make a much focused contribution to monitoring service delivery, especially to disadvantaged
groups such as rural, urban periphery, women, children and the unemployed. ZPRP Task force was
formed specifically to oversee the designing of Citizen Report Card pilot in Zanzibar, a technique adopted
from India. A consortium of fourteen NGOs benefited in collaboration with OCGS, had planned to
undertake Participatory Services Delivery Assessment (PSDA), disseminate main findings to stakeholders
and translate the summary of key findings into simpler language for wider circulation.
The involvement of CSOs very earlier in the process sets the tone for all preceding stages. It creates a
foundation for broad based participation, widespread buy in and legitimacy. This can be done through
planning and policy making processes. CSO engagement enhances the responsiveness of policies to the
needs of citizens, especially poor men and women. CSOs provide alternative views and complementary
sources of data that will enrich policy decisions and design as well as encourage their alignment with the
national vision.
The National Master Sample
The PSDA sample for this pilot in the two districts covered a total of 1015 households in all. The Office
of the Chief Government Statistician (OCGS) coordinated the entire field operations as well as the data
7

entry and analysis. UNDP funded the pilot as well as provided the technical assistance by securing the
services of The Public Affairs Foundation (PAF), Bangalore, India.
The sample was based on the NMS for district level data. According to the NMS of Tanzania, there are
two modules, module A that gives national as well as regional estimates and module B that can give
national regional and district estimates. For module A, there should be selected135 rural EAs and 171
EAs in urban areas in Zanzibar while for Mainland Tanzania in module A there should be 606 villages
from rural areas and 890 EAs from urban areas. For module B in Mainland Tanzania, there should be
selected 3229 villages from rural areas and 3451 EAs from urban areas but distributed to the districts
proportional to population size and 317 rural EAs and 194 urban EAs for Zanzibar respectively for module
B. The tables in the appendices 1 and 2 show the total sizes of samples for each module by region and
district. The table in appendix 1 shows the total number of villages and Enumeration areas in urban areas
in columns two and three respectively while columns four and five show what sample of villages and EAs
should be selected when estimates at national and regional levels are needed. The table in appendix 2
shows the total number of villages and Enumeration areas in urban areas in columns two and three
respectively while columns four and five show what sample of villages and EAs should be selected when
estimates at district levels are needed. From each selected village or EA 15 households were randomly
selected and a questionnaire was administered to these households.
The Output
The pilot PSDA was an attempt to transfer international best practices in public service delivery reform to
Zanzibar Poverty Reduction Plan as well as build awareness and capacity in the stakeholders, offer
diagnostic pointers to service providers who in turn will improve the quality of services. The Pilot PSDA
results have thrown light on the constraints Zanzibaris face in accessing drinking water and primary
education services, their views about the quality and adequacy of drinking water and primary education
8

services and the responsiveness of government officials. The results also provided valuable insights on the
priorities and problems faced by the clients and how these services may be better tailored to the needs of
Zanzibaris in general and the poor in particular. Through the survey, citizens got to speak out on the
quality and affordability of the drinking water and primary education services and also revealed their
awareness and access to the programmes in the two sectors in the districts.
According to table 1, in 2004, the pipe water supply reached about 77% of households. The reach was
better in West District (86%) compared to Chake Chake (64%). Common public taps were reported as the
single most used source of drinking water in the survey (43%), followed by household pipe connection
(34%). Table 1 below has more details.
Table 1: Distribution of Households by Main Sources of Drinking Water
(All figures in percentages)
Normal Water Source Total West District Chake Chake
Household Pipe 34 38 28
Common Public Tap 43 48 36
Boreholes within the house 01 02 0
Boreholes outside the house 02 02 0
Protected well 02 02 02
Unprotected well 12 01 222999
Others 06 07 05
Source: PSDA survey, 2004
9

Access to common public taps is quite good with 90% of users reporting the availability of a common
public tap within 300 m from their residences; 78% of users report that it takes them less than 10 minutes
to reach the source. However, access to unprotected wells (the second most used common public water
source) is a matter of some concern, as more than one-third of the users report the availability beyond 300
m from their residences; 60% of the users report taking more than 10 minutes to reach the source. Table 2
below has more details concerning access to water sources.
Table 2: Access to Common Public Water Sources
(All figures in percentages)
Access Parameters
Distance Time taken
Water Source
<100 m 100-
300m
>300m <10min 10-20 >20min
Common Public
Tap
65 25 10 78 19 03
Boreholes outside
the house
66 07 27 73 27 0
Protected well 41 45 14 78 22 0
Unprotected well 24 45 333111 5 40 55666 04
Source: PSDA survey, 2004
The reason for people not having household pipe connection varies. The main reasons are “cannot afford”
(54%) and “no supply in the area” (21%). Reasons such as “non-reliable water supply” were quoted only
10
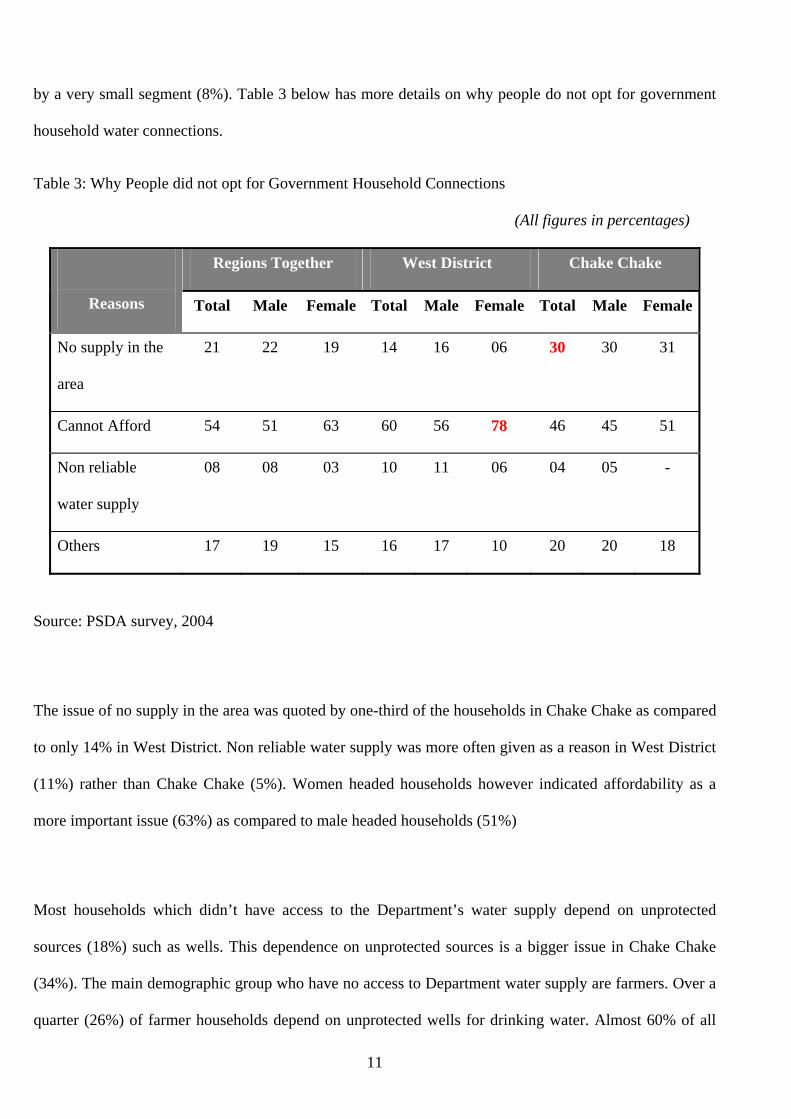
by a very small segment (8%). Table 3 below has more details on why people do not opt for government
household water connections.
Table 3: Why People did not opt for Government Household Connections
(All figures in percentages)
Regions Together West District Chake Chake
Reasons Total Male Female Total Male Female Total Male Female
No supply in the
area
21 22 19 14 16 06 30 30 31
Cannot Afford 54 51 63 60 56 78 46 45 51
Non reliable
water supply
08 08 03 10 11 06 04 05 -
Others 17 19 15 16 17 10 20 20 18
Source: PSDA survey, 2004
The issue of no supply in the area was quoted by one-third of the households in Chake Chake as compared
to only 14% in West District. Non reliable water supply was more often given as a reason in West District
(11%) rather than Chake Chake (5%). Women headed households however indicated affordability as a
more important issue (63%) as compared to male headed households (51%)
Most households which didn’t have access to the Department’s water supply depend on unprotected
sources (18%) such as wells. This dependence on unprotected sources is a bigger issue in Chake Chake
(34%). The main demographic group who have no access to Department water supply are farmers. Over a
quarter (26%) of farmer households depend on unprotected wells for drinking water. Almost 60% of all
11

users of common public water sources had to make more than 5 trips to the source to collect drinking
water for their use at home. This proportion is marginally higher for Chake Chake (64%) as compared to
West District (56%). Those depending on unprotected wells travel greater distances to collect water;
(31%) travel more than 300 m to collect water from this source as against (10%) for common taps.
Quality of public water supply
Most users (94%) of services of the water department found it easy to secure a domestic piped water
connection. While more than half of those who have tap connections get water supply every day, in West
District (76%) of households had reported that they get daily supply while in Chake Chake district only
(31%).reported daily supply. Table 4 shows the frequency and duration of household piped water supply
Table 4: Frequency and duration of Household piped water supply
(All figures in percentages)
All the regions West District Chake Chake Frequency
T <5 5-10 10> T <5 5-
10
>10 T <5 5-
10
>10
Daily 61 02 10 88 76 02 11 87 31 03 - 97
Alternate
Days
11 22 13 65 07 31 17 50 19 14 10 76
Once in 3
days
07 13 22 65 04 11 22 67 12 14 22 64
Don’t know 21 31 29 40 13 48 14 38 38 19 39 42
Source: PSDA survey, 2004
12

Majority (61%) of the respondents reported getting daily supply of piped water while 88% of those
receiving daily supply of piped water report more than 10 hours of availability. However, access to
unprotected wells, which is the second most used common public water supply source, is a matter of some
concerns as more than one-third of the users reported the availability beyond 300 m from their residences
and at the same time 60% of the users reported taking more than 10 minutes to reach the water source.
Table 5 below shows different water sources and access parameters.
Table 5: Access to Common Public Water Sources and Access Parameters.
(All figures in percentages)
Access Parameters
Distance Time taken
Water Source
<100 m 100-
300m
>300m <10min 10-20 >20min
Common Public
Tap
65 25 10 78 19 03
Boreholes outside
the house
66 07 27 73 27 0
Protected well 41 45 14 78 22 0
Unprotected well 24 45 333111 5 40 55666 04
Source: PSDA survey, 2004
Among those using common public taps, a larger proportion of households in West District had to travel
more than 300 m (14%) as compared to users in Chake Chake (2%)
13

Seventy percent of respondents report that the water supplied through household piped connection is
adequate to meet their requirements; this proportion is slightly low in Chake Chake with only 59%
reporting in the affirmative.
Copping with Seasonal Scarcity
One in two respondents experienced seasonal scarcity (51%) of which 41% were compelled to shift their
regular sources of drinking water supply. This proportion, which shifts the sources, is higher in Chake
Chake with 56% of the respondents reporting the source; the corresponding figure for West District is
37%. Thus the problem is bigger in Chake District than in West District.
Users of household connections experienced greater scarcity (53%) as compared to those using common
taps (49%). However, highest scarcity was experienced by users of unprotected wells (62%). Scarcity
among users of household pipe connections and unprotected wells was significantly high in Chake Chake
(62%). Table 6 below clearly specifies the situation vividly.
14

Table 6: Proportion of Households Experiencing Scarcity by Source of Water.
(All figures in percentages)
All regions together West District Chake Chake
Source of
Normal Use
Total users Reporting
scarcity
Total users Reporting
Scarcity
Total users Reporting
scarcity
Household Tap 34 53 38 43 28 69
Common Tap 43 49 48 49 36 48
Borehole
within house
01 06 02 06 0 -
Borehole
outside house
02 33 02 33 0 -
Protected well 02 43 02 13 02 N too
small
Unprotected
well
12 62 01 N too
small
222999 62
Others 06 46 07 34 05 65
Source: PSDA survey, 2004
The response to scarcity offers some very interesting findings. Most households experiencing
scarcity move to unprotected wells during this period. Twenty seven percent of households
28% with tap connections and using common taps and 86% using un-protected wells move to
other unprotected wells during this period. The other key support systems are the common
tap; 22% of household tap connections and 30% common tap connections move to other
15

common taps during this season. Protected wells also provide an important support system for
12% of household tap users and 22% of common tap users during periods of scarcity. The table
below has more details.
Table 7: Transition in Drinking Water Sources during Scarcity by sources of Water supply.
(All figures in percentages)
Source During Scarcity Times Source
during
normal
times
Piped
Water
Common
Taps
Boreholes
outside
Boreholes
inside
Protected
well
Unprotected
wells
Others
Piped water 03 22 01 04 12 28 30
Common
taps
- 30 N too
small
N too
small
22 28 20
Boreholes
outside
Boreholes
inside
Number of observations too small to draw conclusions
Protected
wells
- - 20 - 60 - 20
Unprotected
wells
- 09 - - N too
small
86 N too
small
Source: PSDA Survey results, 2004
This transition during scarcity periods is not easy. About 26% of household collect water from a
distance of over 300 meters during the scarcity season as against 15% during normal
conditions. Zanzibar Government recognized the link that exist between poverty reduction and improved
water supply services. In the ZPRP 2002, water was regarded as a fundamental component of the plan. A
16

significant step in this direction had been the development of the Draft Water Policy, which was approved
by the Cabinet on December 31, 2003. The Draft Water Policy provides guidance on a number of issues
like pricing, equitable allocation, private-public partnerships, gender awareness and mainstreaming, use of
appropriate technologies and design of new institutional and regulatory frameworks. The draft was not
acted upon.
Concerning their willingness to pay for water services in Zanzibar which so far is provided freely by the
government, there are about seven out of every ten users of public drinking water facilities who reported
that they were willing to pay for the services if better services are assured and the amount mostly quoted
was Tshs. 10 00 per month. Along with showing their willingness to pay as well as the amount they are
prepared to pay in a month, they also suggested on how the water service providers could engage the
public to improve the services. Breakdown in water supply services is a problem that confronts many
households and about 21% of households report breakdowns at least once in a month. District profiles
show a big variation with 32% of users in Chake Chake reporting breakdowns at least once in a month as
compared to 16% in West District.
Table 8: Proportion Reporting Breakdowns at least Once a Month by Source of
Water Supply. (All figures in percentages)
Source of Water Total West District Chake Chake
All sources 21 16 32
Piped Water 20 14 33
Common Tap 21 16 31
Source: PSDA survey, 2004
17

About 70% of these problems were attended to within a week’s time. However, problem resolution within
a week is marginally lower in Chake Chake (60%). In case of any problems with public water sources,
more than one third of the users (37%) report that they prefer not to contact any official; 28% prefer the
officials of the water department and 9% prefer private technicians as the first point of contact in case of
any breakdown.
How satisfied are the people with the public Water Supply System
A much higher proportion of users of household piped connections (82%) and common public taps (82%)
express satisfaction with the quality of water as compared to the users of common boreholes (52%) and
other public sources (66%). However, the satisfaction scores drop when it comes to the quantity of water
availability from different sources. While, 71% and 74% of the users of household piped water and
common taps express satisfaction with the quantity of water they receive, the comparative proportion for
common boreholes is only 52%. The most significant drop is in the case of other public sources (of which
unprotected wells are a major source) where only 32% of users report satisfaction.
Table 9: Satisfaction of Users with Quality & Quantity of Water Supplied
(All figures in percentages)
Water Quality Source of Water
Satisfied Dissatisfied Don’t Know/CS
Household Tap 82 17 01
Common Taps 82 18 -
Common Boreholes 52 48 -
Other Public Sources 66 33 01
18

Water Quantity
Household Tap 71 29 -
Common Taps 74 26 -
Common Boreholes 52 48 -
Other Public Sources 32 65 03
Source: PSDA survey, 2004
Satisfaction with the quality of water from household taps and common public taps is quite high with 82%
each. Common boreholes are, however a cause for concern as almost half of the users are dissatisfied.
Surprisingly, quality of water from other public sources, of which unprotected wells form a significant
proportion, is high at 66%.
Across regions, dissatisfaction with the quantity of water supply through household piped connection is
significantly higher in Chake Chake (42%) as compared to West District (22%). Similarly, 64% of the
users of other public water sources in Chake Chake expressed dissatisfaction with the quantity of water as
compared to 36% in West District.
19

Table 10: Levels of satisfaction by households with the Quality & Quantity of Water
(All figures in percentages)
Level of Satisfaction Total West District Chake Chake
Quality of Water (Household Connection)
Strongly Satisfied 56 65 40
Satisfied 26 20 37
Dissatisfied 09 06 16
Strongly Dissatisfied 09 09 07
Quantity of Water (Household Connection)
Strongly Satisfied 48 57 32
Satisfied 21 21 26
Dissatisfied 14 10 19
Strongly Dissatisfied 16 12 23
Quality of Water (Common Taps)
Strongly Satisfied 61 64 57
Satisfied 21 20 28
Dissatisfied 08 05 11
Strongly Dissatisfied 10 11 04
Quantity of Water (Common Taps)
Strongly Satisfied 55 56 54
Satisfied 19 16 23
Dissatisfied 13 14 17
20

Strongly Dissatisfied 13 14 06
Quality of Water (Other Public Sources)
Strongly Satisfied 24 38 21
Satisfied 34 38 32
Dissatisfied 17 07 20
Strongly Dissatisfied 25 17 27
Quantity of Water (Other Public Sources)
Strongly Satisfied 22 30 21
Satisfied 20 34 15
Dissatisfied 29 16 33
Strongly Dissatisfied 29 31 20
Source: PSDA survey, 2004
Clearly, scarcity has an impact on satisfaction with the quantity of water received from public sources.
About 95% of the dissatisfied respondents with household taps were the ones experiencing severe scarcity
and dissatisfaction with common taps was at the rate of 82%.
Willingness to Pay
About 65% of all users of public drinking water facilities reported that they were willing to pay more if
better services are assured; the amount people are willing to pay per month is Tsh. 1000 (median) with
91% quoting monthly billing system as the preferred system.
21

The proportion of users reporting willingness to pay is significantly higher in West District (72%) as
compared to Chake Chake (52%).
Conclusion
The PSDA has revealed more relevant information for decision making than what was available from
other sources. It has revealed perceptions and how the people think on ways they can participate in the
water supply sector. This wealth of information gave decision makers in the department of water the
power to move ahead and to send a bill to the House of Representatives for the formation of a Water
Agency, whose among other mandates, is to institute cost sharing culture. The insights derived from the
CRC pilot test has shed light on the issues that limit the poor from accessing and using drinking water
services. The finding on the people’s willingness to pay for better services has also given the department
of water a starting point to initiate to move towards a cost sharing water supply system that could improve
service quality and efficiency. Girls and adult females are the regular fetchers of water for the households
even during the times of scarcity; therefore improving water supply and access will leave these two groups
with ample time for other development activities. The community needs to participate if the system is to
be sustainable.
The RGOZ through the implementation of the ZSGRP has adopted PSDA as a tool for Participatory
monitoring and evaluation because it is a credible and focused feedback tool on service quality and many
more other pointers for policy initiatives. For example, the outcome from the pilot PSDA pilot was put
into use where the Ministry of Education learnt that there were still some school- going children as well as
some disabled children who do not attend classes. This led to the insistence that every school going child
should be in school and started to train teachers to take care of the deaf and dump.
22
The biggest challenge however, is in addressing the issue of scarcity. An important part of this challenge
is in improving the safety of wells which are extensively used in times of scarcity. Any investment in this
will benefit many households. The department of water now emphasizes the revival of wells so that these
wells can serve the people in the dry season, addressing the issue of scarcity. Therefore improving the
safety of wells, which are extensively used in times of scarcity, will benefit many households. Information
that has been available from HBS is that of sources of water, distances to these sources and not quality of
water and satisfaction levels of the water users.
The catch in adopting and internalizing the PSDA results in evidenced based planning and decision
making, rests on how it is carried out and who are involved from the inception stage. The involvement of
all stakeholders, that is, central the government, the local authorities and the NGOs who agitate for their
own comprehensive alternative source of evidence, is essential because the method, the process and the
results must be understood, accepted and eventually used by all stakeholders in their development fields.
Most of the planners and decision makers in government and private sector are currently used to the
quantitative sources like the HBS, DHS, Labour Force Survey and other quantitative surveys carried out
by their National Bureau of Statistics. Therefore, for such qualitative sources to be accepted, the selection
of the representative sample must be scientific by following the system used in the data collection by the
National Statistics Office in the country. This will allow comparability, representation as well as
acceptance of the results as a form of an accurate and scientific alternative source of correct data. As the
saying goes, if you cannot beat them, join them. Let us adopt the scientific methods in collecting the
Qualitative data for evidence based planning and decision making.
23
References:
1) The Implementation Consortium: “Participatory Service Delivery Assessment on Drinking Water
& Primary education in Zanzibar”. A pilot Citizen Report Card. Summary of the Findings. March,
2004.
2) Casson, Kathryn, 2001: “Governance and the Poverty Reduction Strategy Process: A Review of 23
I-PRSPs and PRSPs.” London: Department of International Development.
3) Donahue, John and Joseph Nye, 2003: Towards a World Governance Assessment: Preliminary
Findings from the pilot Phase. United Nations University, Working Paper.
4)Naimani G. M. 2003: “The Sample Design of the National Master Sample and Agriculture Survey/
Census in Tanzania (Draft) UDSM, August, 2003.
5) Moshi, H.P.B., A.K.Shaaban, R..Kibao (eds) 2004: Zanzibar: Challenges of Globalization and
Poverty Reduction. RGOZ. Ministry of Finance and Economic Affairs.
6) RGOZ, 2003: The Zanzibar Population Policy for Sustainable Development. Ministry of Finance
and Economic Affairs, Zanzibar Population Planning Unit-Zanzibar.
24

Appendix 1: The National Master Sample
List of regions, number of villages, number of urban EAs and number of villages/EAs to be selected for
Module A in Mainland Tanzania and Zanzibar.
Number of Number to be selected Region
Villages Urban EAs Villages Urban EAs
1. Arusha 297 902 27 50
2. Coast 421 470 30 30
3.Dar es Salaam 53 6520 27 300
4.Dodoma 497 486 30 30
5.Iringa 648 626 30 40
6. Kagera 599 224 30 30
7. Kigoma 245 487 27 30
8. Kilimanjaro 425 681 30 40
9. Lindi 407 332 27 30
10. Manyara 279 314 27 30
11. Mara 412 630 27 40
12. Mbeya 779 945 30 50
13. Morogoro 546 1210 30 50
14. Mtwara 541 666 30 40
15.Mwanza 701 1201 30 50
16. Rukwa 410 425 27 30
17. Ruvuma 435 393 30 30
18. Shinyanga 859 598 30 40
19. Singida 353 302 27 30
20, Tabora 502 473 30 30
25

21. Tanga 696 686 30 40
Total Mainland 10105 18571 606 890
Zanzibar
22. Kaskazini-Unguja 306 6 27 6
23. Kusini-Unguja 192 11 27 11
24. Mjini Magharibi 183 667 27 100
24.Kaskazini-Pemba 307 59 27 27
25. Kusini-Pemba 287 64 27 27
Total Zanzibar 1275 807 135 171
Source: National Bureau of Statistics, August, 2003.
Appendix 2: Total number of villages, urban EAs and number of villages and urban EAs to be selected for
Module B in Mainland Tanzania and Zanzibar.
Number of Number to be selected Region District
Villages Urban EAs Villages Urban EAs
Total Mainland 10105 18571 3229 3451
In Zanzibar, for rural and urban areas, they have all been demarcated in EAs
Total Zanzibar 1275 807 317 194
Source: National Bureau of Statistics, August,
26