the use of nonfinancial measures for executive
TRANSCRIPT

1
The Use of Nonfinancial Measures for Executive Compensation
in High-Technology Industries*
YU-FANG HUANG, National Chengchi University
JIA-WEN LIANG, National Chengchi University
GERALD J. LOBO, University of Houston
DANA ZHANG, University of Houston
June 2016
* Yu-Fang Huang is a PhD candidate Jia-Wen Liang is an associate professor of Accounting
at National Chengchi University, College of Commerce. Gerald Lobo is the Arthur
Andersen Chair of Accounting and Dana Zhang is a PhD candidate at University of Houston,
Bauer College of Business.

1
The Use of Nonfinancial Measures for Executive Compensation in High-Technology
Industries
Abstract
Innovation is an important driver of firm value for high-technology firms; however, its
outcome is long deferred and highly uncertain. We examine the relation between innovation,
a nonfinancial performance measure, and CEO compensation for high-technology firms. We
find that CEO compensation is positively associated with corporate innovation performance,
i.e., innovation output (measured by patent count) and innovation output value (measured
by patent citations). We also find that CEO equity compensation, particularly option
compensation, is more sensitive to these measures of innovation performance than is cash
compensation. Overall, our evidence suggests that boards of directors view patent
performance as an important non-financial performance measure for innovation and
incorporate this information when determining CEO compensation. We also explore
cross-sectional differences in the compensation relevance of patent performance. We find
the relevance varies according to firm characteristics (noise in financial performance and
R&D intensity) and CEO characteristics (CEO tenure and CEO age).
Key Words: non-financial performance measure, innovation, executive compensation,
patent count, patent citations, implicit contract

1
The Use of Nonfinancial Measures for Executive Compensation in High-Technology
Industries
1. Introduction
A growing literature advocates the use of nonfinancial measures in performance
evaluation to supplement traditional financial measures such as accounting earnings and
stock returns (Luft 2009). Accounting measures are viewed as historical and
backward-looking and hence may not fully reflect a manager’s efforts in furthering the
firm’s long-term goals (Ittner and Larcker 1998a). Although stock price is an aggregate of
publicly available information about the firm’s future prospects, it may not be a sufficient
statistic to assess managerial effort and determine appropriate compensation (Davila and
Venkatachalam 2004). Many believe that nonfinancial indicators such as customer
satisfaction, innovation, and product quality are relevant for the firm’s long-term
performance (Kaplan and Norton 1992). Empirical evidence suggests that these
nonfinancial measures are leading predictors of a firm’s accounting and stock price
performance (Ittner and Larcker 1998b; Hirshleifer et al. 2013; Fornell et al. 2006; Gu
2005). We investigate the role of patents, a nonfinancial measure that is especially critical to
the long-run success of high-technology companies, in executive compensation.
Innovation is important in the value-creating process of high-technology firms and is a
key determinant for firm growth (Porter 1980; Lev and Sougiannis 1999; Lev et al. 2008).
However, investments in innovation are highly risky and long deferred (Huang et al. 2015).
Managers’ innovation efforts are not directly observable and may not be fully reflected in
accounting earnings or stock price. Firm’s R&D expenditures need to be expensed
according to GAAP and hence result in a reduction in current net income. The finance
literature shows that it is difficult for investors to process information about assets that are
less tangible and about firms whose future prospects are highly uncertain. As a result, stock
prices do not fully incorporate information about intangible assets such as those that result
from R&D and adverting expenditures (Hirshleifer et al. 2013; Peng and Xiong 2006; Chan
et al. 2001).
Given the importance of innovation for high-technology firms and that accounting
numbers and stock prices may not fully capture a manager’s effort in innovative activities,
nonfinancial measures could play an important role in executive compensation for these
firms. Patent information is a relatively objective and easily accessible nonfinancial

2
measure of innovation. Since the Court of Appeals for the Federal Circuit was formed in
1982, firms have increasingly recognized the need to patent their innovations and been very
active in patent activities (Hall 2005). Patents are thus among the most important measures
of a high-technology firm’s innovative output (Griliches 1990; Lev 2001; Hall et al. 2005;
Hirshleifer et al. 2013). Given the importance of innovation to the long-run success of these
firms, and given that CEOs reside at the strategic apexes of their firms and make critical
resource allocations pertaining to investments in new products and technologies (Balkin et
al. 2000), whether boards of directors provide managers with an incentive to sustain the
firm’s innovation capabilities by linking CEO pay to the firm’s innovative outputs is clearly
an important and relevant question.
Innovation performance may not be explicitly specified in compensation contracts
because compensation plans are usually limited to a small number of performance measures
given the contracting costs of designing and enforcing them (Murphy, 2000). However,
executive incentive plans often allow the board of directors to exercise its discretion when
evaluating and rewarding managers, i.e. implicit contracts (Hayes and Schaefer 2000,
Ederhof 2010). As a result, innovation performance measures such as patent count and
patent citations can provide the board of directors with useful information when assessing
the quantity and value of a firm’s innovation and hence influence executive compensation.
Since innovation performance could be part of the implicit contract rather than the
explicit contract with managers, we do not attempt to examine the disclosures about
compensation contracts in firms’ proxy statements. Instead, we use a sample of
high-technology firms drawn from the ExecuComp database from 1992 to 2006 and
empirically test whether CEO compensation is associated with patent count and patent
citations after controlling for traditional financial performance measures and firm
characteristics previously found to be linked to CEO compensation.
We find that CEO compensation is positively associated with patent count and patent
citations. These results are consistent with boards of directors considering patent count (i.e.,
innovation output quantity) and citations (i.e., innovation output value), to be important
nonfinancial performance measures when exercising their discretion in rewarding CEOs.
We also examine whether different components of executive compensation are
differentially related to innovation performance. Our results indicate that both cash
compensation and equity-based compensation are associated with innovation performance.
The sensitivity of CEO equity compensation, particularly option compensation, to

3
innovation performance is higher than that of CEO cash compensation, consistent with
compensation committees considering long-term risk-taking incentives to be important
drivers of innovation and tying option compensation to innovation performance. Overall,
the results of our empirical analyses indicate that boards of directors compensate CEOs of
high-technology firms for both the quantity and the value of innovations.
Having documented a systematic relation between compensation of high-technology
firms’ CEOs and innovation performance, we next extend our analysis to explore
cross-sectional differences in the association between CEO compensation and the quantity
and the value of innovation. Specifically, we examine whether the association varies with
firm characteristics (noise in financial performance and R&D intensity) and CEO
characteristics (CEO tenure and CEO age). We find that the association between CEO
compensation and innovation performance is stronger when earnings or stock returns are
noisier, consistent with the information hypothesis from agency theory (Holmstrom 1979;
Banker and Datar 1989; Feltham and Xie 1994). We also find that the weight on innovation
performance is higher when firms are more R&D intensive, consistent with the use of
non-financial performance measures being closely linked to a firm’s business strategy
(Ittner et al. 1997). In addition, we find that compensation committees increase the
sensitivity of CEO compensation to innovation performance for retiring CEOs to mitigate
the horizon problem, but reduce the weight on innovation outputs for new CEOs as
innovation takes time to be patented and current innovation performance may be the result
of innovation efforts by the previous CEO.
Our study contributes to the literature on the use of nonfinancial measures in
performance evaluation by demonstrating the importance of innovation performance in
high-technology industries. Patent count and patent citations have a statistically and
economically significant relation with CEO compensation. Our study also provides insights
into the sensitivity of different compensation components to nonfinancial performance
measures. Our findings indicate that compensation committees tie equity compensation,
particularly option compensation, to patent performance to motivate CEOs to focus on
long-term success.1
Our study also enhances understanding of the relationship between corporate
innovation and compensation. Prior studies focus on how to structure compensation plans
1 Faurel et al. (2015) provide evidence that CEO incentives (holding of stock and options) are associated with
future innovation performance. Our study focuses on the incentives provided by the ability of the
compensation committee to reward CEOs based on signals that may not be revealed in financial performance
measures or that even may not be publicly observable.

4
by varying the impact of accounting-based versus stock-based performance measures in
order to affect the risk preference and time horizon of managers and hence incentivize them
to invest in innovative activities (Cheng 2004; Sheich 2012; Holthausen et al. 1995;
Prendergast 2002; Xue 2007; Manso 2011; Lerner and Wulf 2007; Francis, Hasan, and
Sharma 2010; Yanadori and Marler 2006). Our study shows that in order to encourage
innovation, firms could directly link executive compensation to innovative output instead of
relying solely on adjusting the structure of financial-measure-based compensation.
Although innovation may not be explicitly stated in compensation contracts, the board of
directors could consider innovation outputs as part of the implicit contract when evaluating
the CEO’s performance. Our empirical evidence shows that, despite the difficulty of
accurately measuring innovation outputs and mapping current period innovation to future
firm profitability, boards incorporate innovation performance, particularly patent count and
patent citations, when exercising their discretion in determining CEO compensation.
Finally, our study also sheds light on the trade-off between risk and incentives in
executive compensation by supporting the argument that when outcome is long deferred and
highly risky, boards base the reward to managers on criteria they can control and that are
believed to increase firm value (Manso 2011; Ederer and Manso 2013; Prendergast 2002;
Miller et al. 2002). Since innovation is a risky investment that may introduce high volatility
in the firm’s financial performance, compensating managers solely based on financial
measures may impose excessive risk on them. Our study shows that when innovation is
very important for the firm, the board will use nonfinancial performance measures such as
innovation output (patent count) and innovation value (patent citations) in CEO
compensation to reduce the financial risks managers bear and incentivize them to invest
more in innovations.
The rest of this paper is organized as follows. The next section discusses the related
literature and develops the hypotheses. Section 3 describes the measurement of variables
and research design. Section 4 presents the sample selection and reports the empirical
results. Section 5 explores cross-sectional differences in the predicted association between
innovation performance and CEO compensation, and section 6 provides our conclusions.
2. Related Literature and Hypotheses Development
Agency theory on performance evaluation suggests that financial measures alone
may not be optimal in motivating desired managerial actions (Holmstrom 1979; Banker

5
and Datar 1989; Feltham and Xie 1994). In theory, unless the financial measures are
sufficient statistics for all available information about all the dimensions of managerial
actions that owners desire, there is a role for nonfinancial measures in contracting
(Feltham and Wu 1999; Bushman and Indjejikian 1993). Accounting numbers are often
criticized for their backward-looking nature and limitations in reflecting investments in
intangible assets that may help promote the firm’s long-term success (Ittner and Larcker
1998a; Lambert and Larcker 1987; Sloan 1993). Although stock price aggregates
forward-looking information about firm value, it does not fully incorporate the
implications of nonfinancial performance measures (Rajgopal et al. 2003).
Empirical evidence demonstrates that nonfinancial measures such as customer
satisfaction, product quality, market share, and innovative efficiency are leading
indicators of future performance that help predict future accounting and stock price
performance (Hirshleifer et al. 2013; Fornell et al. 2006; Gu, 2005; Banker et al. 2000;
Nagar and Rajan 2001), confirming the potential usefulness of nonfinancial measures in
contracting. Based on an examination of the disclosures about compensation plans in the
proxy statements of 317 firms in 1993 and 1994, Ittner et al. (1997) show that about 36%
of firms employ nonfinancial measures in evaluating CEO performance and the most
widely used nonfinancial indicators are customer satisfaction, nonfinancial strategic
objectives, and product quality. Davila and Venkatachalam (2004) document that
passenger load factor is an important nonfinancial measure in the airline industry to
determine CEO cash compensation.
Technological innovations are important economic resources that provide
competitive advantage to the firm and enable it to generate profits (Drucker 1993). Thus,
firms’ capability in innovation has increased in importance relative to traditional factors
such as labor, land, and capital. While traditional financial measures such as accounting
earnings and stock prices are the most frequently observed performance measures in
executive compensation contracts (Murphy 2000), they do not fully capture managers’
innovation efforts.2
The mandated full expensing of R&D results in a negative impact of innovative
2 A large extant of literature examines how compensation contracts substitute for accounting- and
market-based performance measures when such measures are better indicators of managerial performance
(e.g., Engel et al. 2003).

6
effort on current accounting earnings. Thus, when managerial compensation is tied to
aggregate accounting measures such as ROA, ROE, or EPS, managers have the incentive
to boost current accounting earnings by reducing R&D expenditures (Cheng 2004).
Although stock prices impound information not reflected in accounting numbers, they
may not fully incorporate the information about innovation. One explanation is that the
market underreacts to such information because of limited investor attention, and this
underreaction is especially pronounced for information that is less tangible and for firms
whose future prospects are highly uncertain (Hirshleifer et al. 2013; Peng and Xiong
2006). In particular, investors and analysts do not fully incorporate the implications of
innovation capabilities reflected in patent count or patent citations for future earnings into
stock prices and earnings forecasts (Hirshleifer et al. 2013; Gu 2005). Thus, whether
compensation committees incorporate innovation performance in evaluating managers’
innovation efforts is an empirical question.
Despite the importance of innovation for sustaining the long-run success of a
high-technology firm, there is limited empirical evidence on the role of innovation as a
nonfinancial performance indicator in executive compensation. Ittner et al.’s (1997)
review of proxy statements indicates that only a few firms disclose the use of new product
development (6.1%) and innovation (2.6%) in bonus plans. The numbers reported in
Ittner et al. (1997) likely understate the current importance of innovation as a nonfinancial
measure in executive compensation. First, their study was conducted using a sample of
firms in the early 1990s.3 The relevance of technological innovations has significantly
increased in the two decades since. Second, their study was based on 48 different
industries, including industries such as banking for which innovation is likely not the
firm’s primary strategic focus. Third, examining the disclosures of bonus contracts can
only reflect the use of innovation as an explicit contracting term. If most of the firms rely
on implicit agreements to compensate for innovation instead of explicit contracts,
reviewing the bonus plan in the proxy statement may not fully capture the role of
innovation in executive compensation.
Firms can be viewed as a nexus of explicit and implicit contracts (Zingales 2000).
Many public firms, including some of the largest, choose not to have comprehensive written
3 Another early study by Balkin et al. (2000) that investigate the role of innovation in CEO pay is also based
on a sample of firms in 1993-1994.

7
(or explicit) employment contracts with their CEOs but instead to rely on implicit
agreements (Gillan et al. 2009). Explicit contracts are court-enforceable and thus the
performance measures used in explicit compensation contracts are often objective
performance measures that must be not only observable and verifiable, but also related to
states of the world anticipated in the contract. Some performance measures are more
subjective and less verifiable by the court and thus require the principal to retain discretion
and are often part of implicit contracts (Rajan and Reichelstein 2009; Murphy and Oyer
2003). Empirical evidence suggests that boards use both contractible and non-contractible
performance measures in determining executive compensation (Hayes and Schaefer 2000;
Ederhof 2010).
Innovation activities are highly unpredictable and thus difficult to contract upon ex
ante (Holmstrom 1989; Aghion and Tirole 1994; Ederer and Manso 2013). The difficulty
of accurately measuring innovation performance and the practical considerations of
contracting complexity and enforcement costs could inhibit the board from explicitly
incorporating innovation in the firm’s compensation contract. Thus, we expect that
instead of explicitly tying CEO compensation to innovation performance in the incentive
contracts, boards implicitly exercise their subjective assessment of CEO innovation effort
if they consider corporate innovations to be an important value-enhancing responsibility
of CEOs.
In order to capture both the explicit and implicit roles of innovation in executive
contracts, we do not attempt to review the disclosures in the proxy statement. Instead, we
directly examine the association between CEO compensation and firms’ innovation
performance. We focus on high-technology firms because innovation is a key determinant
of these firms’ success and hence should be an informative nonfinancial measure in
performance evaluation.
Innovations are usually officially introduced to the public in the form of approved
patents. Firms have increasingly recognized the importance of patenting their innovations
to avoid imitation. Patents constitute entry barriers and help firms sustain their
competitive advantage. Patents are often viewed as a nonfinancial indicator of technology
firms’ innovation capabilities.
Many studies use patents as indicators of company growth and show that patents are

8
strongly associated with subsequent gains in companies’ productivity, earnings, and stock
prices. For example, Deng et al. (1999) and Hall et al. (2005) find that patent count and
patent citations are positively related to market-to-book ratio, stock return, and Tobin’s Q.
Matolcsy and Wyatt (2008) show that industry-level patent count and journal citations are
positively associated with contemporaneous market valuation and future operating
performance. Gu (2005) reports that change in patent citations is positively associated with
future earnings, especially in industries with relatively short time lags between
technological advances and profit realization.
If boards reward CEOs’ innovation efforts, CEO compensation should be positively
related to firms’ innovation performance. Following the prior literature, we use patent count
and patent citations to measure innovation performance. We formalize these predictions in
the following hypotheses (stated in alternative form):
H1: Ceteris paribus, CEO compensation is positively associated with
innovation performance.
H1a: Ceteris paribus, CEO compensation is positively associated with patent
count.
H1b: Ceteris paribus, CEO compensation is positively associated with patent
citations.
CEO compensation includes both cash components (salary and bonus) and equity
components (options and restricted stock). The board could consider innovation
performance when determining both components of CEO compensation. Davila and
Venkatachalam (2004) argue that the cash components should be related to performance
measures in the current period whereas the equity components could be used to motivate
future actions instead of being rewards for current performance. Their results indicate that
only cash compensation is associated with their nonfinancial measure, passenger load factor,
in the airline industry. However, prior studies also document the importance of equity-based
compensation, especially stock options, in motivating innovations (Cheng 2004; Lerner and
Wulf, 2007; Manso 2011). As a result, it is ex ante unclear whether equity and/or cash
compensation will be linked to current innovation performance. Therefore, we state our
second hypothesis as follows.
H2: Ceteris paribus, both cash and equity CEO compensation are positively
associated with innovation performance.

9
H2a: Ceteris paribus, both CEO cash and CEO equity CEO compensation are
positively associated with patent count.
H2b: Ceteris paribus, both CEO cash and CEO equity CEO compensation are
positively associated with patent citations.
We also examine whether there are cross-sectional differences in the relation between
CEO compensation and innovation performance. We first explore two important firm
characteristics that are likely to affect the importance of innovation performance as a
non-financial performance measure, noise in the financial performance measures and the
firm’s R&D intensity.
Agency theory suggests that any performance measure that provides incremental
information about an agent’s efforts that the principal wishes to motivate should receive
non-zero weight in compensation and the weight depends on the signal-to-noise ratio of the
performance measure in reflecting the agent’s efforts that can be extracted from the
alternative measures (Holmstrom 1979; Banker and Datar 1989; Feltham and Xie 1994).
Thus, the relative weight placed on a performance measure depends on the relative
informativeness of financial and non-financial performance measures. One potential
determinant of the relative information content of alternative performance measures is the
noise in measuring financial performance. If the accounting or market-based performance
measures are noisier, non-financial performance measures such as patent counts and patent
citations should be relatively more informative in measuring managerial efforts and hence
more closely related to CEO compensation. Therefore, we state our third hypothesis as
follows.
H3: Ceteris paribus, CEO compensation is more positively associated with
innovation performance when financial performance measures are noisier.
Prior research suggests that the manager’s incentives should be aligned with the goal of
the firm and thus the performance measures in compensation contracts should be closely
linked to the firm’s business strategy (Simons 1987; Ittner et al. 1997). For firms spending a
lot on R&D, innovation is crucial for creating competitive advantage and motivating
managerial efforts in innovation should be more important when determining CEO
compensation. As a result, we expect greater weight on innovation performance when the
firm is more R&D intensive. We state our fourth hypothesis as follows.

10
H4: Ceteris paribus, CEO compensation is more positively associated with
innovation performance when the firm is more R&D intensive.
In addition to firm characteristics, we also examine whether the relationship between
CEO compensation and innovation performance varies with CEO characteristics. We
specifically focus on CEO age and CEO tenure. It is well documented in the literature that
CEOs approaching retirement may have a horizon problem (Gibbons and Murphy 1992;
Cheng 2004). As a CEO approaches retirement, it is less likely that the CEO will benefit
from current innovation efforts that take long to realize. CEOs therefore are more likely to
reduce current R&D investment to boost current earnings than invest in innovative projects
that will benefit the firm in the long-run. To mitigate the horizon problem, the compensation
committee may adjust CEO compensation structure to reduce such opportunistic behavior.
One possible adjustment is to tie CEO compensation more closely to non-financial
performance measures as it takes time for the innovation efforts to be reflected in the
financial performance measures. Therefore, we expect a stronger relation between CEO
compensation and innovation performance when CEOs are near retirement age. In contrast,
new CEOs should have relatively longer horizons and stronger motivations to exert efforts
in innovation. In addition, since it takes time for innovation efforts to be realized as patents,
current patent output may reflect the innovation efforts of the previous CEO during the
CEO turnover years. Therefore, we expect a weaker association between CEO
compensation and innovation performance for new CEOs. We state our fifth and sixth
hypotheses as follows.
H5: Ceteris paribus, CEO compensation is more strongly associated with
innovation performance for CEOs near retirement age.
H6: Ceteris paribus, CEO compensation is less strongly associated with
innovation performance for new CEOs.
3. Research Design
3.1 Measurement of innovation performance
Many prior studies use patent count as the measure of innovation productivity (e.g.,
Griliches 1990; Holthausen et al. 1995). However, according to Trajtenberg et al. (1997)
and Kelley and Rice (2002), simple patent count is not a sufficient indicator of innovative
performance because not all patents are equally valuable. Prior research indicates that the
11
number of patent citations provides incremental information regarding the value of patents
(Griliches 1987;Shane 1993;Harhoff et al. 1999;Hall et al. 2005;Stolpe 2002; Pandit et
al. 2011). While patent count reflects the quantity of innovation output, it does not capture
the quality and economic significance of innovation, which is reflected in citations. Given
the above, a likely reason for the incremental information in the number of patent citations
is that it includes information about both the quantity and the quality of innovation output.
For these reasons, we also use the number of patent citations as our measure of overall
innovation performance and examine its relation with CEO compensation.
We measure patent count as the number of patents granted in year t and patent citations
by summing the number of citations received by a firm’s patents granted in year t over the
years t+1 to t+3. Although this measure of patent citations is an ex post proxy for overall
innovation performance, our presumption is that boards of directors have additional
information that allows them to assess overall innovation performance in terms of the
expected benefits that the firm will obtain from the patents when determining executive
compensation. Harhoff et al. (1999) find that the estimated value of a patent is correlated
with subsequent citations and that the most highly cited patents are very valuable, with a
single citation implying an average value of about $1 million. As a result, we use the
number of citations as an ex post proxy for the expected value of the patent estimated by the
board when evaluating innovation performance. It is worth noting that this measure allows
us to examine whether boards devote attention to patent quality and incorporate this
information in the executive’s compensation structure, even though ex post citations
information is not available to the boards when determining CEO compensation for the
year.4
The NBER patent database contains two time placers for each patent: its application
date and grant date. Although summing up the number of patents applied for during the year
would be a timely proxy for CEO’s innovation efforts, the database only contains
information about successful patent grants and thus does not allow us to calculate total
number of patents applied for during the year. To be consistent with prior studies (e.g.
Hirshleifer et al. 2013), we use the number of patents granted during year t to calculate
4 We also use citations received in year t for patents granted in year t-3 to t-1 to examine the association
between CEO compensation and current patent citations. The results are qualitatively similar. However, a
drawback of using current patent citations is that it may not really capture CEO current innovation efforts as it
takes time to receive patent citations.

12
patent count.5 We take the natural logarithms of these variables in the regression models
because the distributions of patent count and patent citations are highly skewed.
3.2 Empirical Model
We infer the economic importance of non-financial innovation performance measures in
CEO compensation by examining the association between CEO compensation and patent
performance. Specifically, to test our hypotheses that CEO compensation is positively
associated with patented performance, we examine the incremental importance of patent
performance for CEO compensation after controlling for traditional financial performance
measures and firm characteristics. We use the following regression model to examine the
relation between innovation performance and CEO compensation:
Compi,t = β0 + β1PatentPerformance + β2ROAi,t + β3RETi,t + β4 ROASDi,t +
β5RETSDi,t + β6R&D + β7LEV i,t + β8LSALESi,t + β9MBi,t + β10CPSi,t +
β11SDTAi,t + β12TAILSi,t + + εi,t
(1)
where Comp is the log of CEO compensation. To test Hypotheses 1 and 2, we examine
the incremental relevance of patent performance for CEO total compensation as well as for
its components, cash compensation and equity compensation. We define cash compensation
as the sum of salary and bonus and equity compensation as the sum of options and restricted
stock. Because option compensation is particularly important for high-technology firms to
motivate innovation, we also examine the relevance of patent performance for CEO option
compensation (Cheng 2004). PatentPerformance represents either patent count or total
patent citations. β1 is our variable of interest; a positive value suggests that boards
compensate CEOs for nonfinancial, patent performance.
Return on assets (ROA) and stock returns (RET) are commonly-used observable
indicators for measuring contemporaneous financial performance (Hayes and Schaefer 2000,
Murphy 2000). We expect that CEOs are compensated for the risks they face, i.e., they
receive a risk premium (Banker and Datar 1989; Smith and Watts 1992; Core 1997; Cyert et
al. 1997; Core et al. 1999). Following Hayes and Schaefer (2000), we use the standard
deviation of return on assets (ROASD) and the standard deviation of stock returns (RETSD)
5 Untabulated tests show that results are qualitatively similar if we use the number of patents applied for in
year t.

13
measured over the prior five years to proxy for firm risk. We control for R&D expense
deflated by total assets (R&D), as Cheng (2004) documents that CEO compensation is tied
positively to R&D expense to avoid myopia and horizon problems. Although firms may link
CEO compensation to R&D to motivate innovation, R&D only measures the input, not the
output of firms’ innovative activities. The non-financial measures we examine in this paper,
i.e. patent count and patent citations, are output-based measures that provide the board with
useful information incremental to the level of R&D expenditure in evaluating the CEO’s
efforts in innovation. We use the ratio of total liabilities to total assets (LEV) to measure
financial leverage. We expect CEO compensation to be higher when firms are larger and
have more complex operations and growth opportunities. Following Rosen (1982), Smith
and Watts (1992), Core et al. (1999), and Brick et al. (2006), we use the natural logarithm of
sales (LSALES) as a measure of size and complexity. Following Hayes and Schaefer (2000),
we use market-to-book ratio (MB), computed as the average over the three fiscal years prior
to year t, as a measure of growth opportunities.
We follow Ederhof (2010) and include the standard deviation of scaled total accruals
over the prior five years (SDTA) to control for a company’s susceptibility to earnings
manipulation. In addition, we include CEO pay slice, CPS, defined as the percentage of
total compensation paid to the top five executives that goes to the CEO, to control for
executive power. We also include an indicator variable, TAILS, which equals 1 if the
contractible performance falls in the tails of the distribution and zero otherwise, to capture
whether a company’s contractible performance has an extreme value that triggers
discretionary compensation. We measure contractible performance as the change in EPS.
Lastly, we include year and two-digit SIC industry fixed effects in the model.
To examine whether the relation between CEO compensation and innovation
performance varies across the noise in financial measures and R&D intensity, we estimate
the OLS regression in equation (1) for separate subsamples. To test Hypothesis 3, we use
the volatility of ROA (stock return) as the proxy for the noise in accounting (market) based
performance measures. We divide our sample into observations with standard deviation of
ROA (ROASD) or stock returns (RETSD) over the five-year period above and below the
median and estimate equation (1) separately for the subsamples. To test Hypothesis 4, we
split the sample at the industry (2-digit SIC code) median level of R&D expenditure scaled
by total assets (R&D).

14
To examine whether the association between CEO compensation and patent
performance differs for retiring or new CEOs, we augment the model in equation (1) with a
dummy variable related to CEO characteristics and its interaction with patent performance.
We use the following regression model to test Hypotheses 5 and 6:
Compi,t = β0 + β1PatentPerformance + β2CEOCharacteristics +
β3PatentPerformance × CEOCharacteristics + β4ROAi,t + β5RETi,t +
β6ROASDi,t + β7RETSDi,t + β8R&D + β9LEV i,t + β10LSALESi,t + β11MBi,t
+ β12CPSi,t + β13SDTAi,t + β14TAILSi,t +
+ εi,t (2)
where CEOCharacteristics represents either a dummy variable for retiring CEOs (Retire) or
new CEOs (NewCEO). Retire equals one if CEO age is over 62, and zero otherwise.
NewCEO equals 1 if CEO tenure is less than 3 years, and zero otherwise.
4. Results
4.1 Data and Sample
Panel A of Table 1 describes our sample selection procedure. Our sample consists of
high-technology firms drawn from the ExecuComp database during the period 1992-2006.
Following prior studies (e.g., Gu 2005; Bowen, Davis, and Matsumoto 2005; Barton and
Waymire 2004), we define high-technology firms as firms in the following industries:
chemical, biotech and pharmaceutical (SIC 28), machinery and computer hardware (SIC 35),
electrical and electronics components (SIC 36), transportation equipment (SIC 37), and
medical and scientific instruments (SIC 38).
We obtain financial data from Compustat, CEO compensation data from ExecuComp,
and patent data from the National Bureau of Economic Research (NBER). The patent
database contains detailed information on all patents granted by the US Patent and
Trademark Office (USPTO) between 1976 and 2006. Data items include patent assignee
names, application dates, grant dates, number of citations of each patent, firms’
Compustat-matched identifiers, and other details. Patents are included in the database only
if they are granted by USPTO by the end of 2006.
Finally, we require firms to have sufficient data for calculating the control variables.

15
This leads to a sample of 607 firms and 4,145 firm-year observations for testing our
hypotheses. Panels B and C of Table 1 show the breakdown of firm-year observations by
industry and by year, respectively. The number of firm-year observations ranges from 1,098
(26.49%) in the chemical, biotech, and pharmaceutical industry (SIC 28) to 506 (12.21%) in
the transportation equipment industry (SIC 37). The observations are evenly distributed
over the sample years.6
4.2 Descriptive Statistics
Table 2 presents the descriptive statistics of the variables used in the regressions. The
means of CEO total, cash, and option compensation are each larger than their corresponding
medians. Without log transformations, the untabulated statistics show that the mean
(median) of CEO total compensation and cash compensation are $4,684,014 ($1,798,955)
and $1,303,088 ($966,571), respectively. The statistics indicate skewness of the data and
the need for log transformation of the compensation variables. At the median, equity
compensation represents about 55% of CEO total compensation, and stock options represent
81% of equity compensation.
Based on the untransformed data, firms on average receive 54 patent grants during a
year and the median number of patent grants is 9, suggesting that the distribution of patent
count is highly-skewed and justifying the use of the logarithmic transformation. The
average citations per patent is 1.47 and the median is 1. Consistent with the observations in
Hall et al. (2005), one-quarter of the one-million patents have no citations and 150,000 of
them have only one citation during the 10-year-period after the grant.
The mean (median) ROA of the sample firms is 3.6% (5.7%) and the mean (median)
one-year stock return is 19.5% (11.4%). The standard deviation of ROA (ROASD) over the
past five years has a mean (median) of 0.064 (0.035) and the standard deviation of annual
stock returns over the past five years (RETSD) has a mean (median) of 0.569 (0.387),
suggesting that stock returns are generally more volatile than accounting returns. The mean
annual R&D expenditure is 6.8% of total assets and the median is 4.6%. The mean and
median for LEV are around 49% and the mean (median) for market-to-book (MB) ratio is
3.553 (2.724). The proportion of CEO compensation over total compensation for the five
6 The number of firm-year observations is lower in the early sample period because of the data availability in
the ExecuComp database.

16
highest-paid executives (CPS) is on average 37%. The value for the measure of accrual
volatility (STDA) has a mean (median) of 0.065 (0.046).
Table 3 shows the correlation matrix of all the variables used in the regression. The
correlations between CEO compensation and financial performance (ROA and RET) are
positive, as expected. Of particular importance to our study, patent count and patent
citations are both positively correlated with CEO total, cash, and equity compensation. We
also find that CEO compensation is positively correlated with LSALE, MB, LEV, and CPS,
and negatively correlated with risk (ROASD and RETSD), earnings manipulability (SDTA),
and extreme financial outcomes (TAILS).
4.3 CEO Compensation and Innovation Performance
Tables 4 and 5 present estimation results for Equation (1). Table 4 reports the results
relating CEO compensation to patent count and Table 5 reports the results relating CEO
compensation to patent citations. The results reported in Column (1) of Table 4 indicate that
CEO total compensation is positively associated with patent count (coefficient = 0.047,
p<0.01), consistent with Hypothesis 1. The explanatory power of the model is relatively
high with the adjusted R-square equal to 58.23%. We also find that CEO total compensation
is positively associated with RET (coefficient = 0.114, p<0.01) and RETSD (coefficient =
0.107, p<0.01), suggesting that firms tie CEO total compensation to market performance
and pay CEOs a risk premium for the risks inherent in financial performance and firm
operations. The estimated coefficient on accounting returns (ROA) is significantly negative
at the 1% level; however, we do not find the coefficient on ROASD to be significantly
different from zero. The estimated coefficient on R&D is positive, consistent with the
finding in Cheng (2004) that firms tie CEO compensation to R&D expense, perhaps to
offset CEO incentives to cut R&D expenses to boost earnings. We also find a positive
coefficient on the log of sales (coefficient = 0.414, p<0.0001), suggesting that larger firms
compensate their CEOs more. The estimated coefficient on market-to-book ratio is
significantly positive (coefficient = 0.045, p<0.01), consistent with CEO compensation
being higher when firms have greater growth opportunities. The estimated coefficient on
CPS is significantly positive (coefficient = 1.679, p<0.01), consistent with CEO power
being reflected in higher compensation. We do not find the estimated coefficient on SDTA
to be positive, indicating no evidence that CEOs of firms with higher earnings
manipulability receive higher total compensation.

17
The results for CEO compensation components, reported in Columns (2)-(4) of Table 4,
are consistent with Hypotheses 2a and 2b that CEO cash compensation and stock
compensation are each positively associated with patent count. Specifically, the coefficients
on patent count are positive and significant for cash compensation (coefficient = 0.020,
p<0.01), equity compensation (coefficient = 0.146, p<0.01), and option compensation
(coefficient = 0.174, p<0.01). A comparison of columns (2)-(4) reveals that the magnitude
of the coefficient on patent count for option compensation is the greatest. An economic
interpretation of our findings is that a 10% increase in patents increases cash compensation
by 0.20%, equity compensation by 1.46%, and option compensation by 1.74%, suggesting
that the increase in patent count has a greater impact on equity compensation, particularly
option compensation, than on cash compensation.7 As CEO stock options usually vest over
time (i.e., 3 to five years) and expire after several years (i.e., up to 10 years), compensation
committees use stock options to motivate CEOs to focus on long-term performance (Cheng
2004). Our finding is also consistent with Ederer and Manso (2013) who suggest that
reward for long-term success is essential for inducing managers to pursue more innovative
business strategies. A concurrent study by Faurel et al. (2015) also provides evidence that
CEO holdings of stock and options are associated with future innovation performance and is
consistent with stock and option compensation being important in motivating innovation.
The coefficients on RET are significantly positive across Columns (2)-(4), confirming
that both cash and stock compensation components are positively related to market
performance. However, the coefficient on ROA is not significantly different from zero for
cash compensation. A plausible explanation for this result is that accounting returns may be
a noisy performance measure for high-technology firms and thus firms reduce the
sensitivity of CEO cash pay to accounting performance.8 The coefficients on ROA are
negative for equity compensation and option compensation. This result is consistent with
stocks and options being granted to “restore” incentives and thereby motivate improvements
in long-term performance for firms with poor current accounting performance (Davila and
Venkatachalam 2004). The estimated coefficients on R&D are significantly positive across
the different compensation components, consistent with a positive weight on R&D expense
7 On the original scale without log transformation, the median patent count for our sample firms is 9. Thus,
obtaining one more patent count/citations equals to an 11.1% increase in patent counts/citations. We use the
approximate number of 10% to ease interpretation of the economic significance of the results. 8 This result is consistent with the results of prior studies. For example, Davila and Venkatachalam (2004) also
find that ROA is not significantly related to any of the compensation measures.

18
to mitigate the myopia problem. Leverage (LEV) is positively associated with cash
compensation, but negatively associated with stock compensation, consistent with the
agency conflicts between debtholders and stockholders. CEO pay slice (CPS) is positively
associated with cash compensation and equity compensation, consistent with the notion that
CEOs with greater power receive higher compensation. Another difference between CEO
cash and equity compensation shown in the results is that the adjusted R-square is higher for
CEO cash compensation (60.34%) than for CEO equity compensation (18.43%) and option
compensation (14.82%). This finding may reflect the fact that the value of equity
compensation is influenced by more factors than is cash compensation (Baber et al. 1991;
Cheng 2004).
Table 5 presents the results relating CEO compensation to the ex post measure of
overall innovation performance (i.e., patent citations) after controlling for financial
performance measures. The estimated coefficients on PatentCitations are significantly
positive for CEO total compensation (coefficient = 0.051, p < 0.01), cash compensation
(coefficient = 0.011, p <0.05), and equity compensation (coefficient = 0.120, p <0.01). For
option compensation, the estimated coefficient is the highest (coefficient = 0.126, p < 0.01).
Overall, our evidence is consistent with Hypothesis 1 and Hypothesis 2 that patent citations,
as a non-financial measure of innovation performance, are relevant to CEO compensation
contracting. The results also suggest that compensation committees devote attention to
assessing the value of innovation (which is not directly observable to outsiders) when
determining CEO compensation. Among the compensation components, CEO option
compensation is most sensitive to patent citations, suggesting that compensation committees
consider option compensation to be a powerful mechanism for inducing managers to pursue
more valuable innovations.
Overall, our results are consistent with our hypotheses that non-financial performance
measures are relevant for contracting. CEO compensation is positively associated with
innovation performance measured by patent count or patent citations. In addition, to induce
managers to pursue high quality innovations, the relevance of innovation performance is
higher for equity compensation (particularly option compensation) than for cash
compensation.

19
4.4 Innovation Performance in Compensation and Noise in Financial Measures
Table 6 presents the regression results for subsamples partitioned by stock return
volatility and Table 7 reports corresponding results for subsamples partitioned by the
volatility in accounting earnings. Panels A and B of the two tables present the results when
innovation performance is measured by patent count and patent citations, respectively.
When innovation performance is measured by patent count, the results for both return
volatility and earnings volatility are consistent with our hypotheses for CEO total
compensation. We find significantly positive coefficients on patent count for CEO total
compensation for the high return volatility subsample (coefficient = 0.082, p<0.01), while
the coefficient is not reliably different from zero for the low return volatility subsample. The
coefficient on patent count for CEO total compensation is significantly larger for the high
earnings volatility subsample compared with the low earnings volatility subsample (0.063
and 0.034, respectively, difference significant at the 5% level). When we examine the
compensation components, the results for cash compensation are qualitatively similar to
those for total compensation. However, for equity and option compensation, the coefficient
on patent count is statistically indifferent between the high return (earnings) volatility and
low return (earnings) subsamples.
When innovation performance is measured by patent citations, our results are
consistent with our hypotheses for CEO total compensation. We find a significantly larger
coefficient on patent citations for the high return (earnings) volatility subsample than for the
low return (earnings) volatility subsample (difference significant at the 1% (10%) level).
The results for the compensation components are similar to those for patent count. For
equity or option compensation, the coefficient on patent citations is statistically indifferent
between the high return (earnings) volatility and low return (earnings) volatility subsamples.
For cash compensation, the coefficient on patent citations is significantly larger for the high
return volatility subsample than the low return volatility subsample (difference significant at
the 5% level), and statistically indifferent between the high and low earnings volatility
subsamples.
Overall, our results are consistent with Hypothesis 3 that boards assign a larger weight
to innovation performance in determining CEO total compensation and in particular CEO
cash compensation, when the financial performance measures are noisier.

20
4.5 Innovation Performance in Compensation and R&D Intensity
Table 8 presents the regression results for separate subsamples partitioned by R&D
intensity. Panel A and Panel B report the results for patent count and patent citations,
respectively. For total compensation, the coefficients on patent count and patent citations
are significantly larger for the high R&D intensity subsample than for the low R&D
intensity subsample (difference significant at the 1% level). When examining the results for
compensation components, equity and option compensation show qualitatively similar
results with total compensation. However, we do not find the coefficients on patent count
and patent citations to be significantly different between high and low R&D intensity
subsamples for cash compensation.
Overall, our results are consistent with Hypothesis 4 that boards assign a larger weight
to patent quantity and patent value in determining CEO compensation when the firm is
more R&D intensive, suggesting that boards consider innovation performance more
important when firms spend more resources on innovation.
4.6 Innovation Performance in Compensation and CEO Characteristics
Table 9 presents the results for the effect of CEO age on the relation between CEO
compensation and innovation performance. Panel A and Panel B report the results for patent
count and patent citations, respectively. We find that the coefficients on the interaction terms
between PatentPerformance and Retire are significantly positive across compensation
components, suggesting that the association between CEO compensation and innovation
performance is stronger when CEOs approach retirement.
Table 10 presents the results for the effect of CEO tenure. Panel A and Panel B report
the results for patent count and patent citations, respectively. The coefficient on the
interaction term between PatentCount and NewCEO for total compensation is significantly
negative (-0.024, p<0.05), suggesting that boards adjust CEO total compensation related to
patent count downward for new CEOs. The coefficients on the interaction term are
insignificant for the compensation components. The results for patent citations are similar in
that the coefficients on the interaction term between PatentCitations and NewCEO are
significantly negative for CEO total compensation (-0.031, p<0.01) and for CEO equity
compensation (-0.070, p<0.10), suggesting the CEO compensation is less sensitive to patent
quality information for new CEOs. We do not find the estimated coefficients on the

21
interaction term to be different from zero for cash compensation and option grants.
Overall, our results are consistent with our expectation in Hypotheses 5 and 6. The
boards adjust the compensation structure for retiring (new) CEOs by increasing (decreasing)
the weight on innovation performance when rewarding CEOs.
5. Additional Analyses
In our main tests, we consider patent count and patent citations as two separate
measures for innovation performance and estimate two regressions instead of including both
measures in one regression. One reason for doing so is that it takes time for new patent
grants to receive patent citations. As a result, our measure of patent citations is an ex post
measure of citations over the years t+1 to t+3 for patents granted in year t while patent
count is a performance measure readily available at the end of fiscal year t. In addition, the
number of total patent citations is highly correlated with patent count and thus would
potentially result in severe multicollinearity if both measures were included in the same
model. As a result, we are unable to assess the relative weights placed on each innovation
performance measure using the approach in our main tests.
In this section, we take a different perspective and explore whether boards consider
both innovation quantity and innovation quality when determining CEO compensation.
Patent citations can be expressed as the product of patent count and citations per patent. In
other words, patent citations can be considered as a measure of overall innovation
performance. We examine the relation between CEO compensation and the two components
of overall innovation performance, patent count and citations per patent. We measure patent
count as the number of patents granted in year t and citations per patent as the number of
citations received by a firm’s patents granted in year t over the years t+1 to t+3 divided by
the number of patents granted in year t.
If boards reward CEOs for innovation performance, then CEO compensation should be
positively related to the number of patent citations. Furthermore, if boards reward managers
for innovation quantity and innovation quality, then CEO compensation should be positively
related to both patent count and citations per patent. Table 10 presents the results for patent
citations and the two components: patent count and citations per patent. We find that CEO
total compensation is positively associated with total patent citations, as well as with patent

22
count and citations per patent. These results are consistent with boards of directors
considering total patent citations (i.e., overall innovation contribution) and its components,
patent count (i.e., innovation output quantity) and citations per patent (i.e., innovation
output quality), to be important nonfinancial performance measures when exercising their
discretion in rewarding CEOs.
6. Conclusions
Based on a sample of high-technology firms during 1992-2006, we find that patent
performance is an important non-financial measure for innovation performance when
compensation committees determining CEO compensation, apart from the observed
financial performance results and firm characteristics. We also find that the relevance of
patent performance in contracting is higher for equity compensation (particularly option
compensation) than for cash compensation. This evidence also supports the notion that
compensation committees consider corporate innovation performance to be an important
responsibility of the CEO when exercising their discretion in determining CEO
compensation. We also find that the relevance of innovation performance for compensation
varies cross-sectionally with firm characteristics and CEO characteristics.
Our findings also support the argument that when outcome is long deferred and highly
uncertain, boards of directors base the reward to CEOs on criteria they can control and that
boards expect will increase firm value (Manso 2011; Prendergast 2002). This incentive then
induces the managers to take higher risks because the financial risks they bear are reduced
to a certain extent.

23
References
Aghion, P., and J. Tirole. 1994. The management of innovation. Quarterly Journal of
Economics 109 (4):1185-1209
Baber. W. R., P. M. Fairfield, and J. A. Haggard.1991. The effect of concern about reported
income on discretionary spending decisions: The case of research and development.
The Accounting Review 66 (4):818-829
Balkin, D. B., G. D. Markman, and L. R. Gomez-Mejia. 2000. Is CEO pay in
high-technology firm related to innovation? Academy of Management Journal 43 (6):
1118-1129.
Banker, R. D., and S. M. Datar. 1989. Sensitivity, precision, and linear aggregation of
signals for performance evaluation. Journal of Accounting Research 27 (1): 21-39.
Banker, R. D., G. Potter, and D. Srinivasan. 2000. An empirical investigation of an
incentive plan that includes nonfinancial performance measures. The Accounting
Review 75 (1): 65-92.
Barton, J., and G. Waymire. 2004. Investor protection under unregulated financial reporting.
Journal of Accounting and Economics 38 (1): 65–116.
Bowen, R., A. Davis, and D. Matsumoto. 2005. Emphasis on pro forma versus GAAP
Earnings in quarterly press releases: Determinants, SEC Intervention, and market
reactions. The Accounting Review 80 (4): 1011–1038.
Brick, I. E., O. Palmon, and J. K. Wald. 2006. CEO compensation, director compensation,
and firm performance: Evidence of cronyism? Journal of Corporate Finance 12 (3):
403-423.
Bushman, R., and R. Indjejikian. 1993. Accounting income, stock price, and managerial
compensation. Journal of Accounting and Economics 16 (1):3-23
Chan, L. K., J. Lakonishok, and T. Sougiannis. 2001. The stock market valuation of
research and development expenditures. The Journal of Finance 56 (6): 2431-2456.
Cheng, S. 2004. R&D expenditures and CEO compensation. The Accounting Review 79 (2):
305-328.
Core, J. E. 1997. The directors’ and officers’ insurance premium: an outside assessment of
the cost of weak corporate governance. The Journal of Law, Economics and
Organization 16 (2): 449-477.
Core, L. E., R. W. Holthausen and D. F. Larcker. 1999. Corporate governance, chief officer
compensation, and performance. Journal of Financial Economics 51 (3): 371-406.
Cyert, R., S. Kang, P. Kumar, and A. Shah. 1997. Corporate governance and the level of
CEO compensation. Working Paper, Carnegie Mellon University.
Davila, A., and Venkatachalam, M. 2004. The relevance of non-financial performance
measures for CEO compensation: Evidence from the airline industry. Review of
Accounting Studies: 9 (4), 443-464.
Deng, Z., B. Lev, and F. Narin. 1999. Science and technology as predictors of stock
performance. Financial Analysts Journal 55(3): 20-32.
Drucker, P. F. 1993. Post-capitalist society. Oxford: Butterworth Heinemann.
Ederer, F., and G. Manso. 2013. Is pay for performance detrimental to innovation?
Management Science 59 (7) :1496-1513
Ederhof, M. 2010. Discretion in bonus plans. The Accounting review 85 (6): 1921-1949.
Faurel, L., Q. Li, D. Shanthikumar, and S.H. Teoh. 2015. CEO Incentives and Product
Development Innovation: Insight from Trademarks. Working paper.
Feltham, G. A., and M. Wu. 1999. Public reports, information acquisition by investors, and
management incentives. Review of Accounting Studies 5 (2):155–190.
Feltham, G. A., and J. Xie. 1994. Performance measure congruity and diversity in

24
multi-task principal/agent relations. The Accounting Review 69 (3): 429-453.
Fornell, C., S. Mithas, V. Forrest V. Morgeson III, and M.S. Krishnan. 2006. Customer
satisfaction and stock prices: High returns, low risk. Journal of Marketing 70 (1): 3-14.
Francis, B., I. Hasan, and Z. Sharma. 2010. Do incentives create innovation? Evidence from
CEO compensation contracts. Working Paper.
Gibbons, R. and K. J. Murphy. 1992. Does executive compensation affect investment?
Journal of Applied Corporate Finance 5 (2): 99-109.
Gillan, S., J. C. Hartzell, and R. Parrino. 2009. Explicit versus implicit contracts: Evidence
from CEO employment agreements. The Journal of Finance 64 (4):1629-1655
Griliches, Z. 1987. R&D and productivity: Measurement issues and econometric results.
Science 237 (4810): 31-35.
Griliches, Z. 1990. Patent statistics as economic indicators: a survey. Journal of Economic
Literature 28 (4): 1661-1707.
Gu, F. 2005. Innovation, future earnings, and market efficiency. Journal of Accounting,
Auditing and Finance 20 (4): 385-481.
Hall, B. H., A. Jaffe and M. Trajtenberg. 2005. Market value and patent citations. Rand
Journal of Economics 36 (1): 16-38.
Hall, B.H. 2005. Exploring the patent explosion. Journal of Technology Transfer 30
(1-2):35–48.
Harhoff, D., F. Narin, F. M. Scherer, and K. Vopel. 1999. Citation frequency and the value
of patented inventions. The Review of Economics and Statistics 81 (3): 511-515.
Hayes, R. M., and S. Schaefer. 2000. Implicit contracts and the explanatory power of top
executive compensation for future performance. RAND Journal of Economics 31 (2):
273-293.
Hirshleifer, D., P.H. Hsu, and D. Li. 2013. Innovative efficiency and stock returns. Journal
of Financial Economics 107 (3):632-654
Holmstrom, B. 1979. Moral hazard and observability. The Bell Journal of Economics 10 (1):
74-91.
Holmstrom, B. 1989. Agency costs and innovation. Journal of Economic Behavior &
Organization 12:305-327
Holthausen, R. W., D. F. Larcker, and R. G. Sloan. 1995. Business unit innovation and the
structure of executive compensation. Journal of Accounting and Economics 19
(2-3):279-313
Huang, S., J. Ng, T. Ranasinghe, and M. Zhang. 2015. Do innovative firms communicate
more? Evidence from the relation between patenting and management earnings
forecasts. Working paper.
Ittner, C. D., D. F. Larcker and M. V. Rajan. 1997. The choice of performance measures in
annual bonus contracts. The Accounting Review 72 (2): 231–255.
Ittner, C. D., and Larcker, D. F. 1998a. Innovations in performance measurement: trends
and research implications. Journal of Management Accounting Research 10 ():
205-237.
Ittner, C. D., and D. F. Larcker. 1998b. Are nonfinancial measures leading indicators of
financial performance? An analysis of customer satisfaction. Journal of Accounting
Research 36 (): 1-36.
Kelley, D. J., and M. P. Rice. 2002. Advantage beyond founding the strategic use of
technologies. Journal of Business Venturing 17 (1): 41-57.
Kaplan, R. and D. Norton. 1992. The balanced-scorecard: Measures that drive performance.
Harvard Business Review 69 (1): 71-79.
Lambert, R. A., and D. F. Larcker. 1987. An analysis of the use of accounting and
market measures of performance in executive compensation contracts. Journal of

25
Accounting Research 25(): 85-125.
Lerner, J., and J. Wulf. 2007. Innovation and incentives: Evidence from corporate R&D.
Review of Economics and Statistics 89 (4):634-644
Lev, B., and T. Sougiannis. 1999. Penetrating the book-to-market black box: The R&D
effect. Journal of Accounting and Economics 26 (3-4):419-449
Lev, B., 2001. Intangibles: management, measurement, and reporting. Brookings Institution
Press, Washington, DC.
Lev, B., D. Nissim, and J. Thomas. 2008. On the informational usefulness of R&D
capitalization and amortization. Visualising Intangibles: Measuring and Reporting in
the Knowledge Economy: 97-128. Ed. Stefano Zambon and Giuseppe Marzo. Burlinton,
VT: Ashgate Publishing.
Luft, J. 2009. Nonfinancial information and accounting: A reconsideration of benefits and
challenges. Accounting Horizons 23 (3): 307-325.
Manso, G. 2011. Motivating innovation. The Journal of Finance 66 (5):1823-1860
Matolcsy, Z. P., and Wyatt, A. 2008. The association between technological conditions and
the market value of equity. The Accounting Review 83 (2): 479–518.
Miller, J. S., R. M. Wiseman, and L. R. Gomez-Mejia. 2002. The fit between CEO
compensation design and firm risk. Academy of Management Journal 45 (4): 745-756.
Murphy, K. J. and P. Oyer. 2003. Discretion in executive incentive contracts: Theory
andevidence. Working paper, University of Southern California and Stanford
University.
Murphy, K. J. 2000. Performance standards in incentive contracts. Journal of Accounting
and Economics 30 (3): 245 – 278.
Nagar, V. and M. Rajan. 2001. The revenue implications of financial and operational
measures of product quality. The Accounting Review 76 (4): 495–513.
Pandit, S., C. E. Wasley, and T. Zach. 2011. The effect of research and development (R&D)
inputs and outputs on the relation between the uncertainty of future operating
performance and R&D expenditures. Journal of Accounting, Auditing and Finance 26
(1): 121-144.
Peng, L., and Xiong, W., 2006. Investor attention, overconfidence and category learning.
Journal of Financial Economics 80:563–602.
Porter, M. 1980. Competitive strategy: Techniques for analyzing industries and
competitors. The Free Press.
Prendergast, C. 2002. The tenuous trade-off of risk and incentives? The Journal of Political
Economy 110 (5): 1071-1102.
Rajan, M. V., and S. Reichelstein. 2009. Objective versus subjective indicators of
managerial performance. The Accounting Review 84:209-237
Rajgopal, S., M. Hanlon, and T. Shevlin. 2003. Are executive stock options associated with
future earnings? Journal of Accounting and Economics 36 (1):3-43
Rosen, S. 1982. Authority, control and the distribution of earnings. Bell Journal of
Economics 13 (2): 311-323.
Shane, H. 1993. Patent citations as an indicator of the value of intangible assets in the
semiconductor industry. Dissertation, University of Pennsylvania.
Sheich, S. 2012. Do CEO compensation incentives affect innovation? Review of Accounting
and Finance 11 (1): 4-39.
Simons, R. 1987. Accounting control systems and business strategy: An empirical analysis.
Accounting, Organizations and Society 12 (4): 357-374.
Sloan, R. G. 1993. Accounting earnings and top executive compensation. Journal of
Accounting and Economics 16 (1): 55-100.
Smith, C. W., and R. L. Watts. 1992. The investment opportunity set, corporate financing,

26
dividend, and financing policies. Journal of Financial Economics 32 (3): 262-292.
Stolpe, M. 2002. Determinants of knowledge diffusion as evidenced in patent data: The case
of liquid crystal display technology. Research Policy 31 (7): 1181-1198.
Trajtenberg, M., and A. B. J. R. Henderson. 1997. University versus corporate patents: A
window on the basicness of invention. Economics of Innovation and New Technology
5 (1): 19-50.
Xue, Y. 2007. Make or buy new technology: The role of CEO compensation contract in a
firm’s route to innovation. Review of Accounting Studies 12 (4): 659-690.
Yanadori, Y., and J. H. Marler. 2006. Compensation strategy: Does business strategy
influence compensation in high-technology firms? Strategic Management Journal 27
(6):559-570
Zingales, L. 2000. In search of new foundations. The Journal of Finance 55 (4):1623-1653
27
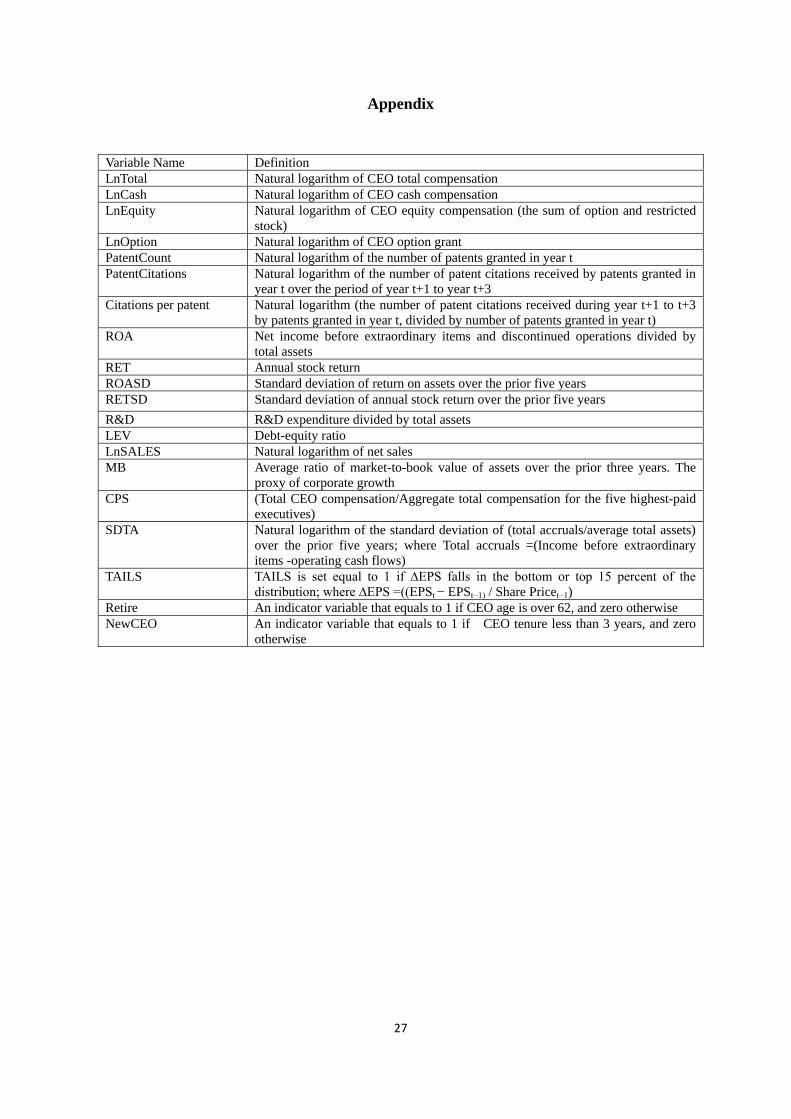
Appendix
Variable Name Definition
LnTotal Natural logarithm of CEO total compensation
LnCash Natural logarithm of CEO cash compensation
LnEquity Natural logarithm of CEO equity compensation (the sum of option and restricted
stock)
LnOption Natural logarithm of CEO option grant
PatentCount Natural logarithm of the number of patents granted in year t
PatentCitations Natural logarithm of the number of patent citations received by patents granted in
year t over the period of year t+1 to year t+3
Citations per patent Natural logarithm (the number of patent citations received during year t+1 to t+3
by patents granted in year t, divided by number of patents granted in year t)
ROA Net income before extraordinary items and discontinued operations divided by
total assets
RET Annual stock return
ROASD Standard deviation of return on assets over the prior five years
RETSD Standard deviation of annual stock return over the prior five years
R&D R&D expenditure divided by total assets
LEV Debt-equity ratio
LnSALES Natural logarithm of net sales
MB Average ratio of market-to-book value of assets over the prior three years. The
proxy of corporate growth
CPS (Total CEO compensation/Aggregate total compensation for the five highest-paid
executives)
SDTA Natural logarithm of the standard deviation of (total accruals/average total assets)
over the prior five years; where Total accruals =(Income before extraordinary
items -operating cash flows)
TAILS TAILS is set equal to 1 if ∆EPS falls in the bottom or top 15 percent of the
distribution; where ∆EPS =((EPSt − EPSt−1) / Share Pricet−1)
Retire An indicator variable that equals to 1 if CEO age is over 62, and zero otherwise
NewCEO An indicator variable that equals to 1 if CEO tenure less than 3 years, and zero
otherwise

28
Table 1
Sample Selection and Sample Breakdown
Panel A:Sample Selection Procedure
Description Number of
firm-years
Number of
firms
Initial sample with CEO compensation data from
ExecuComp (1992-2006) 23,900 3,038
Less: Observations with missing total compensation (3,528) (128)
Less: firms not in the high technology company (14,684) (2,143)
Less: firms with no patent data in NBER database (393) (71)
Less: firms with insufficient data for the control variables (1,150) (89)
Sample used in regression 4,145 607
Panel B:Sample breakdown by industry
SIC CODE Industry Number of
firm-years
Percentage
(%)
28 Chemical, biotech, and pharmaceutical 1,098 26.49
35 Machinery and computer hardware 827 19.95
36 Electrical and electronics components 1,005 24.25
37 Transportation equipment 506 12.21
38 Medical and scientific instruments 709 17.1
Panel C: Sample breakdown by year
Year Number of
firms
Percentage
(%)
1992 17 0.41
1993 193 4.66
1994 255 6.15
1995 260 6.27
1996 270 6.51
1997 289 6.97
1998 299 7.21
1999 291 7.02
2000 285 6.88
2001 303 7.31
2002 334 8.06
2003 348 8.4
2004 348 8.4
2005 335 8.08
2006 318 7.67
Notes:
Table 1 reports information related to sample selection and distribution. Panel A explains the sample selection
process. Panel B reports the industry distribution of the sample. Panel C reports the year distribution of the
sample.

29
Table 2
Descriptive Statistics Variable N Mean Std. Dev. Q1 Median Q3
LnTotal 4,145 7.617 1.160 6.753 7.495 8.353
LnCash 4,145 6.904 0.711 6.397 6.874 7.394
LnEquity 3,903 6.059 2.893 5.591 6.889 7.896
LnOption 3,903 5.676 3.078 5.078 6.674 7.723
PatentCount 4,145 2.402 1.742 1.099 2.303 3.714
PatentCitations 3,144 2.423 2.030 0.693 2.197 3.970
Citations per Patent 2,647 0.747 0.529 0.405 0.693 1.083
ROA 4,145 0.036 0.127 0.019 0.057 0.096
RET 4,145 0.195 0.563 -0.134 0.114 0.376
ROASD 4,145 0.064 0.089 0.018 0.035 0.072
RETSD 4,145 0.569 0.528 0.252 0.387 0.673
R&D 4,145 0.068 0.068 0.021 0.046 0.098
LEV 4,145 0.483 0.226 0.315 0.493 0.628
LnSales 4,145 6.997 1.659 5.943 7.001 8.070
MB 4,145 3.553 3.001 1.863 2.724 4.152
CPS 4,145 0.369 0.142 0.277 0.353 0.447
SDTA 4,145 0.065 0.062 0.028 0.046 0.079
TAILS 4,145 0.301 0.459 0 0 1
Notes:
Table 2 reports the descriptive statistics for the sample. See Appendix for definitions of the variables.

30
TABLE 3
Pearson Correlations
LnTotal LnCash LnEquity LnOption PatentCount Citations Citations per
Patent ROA RET ROASD RETSD
R&D LEV LnSales MB CPS SDTA TAILS
LnTotal 1
LnCash 0.715*** 1
<.0001
LnEquity 0.384*** 0.320*** 1
<.0001 <.0001
LnOption 0.295*** 0.252*** 0.896*** 1
<.0001 <.0001 <.0001
PatentCount 0.388*** 0.438*** 0.280*** 0.263*** 1
<.0001 <.0001 <.0001 <.0001
Citations 0.388*** 0.404*** 0.277*** 0.262*** 0.931*** 1
<.0001 <.0001 <.0001 <.0001 <.0001
Citations/Patent 0.106*** -0.011 0.108*** 0.106*** 0.261*** 0.627*** 1
<.0001 0.5642 <.0001 <.0001 <.0001 <.0001
ROA 0.284*** 0.267*** 0.022 0.009 0.050*** 0.030* -0.021 1
<.0001 <.0001 0.1617 0.5682 0.0013 0.0939 0.2866
RET 0.125*** 0.072*** 0.021 0.031** -0.018 0.015 0.057*** 0.161*** 1
<.0001 <.0001 0.1801 0.0497 0.253 0.4161 0.0031 <.0001
ROASD -0.177*** -0.250*** 0.001 0.023 -0.059*** -0.023 0.135*** -0.440*** 0.049*** 1
<.0001 <.0001 0.9561 0.1473 0.0002 0.2014 <.0001 <.0001 0.0016
RETSD -0.132*** -0.280*** -0.003 0.029* -0.126*** -0.058*** 0.191*** -0.226*** 0.017 0.431*** 1
<.0001 <.0001 0.8303 0.0707 <.0001 0.0012 <.0001 <.0001 0.2881 <.0001
R&D -0.087*** -0.215*** 0.052*** 0.103*** 0.099*** 0.165*** 0.280*** -0.411*** 0.070*** 0.489*** 0.285*** 1
<.0001 <.0001 0.0011 <.0001 <.0001 <.0001 <.0001 <.0001 <.0001 <.0001 <.0001
LEV 0.127*** 0.294*** 0.069*** 0.016 0.149*** 0.080*** -0.223*** -0.224*** -0.058*** -0.050*** -0.261*** -0.211*** 1
<.0001 <.0001 <.0001 0.3201 <.0001 <.0001 <.0001 <.0001 0.0002 0.0013 <.0001 <.0001
LnSales 0.572*** 0.708*** 0.289*** 0.228*** 0.568*** 0.516*** 0.029 0.352*** -0.034** -0.400*** -0.353*** -0.392*** 0.391*** 1
<.0001 <.0001 <.0001 <.0001 <.0001 <.0001 0.1304 <.0001 0.0309 <.0001 <.0001 <.0001 <.0001
MB 0.245*** 0.101*** 0.167*** 0.165*** 0.135*** 0.157*** 0.094*** 0.093*** 0.100*** 0.123*** 0.115*** 0.281*** -0.067*** 0.032** 1
<.0001 <.0001 <.0001 <.0001 <.0001 <.0001 <.0001 <.0001 <.0001 <.0001 <.0001 <.0001 <.0001 0.0423
CPS 0.597*** 0.290*** 0.151*** 0.081*** 0.038** 0.021 -0.020 0.082*** -0.015 -0.079*** -0.067*** -0.086*** 0.065*** 0.111*** 0.020 1
<.0001 <.0001 <.0001 <.0001 0.0141 0.2403 0.3 <.0001 0.323 <.0001 <.0001 <.0001 <.0001 <.0001 0.1871
SDTA -0.167*** -0.234*** -0.025 0.006 -0.138*** -0.093*** 0.146*** -0.308*** 0.061*** 0.771*** 0.406*** 0.352*** -0.113*** -0.339*** 0.078*** 1
<.0001 <.0001 0.1182 0.717 <.0001 <.0001 <.0001 <.0001 <.0001 <.0001 <.0001 <.0001 <.0001 <.0001 <.0001
TAILS -0.206*** -0.164*** -0.055*** -0.050*** -0.035** -0.004 0.065*** -0.389*** 0.021 0.255*** 0.149*** 0.140*** 0.193*** -0.122*** -0.165*** -0.077*** 0.231*** 1
<.0001 <.0001 0.0006 0.0019 0.0243 0.8309 0.0008 <.0001 0.1683 <.0001 <.0001 <.0001 <.0001 <.0001 <.0001 <.0001 <.0001
Notes:
Table 3 reports Pearson correlation matrix for the variables. See Appendix for definitions of the variables.
***, **, and * denote significance at the 0.01, 0.05, and 0.10 levels, respectively.

31
Table 4 Regression of CEO Compensation on Patent Count
Notes:
Table 4 presents estimation results for the OLS regression relating CEO compensation to patent count.
Column (1) to (4) reports the results for CEO total compensation, cash compensation, equity compensation,
and option compensation respectively. Industry and year fixed effects are included. The numbers in
parentheses represent p-values, which are calculated based on standard errors clustered by firm. See Appendix
for definitions of the variables.
***, ** and * indicate significance at 1 percent, 5 percent and 10 percent levels, respectively, in a one-tailed
test if sign is predicted; two-tailed test otherwise.
Variable
Exp.
Sign
(1)
Total
compensation
(2)
Cash
compensation
(3)
Equity
compensation
(4)
Option
Grants
Intercept 3.553*** 4.264*** -1.565** -1.049
(<.0001) (<.0001) (0.0259) (0.1696)
PatentCount + 0.047*** 0.020*** 0.146*** 0.174***
(<.0001) (0.0002) (<.0001) (<.0001)
ROA + -0.570*** 0.098 -1.408*** -1.257**
(<.0001) (0.2126) (0.0028) (0.0141)
RET + 0.114*** 0.125*** 0.187** 0.207**
(<.0001) (<.0001) (0.0200) (0.0177)
ROASD + 0.319 0.190
(0.1871)
1.091 0.524
(0.1336) (0.2069) (0.5770)
RETSD + 0.107*** -0.074*** 0.271*** 0.337***
(<.0001) (<.0001) (0.0045) (0.0012)
R&D + 1.862*** 0.718*** 4.226*** 5.910***
(<.0001) (<.0001) (<.0001) (<.0001)
LEV - -0.346*** 0.118*** -0.693*** -1.060***
(<.0001) (0.0041) (0.0052) (<.0001)
LSALES + 0.414*** 0.279*** 0.572*** 0.539***
(<.0001) (<.0001) (<.0001) (<.0001)
MB + 0.045*** 0.004 0.069*** 0.059***
(<.0001) (0.1642) (<.0001) (0.0007)
CPS + 1.679*** 1.012*** 2.458*** 1.327***
(<.0001) (<.0001) (<.0001) (<.0001)
SDTA - -0.243 -0.008 -0.566 0.528
(0.3694) (0.9651) (0.6039) (0.6565)
TAILS ? -0.135*** -0.107*** -0.243** -0.297***
(<.0001) (<.0001) (0.0191) (0.0085)
Adj R2 0.5823 0.6034 0.1843 0.1482
N 4,133 4,133 3,903 3,903

32
Table 5 Regression of CEO Compensation on Patent Citations
Variable
Exp.
Sign
Total
compensation
Cash
compensation
Equity
compensation
Option
grants
Intercept 3.592*** 4.127*** -1.686** -1.236
(<.0001) (<.0001) (0.0187) (0.1095)
PatentCitations + 0.051*** 0.011** 0.120*** 0.126***
(<.0001) (0.0336) (0.0002) (0.0003)
ROA + -0.680*** 0.110 -1.890*** -1.997***
(<.0001) (0.2009) (0.0003) (0.0003)
RET + 0.092*** 0.110*** 0.176** 0.214**
(<.0001) (<.0001) (0.0385) (0.0195)
ROASD + 0.368 0.374** 1.902* 1.211
(0.1513) (0.0253) (0.0576) (0.2618)
RETSD + 0.128*** -0.060*** 0.363*** 0.418***
(<.0001) (0.0009) (0.0009) (0.0004)
R&D + 1.551*** 0.84*** 3.444*** 4.893***
(<.0001) (<.0001) (0.0003) (<.0001)
LEV +/- -0.404*** 0.100** -0.762*** -1.060***
(<.0001) (0.0335) (0.007) (0.0005)
LSALES + 0.408*** 0.293*** 0.620*** 0.598***
(<.0001) (<.0001) (<.0001) (<.0001)
MB + 0.050*** 0.004 0.071*** 0.062***
(<.0001) (0.2253) (<.0001) (0.0011)
CPS + 1.718*** 1.133*** 2.245*** 1.264***
(<.0001) (<.0001) (<.0001) (0.0004)
SDTA + -0.219 -0.329 -1.105 -0.108
(0.4801) (0.1044) (0.3629) (0.9339)
TAILS ? -0.134*** -0.098*** -0.212* -0.257**
(<.0001) (<.0001) (0.0642) (0.0372)
Adj R2 0.5754 0.6215 0.1930 0.1590
N 3,132 3,132 3,132 3,132
Notes:
Table 5 presents estimation results for the OLS regression relating CEO compensation to patent citations.
Column (1) to (4) reports the results for CEO total compensation, cash compensation, equity compensation,
and option compensation respectively. Industry and year fixed effects are included. The numbers in
parentheses represent p-values, which are calculated based on standard errors clustered by firm. See Appendix
for definitions of the variables.
***, ** and * indicate significance at 1 percent, 5 percent and 10 percent levels, respectively, in a one-tailed
test if sign is predicted; two-tailed test otherwise.

33
Table 6 Regressions of CEO Compensation on Patent Performance, Partitioned by
Firms with Large RETSD and Small RETSD
Panel A: Regressions of CEO Compensation on Patent Count
Variable
Exp
Sign
(1)
Total compensation
(2)
Cash compensation
(3)
Equity compensation
(4)
Option grants
Large
RETSD
Small
RETSD
Large
RETSD
Small
RETSD
Large
RETSD
Small
RETSD
Large
RETSD
Small
RETSD
Intercept 4.254*** 2.802*** 4.690*** 3.810*** -1.109 -2.676*** -0.385 -2.319**
(<.0001) (<.0001) (<.0001) (<.0001) (0.3697) (0.0017) (0.7685) (0.0156)
PatentCount + 0.082*** 0.008 0.037*** -0.005 0.142*** 0.136*** 0.178*** 0.141***
(<.0001) (0.2093) (<.0001) (0.2519) (0.0025) (0.0017) (0.0005) (0.0033)
ROA + -0.491*** -0.571*** 0.177* 0.040 -1.924*** 0.383 -1.253** -0.661
(0.0014) (0.0041) (0.082) (0.7714) (0.0012) (0.6608) (0.0465) (0.5001)
RET + 0.068** 0.231*** 0.104*** 0.186*** 0.121 0.419*** 0.107 0.522***
(0.0127) (<.0001) (<.0001) (<.0001) (0.2484) (0.003) (0.3352) (0.001)
ROASD + 0.431 0.302 0.104 0.169 1.184 2.378 1.106 -0.231
(0.1168) (0.4439) (0.5695) (0.5372) (0.2700) (0.1704) (0.3305) (0.9058)
RETSD + 0.060* 0.480*** -0.060*** -0.086 0.219* 1.417** 0.261** 1.005
(0.0557) (0.0021) (0.0041) (0.4274) (0.0750) (0.0405) (0.0447) (0.1959)
R&D + 1.195*** 2.456*** 0.474** 1.058*** 3.180*** 5.647*** 4.222*** 8.150***
(<.0001) (<.0001) (0.0179) (<.0001) (0.0067) (0.0001) (0.0007) (<.0001)
LEV +/- -0.421*** -0.184** 0.078 0.101* -1.255*** 0.274 -1.454*** -0.362
(<.0001) (0.0357) (0.1725) (0.0971) (0.0002) (0.4796) (<.0001) (0.4066)
LSALES + 0.382*** 0.464*** 0.252*** 0.323*** 0.526*** 0.619*** 0.431*** 0.670***
(<.0001) (<.0001) (<.0001) (<.0001) (<.0001) (<.0001) (<.0001) (<.0001)
MB + 0.046*** 0.037*** -0.003*** 0.009*** 0.075*** 0.037 0.086*** 0.005
(<.0001) (<.0001) (0.4605) (0.0116) (0.0008) (0.1148) (0.0003) (0.8574)
CPS + 1.506*** 1.896*** 0.871*** 1.188*** 2.494*** 2.369*** 1.798*** 0.610
(<.0001) (<.0001) (<.0001) (<.0001) (<.0001) (<.0001) (<.0001) (0.1984)
SDTA + -0.465 0.089 0.282 -0.377 -1.958 1.958 -1.501 5.107***
(0.2028) (0.8315) (0.2467) (0.1941) (0.1667) (0.2914) (0.3168) (0.0144)
TAILS ? -0.123*** -0.144 -0.089*** -0.095*** -0.256* -0.246* -0.218 -0.406**
(0.0016) (<.0001) (0.0006) (<.0001) (0.0919) (0.0859) (0.1758) (0.0117)
Adj R2 0.5124 0.6776 0.4987 0.6774 0.1516 0.2324 0.1323 0.179
N 2,066 2,067 2,066 2,067 1,956 1,947 1,956 1,947
Difference between +
PatentCount coefficients
0.074***
(<.0001)
0.041***
(0.0001)
0.006
(0.4646)
0.037
(0.3110)

34
Table 6 (continued) Regressions of CEO Compensation on Patent Performance,
Partitioned by Firms with Large RETSD and Small RETSD
Panel B: Regressions of CEO Compensation on Total Patent Citations
Notes:
Table 6 presents estimation results for the OLS regression of CEO compensation on innovation performance
for the two subsamples partitioned by the sample median value of stock return volatility (RETSD). Panel A
reports the results when innovation performance is measured using patent count. Panel B reports the results
when innovation performance is measured using patent citations. Column (1) to (4) reports the results for CEO
total compensation, cash compensation, equity compensation, and option compensation respectively. Industry
and year fixed effects are included. The numbers in parentheses represent p-values, which are calculated based
on standard errors clustered by firm. See Appendix for definitions of the variables.
***, ** and * indicate significance at 1 percent, 5 percent and 10 percent levels, respectively, in a one-tailed
test if sign is predicted; two-tailed test otherwise.
Variable
Exp
Sign
(1)
Total compensation
(2)
Cash compensation
(3)
Equity compensation
(4)
Option grants
Large
RETSD
Small
RETSD
Large
RETSD
Small
RETSD
Large
RETSD
Small
RETSD
Large
RETSD
Small
RETSD
Intercept 4.245*** 2.967*** 4.480*** 3.832*** -1.116*** -2.719*** -0.424 -2.449**
(<.0001) (<.0001) (<.0001) (<.0001) (0.3745) (0.0019) (0.7473) (0.012)
PatentCitations + 0.077*** 0.027*** 0.022*** 0.002 0.127*** 0.117*** 0.144*** 0.107**
(<.0001) (0.0056) (0.0036) (0.3898) (0.0037) (0.0040) (0.0019) (0.0142)
ROA + -0.618*** -0.578*** 0.199* 0.027 -2.444*** -0.153 -2.024*** -1.398
(0.0004) (0.0092) (0.0803) (0.8515) (0.0002) (0.8702) (0.0035) (0.18)
RET + 0.045 0.231*** 0.091*** 0.180*** 0.090 0.466*** 0.105 0.592***
(0.1257) (<.0001) (<.0001) (<.0001) (0.4168) (0.0019) (0.3675) (0.0004)
ROASD + 0.494 -0.132 0.380** -0.120 1.931 2.245 1.894 -0.837
(0.1376) (0.7723) (0.0782) (0.6846) (0.1241) (0.2409) (0.1499) (0.695)
RETSD + 0.090** 0.476** -0.041 -0.115 0.356** 0.957 0.381*** 0.712
(0.0164) (0.0111) (0.0867) (0.3464) (0.0115) (0.2247) (0.0098) (0.4178)
R&D + 1.018*** 2.248*** 0.769*** 0.937*** 2.218* 5.370*** 3.059** 7.820***
(0.0029) (<.0001) (0.0005) (0.0002) (0.0856) (0.0008) (0.0236) (<.0001)
LEV +/- -0.492*** -0.193* 0.067 0.091 -1.409*** 0.492 -1.556*** -0.065
(<.0001) (0.0663) (0.3044) (0.1827) (0.0002) (0.2656) (0.0001) (0.8949)
LSALES + 0.384*** 0.436*** 0.277*** 0.315*** 0.565*** 0.648*** 0.491*** 0.693***
(<.0001) (<.0001) (<.0001) (<.0001) (<.0001) (<.0001) (<.0001) (<.0001)
MB + 0.053*** 0.036*** -0.004 0.013*** 0.082*** 0.027 0.091*** -0.004
(<.0001) (<.0001) (0.3164) (0.0024) (0.0008) (0.317) (0.0004) (0.8893)
CPS + 1.544*** 1.945*** 1.004*** 1.287*** 2.371*** 1.956*** 1.651*** 0.598
(<.0001) (<.0001) (<.0001) (<.0001) (<.0001) (<.0001) (0.0009) (0.2573)
SDTA + -0.306 -0.056 -0.053 -0.517* -2.255 1.701 -1.913 4.616**
(0.4674) (0.908) (0.846) (0.0987) (0.1564) (0.401) (0.2512) (0.0411)
TAILS ? -0.152*** -0.095** -0.083*** -0.074*** -0.355** -0.059 -0.323* -0.180
(0.0008) (0.011) (0.0042) (0.0024) (0.0362) (0.7052) (0.069) (0.3011)
Adj R2 0.5259 0.6533 0.5252 0.6891 0.1697 0.2355 0.1527 0.1851
N 1,566 1,566 1,566 1,566 1,566 1,566 1,566 1,566
Difference between +
PatentCitations coefficients
0.051***
(0.0009)
0.020**
(0.0297)
0.010
(0.4365)
0.036
(0.3006)

35
Table 7 Regressions of CEO Compensation on Patent Performance, Partitioned by
Firms with Large ROASD and Small ROASD
Panel A: Regressions of CEO Compensation on Patent Count
Variable
Exp
Sign
(1)
Total compensation
(2)
Cash compensation
(3)
Equity compensation
(4)
Option grants
Large
ROASD
Small
ROASD
Large
ROASD
Small
ROASD
Large
ROASD
Small
ROASD
Large
ROASD
Small
ROASD
Intercept 4.103*** 3.039*** 4.409*** 3.946*** 0.098 -3.169*** 0.476 -2.473**
(<.0001) (<.0001) (<.0001) (<.0001) (0.9322) (0.0006) (0.6985) (0.0157)
PatentCount + 0.063*** 0.034*** 0.041*** 0.002 0.102** 0.186*** 0.158*** 0.193***
(<.0001) (0.0004) (<.0001) (0.4082) (0.0197) (<.0001) (0.0014) (0.0002)
ROA + -0.436*** -0.425 0.183** 0.887*** -1.382** -1.639 -1.298** -1.054
(0.0028) (0.1387) (0.0477) (<.0001) (0.0105) (0.2165) (0.024) (0.474)
RET + 0.072*** 0.177*** 0.098*** 0.174*** 0.101 0.269* 0.137 0.265
(0.0074) (<.0001) (<.0001) (<.0001) (0.3106) (0.0697) (0.1952) (0.1085)
ROASD + 0.395 -2.761* 0.109 -2.664** 1.506 13.248* 1.019 10.694
(0.1324) (0.0859) (0.5115) (0.024) (0.1248) (0.0747) (0.3297) (0.1947)
RETSD + 0.059** 0.271*** -0.062*** -0.092** 0.062 0.872*** 0.169 0.693**
(0.0414) (<.0001) (0.0007) (0.0193) (0.5691) (0.0005) (0.1413) (0.0122)
R&D + 1.433*** 2.051*** 0.536*** 0.329 2.955*** 4.726*** 4.139*** 8.094***
(<.0001) (<.0001) (0.0027) (0.2498) (0.005) (0.009) (0.0002) (<.0001)
LEV +/- -0.471*** -0.190** 0.071 0.111* -1.204*** -0.114 -1.515*** -0.606
(<.0001) (0.0351) (0.1848) (0.0951) (0.0002) (0.7848) (<.0001) (0.192)
LSALES + 0.386*** 0.451*** 0.246*** 0.326*** 0.549*** 0.633*** 0.507*** 0.61***
(<.0001) (<.0001) (<.0001) (<.0001) (<.0001) (<.0001) (<.0001) (<.0001)
MB + 0.044*** 0.037*** 0.002 -0.002 0.082*** 0.025 0.081*** -0.014
(<.0001) (<.0001) (0.569) (0.7263) (<.0001) (0.38) (0.0002) (0.6511)
CPS + 1.669*** 1.671*** 1.020*** 0.996*** 2.486*** 2.340*** 1.613*** 0.856*
(<.0001) (<.0001) (<.0001) (<.0001) (<.0001) (<.0001) (0.0003) (0.0737)
SDTA + -0.257 0.095 0.115 0.374 -1.248 1.045 -0.068 2.191
(0.4541) (0.8488) (0.5984) (0.3061) (0.329) (0.6444) (0.9602) (0.3829)
TAILS ? -0.129*** -0.127*** -0.066*** -0.069** -0.291** -0.320* -0.382*** -0.221
(0.0005) (0.0009) (0.005) (0.0143) (0.0354) (0.0664) (0.0096) (0.2527)
Adj R2 0.5402 0.6489 0.5726 0.6163 0.1753 0.2078 0.1633 0.1471
N 2,067 2,066 2,067 2,066 1,958 1,945 1,958 1,945
Difference between +
PatentCount coefficients
0.028**
(0.0442)
0.039***
(0.0003)
-0.085
(0.8910)
-0.035
(0.6786)

36
Table 7 (continued) Regressions of CEO Compensation on Patent Performance,
Partitioned by Firms with Large ROASD and Small ROASD
Panel B: Regressions of CEO Compensation on Total Patent Citations
Notes:
Table 7 presents estimation results for the OLS regression of CEO compensation on innovation performance
for the two subsamples partitioned by the sample median value of ROA volatility (ROASD). Panel A reports
the results when innovation performance is measured using patent count. Panel B reports the results when
innovation performance is measured using patent citations. Column (1) to (4) reports the results for CEO total
compensation, cash compensation, equity compensation, and option compensation respectively. Industry and
year fixed effects are included. The numbers in parentheses represent p-values, which are calculated based on
standard errors clustered by firm. See Appendix for definitions of the variables.
***, ** and * indicate significance at 1 percent, 5 percent and 10 percent levels, respectively, in a one-tailed
test if sign is predicted; two-tailed test otherwise.
Variable
Exp
Sign
(1)
Total compensation
(2)
Cash compensation
(3)
Equity compensation
(4)
Option grants
Large
ROASD
Small
ROASD
Large
ROASD
Small
ROASD
Large
ROASD
Small
ROASD
Large
ROASD
Small
ROASD
Intercept 4.156*** 3.078*** 4.261*** 3.906*** 0.102 -3.513*** 0.429 -2.741***
(<.0001) (<.0001) (<.0001) (<.0001) (0.9296) (0.0003) (0.7276) (0.0088)
PatentCitations + 0.061*** 0.039*** 0.021*** 0.009* 0.093** 0.138*** 0.099** 0.152***
(<.0001) (0.0001) (0.0053) (0.0909) (0.0220) (0.0015) (0.0220) (0.0013)
ROA + -0.59*** -0.735** 0.182* 0.810*** -1.917*** -2.293 -2.024*** -2.922*
(0.0004) (0.0258) (0.0827) (0.0003) (0.0012) (0.1188) (0.0013) (0.0679)
RET + 0.065** 0.150*** 0.085*** 0.167*** 0.122 0.236 0.170 0.262
(0.0229) (<.0001) (<.0001) (<.0001) (0.2358) (0.1415) (0.1202) (0.1343)
ROASD + 0.371 -3.041 0.296 -2.864** 1.822 16.116* 1.489 12.201
(0.2373) (0.113) (0.1387) (0.0268) (0.1036) (0.0595) (0.2124) (0.1899)
RETSD + 0.072** 0.285*** -0.045** -0.121*** 0.153 0.862*** 0.245* 0.783**
(0.0356) (<.0001) (0.0409) (0.0047) (0.209) (0.0024) (0.0596) (0.0113)
R&D + 0.986*** 2.442*** 0.696*** 0.434 1.769 4.897** 3.260*** 7.347***
(0.0021) (<.0001) (0.0006) (0.162) (0.1211) (0.0172) (0.0075) (0.001)
LEV +/- -0.539*** -0.226** 0.058 0.136* -1.298*** -0.402 -1.604*** -0.724
(<.0001) (0.0345) (0.3694) (0.0589) (0.0003) (0.397) (<.0001) (0.1617)
LSALES + 0.383*** 0.442*** 0.270*** 0.320*** 0.580*** 0.728*** 0.577*** 0.670***
(<.0001) (<.0001) (<.0001) (<.0001) (<.0001) (<.0001) (<.0001) (<.0001)
MB + 0.052*** 0.036*** 0.003 -0.001 0.090*** 0.008 0.078*** 0.002
(<.0001) (<.0001) (0.5066) (0.8552) (<.0001) (0.8171) (0.0008) (0.9629)
CPS + 1.659*** 1.785*** 1.106*** 1.143*** 2.239*** 2.196*** 1.320*** 1.120**
(<.0001) (<.0001) (<.0001) (<.0001) (<.0001) (<.0001) (0.0064) (0.0375)
SDTA + -0.310 0.070 -0.228 0.159 -1.855 0.528 -0.870 1.593
(0.4374) (0.8988) (0.3679) (0.6712) (0.1923) (0.8308) (0.5666) (0.5536)
TAILS ? -0.149*** -0.116*** -0.074*** -0.040 -0.275* -0.261 -0.394** -0.162
(0.0005) (0.0073) (0.0066) (0.1662) (0.0699) (0.1748) (0.0151) (0.4394)
Adj R2 0.5435 0.6363 0.5763 0.6542 0.186 0.2166 0.1626 0.1685
N 1,566 1,566 1,566 1,566 1,566 1,566 1,566 1,566
Difference between +
PatentCitations coefficients
0.022*
(0.0927)
0.012
(0.1384)
-0.045
(0.7532)
-0.053
(0.7753)

37
Table 8 Regressions of CEO Compensation on Patent Performance, Partitioned by
R&D Intensity
Panel A: Regressions of CEO Compensation on Patent Count
Variable
Exp.
Sign
(1)
Total compensation
(2)
Cash compensation
(3)
Equity compensation
(4)
Option grants
High
R&D
Low
R&D
High
R&D
Low
R&D
High
R&D
Low
R&D
High
R&D
Low
R&D
Intercept 3.776*** 2.885*** 4.413*** 3.695*** -0.593 -2.792*** -0.090 -2.287**
(<.0001) (<.0001) (<.0001) (<.0001) (0.5969) (0.003) (0.9395) (0.0286)
PatentCount + 0.067*** 0.002 0.024*** 0.016** 0.218*** -0.016 0.328*** -0.075*
(<.0001) (0.4215) (0.0023) (0.02) (<.0001) (0.3752) (<.0001) (0.089)
ROA + -0.541*** -0.077 0.124 0.749*** -1.149** -2.005* -0.643 -2.183*
(0.0004) (0.7331) (0.2067) (<.0001) (0.0398) (0.0605) (0.2744) (0.0656)
RET + 0.081*** 0.139*** 0.107*** 0.126*** 0.093 0.337** 0.058 0.426***
(0.0039) (<.0001) (<.0001) (<.0001) (0.3653) (0.0126) (0.5935) (0.0045)
ROASD + 0.082 1.018*** 0.169 -0.215 0.931 1.851 0.650 0.059
(0.762) (0.008) (0.3369) (0.441) (0.3508) (0.3214) (0.5359) (0.9772)
RETSD + 0.087*** 0.085** -0.076*** -0.040 0.298*** 0.015 0.290** 0.123
(0.0047) (0.0261) (0.0001) (0.1482) (0.0085) (0.9338) (0.015) (0.5432)
R&D + 0.538* 2.690*** 0.345* 1.109** 0.606 12.335*** 0.787 16.205***
(0.0777) (0.0001) (0.0814) (0.0306) (0.5905) (0.0002) (0.507) (<.0001)
LEV +/- -0.388*** -0.102 0.088 0.112* -0.712** -0.434 -0.926*** -0.870*
(<.0001) (0.2301) (0.119) (0.0708) (0.0292) (0.2815) (0.0071) (0.0521)
LSALES + 0.369*** 0.488*** 0.253*** 0.335*** 0.466*** 0.732*** 0.337*** 0.797***
(<.0001) (<.0001) (<.0001) (<.0001) (<.0001) (<.0001) (<.0001) (<.0001)
MB + 0.051*** 0.023*** 0.00001 0.002 0.103*** 0.008 0.113*** -0.047
(<.0001) (0.0001) (0.9976) (0.6643) (<.0001) (0.7739) (<.0001) (0.1307)
CPS + 1.346*** 2.125*** 0.862*** 1.210*** 1.920*** 3.323*** 1.540*** 1.298**
(<.0001) (<.0001) (<.0001) (<.0001) (<.0001) (<.0001) (0.0002) (0.0109)
SDTA + -0.268 -0.254 0.005 0.450 -0.741 -0.387 -0.046 1.512
(0.4573) (0.5392) (0.9839) (0.1349) (0.5772) (0.8427) (0.9739) (0.4855)
TAILS ? -0.063 -0.178*** -0.09*** -0.061** 0.072 -0.515*** 0.126 -0.619***
(0.11) (<.0001) (0.0004) (0.0109) (0.6232) (0.0009) (0.4127) (0.0003)
Adj R2 0.5739 0.6334 0.6072 0.6213 0.1984 0.1648 0.1782 0.1096
N 2,066 2,067 2,066 2,067 1,952 1,951 1,952 1,951
Difference between +
PatentCount coefficients
0.065***
(<0.0001)
0.008
(0.2264)
0.234***
(0.0012)
0.403***
(<0.0001)

38
Table 8 (continued) Regressions of CEO Compensation on Patent Performance,
Partitioned by R&D Intensity
Panel B: Regression of CEO Compensation on Total Patent Citations
Notes:
Table 8 presents estimation results for the OLS regression of CEO compensation on innovation performance
for the two subsamples partitioned by the industry median level of R&D intensity (R&D). Panel A reports the
results when innovation performance is measured using patent count. Panel B reports the results when
innovation performance is measured using patent citations. Column (1) to (4) reports the results for CEO total
compensation, cash compensation, equity compensation, and option compensation respectively. Industry and
year fixed effects are included. The numbers in parentheses represent p-values, which are calculated based on
standard errors clustered by firm. See Appendix for definitions of the variables.
***, ** and * indicate significance at 1 percent, 5 percent and 10 percent levels, respectively, in a one-tailed
test if sign is predicted; two-tailed test otherwise.
Variable
Exp
Sign
(1)
Total compensation
(2)
Cash compensation
(3)
Equity compensation
(4)
Option grants
High
R&D
Low
R&D
High
R&D
Low
R&D
High
R&D
Low
R&D
High
R&D
Low
R&D
Intercept 3.838*** 2.863*** 4.263*** 3.554*** -0.708 -2.761*** -0.133 -2.461**
(<.0001) (<.0001) (<.0001) (<.0001) (0.5351) (0.0044) (0.9118) (0.0202)
PatentCitations + 0.061*** 0.016* 0.011* 0.017** 0.163*** -0.004 0.248*** -0.078*
(<.0001) (0.0661) (0.0925) (0.0122) (0.0003) (0.47) (<.0001) (0.0744)
ROA + -0.614*** -0.300 0.122 0.937*** -1.444** -3.764*** -1.207* -4.426***
(0.0004) (0.258) (0.2536) (<.0001) (0.0184) (0.0021) (0.0599) (0.0009)
RET + 0.074** 0.113*** 0.090*** 0.125*** 0.128 0.296** 0.140 0.346**
(0.015) (0.0003) (<.0001) (<.0001) (0.2353) (0.0409) (0.2179) (0.0285)
ROASD + 0.150 1.486*** 0.222 0.188 1.811 3.660 1.267 2.609
(0.6396) (0.0061) (0.2628) (0.6229) (0.1117) (0.1417) (0.2884) (0.3377)
RETSD + 0.105*** 0.097** -0.059*** -0.048 0.404*** 0.019 0.382*** 0.137
(0.0035) (0.0385) (0.0081) (0.1486) (0.0016) (0.9287) (0.0046) (0.5584)
R&D + 0.323 2.279*** 0.608*** 0.263 0.066 13.358*** 0.061 17.075***
(0.3538) (0.0047) (0.0049) (0.6431) (0.9577) (0.0003) (0.9625) (<.0001)
LEV +/- -0.442*** -0.188* 0.091 0.089 -0.767** -0.675 -0.995** -0.932*
(<.0001) (0.059) (0.1593) (0.2059) (0.0386) (0.1402) (0.0106) (0.0624)
LSALES + 0.366*** 0.489*** 0.269*** 0.350*** 0.515*** 0.787*** 0.392*** 0.873***
(<.0001) (<.0001) (<.0001) (<.0001) (<.0001) (<.0001) (<.0001) (<.0001)
MB + 0.054*** 0.025*** -0.002 0.007 0.102*** -0.002 0.112*** -0.061*
(<.0001) (0.0004) (0.624) (0.1734) (<.0001) (0.9581) (<.0001) (0.0844)
CPS + 1.363*** 2.193*** 0.983*** 1.303*** 1.935*** 2.753*** 1.666*** 0.880
(<.0001) (<.0001) (<.0001) (<.0001) (<.0001) (<.0001) (0.0003) (0.1201)
SDTA + -0.441 0.110 -0.282 0.311 -1.578 -0.186 -1.059 1.836
(0.2965) (0.8148) (0.2808) (0.349) (0.2939) (0.9313) (0.5013) (0.4364)
TAILS ? -0.072 -0.183*** -0.074*** -0.062** 0.046 -0.499*** 0.082 -0.602***
(0.1144) (<.0001) (0.0089) (0.0162) (0.7796) (0.0031) (0.6317) (0.0011)
Adj R2 0.5679 0.6234 0.6313 0.6388 0.2056 0.1728 0.1820 0.1307
N 1,566 1,566 1,566 1,566 1,566 1,566 1,566 1,566
Difference between +
PatentCitations coefficients
0.045***
(0.0038)
-0.006
(0.7133)
0.166***
(0.0071)
0.326***
(<0.0001)

39
Table 9 Regression of CEO Compensation on Patent Performance and Indicator for
Retiring CEO
Panel A: Regression of CEO Compensation on Patent Count
Variable
Exp.
Sign
(1)
Total
compensation
(2)
Cash
compensation
(3)
Equity
compensation
(4)
Option
grants
Intercept 3.580*** 4.264*** -1.280* -0.793
(<.0001) (<.0001) (0.0684) (0.2992)
PatentCount + 0.042*** 0.016*** 0.104*** 0.138***
(<.0001) (0.0041) (0.0022) (0.0003)
Retire ? -0.077* 0.043 -0.890*** -0.824***
(0.0552) (0.1145) (<.0001) (<.0001)
PatentCount*Retire + 0.018 0.025*** 0.148*** 0.119**
(0.1088) (0.0054) (0.0051) (0.028)
ROA + -0.576*** 0.111 -1.496*** -1.343***
(<.0001) (0.1574) (0.0014) (0.0085)
RET + 0.114*** 0.126*** 0.187** 0.207**
(<.0001) (<.0001) (0.0196) (0.0176)
ROASD + 0.324 0.171
(0.2344)
1.158 0.595
(0.1282) (0.1786) (0.5254)
RETSD + 0.106*** -0.074*** 0.253*** 0.320***
(<.0001) (<.0001) (0.0077) (0.002)
R&D + 1.840*** 0.781*** 3.873*** 5.557***
(<.0001) (<.0001) (<.0001) (<.0001)
LEV - -0.350*** 0.119*** -0.751*** -1.113***
(<.0001) (0.0037) (0.0024) (<.0001)
LSALES + 0.414*** 0.280*** 0.571*** 0.538***
(<.0001) (<.0001) (<.0001) (<.0001)
MB + 0.045*** 0.004 0.068 *** 0.058***
(<.0001) (0.1884) (<.0001) (0.0008)
CPS + 1.681*** 0.997*** 2.508*** 1.380***
(<.0001) (<.0001) (<.0001) (<.0001)
SDTA - -0.247 0.045 -0.704 0.375
(0.3605) (0.8036) (0.5177) (0.7512)
TAILS ? -0.138*** -0.103*** -0.283*** -0.335***
(<.0001) (<.0001) (0.0061) (0.0029)
Adj R2 0.5825 0.6069 0.1916 0.1542
N 4,133 4,133 3,903 3,903

40
Table 9 (continued) Regression of CEO Compensation on Patent Performance and
Indicator for Retiring CEO
Panel B: Regression of CEO Compensation on Patent Citations
Notes:
Table 9 presents estimation results for the OLS regression relating CEO compensation to innovation
performance and its interaction with retiring CEOs. Retire is set equal to 1 if CEO age is over 62; else zero.
Panel A reports the results when innovation performance is measured using patent count. Panel B reports the
results when innovation performance is measured using patent citations. Column (1) to (4) reports the results
for CEO total compensation, cash compensation, equity compensation, and option compensation respectively.
Industry and year fixed effects are included. The numbers in parentheses represent p-values, which are
calculated based on standard errors clustered by firm. See Appendix for definitions of the variables.
***, ** and * indicate significance at 1 percent, 5 percent and 10 percent levels, respectively, in a one-tailed
test if sign is predicted; two-tailed test otherwise.
Variable
Exp.Sign
(1)
Total
compensation
(2)
Cash
compensation
(3)
Equity
compensation
(4)
Option
grants
Intercept 3.612*** 4.14*** -1.495** -1.046
(<.0001) (<.0001) (0.037) (0.1757)
PatentCitations + 0.048*** 0.006 0.096*** 0.102***
(<.0001) (0.1444) (0.0027) (0.0028)
Retire ? -0.062 0.025 -0.730*** -0.738***
(0.1491) (0.3653) (<.0001) (<.0001)
PatentCitations*Retire + 0.014 0.029*** 0.080* 0.076*
(0.1656) (0.0008) (0.0728) (0.0999)
ROA + -0.685*** 0.131 -1.994*** -2.105***
(<.0001) (0.1266) (0.0001) (0.0002)
RET + 0.092*** 0.110*** 0.178** 0.216**
(<.0001) (<.0001) (0.0354) (0.0179)
ROASD + 0.371 0.367** 1.956 1.266
(0.1476) (0.0276) (0.0500) (0.2389)
RETSD + 0.127*** -0.062*** 0.354*** 0.409***
(<.0001) (0.0006) (0.0011) (0.0005)
R&D + 1.528*** 0.912*** 3.023*** 4.458***
(<.0001) (<.0001) (0.0017) (<.0001)
LEV +/- -0.410*** 0.100** -0.829*** -1.128***
(<.0001) (0.0337) (0.0033) (0.0002)
LSALES + 0.408*** 0.293*** 0.623*** 0.602***
(<.0001) (<.0001) (<.0001) (<.0001)
MB + 0.050*** 0.003 0.070*** 0.061***
(<.0001) (0.2406) (<.0001) (0.0014)
CPS + 1.719*** 1.117*** 2.299*** 1.320***
(<.0001) (<.0001) (<.0001) (0.0002)
SDTA + -0.216 -0.287 -1.167 -0.178
(0.4877) (0.1551) (0.3348) (0.8914)
TAILS ? -0.136*** -0.094*** -0.246** -0.292**
(<.0001) (<.0001) (0.031) (0.0175)
Adj R2 0.5754 0.6253 0.1994 0.1649
N 3,132 3,132 3,132 3,132

41
Table 10 Regression of CEO Compensation on Patent Performance and Indicator
Variable for New CEO
Panel A: Regressions of CEO Compensation on Patent Count
Variable
Exp.
Sign
(1)
Total
compensation
(2)
Cash
compensation
(3)
Equity
compensation
(4)
Option
grants
Intercept + 3.607*** 4.369 *** -1.695** -1.034
(<.0001) (<.0001) (0.0178) (0.1838)
PatentCount + 0.061*** 0.021*** 0.174*** 0.191***
(<.0001) (0.0017) (<.0001) (<.0001)
NewCEO ? -0.012 -0.083*** 0.171 0.026
(0.7427) (0.0011) (0.2655) (0.8746)
PatentCount* NewCEO - -0.024** -0.003 -0.049 -0.030
(0.023) (0.3636) (0.1638) (0.2926)
ROA + -0.564*** 0.112 -1.427*** -1.255**
(<.0001) (0.1561) (0.0025) (0.0143)
RET + 0.115*** 0.127*** 0.185** 0.207**
(<.0001) (<.0001) (0.0217) (0.0177)
ROASD + 0.333 0.202
(0.1598)
1.093 0.531
(0.1168) (0.2061) (0.5722)
RETSD + 0.107*** -0.069 *** 0.261*** 0.335***
(<.0001) (<.0001) (0.0065) (0.0013)
R&D + 1.85*** 0.701 *** 4.239*** 5.906***
(<.0001) (<.0001) (<.0001) (<.0001)
LEV - -0.335*** 0.128*** -0.694*** -1.050***
(<.0001) (0.0017) (0.0052) (0.0001)
LSALES + 0.413*** 0.277*** 0.575*** 0.539***
(<.0001) (<.0001) (<.0001) (<.0001)
MB + 0.044*** 0.003 0.068*** 0.058***
(<.0001) (0.2146) (<.0001) (0.0009)
CPS + 1.648*** 0.979*** 2.466*** 1.304***
(<.0001) (<.0001) (<.0001) (<.0001)
SDTA - -0.206 0.026 -0.565 0.563
(0.4465) (0.8881) (0.6048) (0.6358)
TAILS ? -0.133*** -0.105*** -0.243** -0.296***
(<.0001) (<.0001) (0.019) (0.0088)
Adj R2 0.5835 0.6064 0.1841 0.1479
N 4,133 4,133 3,903 3,903

42
Table 10 (continued) Regression of CEO Compensation on Patent Performance and
Indicator Variable for New CEO
Panel B: Regressions of CEO Compensation on Patent Citations
Variable
Exp.Sign
(1)
Total
compensation
(2)
Cash
compensation
(3)
Equity
compensation
(4)
Option
grants
Intercept 3.659*** 4.253*** -1.847** -1.318*
(<.0001) (<.0001) (0.0115) (0.094)
PatentCitations + 0.070*** 0.011** 0.163*** 0.156***
(<.0001) (0.0680) (0.0001) (0.0005)
NewCEO ? -0.015 -0.107*** 0.230 0.136
(0.7089) (<.0001) (0.1537) (0.4356)
PatentCitations*NewCEO - -0.031*** 0.0003 -0.070* -0.049
(0.0054) (0.4869) (0.0731) (0.1730)
ROA + -0.667*** 0.136 -1.922*** -2.014***
(<.0001) (0.1148) (0.0002) (0.0003)
RET + 0.092*** 0.111*** 0.172** 0.212**
(<.0001) (<.0001) (0.0429) (0.021)
ROASD + 0.378 0.392** 1.882* 1.201
(0.1392) (0.0186) (0.0603) (0.2659)
RETSD + 0.129*** -0.053*** 0.347*** 0.409***
(<.0001) (0.0035) (0.0015) (0.0005)
R&D + 1.568*** 0.842*** 3.475*** 4.915***
(<.0001) (<.0001) (0.0003) (<.0001)
LEV +/- -0.382*** 0.118** -0.757*** -1.053***
(<.0001) (0.0119) (0.0075) (0.0006)
LSALES + 0.406*** 0.291*** 0.622*** 0.599***
(<.0001) (<.0001) (<.0001) (<.0001)
MB + 0.049*** 0.003 0.069*** 0.061***
(<.0001) (0.2966) (<.0001) (0.0015)
CPS + 1.681*** 1.099*** 2.247*** 1.257***
(<.0001) (<.0001) (<.0001) (0.0005)
SDTA + -0.159 -0.289 -1.070 -0.075
(0.6079) (0.1529) (0.3785) (0.9544)
TAILS ? -0.134*** -0.098*** -0.214* -0.258**
(<.0001) (<.0001) (0.0611) (0.0361)
Adj R2 0.5776 0.6256 0.1931 0.1587
N 3,132 3,132 3,132 3,132
Notes:
Table 10 presents estimation results for the OLS regression relating CEO compensation to innovation
performance and its interaction with new CEOs. NewCEO is set equal to 1 if CEO tenure less than 3 years;
else zero. Panel A reports the results when innovation performance is measured using patent count. Panel B
reports the results when innovation performance is measured using patent citations. Column (1) to (4) reports
the results for CEO total compensation, cash compensation, equity compensation, and option compensation
respectively. Industry and year fixed effects are included. The numbers in parentheses represent p-values,
which are calculated based on standard errors clustered by firm. See Appendix for definitions of the variables.
***, ** and * indicate significance at 1 percent, 5 percent and 10 percent levels, respectively, in a one-tailed
test if sign is predicted; two-tailed test otherwise.

43
Table 11 Regression of CEO Compensation on Patent Citations and Components
Variable Exp. Sign Total compensation Total compensation
Intercept 3.592*** 3.761***
(<.0001) (<.0001)
PatentCitations + 0.051***
(<.0001)
PatentCount + 0.08***
(<.0001)
Citations/patent + 0.095***
(0.0007)
ROA + -0.680*** -0.521***
(<.0001) (0.0004)
RET + 0.092*** 0.079***
(<.0001) (0.0013)
ROASD + 0.368 0.032
(0.1513) (0.9115)
RETSD + 0.128*** 0.157***
(<.0001) (<.0001)
R&D + 1.551*** 1.406***
(<.0001) (<.0001)
LEV +/- -0.404*** -0.361***
(<.0001) (<.0001)
LSALES + 0.408*** 0.373***
(<.0001) (<.0001)
MB + 0.050*** 0.049***
(<.0001) (<.0001)
CPS + 1.718*** 1.609***
(<.0001) (<.0001)
SDTA + -0.219 -0.219
(0.4801) (0.531)
TAILS ? -0.134*** -0.113***
(<.0001) (0.0004)
Adj R2 0.5754 0.5735
N 3,132 2,638
Notes:
Table 11 presents estimation results for the OLS regression of CEO total compensation on total patent citation
and its components. Column (1) reports the results relating CEO total compensation to total patent citations.
Column (2) reports the results relating CEO total compensation to patent count and citations per patent.
Industry and year fixed effects are included. The numbers in parentheses represent p-values, which are
calculated based on standard errors clustered by firm. See Appendix for definitions of the variables.
***, ** and * indicate significance at 1 percent, 5 percent and 10 percent levels, respectively, in a one-tailed
test if sign is predicted; two-tailed test otherwise.