the use of multivariate analysis in the classification of
TRANSCRIPT

1
The use of multivariate analysis in the classification of Syrian governorates according to the number of
communicable diseases 2001-2017 Dr. Mohamed Akroush1, Dr. Fawaz Haidar2, Lama MInla3
ــــــــــــــــــــــــــــــــــــــــــــــــــــــــــــــــــــــــــــــــــــــــــــــــــــــــــــــــــــــــــــــــــــــــــــــــــ
Summary:
This study provides an assessment of the current status of communicable diseases in Syria Arab Public from 2011-2017. Within groups of the main diseases that the Syria Ministry of Health in cooperation with the World Health Organization are monitoring and following up on their numbers and whether the infection is verifiable and spreadable or is still suspected. This study provides a statistical map of the most areas that prone to communicable diseases in the Syrian governorates during years of study.
In this study we used the style of multivariate to analysis through the use of cluster and discriminatory to the classification of Syria governorates. The results show that there is no homogeneity in the number of infectious diseases among the Syria governorates, where the level of infection group within the average level by distinguishing these levels of communicable in the Syria governorates, a group of 21 diseases has showed different levels from the rest like Diphtheria diseases and leishmaniasis.
Keywords:
Communicable diseases, Syrian governorates, cluster analysis,
discriminatory analysis.
ــــــــــــــــــــــــــــــــــــــــــــــــــــــــــــــــــــــــــــــــــــــــــــــــــــــــــــــــــــــــــــــــــــــــــــــــــ
1-Introduction:
Diseases of all kinds are one of the major problems of human beings at
the individual, regional and global levels which lead to appear a group of
problems in society that are affected by the geographical, economic and
1 Department of Statistics and Programming, Faculty of Economics, Tishreen University, Syria.
2 Department of Public Health, Faculty of Medicine, Tishreen University, Syria.
3 Department of Statistics and Programming, Faculty of Economics, Tishreen University, Syria. e mail:

2
social environment [1]. The critical hypothesis of epidemiology is that
duality of diseases and health don't occur randomly in the total
population, but are more likely to be achieved in some members of
population than others because of risk factors that may not randomly
distributed between the population [2]. At the global and local levels,
there is a constant and sustained follow up of the increasing incidence,
control and recording of any recording of any new cases through
surveillance programs (routine or sentinel), and the need to report any
new numbers that many approach the criteria that are considered as
indicators of risk which requiring rapid intervention. In the new
International Regulations adopted by 58th World Health Assembly in May
2005, a legal farm work designed to prevent , protect, combat and
provide an effective and genuine response against diseases and health
events that may constitute public health emergencies of international
concern was developed to achieve that, the new International Health
Regulations have put a set of rules and procedures to support the
current global outbreak alert and response system, requiring counties to
improve international surveillance and notification mechanism on public
health events and to strengthen their national surveillance and
intervention capacities [3]. To this end it is necessary to study several
factors most important of which identify place and geographical areas
which record the number of communicable diseases according to the
type of diseases, the severity of its spread and the ways of spreading
the infection, which gives the government and international supportive
and active health authorities in change of controlling and treating
communicable diseases the ability and dynamism to respond to any
increase in the number of new infections and to treat and confirm
confirmed infections which in turn become transmission and spread
factors for the rest of population . Scientific literature relating to
communicable diseases has extensive attention to all aspects of the
incidence of infection direct monitoring of numbers (infected and
suspected) location of outbreaks of specific communicable diseases and
response to outbreaks. A critical evaluation of these literature reveals
the most authors have been interested in the idea of spatial spread, with
most studies focusing on the spread of communicable diseases

3
according to geographical maps and predisposing factors in a
geographical region. In 2019 Dalvi and Braga studied the spatial spread
of Zika, Dengue and Chikungunya epidemic 2015-2019 in the
municipality of Rio de Janerio, Brazil to study the infection rate of the
population and determine the nearest neighbor through the hierarchy of
distribution of viruses in the city according to the spatial distribution this
gave the ability to study the propagation pattern of the three viruses [4].
In 2013 AlZiad and Hussein examined the spatial variability of
communicable diseases in Sheikh Souk for the period 2004-2010 in the
Republic of Iraq with the aim of demonstrating, analyzing and detecting
the geographical distribution of communicable diseases and identifying
the geographical environments in which the disease is concentrated or
spread and the factors leading to this variation. The research showed
that the incidence of smallpox was the first place, where the number of
infections were 279 cases, 30.8% of the total number of cases in 2004
with a turbulent increase in some communicable diseases such as
typhoid 15% of total infection in 2004 [5]. In 2016 Moore, Gelfeld,
Okunogbe and Paul presented research to identify future areas most
susceptible to diseases by designing an infectious disease vulnerability
index, in order to provide an effective tool to help identify countries that
may be more vulnerable to outbreaks. Infectious diseases promote
awareness in them [6].
ــــــــــــــــــــــــــــــــــــــــــــــــــــــــــــــــــــــــــــــــــــــــــــــــــــــــــــــــــــــــــــــــــــــــــــــــــ
2- Materials and methods:
2.1 Communicable diseases:
Infectious diseases are a disease that can be transmitted or spread from
one person or species to another either direct or indirect contact. The
World Health Organization defines infectious diseases as diseases
caused by pathogenic microorganisms such as: bacteria, viruses,
parasites or fungi which can spread directly or indirectly from person to
person [7]. Where an epidemic or outbreak can occur, when it meets
several auxiliary aspects of the occurrence of the diseases of the worker
(pathogen), population (hosts) and the environment thus constitute an
ideal position for spread. Infectious agents are abundant, rapidly

4
changing and can become resistant to drugs if they are not completely
destroyed [8] [9]. Low vaccination rates, malnutrition, age (old and new)
and immune depression all contribute to the risk of infection as
overcrowding, poor regional design and hygiene due to poverty, dirty
drinking water, rapid climate change and natural diseases can lead to
conditions that allow easy transmission of disease [8], It may spread and
movement of people or goods geographically can sometimes be more
complex than a simple wave or simple graphical deployment model
would describe. This is because the way these things are transferred is
no longer confined to a local geography or a limited network of contacts,
for example: an infectious flu spreading somewhere may become a
complex deployment if virus carries are dispersed across highway
networks to remote locations. Such influenza may spread beyond the
region and even become international, consequently studies that focus
on spatial diffusion should become more sophisticated and specialized
than traditional methods of studying the composition of the affected
population through a single-shape diffusion curve or other relater
methods [9].
Communicable diseases are still forming a risk of health which are a
main cause of death in many parts of the world. Tuberculosis is one of
the top ten cause of death worldwide with an annual burden of 1.7
million dollars. In 2016 global deaths from other infectious diseases
included 1.34 million hepatitis deaths, 1.0 million HIV related causes and
about half a million malarias. Outbreak of vaccine-preventable diseases
such as polio, rubella and other life threatening diseases pose a
significant threat to different communities around the world [7]. Once
an emergency is confirmed, there must be a rapid and comprehensive
response to the control of infectious diseases. A specialized health camp
should be established and the diseases should be managed quickly. The
total objectives are rapid assessment, prevention, surveillance, diseases
outbreak control and diseases management, for more detailed
information on the logistics of infectious disease control [8].

5
2.2 Classification of communicable diseases:
Infectious diseases are major causes of death, disability, and social and
economic
disruption for millions of people. In addition, they can be possibly
transmitted via several
ways through pathogens, vectors, non-biological physical vehicles
(water, soil, etc.), nonhuman reservoirs and human host [10]
Communicable diseases are classified into three categories: diseases
that cause high levels of mortality, diseases that place a heavy burden
on population, and diseases that can have serious global implications,
given their spread and un predictable nature of the spread [11].
Therefore, infectious diseases can be classified into two categories
based on mode of transmission:
- those that spread directly from person to person (through direct
contact or exposure to the drop).
- those that spread indirectly through an interfering vector (mosquito or
tick) or non-biological physical compound (soil and water) [12]
The existence of an environment that fosters the spread of infection
among the population makes it difficult to combat and identify places
and geographical regions is difficult for all government agencies and
community bodies to address and reduce it.
2.3 Global variation in dealing with communicable diseases:
Throughout history diseases take a wide logical, geographical scope and
communicable diseases are one of the most affected by the geographic
structure and socio-economic environment of community, the impacts
associated with these diseases are complementary in structure,
alternating in intensity, strength and impact. While there are many
preventive measures against the emergence and spread of
communicable diseases may have disappeared especially in developed
countries, but there are still communicable diseases characterized by

6
high prevalence at a global level. One of the reasons is the increase in
the population and the resistance of bacteria that cause the diseases
due to the emergence of new chains which don't work with traditional
treatments, in addition to the lock of medicines especially in countries
where there are disorders that prevent the completion of the medical
care model that leads cases and a decrease in the number of new
infections. Due to the erratic planning of recourses in the world and the
power of political decision-making in each country, economic and social
differences are becoming increasingly contradictory. In regions with low
levels of society and economic development in term of geographical
distribution of communicable diseases, this group of countries is
characterized by disorders associated with increasing population and
food shortages, poor sanitation, poor health and presence of diseases
that directly lead to death. This isn't the case in developed economic and
social areas because of the advantages that members of society receive
in socio-economic living conditions [1]. The World Health Organization
established health regulation (IHR) (2005) which require that all
countries have the capacity to detect, assess, report and respond to
potential threats that is detection of potential threats through
surveillance, laboratory and decision-making systems in health
emergencies public and reporting specific diseases and any potential
international health emergencies and responding to public health events
[11]. Today's highly mobile, interdependent and interconnected world
offers countless opportunities for the rapid spread of diseases. In
particular, diseases that may turn into a pandemic that have made
cholera, meningococcal diseases and yellow ever a very real and
worrisome societal realm, making the urgent need for renewed
surveillance efforts to prevent and control. Communicable diseases have
aroused great international and new scientific challenges causing great
human suffering and enormous economic damage [13]. It is important
that all countries have the ability to detect and evaluate communicable
diseases and respond to health events. Then they will be able to contain
the spread of diseases within borders (foe each country without causing
any an outbreak) thereby reducing the global spread of diseases [2]. This
leads to the realization of the World Health Organization's vision of

7
international public health, ie a safer world of communicable diseases,
alert and ready to respond collectively to the threat of epidemics and
other health emergencies that pose a serious threat to public health
security. Through the formulation of a global alert and response system
based on partnership, quality and transparency [13].
2.4. Factors affecting the outbreak of communicable diseases:
Increased number of infectious diseases types are directly or indirectly
associated with a range of variables. Vulnerability refers to the ability of
a state to limit the spread of outbreaks. The most affected countries
have sufficient capacity to reduce, monitor and respond to the spread of
diseases while the most resistant countries have the great capacity to do
that while it may not be possible to prevent the first case(s) of a disease
completely [6]. The maim four factors contributing to the spread of
communicable diseases in any community were identified as follows:
- Demographic factors:
The spread of various infectious diseases, new and old increasing
the impact of demographic, environmental, technological and
other rapid changes in the human environment.
- Health factors:
Strong public health systems are in place to ensure the ability of a
country to prevent, monitor and respond effectively to outbreaks
of communicable diseases. They also reflect the ability of a
government to deliver key healthy services such as vaccines and
the proportion of people who benefit from clean water and
improved health facilities to what extent communities can prevent
[6].
- Economic factors:
It is known that the impact of infectious diseases is greater among
the poorest segments due to many considerations which are the
lack of food, medicine and the disorders in the communities [14].
- Political factors:
For local considerations of political factors that affecting the
spread of communicable diseases, safety and strong funding are
among the most indicators that make work within the health

8
organization to provide primary health care and urgent and
emergency health services that are needed in communicable
diseases emergencies. In addition to domestic consideration,
international political factors affect a country's ability to resist the
spread of infectious diseases. Continued support from both
bilateral donors and international organizations can help
strengthening the health system of a country and provide the
necessary funding, expertise and staff to prepare for respond to
health crises [6].
Through the past few decades, The Eastern Mediterranean has
been one of the regions of the world damaged deeply by war and
political instability. The ongoing conflict and destruction have left
the region plagued by countless health fears that have claimed
many lives. War and chaos often provide the optimal conditions
for the growth and re-emergence of infectious diseases [15].Once
an emergency is confirmed, there must be a rapid and
comprehensive response to the control of infectious diseases. A
camp should have established (to prevent outbreaks, minimize
casualties) and manage the disease quickly. The total objectives
are rapid assessment, prevention, surveillance, disease control
and disease management [8]. Many of the major determinants of
health and the cause of infectious diseases fall outside the direct
control of the health sector. Other sectors involved are those
dealing with sanitation, water supply, environmental change,
climate, education, agriculture, trade tourism, transport, industrial
development and housing [11].
2.5. The status of communicable diseases in Syria:
The directorate of communicable diseases at the Syrian Ministry
of Health has identified the communicable diseases groups
according to World Health Organization announcements and
successive updates through specific groups that are directly
reported as soon as they are suspected (immediately reported).
This is done through the Early warning and Rapid Response
Program through a system set up in collaboration between the
Syrian Ministry of Health and The World Health Organization

9
which is a system for reporting a priority group of communicable
and vaccine-related diseases. Achieving an effective response to
the surveillance system is directly of priority diseases and
surveillance of suspected cases based on standard definition [16],
a part from direct war losses, the Syrian crisis that has engulfed
since 2011 the country has caused many casualties due to
preventable basic health care problems. Hospitals and
ambulances were frequent targets for rockets and explosions
which leading to the collapse of any previously existing health care
infrastructure. More than 700 medical workers have been killed
since the war began in 2011, and more than 60 health care
facilities were distorted last year alone. Internally displaces to safe
areas within the country from who moved to neighboring
countries were forced to live in poor living conditions with limited
access to basic sanitation and health care in the troubled areas of
the country [15]. The epidemic threats and major faced by the
displaced population after an emergency are the greatest
challenge for any government facing similar circumstances as Syria
has experienced in previous year. Resettlement in temporary
location such as refugee camps may involve high population
density, inadequate shelter, poor water and sanitation, this lack of
basic health care poses an integrated threat of further infectious
diseases among the population and a high risk of an epidemic
[17]. In 2017 (74) cases of polio virus derived from type 2 vaccines
were confirmed in the north-east of Syria (in Deir Ezzor, Raqqa
and Homs) The first case was discovered on 3 March, while the
last case was recorded in September 2017 [18].
2.6 Statistical analysis:
To study the spatial distribution of recorded infections from
communicable diseases, the descriptive analytical method was
applied using Spss25 by:
- Use cluster analysis (Hierarchical clustering Analysis) to get the
results of a compilation of the 21 cases of communicable diseases
approver by the Syrian Ministry of Health in accordance with the
plans agreed upon the World Health Organization. The complete

11
linkage method also called the farthest neighbor method was
selected as one of the sequential cluster analysis methods in order
to classify the Syria governorates in terms of the number of
infectious diseases.
- The use of discriminatory analysis because it depends on the
distinction between two or more group which are similar in many
characteristics on the basis of several variables through the use of
the distinctive function. This is achieved in the concept of dealing
with the number of cases of communicable diseases in question
which are similar in the origin of the diseases, methods of
infection, and the way of spreading and responding to the
outbreak in any society. But they differ in terms of the pathogen
factor, the appropriate medications and some specific details of
each particular infectious disease.
ـــــــــــــــــــــــــــــــــــــــــــــــــــــــــــــــــــــــــــــــــــــــــــــــــــــــــــــــــــــــــــــــــــــــ
3.Results and discussions:
3.1 cluster analysis of infectious diseases number:
The directorate of communicable diseases data showed the number
of infectious diseases reported in the year 2001-2017 for the purpose
of classifying the Syrian governorates according to similar clusters of
the number of suspected and confirmed infections from
communicable diseases. Therefore, the governorates were classified
based on data from the directorate of communicable diseases at the
Syrian Ministry of Health as in the following table:
Table (1): The main groups (groups) for communicable diseases in the Syrian Ministry of Health.
Details Group number Details Group number
Mumps 21 Flaccid paralysis 2
Tetanus electrophoresis 21 Neonatal tetanus 1
Cutaneous leishmamiasis 21 Meningitis 1
Visceral leishmaniasis 21 Summer epidemic diarrhea 1
Schistosomiasis 21 Malaria 1
Brucellosis 21 Tuberculosis 1
Typhoid fever 21 Measles 1
Dog 21 Whooping cough 1
Flu 12 Diphtheria 1
Acute diarrhea 12 Hepatitis 22
Rubella 22
Source: communicable diseases director, Syrian Ministry of Health
11
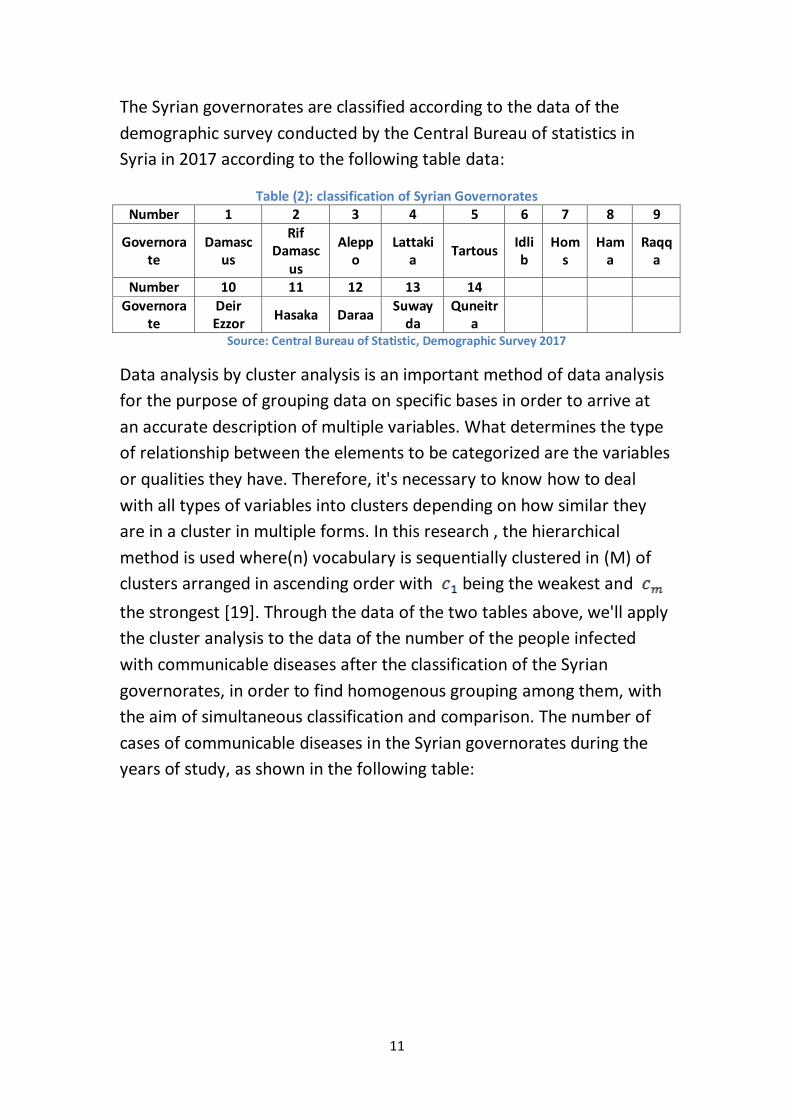
The Syrian governorates are classified according to the data of the
demographic survey conducted by the Central Bureau of statistics in
Syria in 2017 according to the following table data:
Table (2): classification of Syrian Governorates
1 1 1 1 1 1 1 1 2 Number
Raqqa
Hama
Homs
Idlib
Tartous Lattaki
a
Aleppo
Rif Damasc
us
Damascus
Governorate
21 21 21 22 22 Number
Quneitr
a
Suwayda
Daraa Hasaka Deir Ezzor
Governorate
Source: Central Bureau of Statistic, Demographic Survey 2017
Data analysis by cluster analysis is an important method of data analysis
for the purpose of grouping data on specific bases in order to arrive at
an accurate description of multiple variables. What determines the type
of relationship between the elements to be categorized are the variables
or qualities they have. Therefore, it's necessary to know how to deal
with all types of variables into clusters depending on how similar they
are in a cluster in multiple forms. In this research , the hierarchical
method is used where(n) vocabulary is sequentially clustered in (M) of
clusters arranged in ascending order with being the weakest and
the strongest [19]. Through the data of the two tables above, we'll apply
the cluster analysis to the data of the number of the people infected
with communicable diseases after the classification of the Syrian
governorates, in order to find homogenous grouping among them, with
the aim of simultaneous classification and comparison. The number of
cases of communicable diseases in the Syrian governorates during the
years of study, as shown in the following table:

12
Table(3): Number of Infectious Diseases in the Syrian Governorates2001-2017
Diseases
Governorate
103 4385 0 62 551 9099 0 0 830 0 211 2
124 3662 1 79 743 3944 0 0 1308 2 300 1
47 7677 0 602 1225 10535 0 0 592 31 394 1
73 6374 0 118 234 2010 0 0 170 0 185 1
99 7167 0 73 298 1351 0 0 251 1 126 1
9 2161 0 213 347 1605 0 0 355 2 199 1
52 7116 0 209 1097 2211 0 0 474 8 299 1
127 15798 0 25 581 2082 0 0 520 5 273 1
39 3366 0 373 452 2037 3 0 326 3 107 1
19 366 0 129 275 1674 0 0 374 5 277 22
47 2216 0 909 1567 2789 76 0 187 34 155 22
21 892 0 145 395 594 0 0 431 1 132 21
25 136 0 7 316 360 0 0 110 0 61 21
30 456 0 51 168 293 0 0 37 0 40 21
Diseases
Governorate
151472 32591 2 881 26836 0 62 12972 0 5236 2
387924 801816 6 7880 32201 0 0 20830 5 8856 1
176134 68562 8 6456 32143 0 45 214398 13 5063 1
145076 432112 0 1564 1791 0 91 24915 1 1835 1
192767 256734 2 2419 2282 0 47 28187 1 2723 1
43741 32124 5 4279 7628 0 125 89266 0 1678 1
104400 293743 10 4219 14445 0 14 8497 4 3919 1
131821 128029 6 6079 33974 5 13 75967 4 3594 1
55204 75503 1 4030 40970 22 1 6385 0 1013 1
30728 37250 5 540 7124 3 19 16239 0 549 22
207504 134290 4 3660 42999 0 0 96415 3 3552 22
41071 49951 3 5371 10646 0 9 904 0 2168 21
26185 39396 1 350 3551 0 3 619 0 147 21
23663 63370 1 419 2301 0 0 175 0 1348 21
Source: Researches calculations based on data from the directorate of communicable diseases in Syria during the study years.
Cluster analysis was used to find the relationship between the governorates based on similarity measures used, evident through the kinship matrix through which the similarity is determined or not between governorates, expressed based on the distanced derived between each province with the other governorates. The results of the cluster analysis will be presented in the following sequence by using the data of table (1) and (2) based on the data of table (3). The cluster analysis has been limited to the overall linkage method as shown in table below:

13
Table (4) : Agglomeration Schedule
Stage
Cluster Combined
Coefficients Next Stage Cluster 1 Cluster 2
1 7 14 .031 2
2 4 7 .090 3
3 2 4 .293 9
4 5 13 .311 6
5 8 10 .530 8
6 5 12 .716 9
7 3 6 1.327 13
8 8 11 1.460 11
9 2 5 1.959 10
10 2 9 3.984 11
11 2 8 5.923 12
12 1 2 13.768 13
13 1 3 18.650 0
Source: prepared by researchers using spss25
It is clear from the previous table that governorates of Homs and
Quintieri were linked together as the distance between them (0.31) is
the smallest possible, which is measured in term of Euclidean square and
the second step is the next stage from which Homs Governorate will be
formed with the first step with Aleppo Governorate. The linking process
continues to reach the rest of the groups where the largest distance was
the last step which reached (18.650) where in this step was linked to the
provinces of Damascus and Aleppo. The order of the governorates was
represented by the shape of the tree represented by the following:

14
source: prepared by researchers using Spss25
It is clear from the previous figure that the number of clusters is 3 and
the number of governorates in each cluster is shown as in the following
table:
Table( 5) : Number of governorates in each cluster
1
11
2
140111
10111
1
2 Cluster
3
Valid Missing
Source: prepared by researchers using Spss25
The result of the previous table indicates that the total classification of
the Syrian governorates where one governorate was classified in the first
cluster cases ( governorates with low incidence of communicable
diseases ) which was Damascus Governorate , 11 cases in the second
cluster ( governorates with moderate incidence of communicable
Figure (1): The tree of the comprehensive linking method for the governorates

15
diseases ) which were ( Rif Damascus , Lattakia, Tartous, Homs, Raqqa,
Deir Ezzor, Hasaka , Daraa, Sweida and Quneitra) and two cases in the
governorates of Aleppo and Idlib. This means that there is no
homogeneity among the Syrian governorates in terms of the number of
infectious diseases, thus accepting the first hypothesis.
2.3 Study the assumptions necessary to apply discriminatory analysis:
The method of discriminatory analysis relies on the separation of
societies. Information on two or more communities is similar in
character but quantitatively separate. Assuming that are (m) random
samples from communities of different size (
These categorizable data can be placed in a table in this figure [20]:
Figure (2): classifiable vocabulary data using the discriminatory analysis function
Source: Jaouni and Ghanem
The characteristic function was based on several variables (the number
of infectious diseases in the Syrian governorates) which were collected
from each governorate during the study years from 2001-2017. These
groups derived from cluster analysis were used in the discriminatory
analysis in the cases of two groups:

16
1- The dependent variable representing the state of the governorate (1
represents the first cluster governorates with low number of
communicable diseases, 2 represents the second cluster governorates
with moderate number of communicable diseases, 3 represents the
third cluster governorate with high number of communicable diseases).
2-The Independent variables were represented by groups of
communicable diseases which were:
(flaccid paralysis, neonatal tetanus, meningitis, summer epidemic
diarrhea, malaria, tuberculosis, measles, whooping cough, diphtheria,
hepatitis, rubella, mumps, tetanus, cutaneous leishmaniasis, visceral
leishmaniasis, schistosomiasis, brucellosis, typhoid fever, Dog, flu and
acute diarrhea)
4.2. Normal distribution test:
The statistical test of the natural distribution didn't give us positive
result but the group of the study consist of 21 diseases in 14
governorates during the study period from 2001-2017, and based on the
law of large number we can consider that the variables of the study
subject to the normal distribution [21]
5.2. Homogenization condition:
To determine the extent of data homogeneity for each of the
independent variables, we used the (Box's M) and found that
homogeneity condition of the variables was met.
Table (7): Test for Homogeneity of Contrast and Contrast
Average Linkage (Between
Groups) Rank Log Determinant
Pooled within-groups 11 89.454
The ranks and natural logarithms of determinants printed are those of the group covariance matrices. Source: prepared by researchers using Spss25
The Log Determinant value of the independent variable levels grouped
into three groups, so that whenever the value of specified logarithm is
larger than the matrix of that group differs from the rest and it shows

17
clearly. Therefore, the second group (the second cluster where the
average number of infections) where the most dependent variables have
accumulated (s). The following table shows the value of Box's M test for
equality in covariance matrices, which shows the functions of
discriminatory functions. The values of Log Determinants equal to all
groups assumes that matrices are homogenous for common variations
[22].
Table (8): Box's M
Average Linkage
(Between Groups) Rank
Log
Determinant
1 0** .00
2 2 -.332-
3 1 .614*
Source: prepared by researchers using Spss25
Considering the difference of the groups through the differential
functions and the value of Log Determinants in the three group and
zero-hypothesis test for variance matrices are equal to basic
discriminatory function. This indicates homogeneity and no differences,
so two tables are treated jointly to test for homogeneity.
6.3. Test for no self-correlation between independent variables:
The correlation matrix between independent variables shows that self-correlation between most independent variables is weak and this increase the discriminatory ability of the variables. 7.3. Test the significance of variables in discriminatory function: The mean of the variables in the groups were calculated as shown in the following table: Table (9): Arithmetic averages numbers of infectious diseases for three groups
601 4385 0 62 551 9099 0 0 830 2 211 First
group
6.914
4322.64
0.09 192.5
5 556.9
1 1758.6
4 7.1
8 0 380.73
7.45
177.73 Secon
d
group
82 4919 0 407.5 786 6070 0 0 473.5 4 296.5 Third
group
151472 32591 2 881 26836 0 62 12972 0 5236 First
group
122394
.8 210199
.5 3.55 3321
17480.36
2.73
17.91
25375.73
1.64
2700.36
Secon
d
group
109937
.5 50343 6.5
5367.5
19885.5
0 85 151832 6.5 3370.5 Third
group
Source: prepared by researchers using Spss25

18
We note from the previous table that the highest value of the mean in
the provinces for three groups was in the influenza group, where it
reached 2010199.5 in the second group. The lowest means was in the
diphtheria group where it was 0.09 in the second group too (excluding
zero values). The F test for each variable in the linear function is shown
as in the following table:
Table 10: F test for each variable in the linear function.
Wilks' Lambda F df1 df2 Sig.
Hepatitis .997 .031 1 12 .863
Rubella .898 1.365 1 12 .025
Mumps .995 .062 1 12 .807
Tetanus
electrophoresis
.745 4.098 1 12 .066
Cutaneous
leishmamiasis
.395 18.391 1 12 .001
Visceral
leishmaniasis
.649 6.483 1 12 .026
Schistosomiasis .976 .290 1 12 .600
Brucellosis .999 .017 1 12 .897
Typhoid fever .891 1.472 1 12 .248
Dog .857 2.008 1 12 .182
Flu .941 .753 1 12 .040
Acute diarrhea .997 .035 1 12 .005
Flaccid paralysis .829 2.481 1 12 .141
Neonatal tetanus .991 .114 1 12 .742
Meningitis .996 .045 1 12 .005
Summer epidemic
diarrhea
.a
Malaria .986 .169 1 12 .008
Tuberculosis .812 2.783 1 12 .012
Measles .961 .486 1 12 .499
Whooping cough .897 1.382 1 12 .263
Diphtheria .987 .156 1 12 . 007 a. Cannot be computed because this variable is a constant.
Source: prepared by researchers using Spss25
In order to the test the significance of all the variables to see the importance of each variable in the discriminatory function and the extent of the impact on the results using unilateral variation. The above table shows that the variables (influenza), (acute diarrhea) are

19
significant and have significant effect in terms of differentiation between groups, followed by variables (meningitis), (diphtheria),
(malaria), (rubella), (tuberculosis), (visceral leishmaniasis) and
(cutaneous leishmaniasis) while the other variables have no
significance effect.
The results of the significance test of the distinctive effect. The result of the significance test of the distinctive values and the strength of the legal relationship
(Legal discriminatory analysis) are shown in the following table:
Table 11: Eigenvalues
Function Eigenvalue % of Variance Cumulative %
Canonical
Correlation
1 19.605a 81.5 81.5 .975
2 4.462a 18.5 100.0 .904
a. First 2 canonical discriminant functions were used in the analysis.
Source: prepared by researchers using Spss25
The value of the Eigenvalues of the first model /19.605/ which is greater
than 1, it indicates that the discriminatory function has a great ability to
distinguish and explains 81.5% of the total value of the variance
between the groups of the incidence of communicable diseases under
study. The value of the Eigenvalues of the second model4.462 and
explains the value of 18.5% of the total value of the variation between
groups of the number of infectious diseases under study. As for the
correlation coefficient, its value for the first model 0.975 and 0.904
which are high values for both models and thus are important
discriminatory function, the percentages of change in the dependent
variables were 97.5% and 90.4% in both models, the remaining of the
variance were 2.5% and 9.6% that due to differences between groups.
21
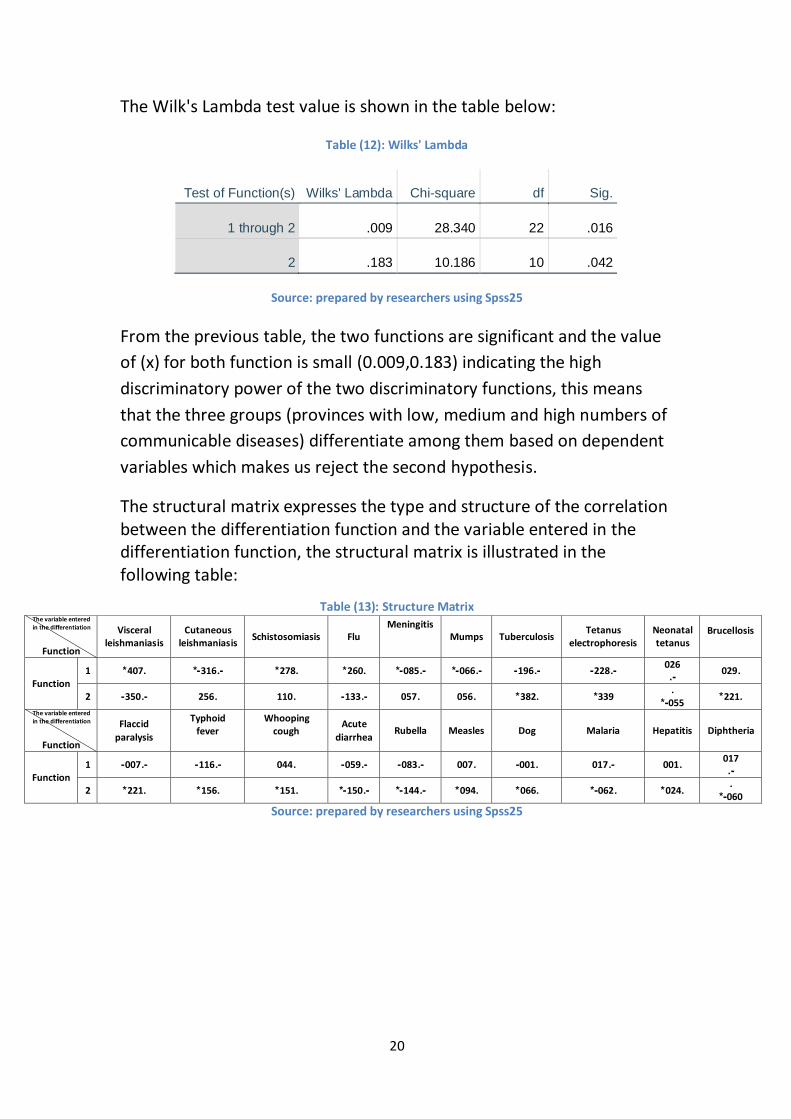
The Wilk's Lambda test value is shown in the table below:
Table (12): Wilks' Lambda
Test of Function(s) Wilks' Lambda Chi-square df Sig.
1 through 2 .009 28.340 22 .016
2 .183 10.186 10 .042
Source: prepared by researchers using Spss25
From the previous table, the two functions are significant and the value
of (x) for both function is small (0.009,0.183) indicating the high
discriminatory power of the two discriminatory functions, this means
that the three groups (provinces with low, medium and high numbers of
communicable diseases) differentiate among them based on dependent
variables which makes us reject the second hypothesis.
The structural matrix expresses the type and structure of the correlation between the differentiation function and the variable entered in the differentiation function, the structural matrix is illustrated in the following table:
Structure Matrix Table (13):
Brucellosis
Neonatal tetanus
Tetanus electrophoresis
Tuberculosis Mumps
Meningitis
Flu Schistosomiasis Cutaneous
leishmaniasis
Visceral leishmaniasis
The variable entered in the differentiation
Function
9211 211
-9 -9111- -9211- -9211-* -9211-* 9112* 9111* -9121-* 9121* 2
Function
9112* 9
211-* 111* 9111* 9211 9211 -9211- 9222 9111 -9112- 1
Diphtheria Hepatitis Malaria Dog Measles Rubella Acute
diarrhea
Whooping cough
Typhoid fever
Flaccid
paralysis
The variable entered in the differentiation
Function
221
-9 9222 -9221 9222- 9221 -9211- -9211- 9211 -9221- -9221- 2
Function 9
212-* 9211* 9211-* 9211* 9211* -9211-* -9212-* 9212* 9211* 9112* 1
Source: prepared by researchers using Spss25

21
The results of the previous table (13) can be explained by the following table:
Table (14): Interpretation of the results of the structural matrix table
The variables aren't including in the
analysis
Function
1 2
There is a positive correlation of 0.057%between the function and the
variable
There is a positive correlation of 2.6%between the function and the
variable
There is a positive correlation of 0.056%between the function and the
variable
There is a positive correlation of 1.7%between the function and the
variable
There is a positive correlation of 0.382%between the function and the
variable
There is a positive correlation of 4.4%between the function and the
variable
There is a positive correlation of 0.221%between the function and the
variable
There is a positive correlation of 1.7%between the function and the
variable
There is a positive correlation of 2.4%between the function and the
variable
There is a positive correlation of 0.01%between the function and the
variable
There is a positive correlation of 0.151%between the function and the
variable
There is a negative correlation of 8.5%between the function and the
variable
There is a positive correlation of 0.094%between the function and the
variable
There is a negative correlation of 6.6%between the function and the
variable
There is a negative correlation of 0.144%between the function and the
variable
There is a negative correlation of 19.6%between the function and the
variable
There is a negative correlation of 0.062%between the function and the
variable
There is a negative correlation of 0.07%between the function and the
variable
There is a negative correlation of 0.060%between the function and the
variable
There is a negative correlation of 8.3%between the function and the
variable
There is a negative correlation of 0.055%between the function and the
variable
There is a negative correlation of 0.07%between the function and the
variable
Source: prepared by researchers using Spss25

22
As for the coefficients standard characteristic function are as shown in the following table:
Table (15) : Standardized Canonical Discriminant Function Coefficients Flaccid paralysis
Neonatal tetanus
Meningitis
Malaria
Tuberculosis
Measles
Whooping cough
Diphtheria
Hepatitis
Rubella
Mumps
1.666
-.369-
-3.747-
-2.44
4- -1.945-
-.053-
3.236 4.845 2.008 -
1.374-
-.385
- 1
Function
-.766-
0.283 -.647- 2.21
5 1.858
-3.10
6- -.743- 1.352 4.458
-5.93
3-
3.083
2
Source: prepared by researchers using Spss25
From the preceding table which preceding table which expresses diphtheria the most important in the differentiation analysis
function in the first model , while the variable that expresses
hepatitis is the most important in the differentiation analysis function in the second model
- Classification function equations:
During the data of table 15 we concluded the classification of observations in the sample studies.
Classification Function Coefficients Table (16):
1 2 3
Flaccid paralysis -.022- .238 .203
Neonatal
tetanus
-.701- -1.189- -1.073-
Meningitis .205 .036 .021
Malaria .874 -.937- -.428-
Tuberculosis .006 -.008- -.004-
Measles .026 .031 -.006-
Whooping cough -.127- .065 .054
Diphtheria -307.400- -56.531- -25.349-
Hepatitis -.017- -.011- -.006-
Rubella 1.818 1.446 .621
Mumps -.007- -.011- -.004-
(Constant) -152.005- -30.541- -17.923- Fisher's linear discriminant functions
Source: prepared by researchers using Spss25
1- Classification function where the governorate has low incidence of communicable diseases (first group):

23
2- Classification function where the governorate has moderate incidence of communicable diseases (second group):
3- Classification function where the governorate has high incidence of communicable diseases (third group):
Based on the results of the previous three equations, we calculate the
discriminatory score for each of the observations in the studied sample and make the decision for the group which this particular view belongs
by determining the highest discriminatory score.
4.3. Classification Result:
Table (17): Classification Results
Average Linkage
(Between Groups)
Predicted Group Membership
Total 1 2 3
Original Count 1 0 0 1 1
2 0 6 5 11
3 0 0 2 2
% 1 .0 .0 100.0 100.0
2 .0 54.5 45.5 100.0
3 .0 .0 100.0 100.0 a. 57.1% of original grouped cases correctly classified.
Source: prepared by researchers using Spss25
The table shows that results of the classification where the elements of the main country of the table for the cases classified correctly. One of the provinces with low infection number is one where they are all rated 100% as is the case in medium infection number of all province where they are rated 100%. The same thing in the provinces with high infection number are two where they are rated 100%.

24
5.3. Calculation of centers of group centroids:
After the classification process we have three sub-groups and each group has a centroid. The following table shows functions at group centroids in discriminatory analysis of three sub-group.
Functions at Group Centroids Table (18):
Average Linkage (Between Groups)
Function
1 2
1 -14.144- .208
2 1.035 -.844-
3 1.382 4.539 Unstandardized canonical discriminant functions evaluated at group means
Source: prepared by researchers using Spss25
The values in the previous table express the functions of group concentration. These values are located in different directions and determine the distance between each of the two values as a whole (21). Depending on the Spss25 program to calculate the distance mentioned, the following figure shows the distribution of infectious diseases in the Syrian governorates during the study years according to the two discriminator analysis function where the first discrimination function is the horizontal axis and the second discrimination function is the vertical axis.
Figure (3): The distribution of infectious diseases in the Syrian governorates during the years of study according to the functions of discrimination at the group
centers.
Source: prepared by researchers using Spss25
ــــــــــــــــــــــــــــــــــــــــــــــــــــــــــــــــــــــــــــــــــــــــــــــــــــــــــــــــــــــــــــــــــــــــــــــــــ

25
Conclusions:
The number of infectious diseases in the Syrian governorates showed no homogeneity during the years of research to be distributed among three clusters ( the first cluster with low injuries numbers , the second cluster with moderate injuries numbers , and the third cluster with high injuries numbers) .The results of the use of cluster analysis have been characterized by a comprehensive linking method that the second cluster with medium number of injuries has been collected by the largest number of Syrian governorates where it reached 11 governorates and this is in line with the average levels of infectious diseases , due to the high level of health care and awareness in people . Although the years of study include the period of unrest in Syria and the declined of the state of health services in some provinces with security and health situation. The results of the analysis show that the group of special numbers of diphtheria is the most important in the differentiation analysis function in the first model, while the group of numbers for hepatitis is the most important in the function of analysis of differentiation in the second model. Thus, the three groups (low, moderate and high injuries) differentiation among them based on the variables included in the analysis according to two major distinctions, confirming that the fourteen Syrian governorates have been correctly classified according to each group which they belong.
ــــــــــــــــــــــــــــــــــــــــــــــــــــــــــــــــــــــــــــــــــــــــــــــــــــــــــــــــــــــــــــــــــــــــــــــــــ
Acknowledgment:
The authors thank the doctors who are working in the Director of
Communicable Diseases in the Syrian Ministry of Health for their
assistance in providing the data, Dr. Hazem Abdo, Dr. Rania Hassan of
Tartous University in Syria and Engineer Ahmad Moharm in Egypt in
preparing the research.
ــــــــــــــــــــــــــــــــــــــــــــــــــــــــــــــــــــــــــــــــــــــــــــــــــــــــــــــــــــــــــــــــــــــــــــــــــ

26
References:
[1 ] B. Markoski و T. Melovska ،"Geographical distribution of diseases in the world تأليف "،
the 5th Congress of the Ecologists of Macedonia, with international participation (Ohrid, 19th—22nd October 2016) Special issues of the Macedonian Ecological Society ،
Macedonia ،1221 9
[2 ] Centers for Disease Control and Prevention (CDC) ،Principles of Epidemiology in Public Health Practice An Introduction to Applied Epidemiology and Biostatistics المجلد ،Third Edition ،Atlanta: U.S. DEPARTMENT OF HEALTH AND HUMAN SERVICES ،1222 ، p. 52.
[3 ] F. El Allaki ،. M. Bigras-Poulin ،P. Michel و 9 A. Ravel ،"A Population Health Surveillance Theory "،Epidemiology and Health رقم ، volume 34 ،p. 2 ،1 november 2012.
[4 ] A. Dalvi و J. Braga " ، Spatial diffusion of the 2015–2016 Zika, dengue and chikungunya epidemics in Rio de Janeiro Municipality, Brazil "،Epidemiology and Infection رقم ،
e237, 1–13 ،pp. 2-9 ،1221 9
[5 ] H. Ziadi and h. Hussein, “Spatial Variability of Communicable Diseases in the Souq Al-Shuyoukh District for the Period 2004-2010,” Thi-Qar University Journal, No. 2, pp. 79-93, March 2013.
[6 ] 9 M. Melina, B. Gelfeld, A. Okunogbe and C. Paul, Identifying Future Areas Most Vulnerable to Infectious Disease Exposure Index, Santa Monica, CA: NATIONAL DEFENSE RESEARCH INSTITUTE, 2016, p. 9.
[7 ] G. Shannan ،"Communicable diseases in the Mediterranean region "،The journal of the international federation of clinical chemistry and laboratory medicine ،p. 156 ،1 Novmber 2018.
[8 ] J. AMELI ،Communicable Diseases and Outbreak Control ،Department of Emergency Medicine, The Warren Alpert Medical School of Brown University ،1221 9
[9 ] F. Faruque ،A. Bhuiyan ،M. Kanu و 9 B. Brackin ،Infections And Communicable Diseases Mississppi ،Mississppi ،1221 ، pp. 2-3.
[11 ] L. Nguyen ،Health Implications of INFECTIOUS DISEASES DUE TO CLIMATE CHANGE A CASE STUDY OF HO CHI MINH CITY ،Thesis presented in part-fulfilment of the degree of Master of Science in accordance ،1222 ، p. 5.
[11 ] "World Health Organization - Regional Office for the Eastern Mediterranean," 2005. [Related]. Available: http://www.emro.who.int/en/health-topics/infectious-diseases/index.html. [Date of arrival 18 10 2019].
[12 ] J. A. Patz ،A. K. Githeko ،. J. P. McCarty ،S. Hussein ،U. Confalonieri و N. de Wet ،"Climate change and infectious diseases "،1222 9
[13 ] Y.-C. Lo ،"Implementation of the IHR Joint External Evaluation: Taiwan’s Experiences "،
27
Health Security رقم ، Number 2 ،p. 132 ،1221 9
[14 ] WHO-Regional Office for the Eastern Mediterranean, 2012. [Connected]. Available: http://www.emro.who.int/en/annual-report/2012/communicable-diseases.html. [Date of arrival 6 10 2019].
[15 ] R. Raslan ،s. El sayegh ،s. Chams ،n. Chams ،a. Lone و i. Hussein ،"RaslanRe-Emerging VaccinePreventable Diseases in "،Front. Public Health, number5, p: 1-7 ،1221 9
[16] Syrian Ministry of Health, 2014. [Connected]. Available: http://www.moh.gov.sy/Default.aspx?tabid=453&language=en-YE. [Date of arrival 6 10 2019].
[17 ] World Health Organization ،COMMUNICABLE DISEASE PROFILE ،geneva ،1222 ، p. 2.
[18 ] World Health Organization, WHO's work in the Eastern Mediterranean Region, Annual Report of the Regional Director, Cairo: World Health Organization, 2017, pp. 29-31.
[19 ] N. Mustafa, “The Use of Some Methods of Cluster Analysis in Classification with the Application of Action +,” Technical Journal, Volume 20, No. 2, pp. 2-4, 2007.
[21 ] A. Ghanem and F. Al-Jaouni, “Multivariate Statistical Analysis (Discriminatory Analysis): Structure in the Characterization and Distribution of Households within the Socio-Economic Society,” Damascus University Journal of Economic and Legal Sciences, Vol. 2, p. 316, 2007.
[21 ] I. Ali and Y. Alloush, Strategic Planning for Small Projects and Their Role in Economic and Social Development in Syria, Lattakia: Tishreen University, 2018, p. 124.
[22 ] M. Al-Bayati, Analysis of Statistical Data Using SPSS Statistical Program, Amman: Dar Al-Hamed, 2005.
[23 ] y.-. c. Lo ،"Implementation of the IHR Joint External Evaluation: Taiwan 's experirences "،Health Security ، number 2 ،p. 132 ،1221 9
[24 ] J. AMELI ،"Communicable Diseases and Outbreak Control "،Emergency Medicine Association of Turkey ،p. 21.
[25 ] A. Al Zayed, LLC Physics, p. Type, p. Night, a. Kandil, M. Bo Talib and F. Al-Manawer, “Problems of Social Policy in Risk Management in GCC Countries,” Social Studies Series, p. 10, 2013.