the use of montecarlo radiation transport codes in radiation physics
TRANSCRIPT

The use of The use of MonteCarloMonteCarlo radiation radiation transport codes in radiation physics transport codes in radiation physics and and dosimetrydosimetry: part II, modeling of : part II, modeling of nuclear reactions nuclear reactions
Alfredo FerrariCERN, Geneva Switzerland
CERN, 28 June 2006
Alfredo Ferrari, AT 28 June 2006 2
Disclaimer:
A significant fraction of the examples presented in this lectureis based on the work of many colleagues: in particular
F.Ballarini, G.Battistoni, M.Brugger, F.Cerutti, R.Engel, A.Fassò, M.V.Garzelli, K.Parodi, M.Pelliccioni, J.Ranft,
S.Roesler, P.R.Sala, F.Sommerer, V.Vlachoudis,and many others, mostly but not only from the FLUKA collaboration
Most of the examples presented have been obtained with the FLUKAcode, the speaker is one of the authors of, which is the tool used at
CERN for most radioprotection/dosimetry calculationsThey are representative of state-of-the-art nuclear models and should
give a reasonable insight into the underlying physics concepts

Alfredo Ferrari, AT 28 June 2006 3
OutlineIntroduction
Hadronic physics vs MonteCarloNuclear interaction vs dosimetry and radiation protection
Nuclear interactions in briefHadron-Nucleon & Hadron-NucleusNucleus-NucleusReal and Virtual Photonuclear interactions
Examples of applicationsActivity and residual dose rate predictionsCosmic rays, commercial flights and missions to MARS Hadrotherapy applications
Info: http://www.fluka.org

Alfredo Ferrari, AT 28 June 2006 4
HEP Hadronic MC applications:
Applications to Medicine/radiobiology are growing, thanks toMixed field capability, including ion transport and interactionsAccuracyReliability
MC simulations are a well established tool in HEP for:• Particle physics: calorimetry, tracking and detector simulation • Accelerator design (→ LHC systems)• Radiation protection (shielding, activation, … )• Dosimetry• Cosmic ray physics
They are also used for:Neutronics simulationsADS (Accelerator Driven Systems)

Alfredo Ferrari, AT 28 June 2006 5
Inelastic hN interactionsIntermediate EnergiesIntermediate Energies
N1 + N2 → N1’ + N2’ + π threshold around 290 MeVimportant above 700 MeV
π + N → π’ + π” + N’ opens at 170 MeV
Dominance of the Δ(1232) resonance and of the N* resonances →reactions treated in the framework of the isobar model → all reactions proceed through an intermediate state containing at least one resonanceResonance energies, widths, cross sections, branching ratios from data and conservation laws, whenever possible
High Energies: Dual Parton Model/Quark Gluon String Model etcHigh Energies: Dual Parton Model/Quark Gluon String Model etcInteracting strings (quarks held together by the gluon-gluon interaction into the form of a string)Interactions treated in the Reggeon-Pomeron frameworkeach of the two hadrons splits into 2 colored partons →combination into 2 colourless chains → 2 back-to-back jetseach jet is then hadronized into physical hadrons
Alfredo Ferrari, AT 28 June 2006 6
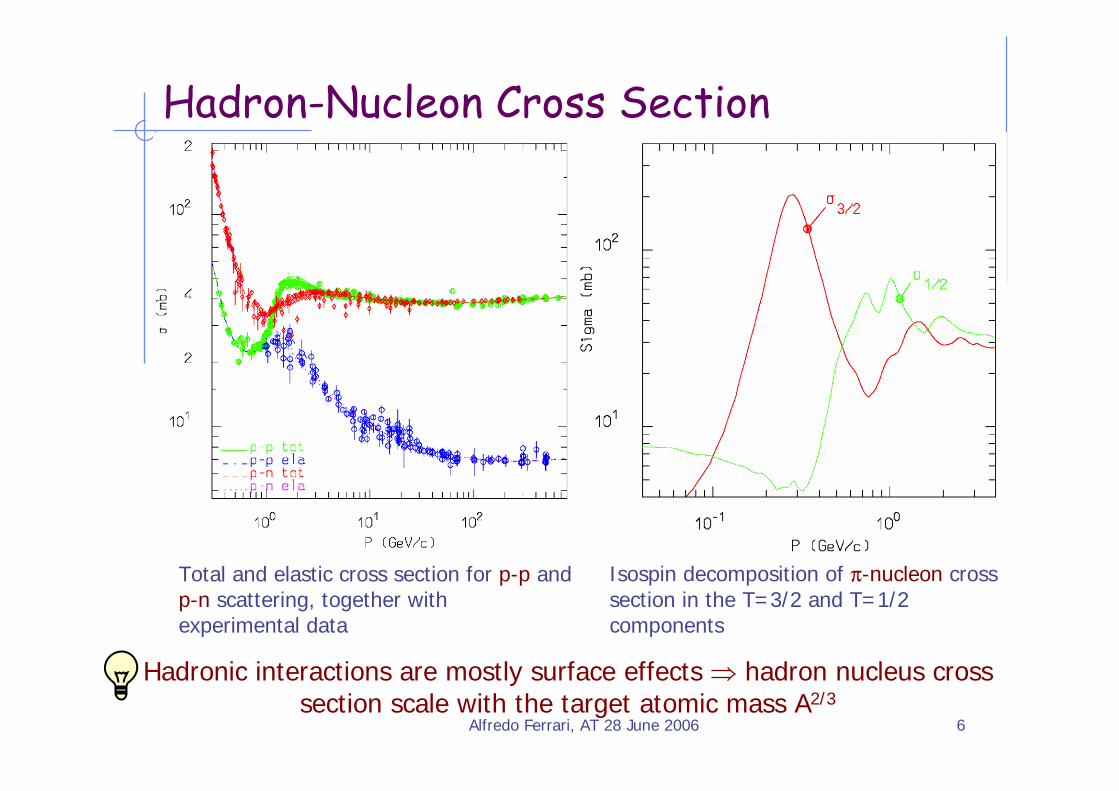
Hadron-Nucleon Cross Section
Total and elastic cross section for p-p and p-n scattering, together with experimental data
Isospin decomposition of π-nucleon cross section in the T=3/2 and T=1/2 components
Hadronic interactions are mostly surface effects ⇒ hadron nucleus cross section scale with the target atomic mass A2/3

Alfredo Ferrari, AT 28 June 2006 7
Inelastic hN at high energies ( DPM )
Reggeon exchange
Pomeron exchange
Parton and color concepts, Topological expansion of QCD, Duality
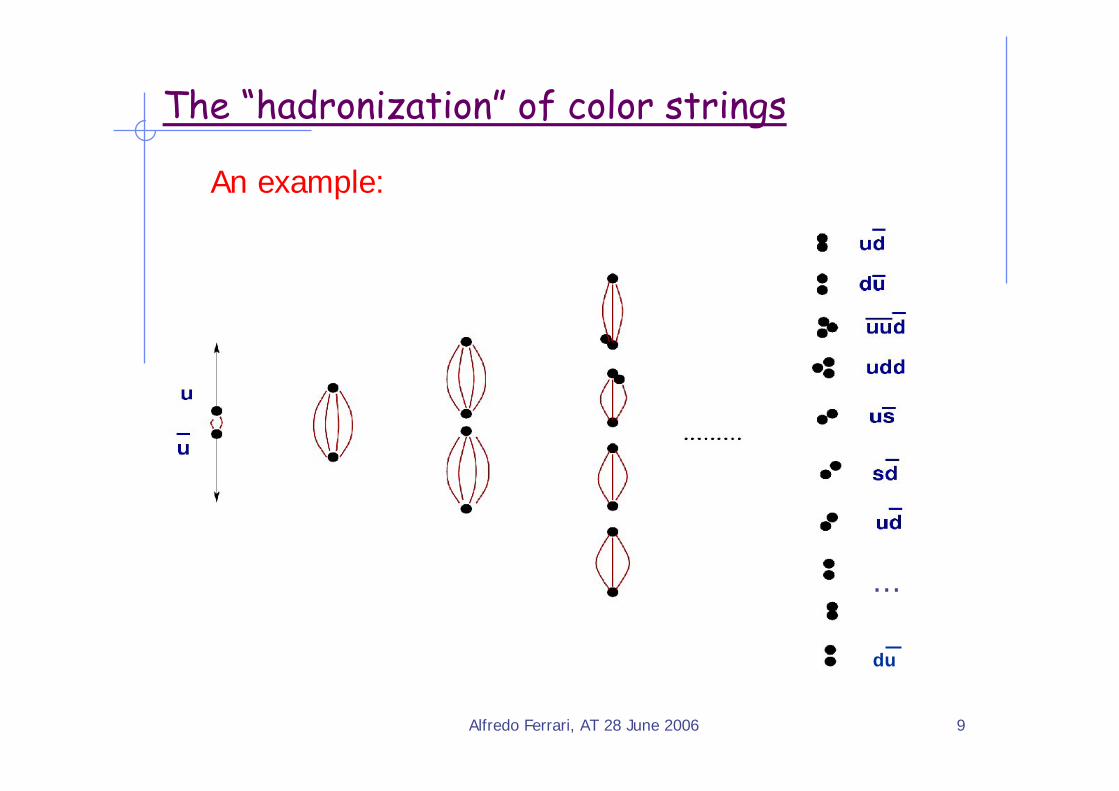
color strings to be “hadronized”

Alfredo Ferrari, AT 28 June 2006 8
Hadron-hadron collisions: chain examples
Leading two-chain diagram in DPM for π+-p scattering. The
color (red, blue, and green) and quark combination shown
in the figure is just one of the allowed possibilities
Leading two-chain diagram in DPM for p-p scattering. The color
(red, blue, and green) and quark combination shown
in the figure is just one of the allowed possibilities
Alfredo Ferrari, AT 28 June 2006 9
The “hadronization” of color strings
An example:
...
du
Alfredo Ferrari, AT 28 June 2006 10
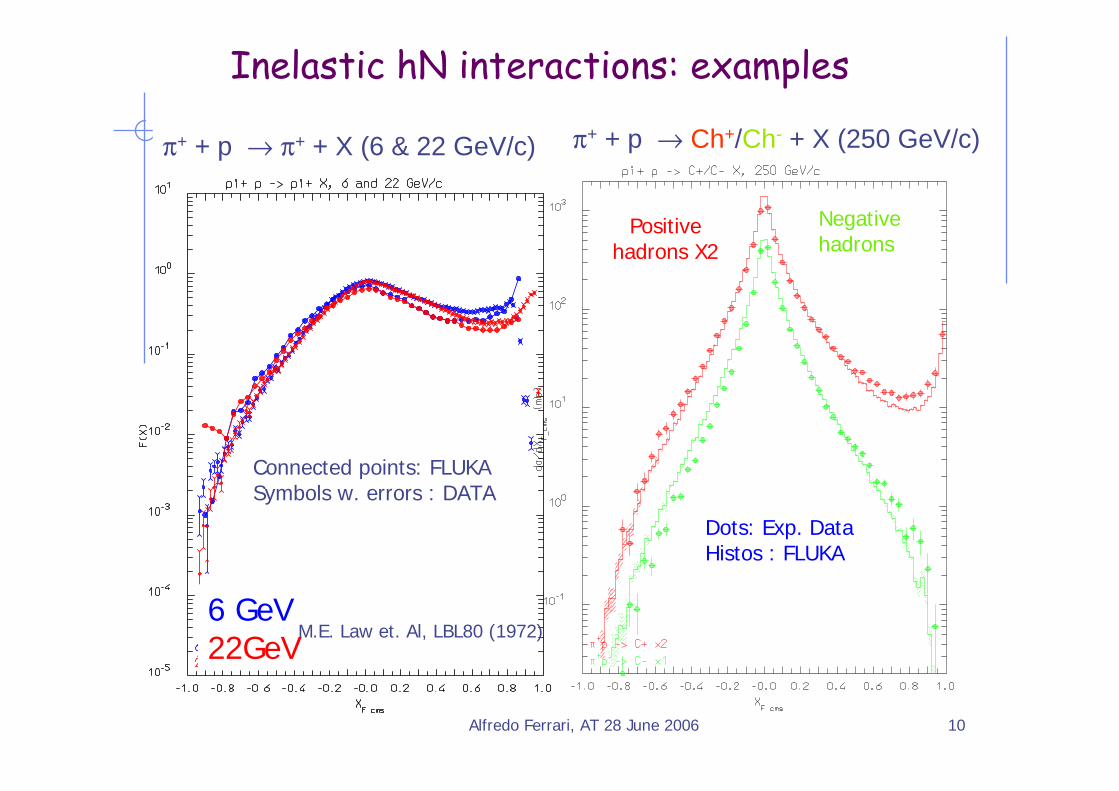
π+ + p → Ch+/Ch- + X (250 GeV/c)
Inelastic hN interactions: examples
π+ + p → π+ + X (6 & 22 GeV/c)
6 GeV22GeV
M.E. Law et. Al, LBL80 (1972)
Connected points: FLUKASymbols w. errors : DATA
Positive hadrons X2
Negative hadrons
Dots: Exp. DataHistos : FLUKA

Alfredo Ferrari, AT 28 June 2006 11
MC modeling of nuclear interactions:Target nucleus description (density, Fermi motion, etc)
Preequilibrium stage with current exciton configuration and excitation energy
(all non-nucleons emitted/decayed + all nucleons below 30-100 MeV)
Glauber-Gribov cascade with formation zone
(Generalized) IntraNuclear cascade
Evaporation/Fragmentation/Fission model
γ deexcitation
t (s)
10-23
10-22
10-20
10-16

Alfredo Ferrari, AT 28 June 2006 12
Nucleon Fermi MotionFermi gas model: Nucleons = Non-interacting Constrained Fermions
Momentum distribution
for k up to a (local) Fermi momentum kF(r) given by
The Fermi energy (kF ≈ 1.36 fm, PF ≈ 260 MeV/c, EF ≈ 35 MeV, at nuclear max. density) is customarily used in building a self-consistent Nuclear Potential
Depth of the potential well ≡ Fermi Energy + Nuclear Binding Energy
2
2
2πk
dkdN =∝
[ ]31
2 )(3)( rrk NF ρπ=

Alfredo Ferrari, AT 28 June 2006 13
(Generalized) IntraNuclear CascadePrimary and secondary particles moving in the nuclear mediumTarget nucleons motion and nuclear well according to the Fermi gas modelInteraction probability
σfree + Fermi motion × ρ(r) + exceptions (ex. π)Glauber cascade at higher energiesClassical trajectories (+) nuclear mean potential (resonant for π)Curvature from nuclear potential → refraction and reflectionInteractions are incoherent and uncorrelatedInteractions in projectile-target nucleon CMS → Lorentz boostsMultibody absorption for π, μ-, K-
Quantum effects (Pauli, formation zone, correlations…)Exact conservation of energy, momenta and all addititivequantum numbers, including nuclear recoil

Alfredo Ferrari, AT 28 June 2006 14
Advantages and Limitations of (G)INCAdvantagesAdvantages
No other model available for energies above the pion threshold production (except QMD models)No other model for projectiles other than nucleonsEasily available for on-line integration into transport codesEvery target-projectile combination without any extra informationParticle-to-particle correlations preservedValid on light and on heavy nucleiCapability of computing cross sections, even when they are unknown
LimitationsLimitationsLow projectile energies E<200MeV are badly described (partially solved in GINC+preequilibrium)Quasi electric peaks above 100MeV are usually too sharpCoherent effect as well as direct transitions to discrete states are not includedNuclear medium effects, which can alter interaction properties are not taken into account (partially solved in GINC)Multibody processes (i.e. interaction on nucleon clusters) are not included (solved in GINC)Composite particle emissions (d,t,3He,α) cannot be easily accommodated into INC, but for the evaporation stage (solved in GINC through coalescence)Backward angle emission poorly described (solved in GINC)

Alfredo Ferrari, AT 28 June 2006 15
hA at high energies: Glauber-Gribov cascade with formation zone
Glauber cascadeQuantum mechanical method to compute Elastic, Quasi-elastic and Absorption hA cross sections from Free hadron-nucleon scattering + nuclear ground stateMultiple Collision expansion of the scattering amplitude
Glauber-GribovField theory formulation of Glauber modelMultiple collisions ↔ Feynman diagramsHigh energies: exchange of one or more Pomerons with one or more target nucleons (a closed string exchange)
Formation zone (=materialization time)

Alfredo Ferrari, AT 28 June 2006 16
Glauber Cascade),(2),( ),(),( sbi
hNsbi
hNhNhN esbesbS δχ η==
Quantum mechanical method to compute all relevant hadron-nucleus cross sections from hadron-nucleon scattering:
and nuclear ground state wave function Ψi
( ) ( ) ( ) ( )2
1
232 ,1 ⎥
⎦
⎤⎢⎣
⎡−−Ψ=≡ ∏∫∫∑
=⊥Σ
A
jjhNi
ffihAfhA srbSuudbdss σσScattering
( ) ( ) ( )2
1
232 ,1 ⎥
⎦
⎤⎢⎣
⎡−−Ψ= ∏∫∫
=⊥
A
jjhNielhA srbSuudbdsσElastic
( ) ( ) ( )⎥⎦
⎤⎢⎣
⎡−−Ψ= ∏∫∫
=⊥
A
jjhNiThA srbSuudbds
1
232 ,Re12σTotal
( ) ( ) ( )
( ) ( )⎪⎭
⎪⎬⎫
⎪⎩
⎪⎨⎧
⎭⎬⎫
⎩⎨⎧
⎥⎦⎤
⎢⎣⎡ −−−−Ψ=
−≡
∏∫∫=
⊥
Σ
A
jjhNi
fhAThAabshA
srbSuudbd
sss
1
2232 ,111
σσσ
Absorption probability over a given b and nucleon configuration
Absorption (particle prod.)
Alfredo Ferrari, AT 28 June 2006 17
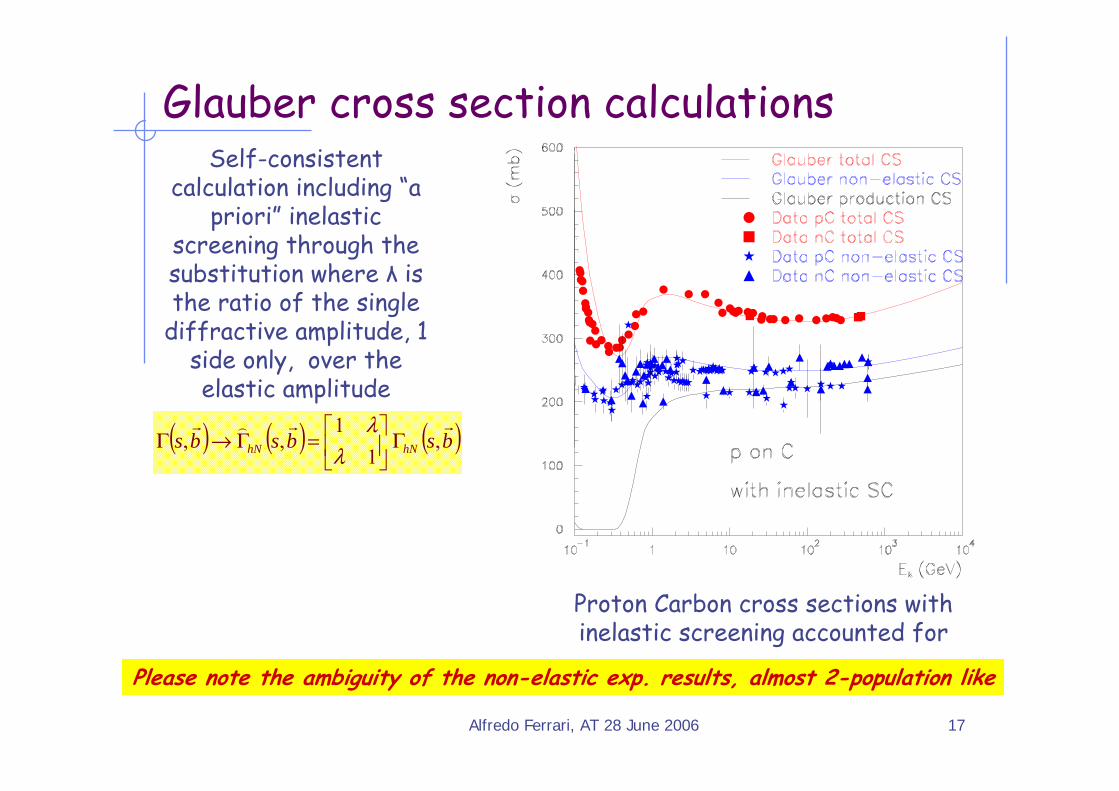
Glauber cross section calculations
Proton Carbon cross sections with inelastic screening accounted for
Please note the ambiguity of the non-elastic exp. results, almost 2-population like
Self-consistent calculation including “a
priori” inelastic screening through the substitution where λ is the ratio of the single
diffractive amplitude, 1 side only, over the elastic amplitude
( ) ( ) ( )bsbsbs hNhN
rr)r,
11
,, Γ⎥⎦
⎤⎢⎣
⎡=Γ→Γ
λλ

Alfredo Ferrari, AT 28 June 2006 18
Gribov interpretation of Glauber multiple collisions
Glauber-Gribov model = Field theory formulation of Glauber modelMultiple collision terms ⇒Feynman graphsAt high energies : exchange of one or more pomerons with one or more target nucleons
In the Dual Parton Model language: (neglecting higher order diagrams):Interaction with n target nucleons ⇒ 2n chains
Two chains from projectile valence quarks + valence quarks of one target nucleon ⇒valence-valence chains2(n-1) chains from sea quarks of the projectile + valence quarks of target nucleons ⇒2(n-1) sea-valence chains
Therefore the absorption cross section is just the integral in the impact parameter plane of the probability of getting at least one non-elastic hadron-nucleon collision
and the overall average number of collision is given by
abshA
rhnrhp NZσ
σσν
+=⟩⟨
Alfredo Ferrari, AT 28 June 2006 19
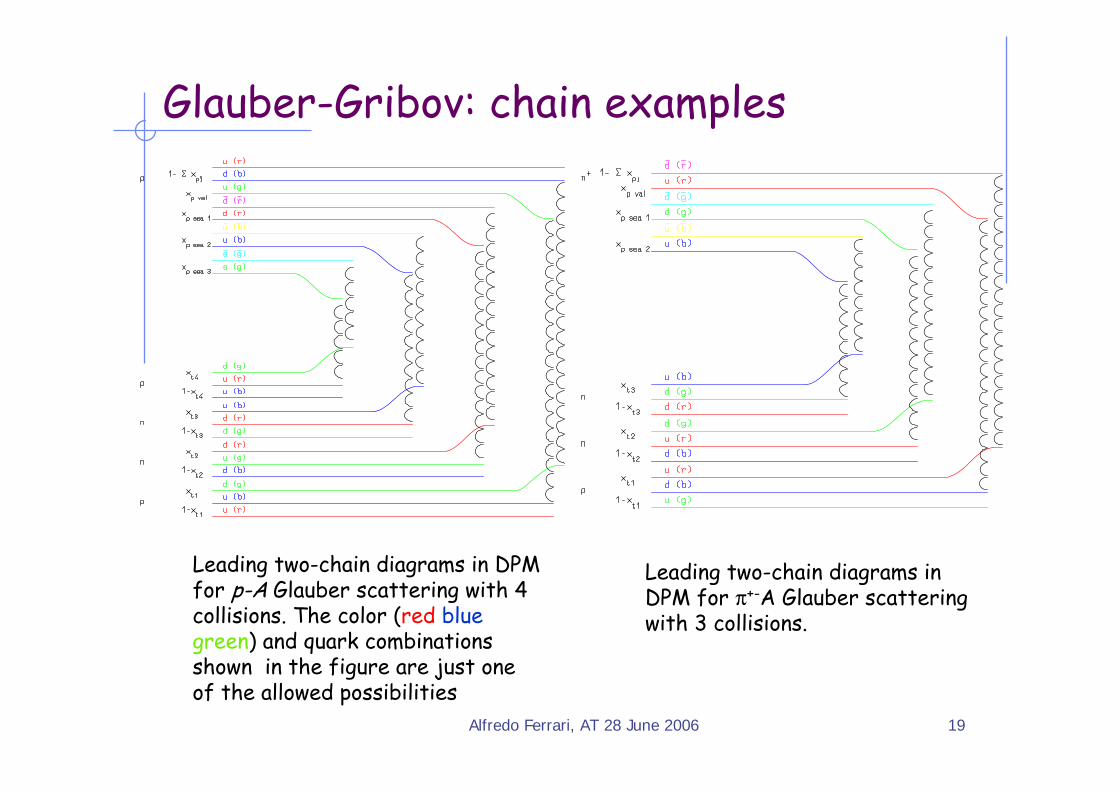
Glauber-Gribov: chain examples
Leading two-chain diagrams in DPM for p-A Glauber scattering with 4 collisions. The color (red bluegreen) and quark combinations shown in the figure are just one of the allowed possibilities
Leading two-chain diagrams in DPM for π+-A Glauber scattering with 3 collisions.

Alfredo Ferrari, AT 28 June 2006 20
From one to manyWhile the Glauber analytical calculation of cross sections is accurate down to sub-GeV energy, the interpretation in terms of explicit multiple collisions and its MonteCarlo implementation are less sound for projectile energies < 5-10 GeV

Alfredo Ferrari, AT 28 June 2006 21
Formation zone Naively: “materialization" time (originally proposed by Stodolski).
Qualitative estimate:
22 MpMt
EM
TT +== hτParticle proper time
22 Mppk
Mpt
Eptcx
T
labfor
lab
T
lablabfor +
=≈≈⋅≡Δ hτβ
Going to the nucleus system
31
0 ArRx Afor ≈≤Δ
Condition for possible reinteraction inside a nucleus:
22 MpEtt
TT +=≈Δ= hh
In the frame where p|| =0

Alfredo Ferrari, AT 28 June 2006 22
Setting the formation zone: no Glauber, no formation zone
Rapidity distribution of charged particles produced in 250 GeV π+ collisions on Aluminum (left) and Gold (right)Points: exp. data ( Agababyan et al., ZPC50, 361 (1991)).
Positive Negative
π+
Positive Negative
π+

Alfredo Ferrari, AT 28 June 2006 23
Setting the formation zone: no Glauber, yes formation zone
Rapidity distribution of charged particles produced in 250 GeV π+ collisions on Aluminum (left) and Gold (right)Points: exp. data ( Agababyan et al., ZPC50, 361 (1991)).
Positive Negative
π+
Positive Negative
π+

Alfredo Ferrari, AT 28 June 2006 24
Setting the formation zone: yes Glauber, no formation zone
Rapidity distribution of charged particles produced in 250 GeV π+ collisions on Aluminum (left) and Gold (right)Points: exp. data ( Agababyan et al., ZPC50, 361 (1991)).
Positive Negative
π+
Positive Negative
π+

Alfredo Ferrari, AT 28 June 2006 25
Setting the formation zone: yes Glauber, yes formation zone
Rapidity distribution of charged particles produced in 250 GeV π+ collisions on Aluminum (left) and Gold (right)Points: exp. data ( Agababyan et al., ZPC50, 361 (1991)).
Positive Negative
π+
Positive Negative
π+
Alfredo Ferrari, AT 28 June 2006 26
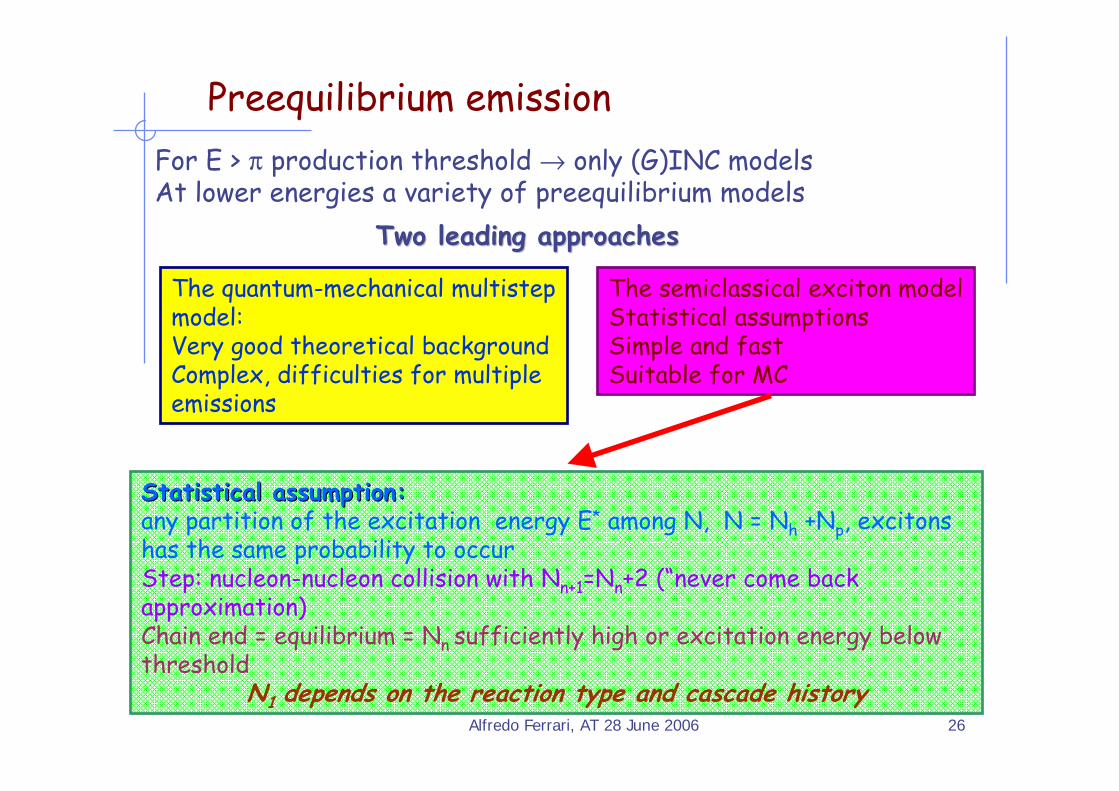
Preequilibrium emissionFor E > π production threshold → only (G)INC modelsAt lower energies a variety of preequilibrium models
Two leading approachesTwo leading approaches
The quantum-mechanical multistepmodel:Very good theoretical backgroundComplex, difficulties for multiple emissions
The semiclassical exciton modelStatistical assumptionsSimple and fastSuitable for MC
Statistical assumption:Statistical assumption:any partition of the excitation energy E* among N, N = Nh +Np, excitonshas the same probability to occurStep: nucleon-nucleon collision with Nn+1=Nn+2 (“never come back approximation)Chain end = equilibrium = Nn sufficiently high or excitation energy below threshold
N1 depends on the reaction type and cascade history

Alfredo Ferrari, AT 28 June 2006 27
Thin target example
Angle-integrated 90Zr(p,xn) at 80.5 MeV
The various lines show the total, INC, preequilibrium and evaporation contributions
Experimental data from M. Trabandt et al., Phys. Rev. C39, 452 (1989)
Alfredo Ferrari, AT 28 June 2006 28
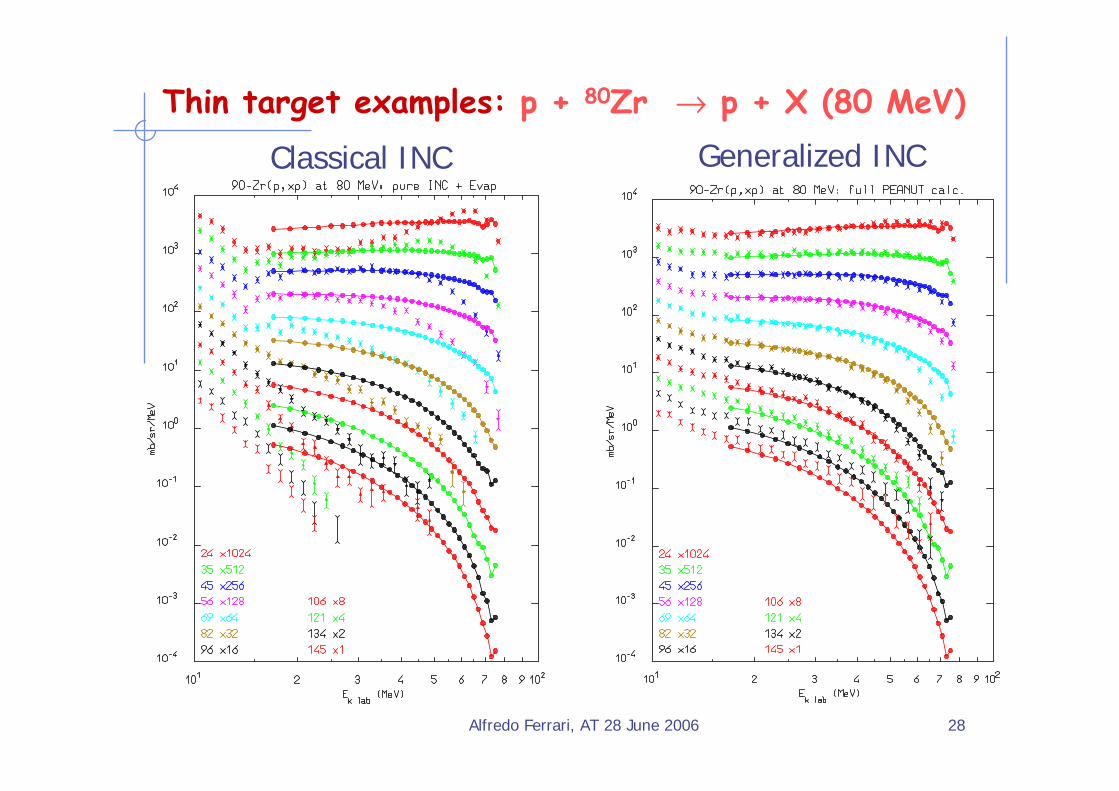
Thin target examples: p + 80Zr → p + X (80 MeV)
Classical INC Generalized INC
Alfredo Ferrari, AT 28 June 2006 29
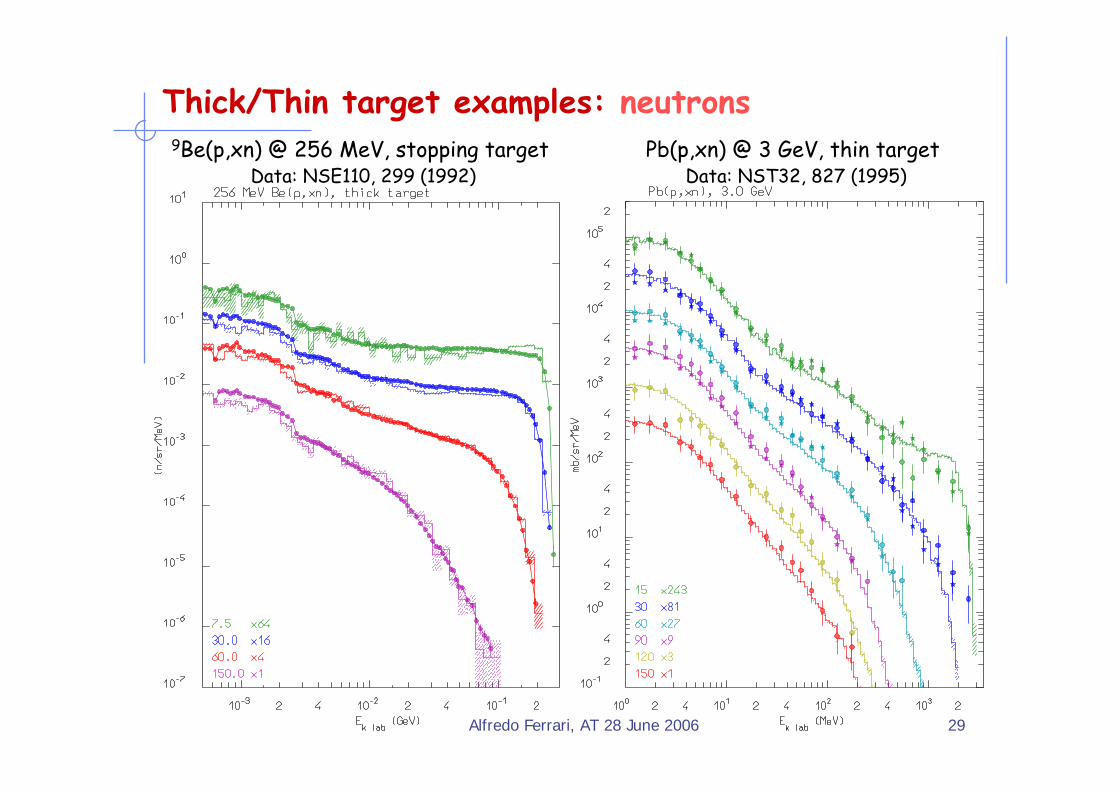
Thick/Thin target examples: neutrons9Be(p,xn) @ 256 MeV, stopping target
Data: NSE110, 299 (1992)Pb(p,xn) @ 3 GeV, thin target
Data: NST32, 827 (1995)
Alfredo Ferrari, AT 28 June 2006 30
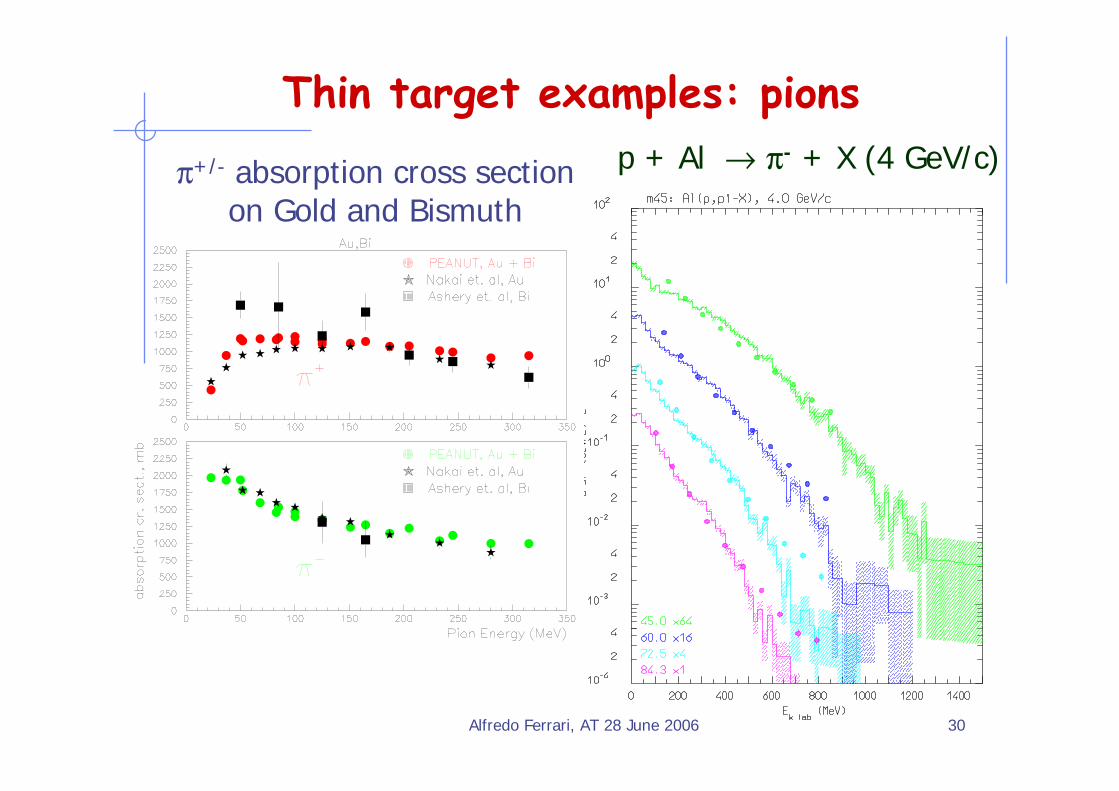
Thin target examples: pions
π+/- absorption cross section on Gold and Bismuth
p + Al → π- + X (4 GeV/c)
Alfredo Ferrari, AT 28 June 2006 31
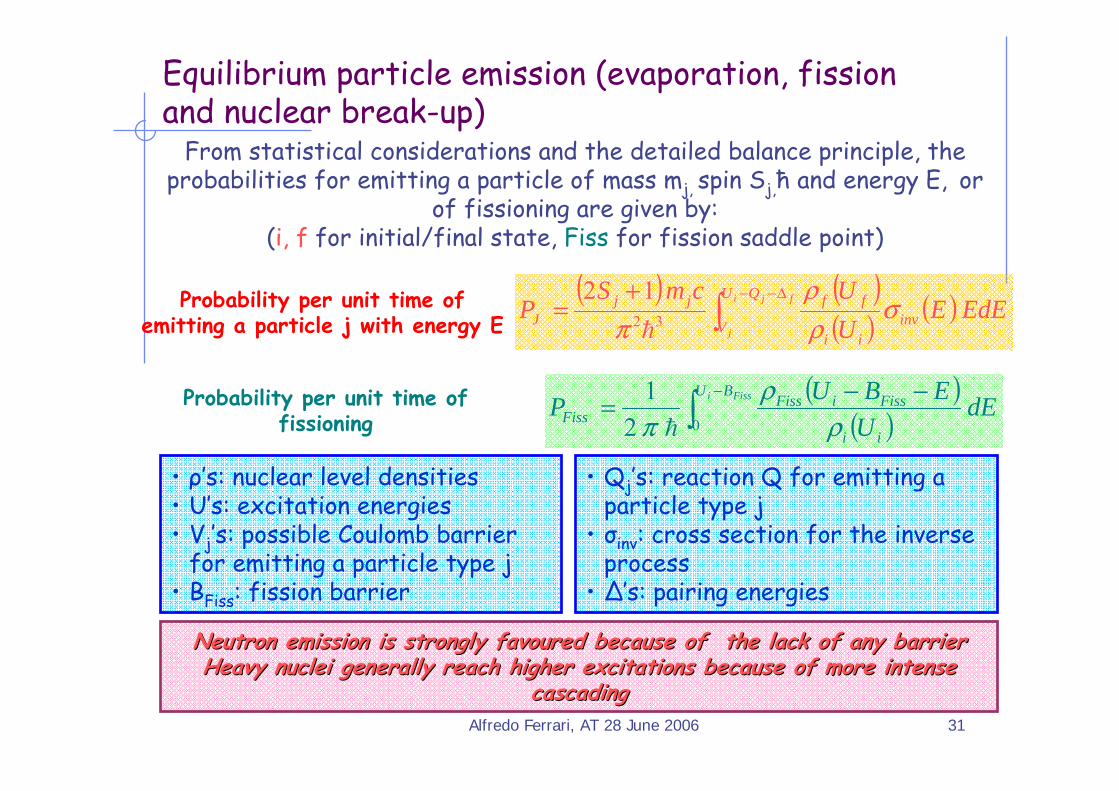
Equilibrium particle emission (evaporation, fission and nuclear break-up)
( ) ( )( ) ( ) EdEEUUcmS
P fji
j
QU
V invii
ffjjJ ∫
Δ−−+= σ
ρρ
π 32
12h
( )( ) dEU
EBUP Fissi BU
ii
FissiFissFiss ∫
− −−=02
1ρ
ρπ h
Probability per unit time of emitting a particle j with energy E
Probability per unit time of fissioning
From statistical considerations and the detailed balance principle, the probabilities for emitting a particle of mass mj, spin Sj,ħ and energy E, or
of fissioning are given by:(i, f for initial/final state, Fiss for fission saddle point)
• ρ’s: nuclear level densities• U’s: excitation energies• Vj’s: possible Coulomb barrier
for emitting a particle type j• BFiss: fission barrier
• Qj’s: reaction Q for emitting a particle type j
• σinv: cross section for the inverse process
• ∆’s: pairing energies
Neutron emission is strongly Neutron emission is strongly favouredfavoured because of the lack of any barrierbecause of the lack of any barrierHeavy nuclei generally reach higher excitations because of more Heavy nuclei generally reach higher excitations because of more intense intense
cascadingcascading

Alfredo Ferrari, AT 28 June 2006 32
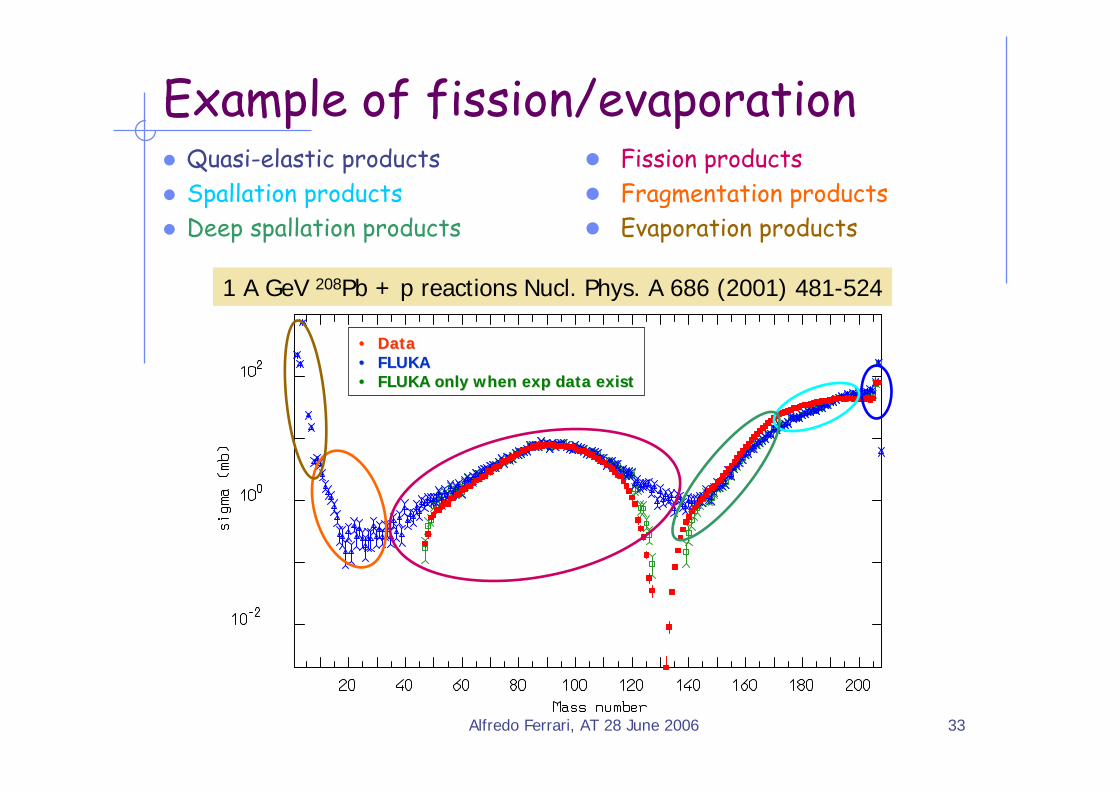
Residual NucleiThe production of residuals is the result of the last step of the nuclear reaction, thus it is influenced by all the previous stagesResidual mass distributions are very well reproducedResiduals near to the compound mass are usually well reproducedHowever, the production of specific isotopes may be influenced by additional problems which have little or no impact on the emitted particle spectra (Sensitive to details of evaporation, Nuclear structure effects, Lack of spin-parity dependent calculations in most MC models)
Alfredo Ferrari, AT 28 June 2006 33
1 A GeV 208Pb + p reactions Nucl. Phys. A 686 (2001) 481-524
Example of fission/evaporationQuasi-elastic productsSpallation productsDeep spallation products
•• DataData•• FLUKAFLUKA•• FLUKA only when exp data existFLUKA only when exp data exist
Fission productsFragmentation productsEvaporation products

Alfredo Ferrari, AT 28 June 2006 34
Heavy ion interaction models
(Generalized)IntraNuclear Cascade modelNuclear mean fieldSemiclassical trajectories
Quantum Molecular Dynamics modelsGaussian packet wave functions for nucleonsNucleon mean field as the sum of two-body potentials
BUU (Boltzmann-Uehling-Uhlenbeck) eq. based modelsTime evolution equation of the nucleon (pions...), one-body phase-space distributionTest particle method (semiclassical trajectories in a self-consistent mean field)
Intermediate energy range (~100 MeV/n to a few GeV/n): three main classes of microscopic models suitable for MonteCarlo.
They are microscopic kinetic models including the propagation and mutual interactions of pion and nucleon resonances. Similar two body collision
terms mostly based on free scattering
(G)INC and QMD models successfully extended up to very high ener(G)INC and QMD models successfully extended up to very high energies and all gies and all hadrons with hadrons with GlauberGlauber + string models (like DPM)+ string models (like DPM)
Alfredo Ferrari, AT 28 June 2006 35
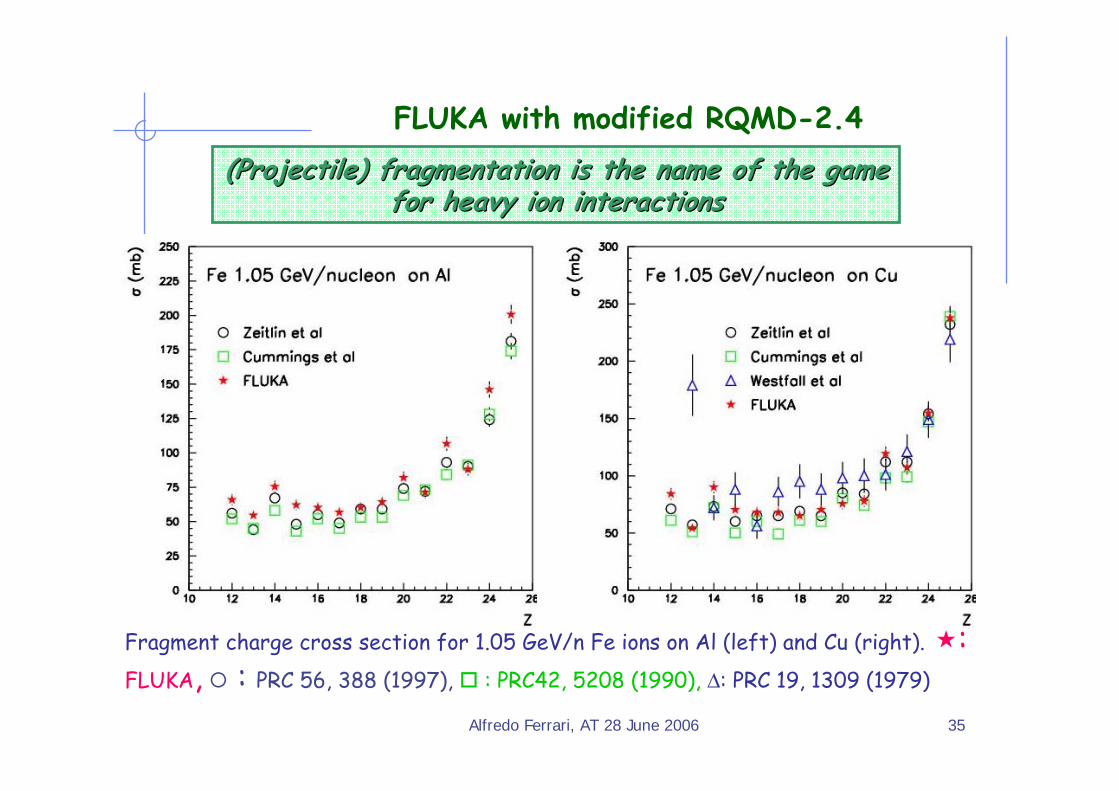
FLUKA with modified RQMD-2.4
Fragment charge cross section for 1.05 GeV/n Fe ions on Al (left) and Cu (right). : FLUKA, : PRC 56, 388 (1997), : PRC42, 5208 (1990), Δ: PRC 19, 1309 (1979)
(Projectile) fragmentation is the name of the game (Projectile) fragmentation is the name of the game for heavy ion interactionsfor heavy ion interactions

Alfredo Ferrari, AT 28 June 2006 36
FLUKA fragmentation results
Fragment charge cross section for 750 MeV/n Uions on Pb.
Data (stars) fromJ. Benlliure, P. Ambruster et
al., Eur. Phys. J. A2, 193-198 (1988).
Fission products have been excluded like in the experimental analysis
Alfredo Ferrari, AT 28 June 2006 37
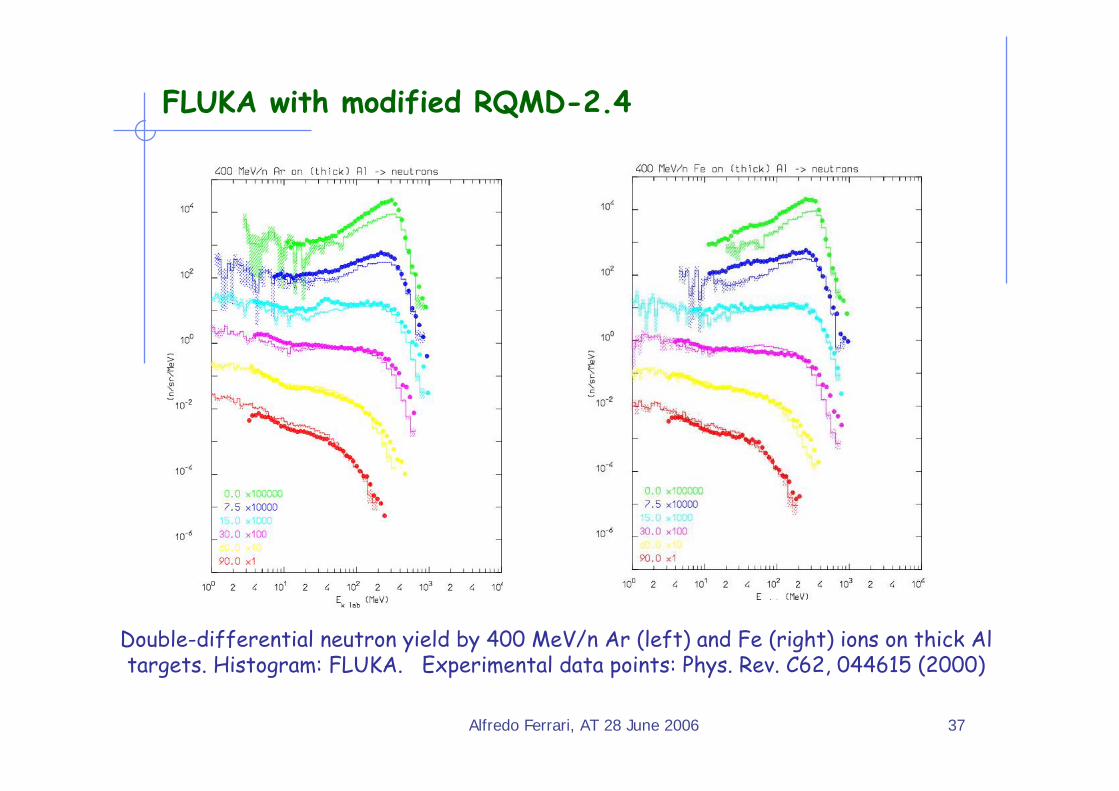
FLUKA with modified RQMD-2.4
Double-differential neutron yield by 400 MeV/n Ar (left) and Fe (right) ions on thick Al targets. Histogram: FLUKA. Experimental data points: Phys. Rev. C62, 044615 (2000)
Alfredo Ferrari, AT 28 June 2006 38
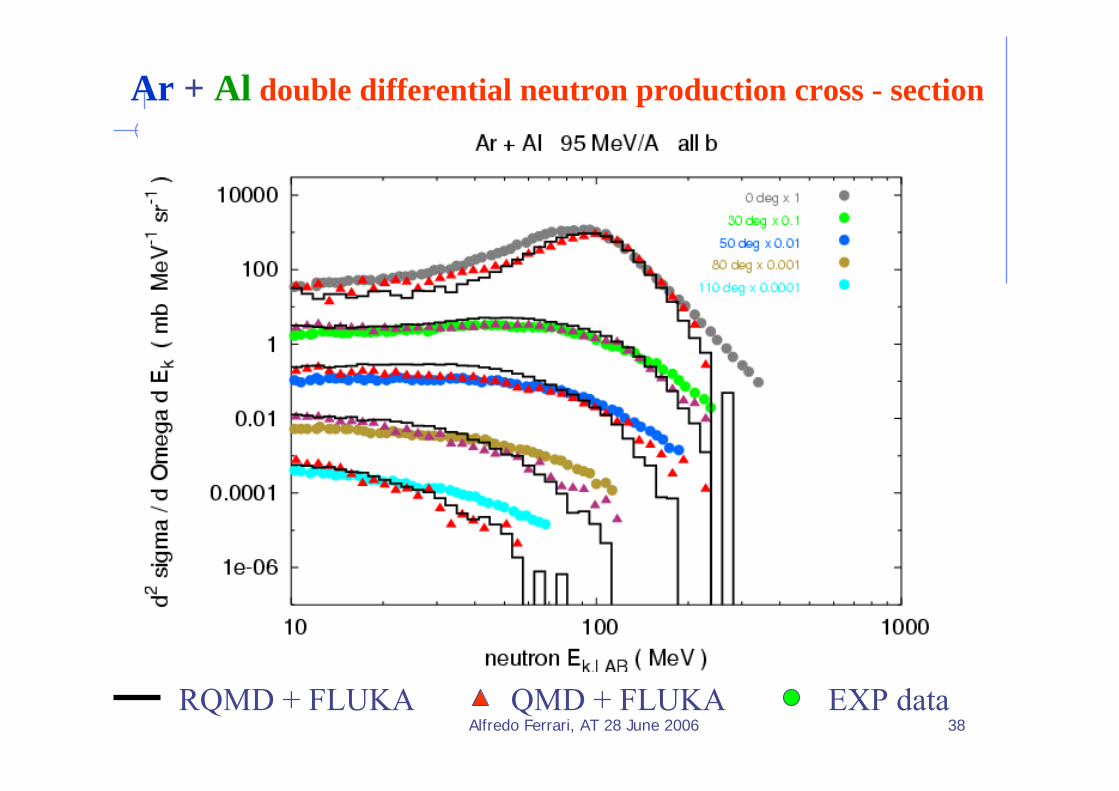
Ar + Al double differential neutron production cross - section
QMD + FLUKA EXP dataRQMD + FLUKA

Alfredo Ferrari, AT 28 June 2006 39
Simulated Charge distribution (red and yellow solid histograms) compared to experimental data collected in central collisions (grey points) by the AMPHORA detector at SARA. The simulation results are sensitive to the experimental cuts, as can be seen comparing the yellow line, obtained imposing a multiplicity cut of Mz > 5 at the end of the fast stage of the reaction, described by QMD, to the red line, obtained adding at the end of the interaction a multiplicity cut of Mz > 10 and the requirements of quasicomplete events taking into account the acceptance of the detector.
Alfredo Ferrari, AT 28 June 2006 40
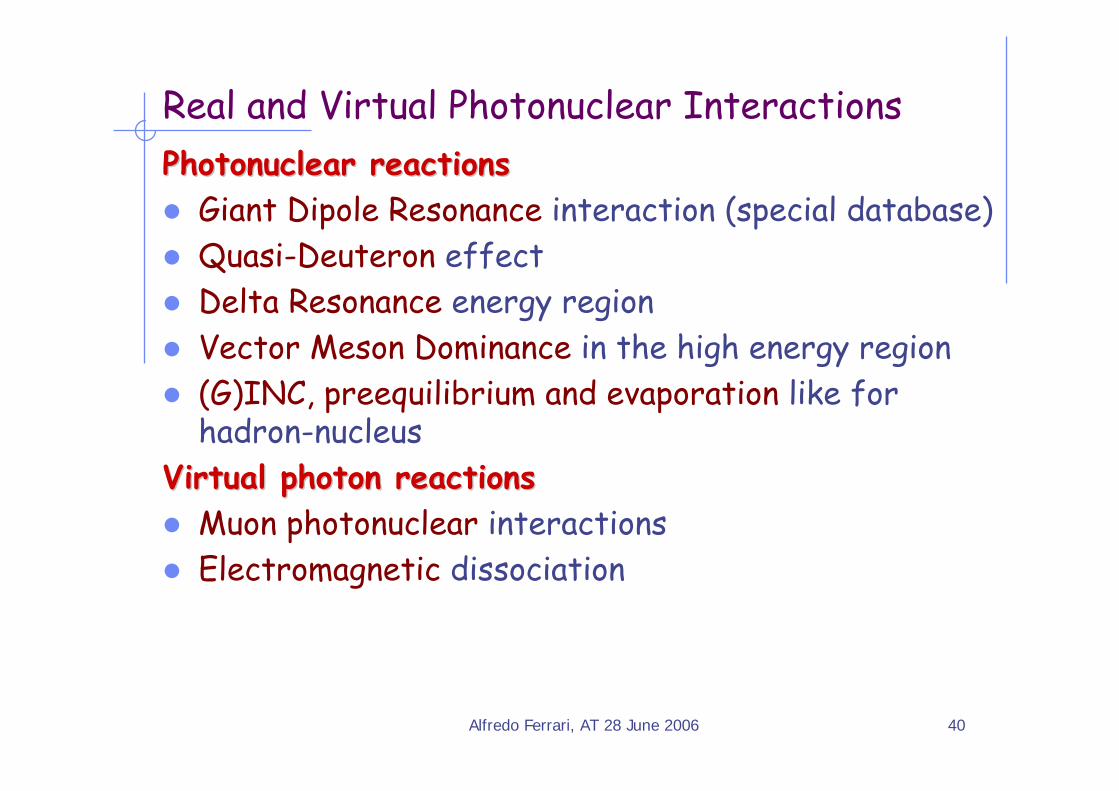
Real and Virtual Photonuclear InteractionsPhotonuclear reactionsPhotonuclear reactions
Giant Dipole Resonance interaction (special database)Quasi-Deuteron effectDelta Resonance energy regionVector Meson Dominance in the high energy region(G)INC, preequilibrium and evaporation like for hadron-nucleus
Virtual photon reactionsVirtual photon reactionsMuon photonuclear interactionsElectromagnetic dissociation

Alfredo Ferrari, AT 28 June 2006 41
Photonuclear int.: exampleReaction: 208Pb(γ,x n) 20≤Eγ ≤140 MeV
Cross section for multiple neutron emission as a function of photon energy, Different colors refer to neutron multiplicity ≥ n , with 2≤n≤8
Symbols: exp data (NPA367, 237 (1981) ; NPA390, 221 (1982) )
Lines: FLUKA
Alfredo Ferrari, AT 28 June 2006 42
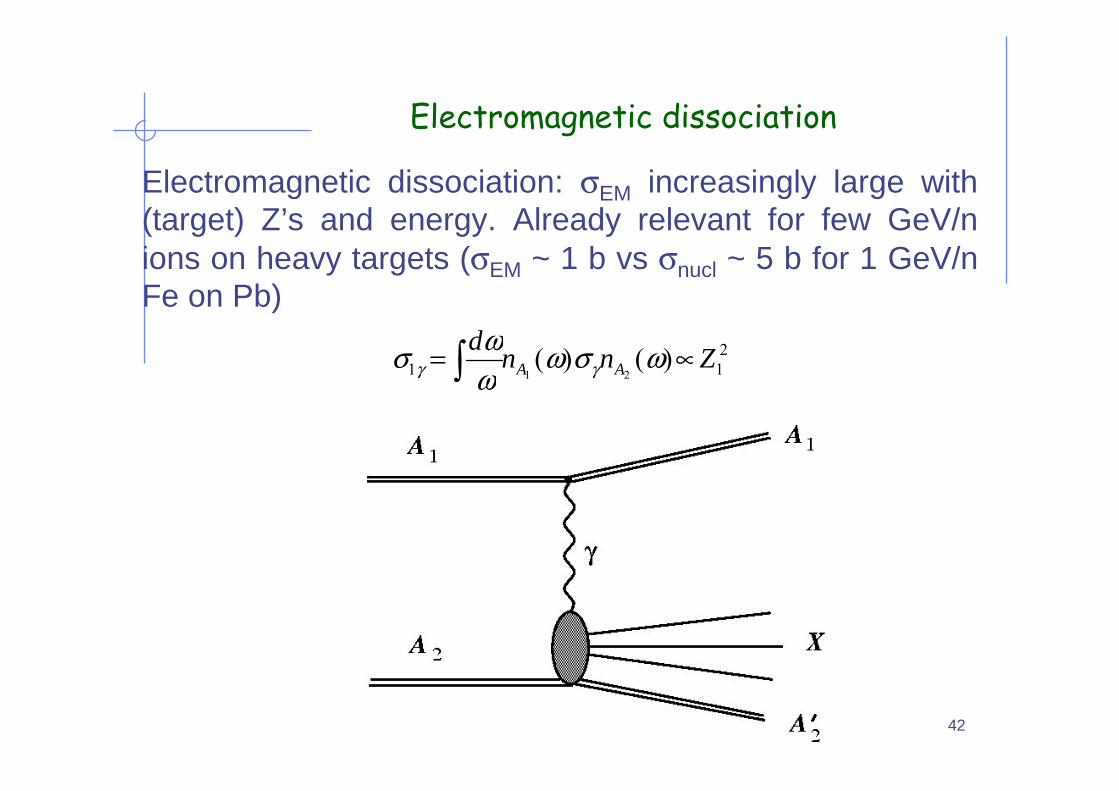
Electromagnetic dissociation
Electromagnetic dissociation: σEM increasingly large with (target) Z’s and energy. Already relevant for few GeV/nions on heavy targets (σEM ~ 1 b vs σnucl ~ 5 b for 1 GeV/nFe on Pb)
211 )()(
21Znnd
AA ∝= ∫ ωσωωωσ γγ

Alfredo Ferrari, AT 28 June 2006 43
Electromagnetic dissociation: example
Left: 28Si(g,tot) as recorded in FLUKA database, 8 interval Bezier fit as used for the Electromagnetic Dissociation event generator.
Right: calculated total, 1nX and 2nX electromagnetic dissociation cross sections for 30 A GeV Pb ions on Al, Cu, Sn and Pb targets. Points – measured cross sections of forward 1n and 2n emissions as a function of target charge (M.B. Golubeva et al., in press)

Alfredo Ferrari, AT 28 June 2006 44
158 GeV/n fragmentation
Fragment charge cross section for 158 AGeV Pbions on various targets. Data (symbols) from NPA662, 207 (2000), NPA707, 513 (2002) (blue circles) and from C.Scheidenberger et al. PRC, in press (red squares), histos are FLUKA (with DPMJET-III) predictions: the dashed histo is the electromagnetic dissociation contribution

Alfredo Ferrari, AT 28 June 2006 45
Examples of Applications

Alfredo Ferrari, AT 28 June 2006 46
CERNCERN--EU HighEU High--Energy Reference Energy Reference Field (CERF) facilityField (CERF) facility
Location of Samples:
Behind a 50 cm long, 7 cm diameter copper target, centred with the beam axis

Alfredo Ferrari, AT 28 June 2006 47
Calculation of Induced Activity with FLUKA
• Simulation of particle interactions and transport in the target, the samples, as well as the tunnel/cavern walls
• Separate simulations for proton and pion beam• Simulations of isotope production via
– High-energy processes– Low-energy neutron interactions
• Transport thresholds– Neutrons: down to thermal energies– Other hadrons: until stopped or captured– No electromagnetic cascade was simulated
• Calculated quantities– Radioactive isotope production per primary particle – (Star density and particle energy spectra in the samples)
• Calculation of build-up and decay of radioactive isotopes for specific irradiation and cooling patterns including radioactive daughter products
Alfredo Ferrari, AT 28 June 2006 48
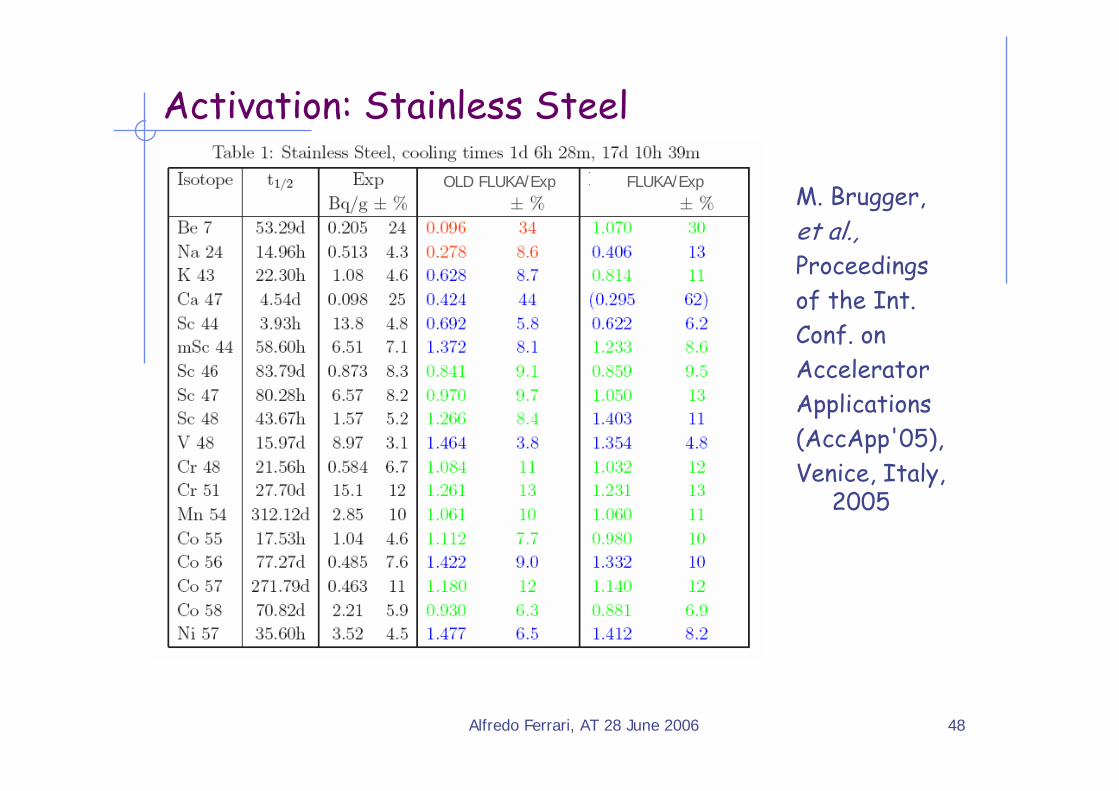
Activation: Stainless Steel
M. Brugger,et al., Proceedingsof the Int.Conf. onAcceleratorApplications(AccApp'05),Venice, Italy,
2005
OLD FLUKA/Exp FLUKA/Exp

Alfredo Ferrari, AT 28 June 2006 49
Activation: Aluminum
M. Brugger,et al., Proceedingsof the Int.Conf. onAcceleratorApplications(AccApp'05),Venice, Italy,
2005
OLD FLUKA/Exp FLUKA/Exp

Alfredo Ferrari, AT 28 June 2006 50
LHC: LHC: Conclusions on activation studyConclusions on activation study
Good agreement was found between the measured and calculated values for most of the isotopes and samples
The large number of samples and variety of different materials offers a extensive possibility to study isotope production
Multifragmentation (NOW DEVELOPED AND PRESENTED AT INT. CONF. ON NUCLEAR DATA FOR SCIENCE AND TECHN. (Santa Fe 2004)) has significantly improved the agreement for intermediate and small mass isotopes
As a consequence, the calculation of remanent dose rates based on an explicit simulation of isotope production and transport ofradiation from radioactive decay with FLUKA should also give reliable results → Part 2
Alfredo Ferrari, AT 28 June 2006 51
Part 2: Radioactivity Produced in LHC Part 2: Radioactivity Produced in LHC Materials: Residual Dose RatesMaterials: Residual Dose Rates
• Levels of residual dose rates are an important design criterion for any high energy facility
• Residual dose rates for arbitrary locations and cooling times are so far predicted with a rather poor accuracy– typically based on the concept of so-called ω-factors and
comprising several severe restrictions– layouts and material composition of beam-line components and
surrounding equipment are often very complex
• Anapproach based on the explicit generation and transport of gamma and beta radiation from radioactive decay should result in much more accurate results

Alfredo Ferrari, AT 28 June 2006 52
Benchmark experiment – Results 1
M. Brugger et al., Radiat. Prot. Dosim. 116 (2005) 12-15
Dose rate as function of cooling timefor different distances between sample and detector

Alfredo Ferrari, AT 28 June 2006 53
Benchmark experiment – Results 2
M. Brugger et al., Radiat. Prot. Dosim. 116 (2005) 12-15
Dose rate as function of cooling timefor different distances between sample and detector
Alfredo Ferrari, AT 28 June 2006 54
Cosmic Rays

Alfredo Ferrari, AT 28 June 2006 55
Cosmic Ray physics: Atmospheric Showers, and Cosmic Ray physics: Atmospheric Showers, and Space missionsSpace missionsThree different streams:Three different streams:
Basic research on Cosmic Ray physics (Basic research on Cosmic Ray physics (muonsmuons, neutrinos, EAS, , neutrinos, EAS, underground physics,...)underground physics,...)Application to Application to dosimetrydosimetry in civil aviation (DOSMAX Collaboration: in civil aviation (DOSMAX Collaboration: DosimetryDosimetry of Aircrew Exposure to Radiation During Solar Maximum, of Aircrew Exposure to Radiation During Solar Maximum, research project funded by the EU)research project funded by the EU)Application to Space missions, in particular manned missions to Application to Space missions, in particular manned missions to MARSMARS
Special addSpecial add--ons required, including:ons required, including:Primary spectra from Z = 1 to Z = 28 (derived from NASA and updated to most recent measurements.)Solar Modulation model (correlated to neutron monitors)Atmospheric model (MSIS Mass-Spectrometer-Incoherent-Scatter)3D geometry of Earth + atmosphere Geomagnetic model

Alfredo Ferrari, AT 28 June 2006 56
(3D) Calculation of Atmospheric ν Flux
Sub-GeV flux at Kamioka
0.02
0.025
0.03
0.035
0.04
0.045
-1 -0.5 0 0.5 1
3 dim
1 dim
cosθ
ν/cm
2 /sec
/sr/
GeV
νμ0.02
0.025
0.03
0.035
0.04
0.045
0.05
-1 -0.5 0 0.5 1
3 dim
1 dim
cosθ
νμ-
0.01
0.012
0.014
0.016
0.018
0.02
0.022
0.024
0.026
-1 -0.5 0 0.5 1
3 dim
1 dim
cosθ
ν/cm
2 /sec
/sr/
GeV
νe 0.008
0.01
0.012
0.014
0.016
0.018
0.02
0.022
-1 -0.5 0 0.5 1
3 dim
1 dim
cosθ
νe-
The first 3-D calculation of atmospheric neutrinos was done with FLUKA.
The enhancement in the horizontal direction, which cannot be predicted by a 1-D calculation, was fully unexpected, but is now generally acknowledged.
In the figure: angular distribution of νμ, ⎯νμ,, νe, ⎯νe..In red: 1-D calculation
Alfredo Ferrari, AT 28 June 2006 57
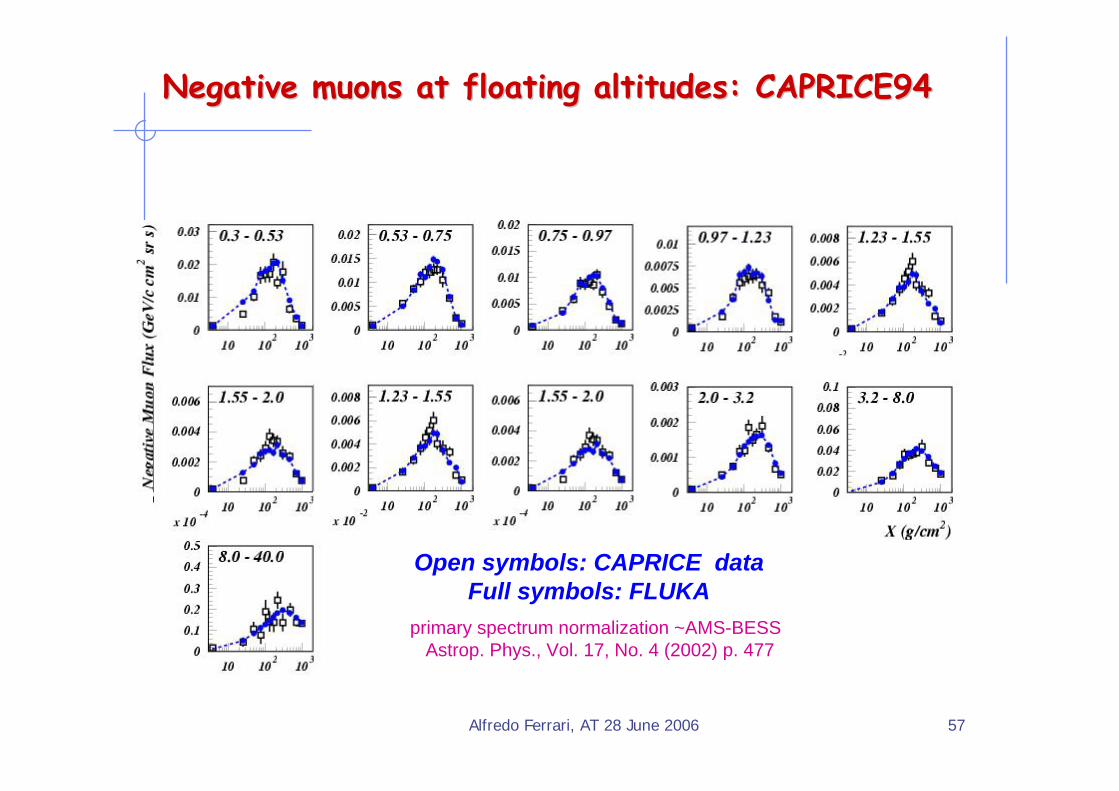
Negative Negative muonsmuons at floating altitudes: CAPRICE94at floating altitudes: CAPRICE94
Open symbols: CAPRICE data Full symbols: FLUKA
primary spectrum normalization ~AMS-BESS Astrop. Phys., Vol. 17, No. 4 (2002) p. 477
Alfredo Ferrari, AT 28 June 2006 58
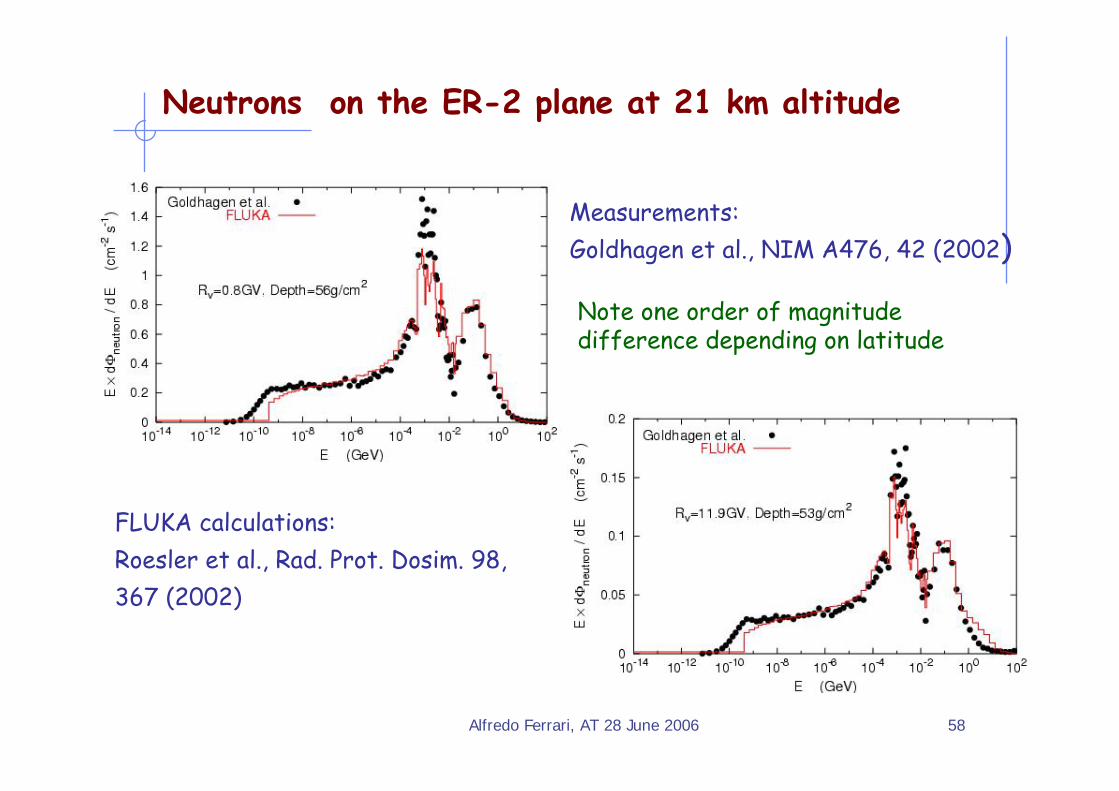
Neutrons on the ER-2 plane at 21 km altitude
Measurements: Goldhagen et al., NIM A476, 42 (2002)
FLUKA calculations: Roesler et al., Rad. Prot. Dosim. 98, 367 (2002)
Note one order of magnitude difference depending on latitude
Alfredo Ferrari, AT 28 June 2006 59
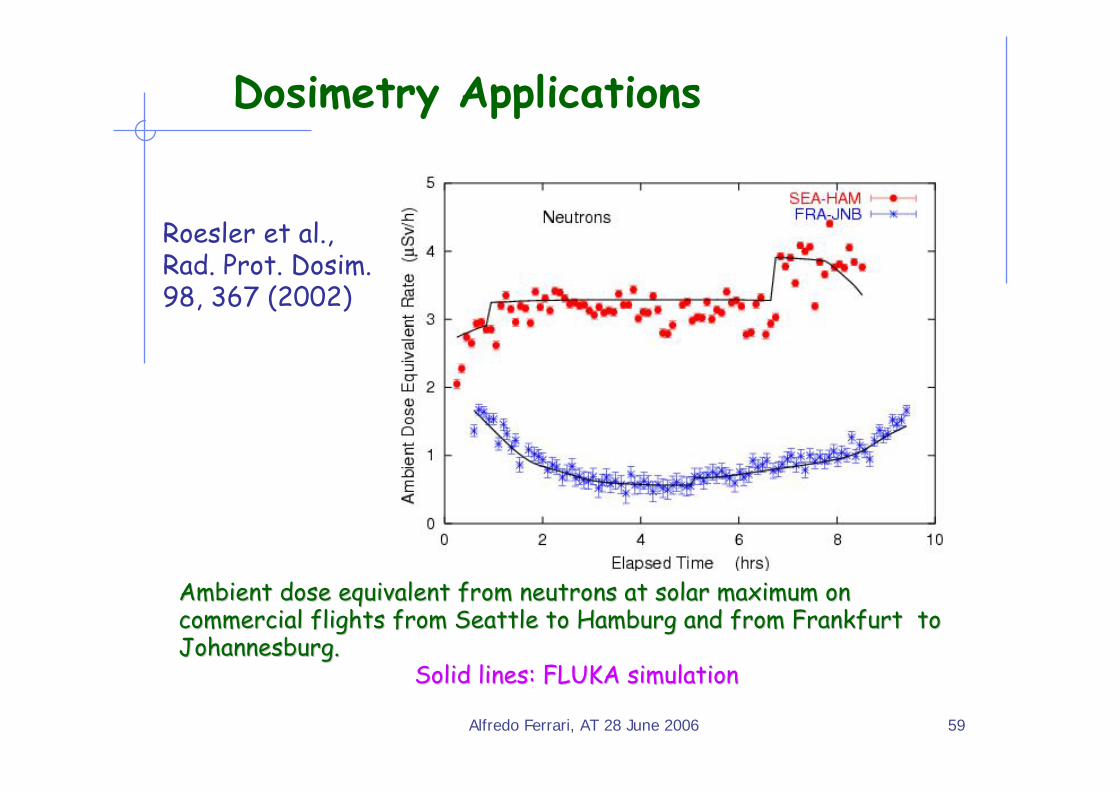
Dosimetry Applications
Ambient dose equivalent from neutrons at solar maximum on Ambient dose equivalent from neutrons at solar maximum on commercial flights from Seattle to Hamburg and from Frankfurt tcommercial flights from Seattle to Hamburg and from Frankfurt to o Johannesburg.Johannesburg.
Solid lines: FLUKA simulationSolid lines: FLUKA simulation
Roesler et al., Rad. Prot. Dosim. 98, 367 (2002)

Alfredo Ferrari, AT 28 June 2006 60
spectrum: 87% protons, 12% He ionsand 1% heavier ions (in fluence) with peaks at 1 GeV/n
flux: ∼4 particles/(cm2 s) at solar min.
spectrum: 90% protons, 10% heavier ions with energy mainly below ∼200 MeV
flux: up to ∼1010 particles/cm2 in some hrs.
dose: order of Sv, strongly dependent on shielding and organ
Galactic Cosmic Rays
NASA pub. 1998NASA pub. 1998
Solar Particle Events
dose:∼1 mSv/day
Radiation sources in space
61
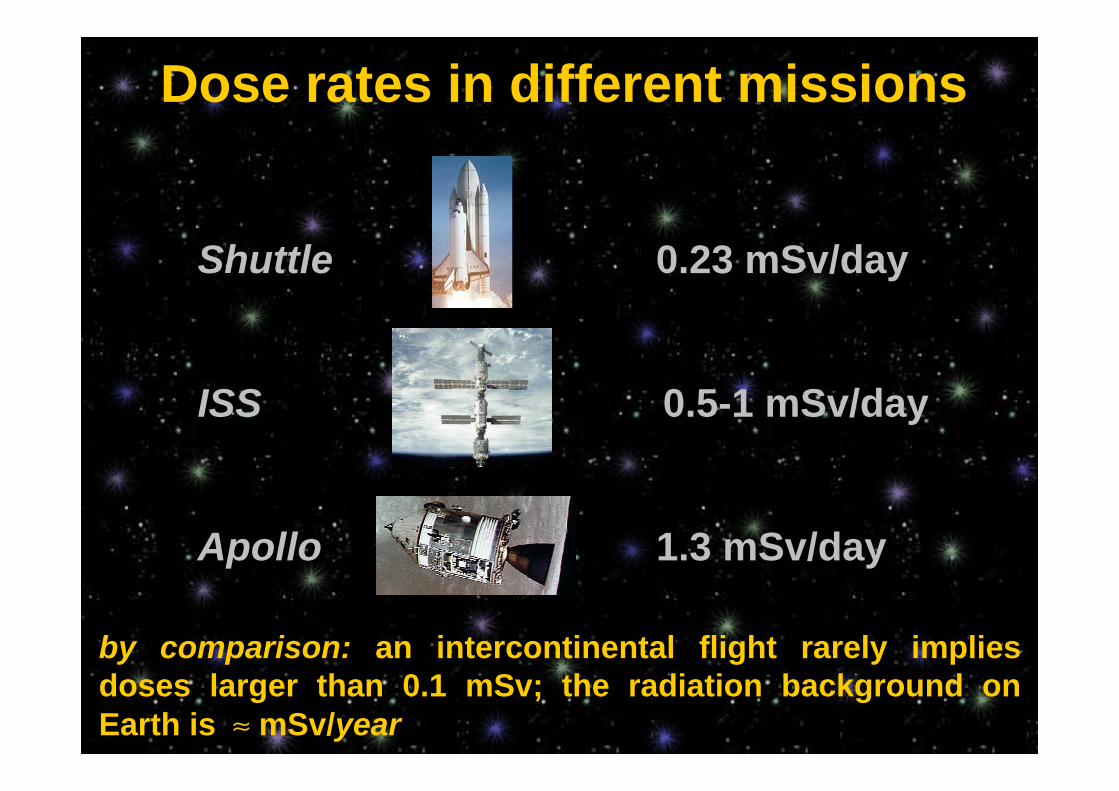
Dose rates in different missions
by comparison: an intercontinental flight rarely implies doses larger than 0.1 mSv; the radiation background on Earth is ≈ mSv/year
Shuttle 0.23 mSv/day
ISS 0.5-1 mSv/day
Apollo 1.3 mSv/day

62
Methods
FLUKAGCR and SPE spectra
Quality factors Yields of “Complex Lesions”Dose
Dose Equivalent
“Biological Dose”
mathematical phantom
(Pelliccioni et al.)“voxel” phantom
(Zankl et al.)
63
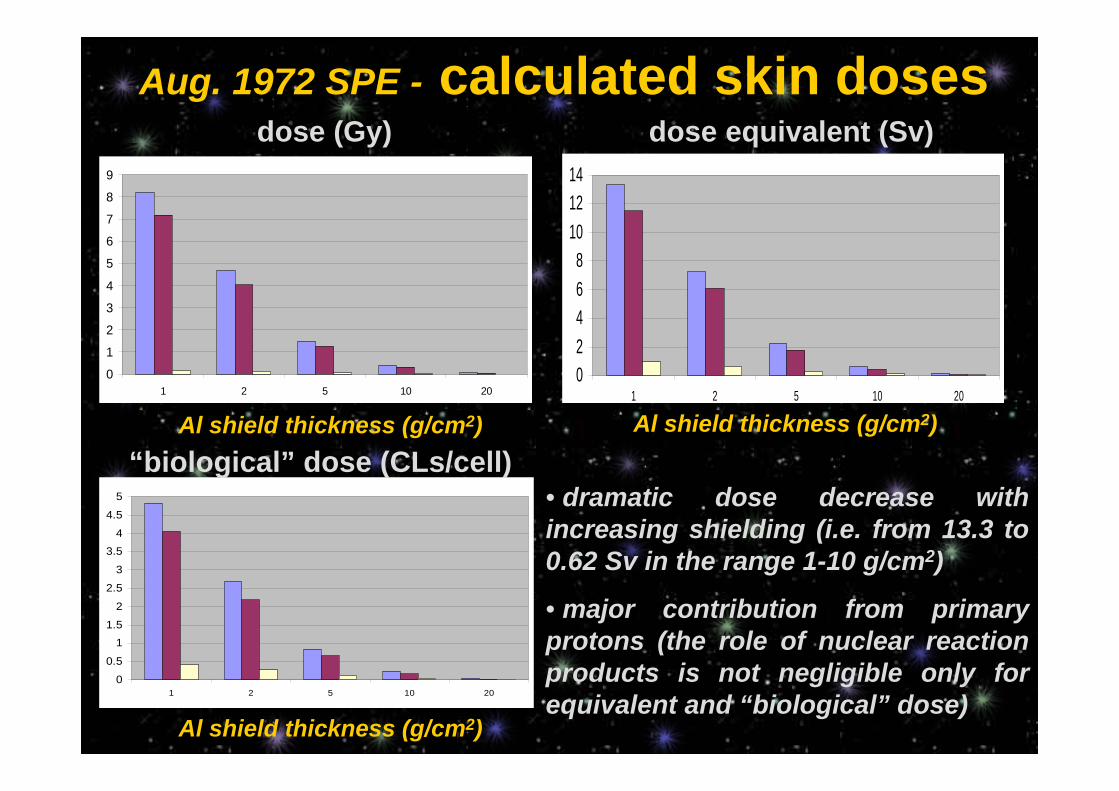
Aug. 1972 SPE - calculated skin doses
0
1
2
3
4
5
6
7
8
9
1 2 5 10 20
0
0.5
11.5
2
2.5
3
3.54
4.5
5
1 2 5 10 20
2
02468
101214
1 2 5 10 20
• dramatic dose decrease with increasing shielding (i.e. from 13.3 to 0.62 Sv in the range 1-10 g/cm2)
• major contribution from primary protons (the role of nuclear reaction products is not negligible only for equivalent and “biological” dose)
dose (Gy) dose equivalent (Sv)
“biological” dose (CLs/cell)Al shield thickness (g/cm2) Al shield thickness (g/cm2)
Al shield thickness (g/cm2)

64
Aug. 1972 SPE - skin vs. internal organs
0
2
4
6
8
10
12
14
1 2 5 10 20
Al thickness (g/cm2)
Total Primary Protons Secondary Hadrons
• much lower doses to liver than to skin (e.g. 1.0 vs. 13.3 Sv behind 1 g/cm2 Al )
• larger relative contribution of nuclear reaction products for liver than for skin (e.g. 14% vs. 7% behind 1 g/cm2 Al)
0
0.2
0.4
0.6
0.8
1
1.2
1 2 5 10 20
Al thickness (g/cm2)
Total Primary Protons Secondary Hadrons
dose equivalent to skin (Sv) dose equivalent to liver (Sv)
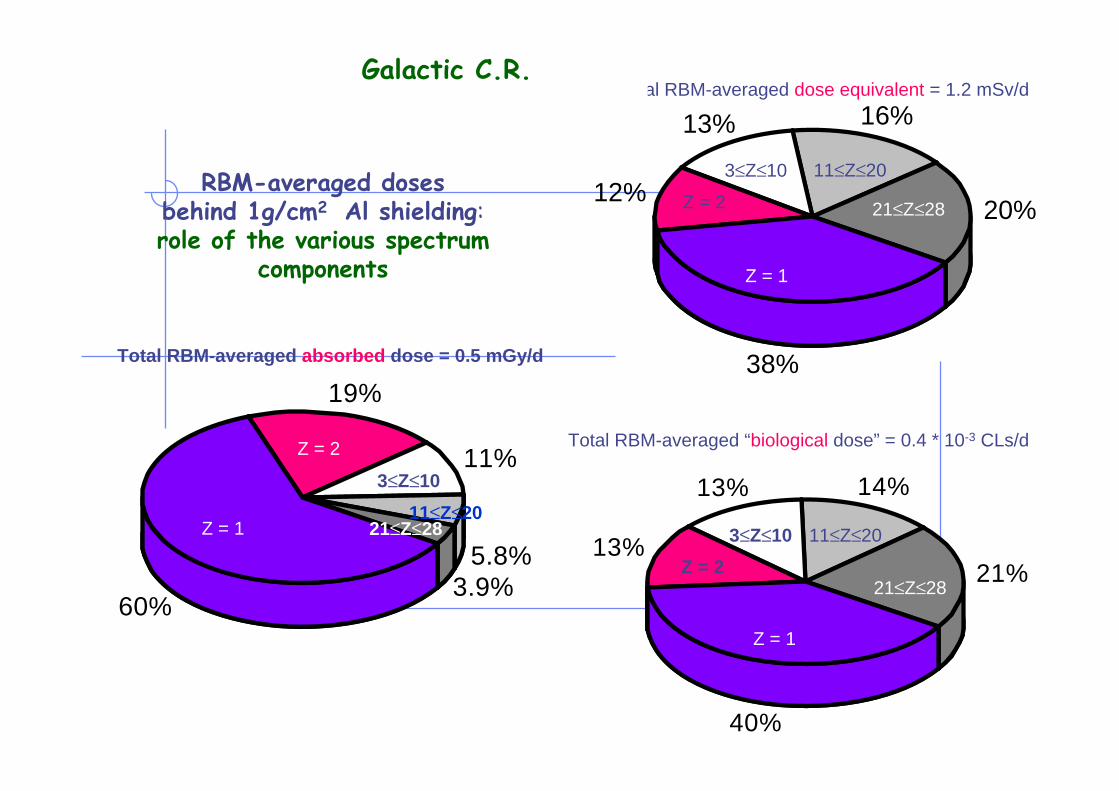
RBM-averaged dosesbehind 1g/cm2 Al shielding:role of the various spectrum
components
Total RBM-averaged “biological dose” = 0.4 * 10-3 CLs/d
20%
16%13%
12%
38%
Z = 1
Z = 2 21≤Z≤28
11≤Z≤203≤Z≤10
3.9%5.8%
11%
19%
60%
Z = 1
Z = 2
21≤Z≤2811≤Z≤20
3≤Z≤10
Total RBM-averaged dose equivalent = 1.2 mSv/d
21%
14%13%
13%
40%
Z = 1
Z = 221≤Z≤28
11≤Z≤203≤Z≤10
Total RBM-averaged absorbed dose = 0.5 mGy/d
Galactic C.R.

66
GCR solar min. - skin vs. internal organs
with respect to skin, internal organs have: 1) similar dose but smaller dose equivalent (∼ 1.3 vs. 1.7 mSv/day); 2) larger relative contributions from nuclear interaction products
skin liver
00.10.20.30.40.50.6
0.3 1 2 3 5
Al thickness (g*cm-2)
mG
y*d-1
Total Primary Ions Secondary Hadrons Electromagnetic
00.10.20.30.40.50.6
0.3 1 2 3 5
Al thickness (g*cm-2)
mG
y*d-1
Total Primary Ions Secondary Hadrons Electromagnetic
0
0.5
1
1.5
2
0.3 1 2 3 5
Al thickness (g*cm-2)m
Sv*d
-1
Total Primary Ions Secondary Hadrons Electromagnetic
0
0.5
1
1.5
2
0.3 1 2 3 5
Al thickness (g*cm-2)
mSv
*d-1
Total Primary Ions Secondary Hadrons Electromagnetic

67
GCR at solar min. - annual effective dose
0.3 0.47 0.43
1 0.47 0.44
2 0.46 0.41
3 0.43 0.41
5 0.42 0.42
Al (g/cm2)
male dose(Sv)
fem. dose(Sv)
the “effective dose” E is a sum over different organ doses, weighted by “tissue weighting factors”gonads: 0.20
bone marrow, colon, lung, stomach: 0.12
bladder, breast, liver, esophagous, thyroid: 0.05
skin, bone surface: 0.01
others: 0.05
ICRP 60, 1990
Alfredo Ferrari, AT 28 June 2006 68
Therapy related features
With the contribution of:K.Parodi, H.Paganetti, T.Bortfeld, W.Enghardt,
F.Fiedler, F.SommererMassachusetts General Hospital, Boston
Heidelberg, Ion Therapy Center, GermanyRossendorf, Germany
CERN, Geneva, Switzerland
Part of the material presented in the following is still Part of the material presented in the following is still unpublished. I am able to show it thanks to the unpublished. I am able to show it thanks to the
courtesy of courtesy of K.ParodiK.Parodi and MGH . It is not included in and MGH . It is not included in the official file of this presentationthe official file of this presentation

Alfredo Ferrari, AT 28 June 2006 69
HadroTherapy applications of MC:
Powerful for cross checking treatment plannings, (particularly for dis-homogeneities) Possibility of describing complex geometries including voxelstructures imported out of raw CT scansEssential (offline or online) for understanding heavy ion fragmentationWithout alternatives for nuclear reaction related issues, like online PET monitoring
The
GO
LE
M p
hant
om
Peto
ussi
-Hen
sset
al,
2002
Alfredo Ferrari, AT 28 June 2006 70
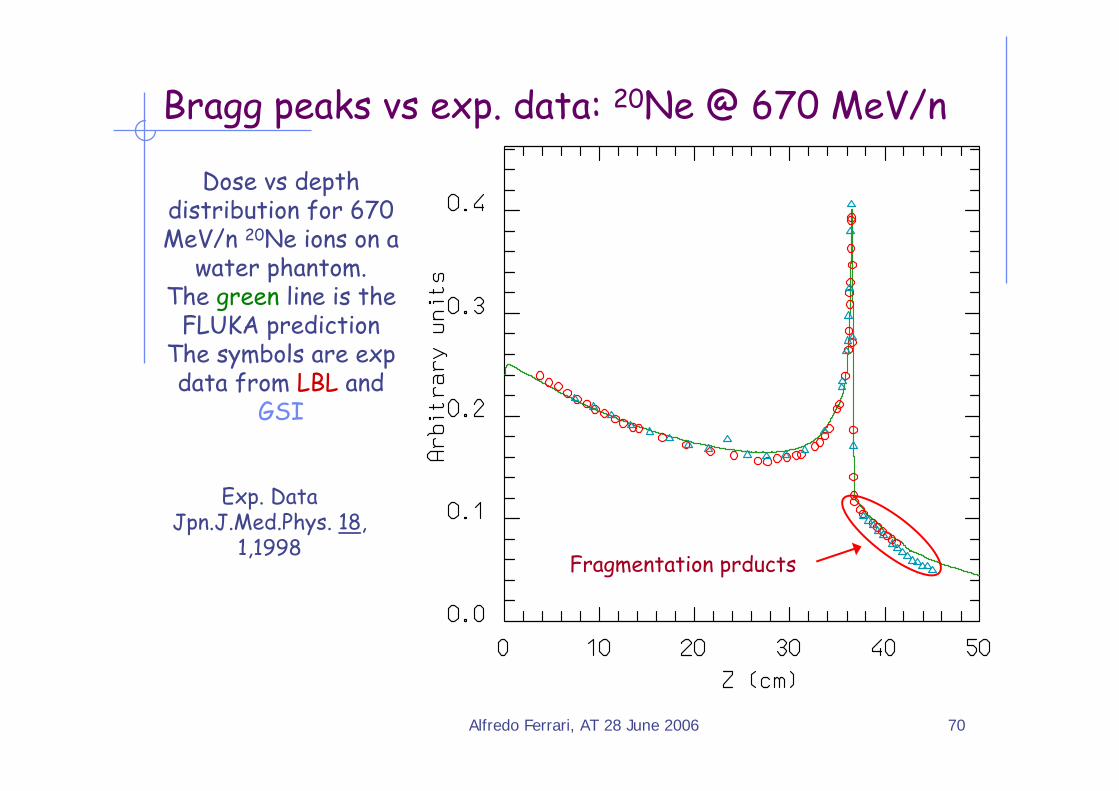
Bragg peaks vs exp. data: 20Ne @ 670 MeV/n
Dose vs depth distribution for 670 MeV/n 20Ne ions on a
water phantom.The green line is the
FLUKA predictionThe symbols are exp data from LBL and
GSI
Exp. Data Jpn.J.Med.Phys. 18,
1,1998Fragmentation prducts

Alfredo Ferrari, AT 28 June 2006 71
Bragg peaks vs exp. data: 12C @ 270 & 330 MeV/n
Exp. Data Jpn.J.Med.Phys. 18,
1,1998
Dose vs depth distribution for 270 and 330 MeV/n 12C
ions on a water phantom.
The full green and dashed blue lines are
the FLUKA predictions
The symbols are exp data from GSI

Alfredo Ferrari, AT 28 June 2006 72
Bragg peaks vs exp. data: 12C @ 270 MeV/n
Exp. Data Jpn.J.Med.Phys. 18,
1,1998
Close-up of the dose vs depth distribution for 270 MeV/n 12C
ions on a water phantom.
The green line is the FLUKA prediction with the nominal
0.15% energy spread The dotted light blue line is the
prediction for no spread, and the
dashed blue one the prediction for I
decreased by 1 eV

Alfredo Ferrari, AT 28 June 2006 73
In-beam treatment control with PET:
337 Mev/u 12C on water, after irradiation
cm0 5 10 15 20 250
0.2
0.4
0.6
0.8
1experiment
simulation
simulation smoothed
Final goal: simulation of β+ emitters generated during the irradiation→→ In-beam treatment plan verification with PET
Alfredo Ferrari, AT 28 June 2006 74
end