the use of m-fish to analysis the presence of genome instability in cells exposed to orthopaedic...
TRANSCRIPT

The use of M-FISH to analysis the The use of M-FISH to analysis the presence of genome instability in presence of genome instability in
cells exposed to orthopaedic implant cells exposed to orthopaedic implant wear debriswear debris
Presented by: Martin Figgitt
Bristol Implant Research Centre
Southmead Hospital
Bristol
ContentsContents
• Introduction – orthopaedic background, implant types etc
•The Bristol Study
•In vitro studies-metal ions
•Results
•Discussion
•Future work
•Acknowledgements
IntroductionIntroduction• Hip and knee orthopaedic implants the second most common elective operation in UK
•More orthopaedic implants in younger eg 40 years old
•Implants produce wear debris in both particulate and metal ion form ( eg cobalt and chromium)
•Does any of this wear debris have any detrimental effects upon patients eg genotoxicity
The Bristol Study
•A comparison of the genotoxicity of two hip resurfacing implants: Birmingham and ASR
•The study is comprised of three components:
1)Patients; M-FISH performed on pre-operative and post-operative blood samples (6 months, 1 year and 2 year)
2)In-vitro study of nanoparticle wear debris
3)In-vitro study of metal ions associated with wear debris

Hip Resurfacing Orthopaedic Implants
ASR Birmingham
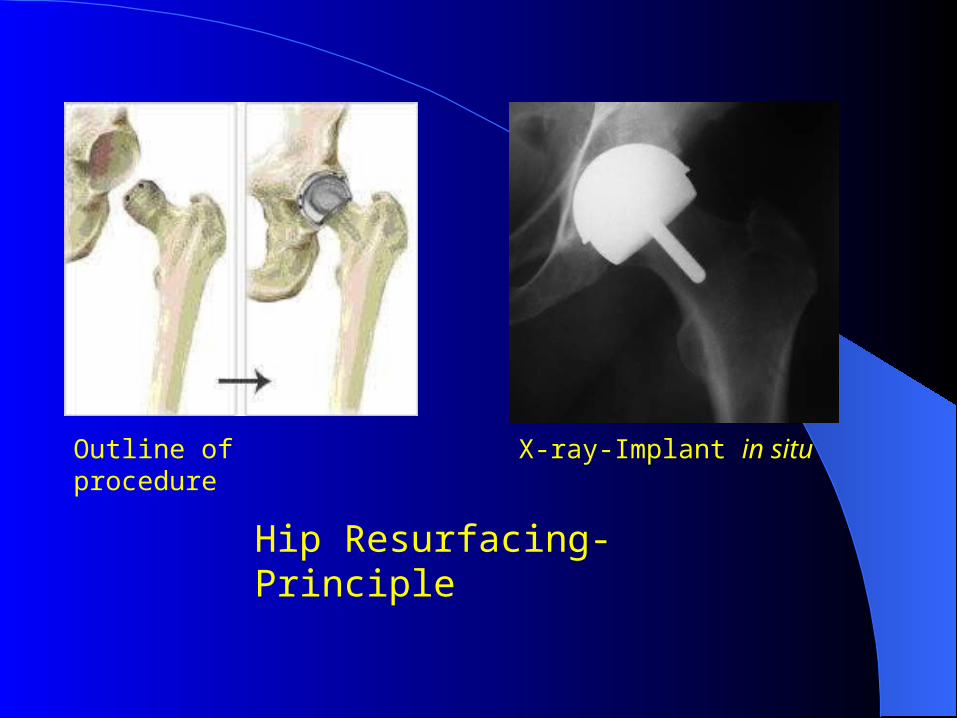
Hip Resurfacing- Principle
Outline of procedure X-ray-Implant in situ
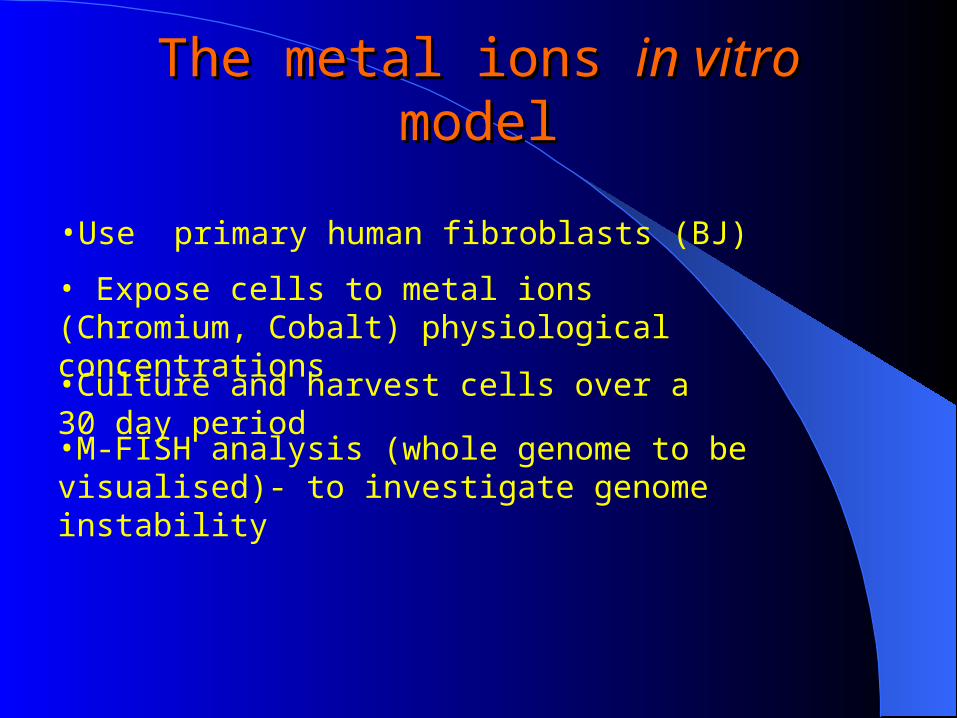
The metal ions The metal ions in vitroin vitro model model
•Use primary human fibroblasts (BJ)
• Expose cells to metal ions (Chromium, Cobalt) physiological concentrations
•Culture and harvest cells over a 30 day period
•M-FISH analysis (whole genome to be visualised)- to investigate genome instability
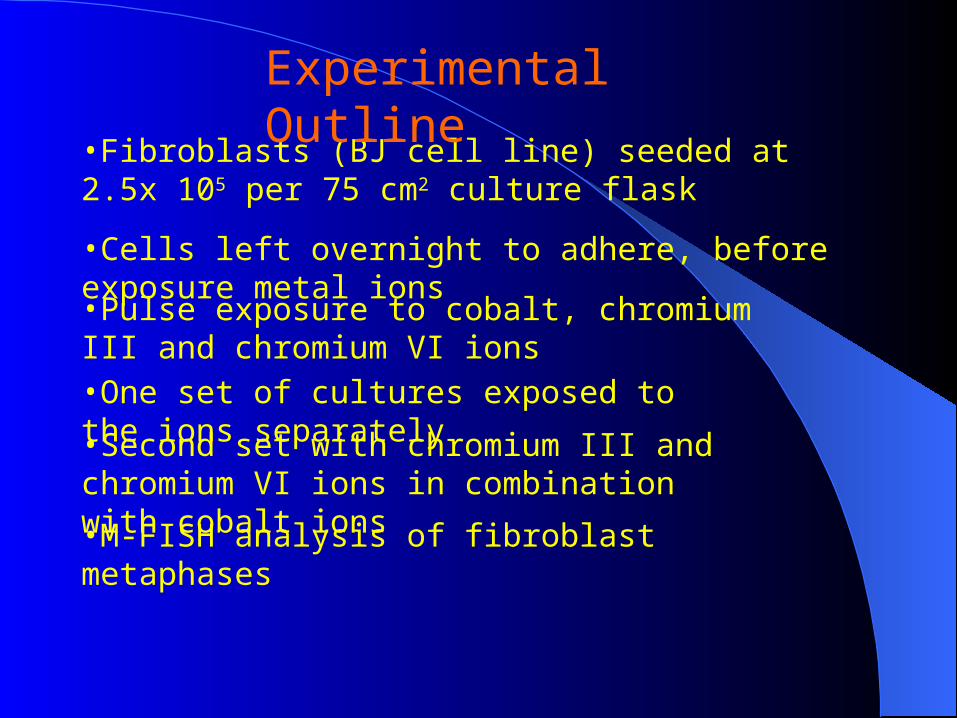
•Fibroblasts (BJ cell line) seeded at 2.5x 10⁵ per 75 cm2 culture flask
Experimental Outline
•Cells left overnight to adhere, before exposure metal ions
•Pulse exposure to cobalt, chromium III and chromium VI ions•One set of cultures exposed to the ions separately
•Second set with chromium III and chromium VI ions in combination with cobalt ions
•M-FISH analysis of fibroblast metaphases
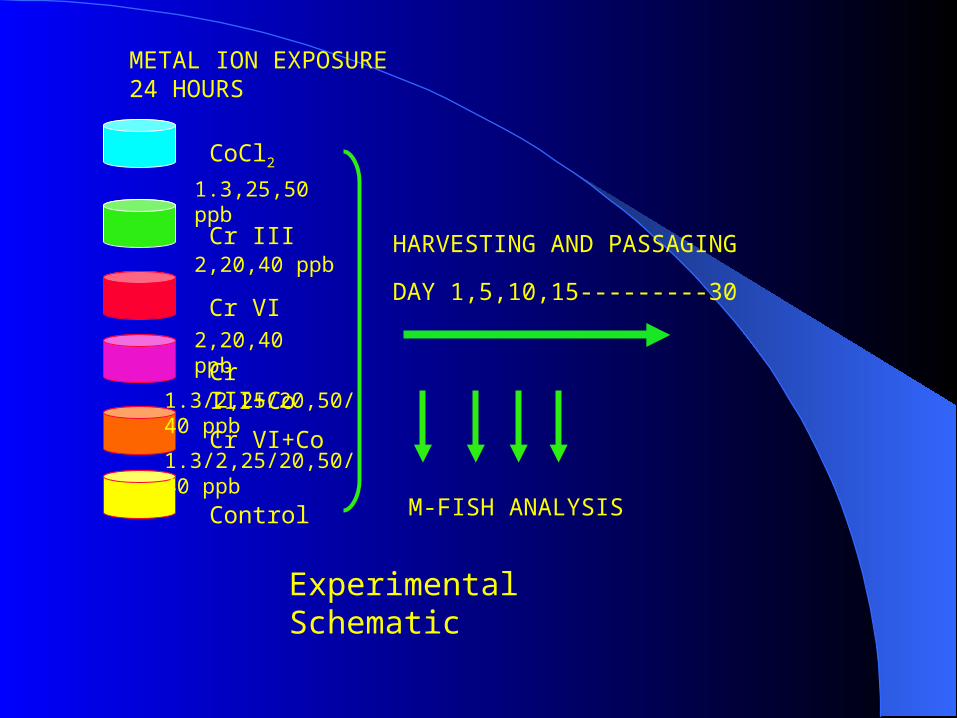
CoCl2
Cr III
Cr VI
Cr III+Co
Cr VI+Co
Control
HARVESTING AND PASSAGING
DAY 1,5,10,15---------30
METAL ION EXPOSURE 24 HOURS
M-FISH ANALYSIS
Experimental Schematic
1.3,25,50 ppb
2,20,40 ppb
2,20,40 ppb
1.3/2,25/20,50/40 ppb
1.3/2,25/20,50/40 ppb
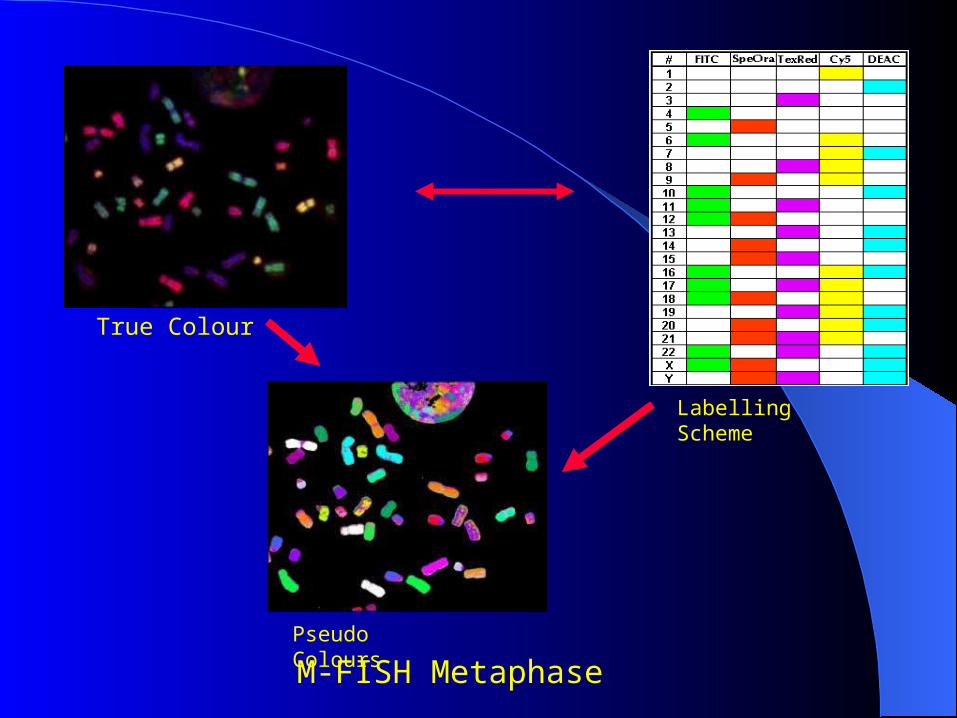
M-FISH Metaphase
True Colour
Labelling Scheme
Pseudo Colours
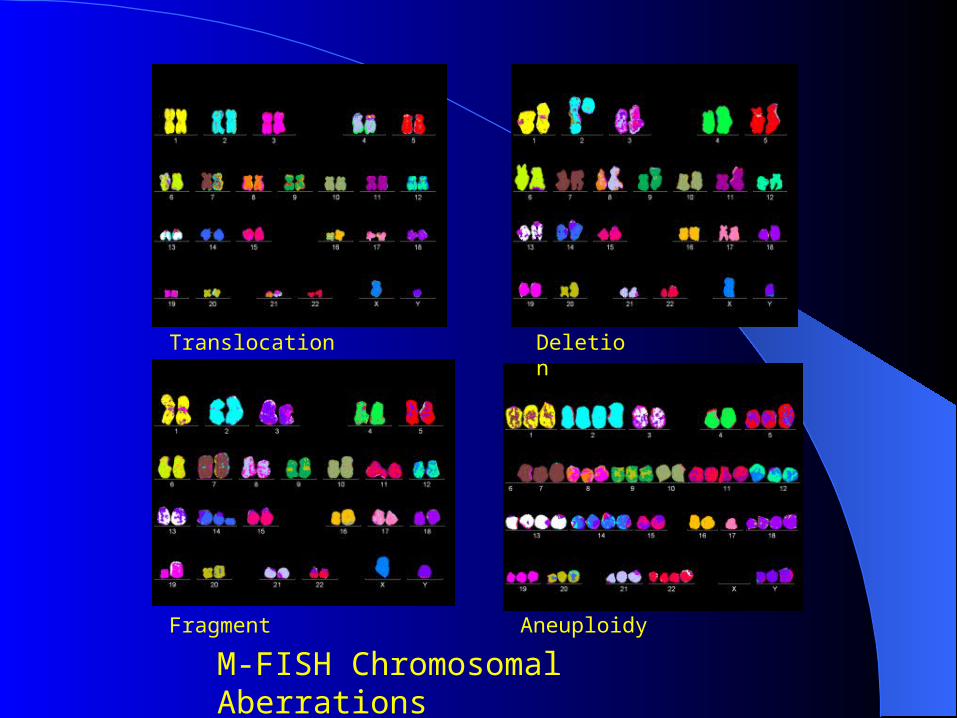
M-FISH Chromosomal Aberrations
Translocation Deletion
Fragment Aneuploidy
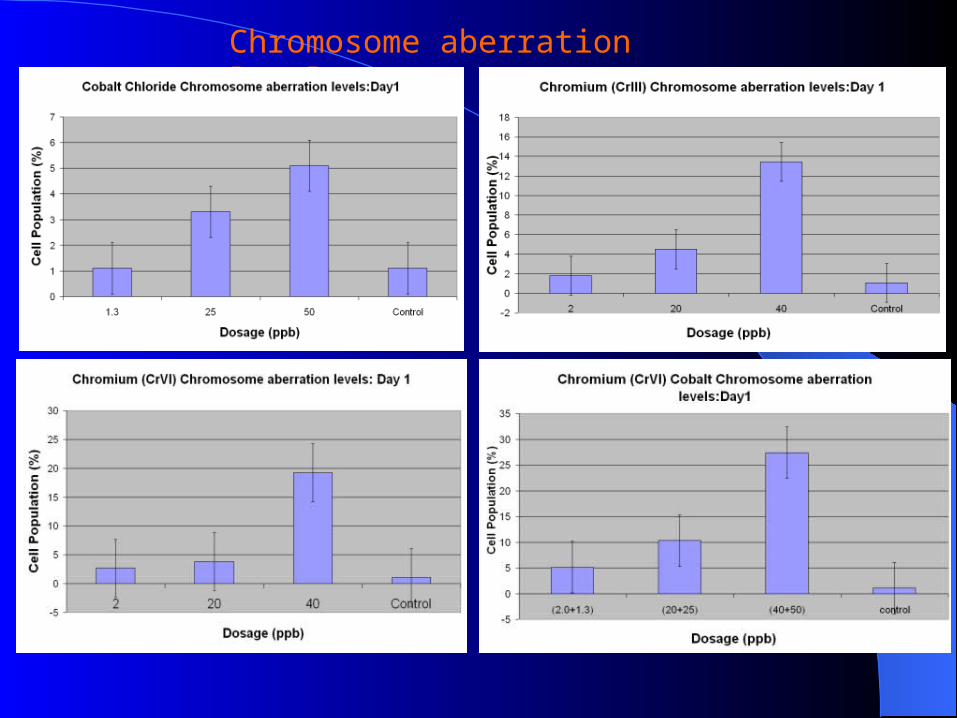
Chromosome aberration levels
Do these aberration levels change overtime?
What is the composition of the aberrations, is there a pattern?
15
1015202530
15
1015202530
15
1015202530
15
1015202530
0 .02
12
5.0
425
.06
37
5.0
85
.10
63
.12
75
.14
87
0 .02
12
5.0
425
.06
37
5.0
85
.10
63
.12
75
.14
87
0 .02
12
5.0
425
.06
37
5.0
85
.10
63
.12
75
.14
87
0 .02
12
5.0
425
.06
37
5.0
85
.10
63
.12
75
.14
87
0 .02
12
5.0
425
.06
37
5.0
85
.10
63
.12
75
.14
87
Co, 0:0
Co, 0:1.3
Co, 0:25
Co, 0:50
CrIII, 0:0
CrIII, 2:0
CrIII, 20:0
CrIII, 40:0
CrVI, 0:0
CrVI, 2:0
CrVI, 20:0
CrVI, 40:0
CrIII+Co, 0:0
CrIII+Co, 2:1.3
CrIII+Co, 20:25
CrIII+Co, 40:50
CrVI+Co, 0:0
CrVI+Co, 2:1.3
CrVI+Co, 20:25
CrVI+Co, 40:50
Da
y
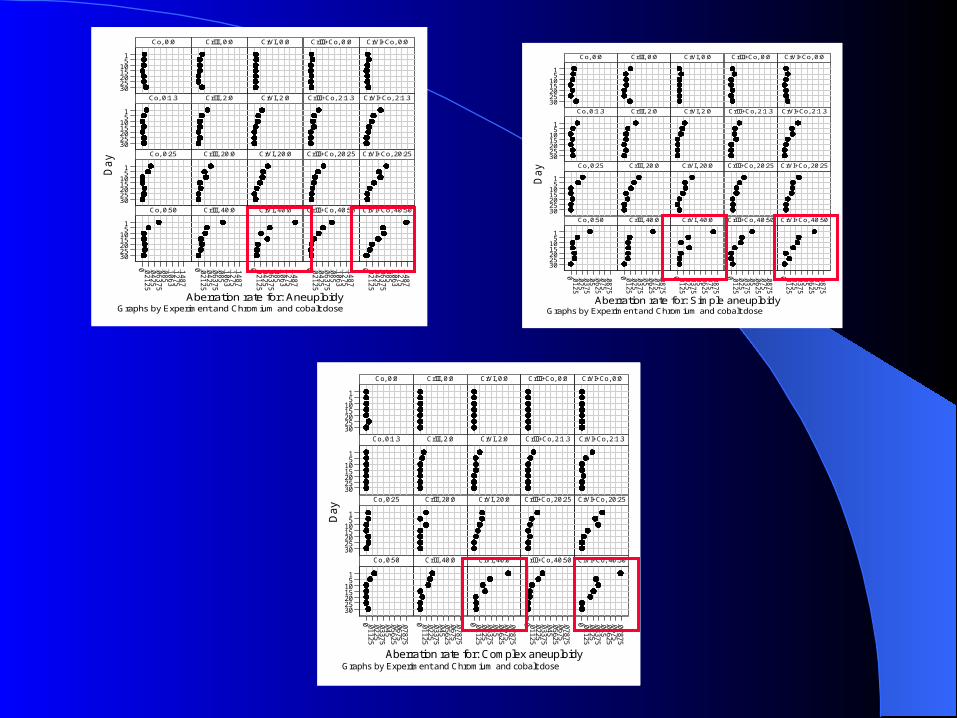
Aberration rate for: AneuploidyGraphs by Experiment and Chromium and cobalt dose
15
1015202530
15
1015202530
15
1015202530
15
1015202530
0 .01
25
.02
5.0
375
.05
.06
25
.07
5.0
875
0 .01
25
.02
5.0
375
.05
.06
25
.07
5.0
875
0 .01
25
.02
5.0
375
.05
.06
25
.07
5.0
875
0 .01
25
.02
5.0
375
.05
.06
25
.07
5.0
875
0 .01
25
.02
5.0
375
.05
.06
25
.07
5.0
875
Co, 0:0
Co, 0:1.3
Co, 0:25
Co, 0:50
CrIII, 0:0
CrIII, 2:0
CrIII, 20:0
CrIII, 40:0
CrVI, 0:0
CrVI, 2:0
CrVI, 20:0
CrVI, 40:0
CrIII+Co, 0:0
CrIII+Co, 2:1.3
CrIII+Co, 20:25
CrIII+Co, 40:50
CrVI+Co, 0:0
CrVI+Co, 2:1.3
CrVI+Co, 20:25
CrVI+Co, 40:50
Da
y
Aberration rate for: Simple aneuploidyGraphs by Experiment and Chromium and cobalt dose
15
1015202530
15
1015202530
15
1015202530
15
1015202530
0 .0112
5.02
25.03
375
.045
.0562
5.06
75.07
875
0 .0112
5.02
25.03
375
.045
.0562
5.06
75.07
875
0 .0112
5.02
25.03
375
.045
.0562
5.06
75.07
875
0 .0112
5.02
25.03
375
.045
.0562
5.06
75.07
875
0 .0112
5.02
25.03
375
.045
.0562
5.06
75.07
875
Co, 0:0
Co, 0:1.3
Co, 0:25
Co, 0:50
CrIII, 0:0
CrIII, 2:0
CrIII, 20:0
CrIII, 40:0
CrVI, 0:0
CrVI, 2:0
CrVI, 20:0
CrVI, 40:0
CrIII+Co, 0:0
CrIII+Co, 2:1.3
CrIII+Co, 20:25
CrIII+Co, 40:50
CrVI+Co, 0:0
CrVI+Co, 2:1.3
CrVI+Co, 20:25
CrVI+Co, 40:50
Da
y
Aberration rate for: Complex aneuploidyGraphs by Experiment and Chromium and cobalt dose
15
1015202530
15
1015202530
15
1015202530
15
1015202530
0 .0012
5.00
25.00
375
.005
0 .0012
5.00
25.00
375
.005
0 .0012
5.00
25.00
375
.005
0 .0012
5.00
25.00
375
.005
0 .0012
5.00
25.00
375
.005
Co, 0:0
Co, 0:1.3
Co, 0:25
Co, 0:50
CrIII, 0:0
CrIII, 2:0
CrIII, 20:0
CrIII, 40:0
CrVI, 0:0
CrVI, 2:0
CrVI, 20:0
CrVI, 40:0
CrIII+Co, 0:0
CrIII+Co, 2:1.3
CrIII+Co, 20:25
CrIII+Co, 40:50
CrVI+Co, 0:0
CrVI+Co, 2:1.3
CrVI+Co, 20:25
CrVI+Co, 40:50
Da
y
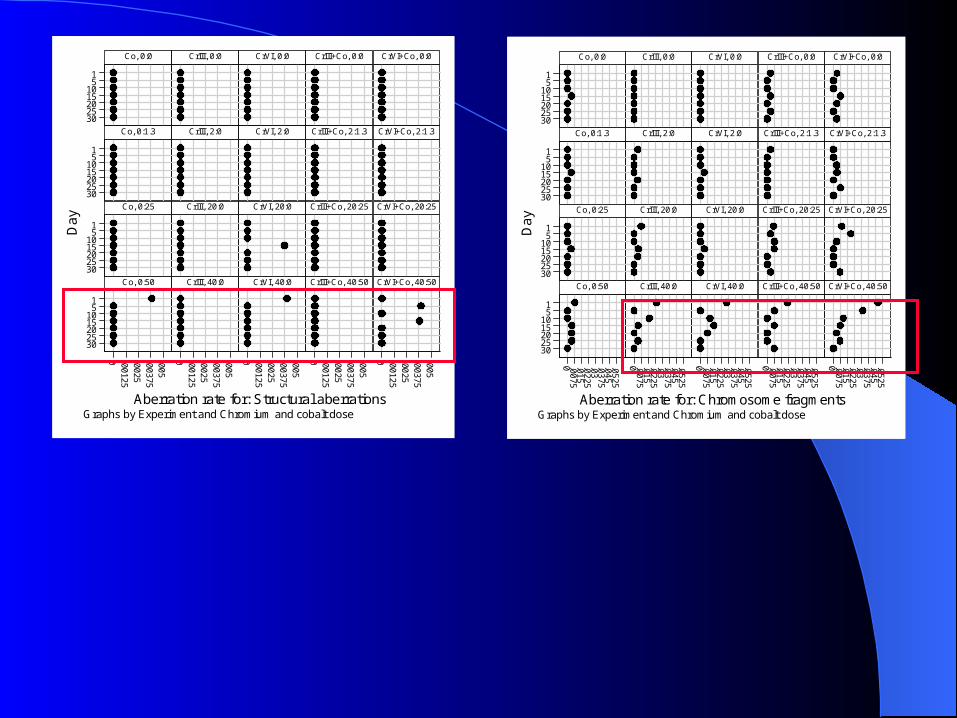
Aberration rate for: Structural aberrationsGraphs by Experiment and Chromium and cobalt dose
15
1015202530
15
1015202530
15
1015202530
15
1015202530
0 .0075
.015
.0225
.03.03
75.04
5.05
25
0 .0075
.015
.0225
.03.03
75.04
5.05
25
0 .0075
.015
.0225
.03.03
75.04
5.05
25
0 .0075
.015
.0225
.03.03
75.04
5.05
25
0 .0075
.015
.0225
.03.03
75.04
5.05
25
Co, 0:0
Co, 0:1.3
Co, 0:25
Co, 0:50
CrIII, 0:0
CrIII, 2:0
CrIII, 20:0
CrIII, 40:0
CrVI, 0:0
CrVI, 2:0
CrVI, 20:0
CrVI, 40:0
CrIII+Co, 0:0
CrIII+Co, 2:1.3
CrIII+Co, 20:25
CrIII+Co, 40:50
CrVI+Co, 0:0
CrVI+Co, 2:1.3
CrVI+Co, 20:25
CrVI+Co, 40:50
Day
Aberration rate for: Chromosome fragmentsGraphs by Experiment and Chromium and cobalt dose
**
***
***
*
***
**
****
*****
***
********
*****
***
*******
**********
*
15
1015202530
15
1015202530
15
1015202530
-.038
750 .03
875
.0775
.1163
.155
.1938
.2325
-.038
750 .03
875
.0775
.1163
.155
.1938
.2325
-.038
750 .03
875
.0775
.1163
.155
.1938
.2325
-.038
750 .03
875
.0775
.1163
.155
.1938
.2325
-.038
750 .03
875
.0775
.1163
.155
.1938
.2325
Co, 0:1.3
Co, 0:25
Co, 0:50
CrIII, 2:0
CrIII, 20:0
CrIII, 40:0
CrVI, 2:0
CrVI, 20:0
CrVI, 40:0
CrIII+Co, 2:1.3
CrIII+Co, 20:25
CrIII+Co, 40:50
CrVI+Co, 2:1.3
CrVI+Co, 20:25
CrVI+Co, 40:50
Da
y
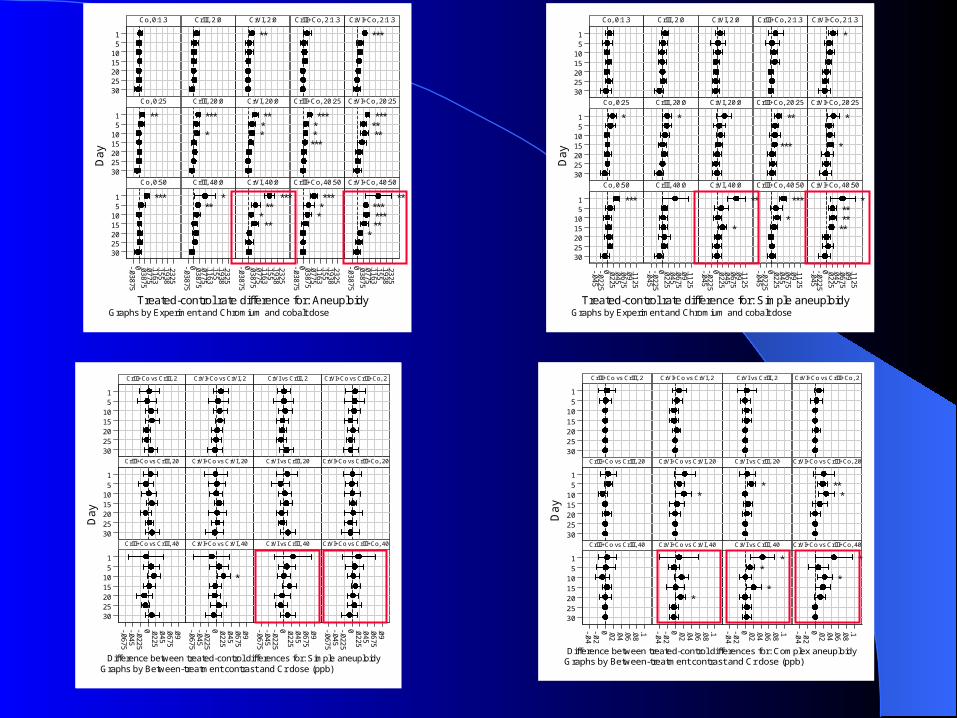
Treated-control rate difference for: AneuploidyGraphs by Experiment and Chromium and cobalt dose
*
***
*
**
*
**
***
***
*
*
*
*
*****
**
15
1015202530
15
1015202530
15
1015202530
-.045
-.022
50 .02
25.04
5.06
75.09.11
25
-.045
-.022
50 .02
25.04
5.06
75.09.11
25
-.045
-.022
50 .02
25.04
5.06
75.09.11
25
-.045
-.022
50 .02
25.04
5.06
75.09.11
25
-.045
-.022
50 .02
25.04
5.06
75.09.11
25
Co, 0:1.3
Co, 0:25
Co, 0:50
CrIII, 2:0
CrIII, 20:0
CrIII, 40:0
CrVI, 2:0
CrVI, 20:0
CrVI, 40:0
CrIII+Co, 2:1.3
CrIII+Co, 20:25
CrIII+Co, 40:50
CrVI+Co, 2:1.3
CrVI+Co, 20:25
CrVI+Co, 40:50
Da
y
Treated-control rate difference for: Simple aneuploidyGraphs by Experiment and Chromium and cobalt dose
*
*
*
**
*
***
*
*
15
10
152025
30
15
1015202530
15
1015202530
-.04
-.02
0 .02
.04
.06
.08
.1 -.04
-.02
0 .02
.04
.06
.08
.1 -.04
-.02
0 .02
.04
.06
.08
.1 -.04
-.02
0 .02
.04
.06
.08
.1
CrIII+Co vs CrIII, 2
CrIII+Co vs CrIII, 20
CrIII+Co vs CrIII, 40
CrVI+Co vs CrVI, 2
CrVI+Co vs CrVI, 20
CrVI+Co vs CrVI, 40
CrVI vs CrIII, 2
CrVI vs CrIII, 20
CrVI vs CrIII, 40
CrVI+Co vs CrIII+Co, 2
CrVI+Co vs CrIII+Co, 20
CrVI+Co vs CrIII+Co, 40
Da
y
Difference between treated-control differences for: Complex aneuploidyGraphs by Between-treatment contrast and Cr dose (ppb)
*
15
1015202530
15
1015202530
15
1015202530
-.067
5-.0
45-.0
225
0 .0225
.045
.0675
.09
-.067
5-.0
45-.0
225
0 .0225
.045
.0675
.09
-.067
5-.0
45-.0
225
0 .0225
.045
.0675
.09
-.067
5-.0
45-.0
225
0 .0225
.045
.0675
.09
CrIII+Co vs CrIII, 2
CrIII+Co vs CrIII, 20
CrIII+Co vs CrIII, 40
CrVI+Co vs CrVI, 2
CrVI+Co vs CrVI, 20
CrVI+Co vs CrVI, 40
CrVI vs CrIII, 2
CrVI vs CrIII, 20
CrVI vs CrIII, 40
CrVI+Co vs CrIII+Co, 2
CrVI+Co vs CrIII+Co, 20
CrVI+Co vs CrIII+Co, 40
Da
y
Difference between treated-control differences for: Simple aneuploidyGraphs by Between-treatment contrast and Cr dose (ppb)
SummarySummary• Initial exposure to the metal ions induce chromosomal aberrations
•Over the time period analysis metal ion induced chromosomal aberrations regresses
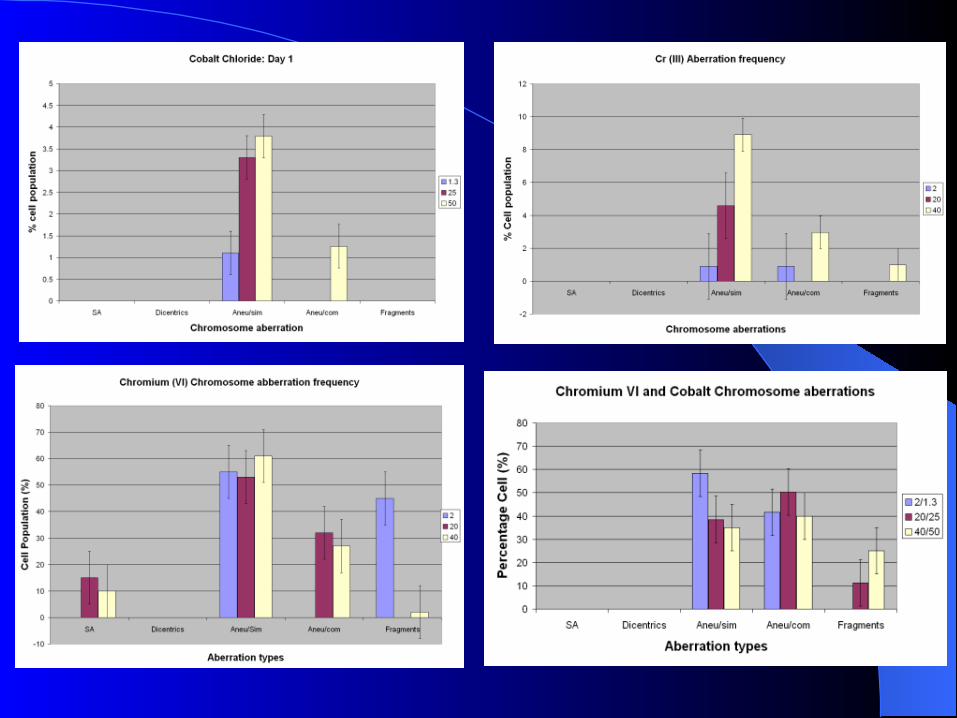
•Both CrIII and Cr VI induce simple and complex aneuploidy
•The combination of Cobalt with CrIII and CrVI results in higher levels of chromosomal aberrations
•Cr VI displays a higher incidence and persistence of complex aneuploidy overtime with and without the presence of cobalt ions
Future WorkFuture Work
• Compare metal ion results with nanoparticle experiments
•Investigate possible mechanisms causing aneuploidy eg tubulin disruption
•Prolonged exposure experiments
•Investigations with cell lines defective in DNA repair

AcknowledgementsAcknowledgementsDr CP Case
Mr A Blom
Professor I Learmonth
Dr R Newson
Grant Sponsors:
ARC
BIRC
Image Associates: M-FISH technology

Thank your for attention
Any questions?