the use of lidar for monitoring and assessing...
TRANSCRIPT

The Use of LiDAR for Monitoring and Assessing Landslides
Timothy D. Stark, F.ASCE, D.GE1; and Ahmed K. Baghdady2
1Professor, Civil and Environmental Engineering, Univ. of Illinois at Urbana-Champaign, 205 N. Mathews Ave., IL 61801. E-mail: [email protected]
2Graduate Research Assistant, Dept. of Civil and Environmental Engineering, Univ. of Illinois at Urbana-Champaign, 205 N. Mathews Ave., IL 61801. E-mail: [email protected]
Abstract: This paper illustrates techniques for assessing the location of past and future landslides using LiDAR. More importantly, this paper will use LiDAR to identify areas susceptible to large landslides which is important for hazard mapping, safe zoning, and public safety. The assessment techniques will be illustrated using the 2014 SR-530 landslide near Oso, Washington. This major and tragic landslide exhibited some important aspects of geo-mechanical behavior that will be discussed and how LiDAR and geotechnical reconnaissance can be used to avoid a future tragedy.
INTRODUCTION Geohazards due to landslide have caused widespread damage across the United States. According to the U.S. Geologic Survey (USGS), landslides cost the United States between $1 billion and $2 billion in damages and kill more than 25 people every year. Improving our understanding of landslide failure mechanisms and triggering factors is crucial to enhancing hazard and risk assessment procedures. The first step towards a reasonable assessment of areas susceptible to landslides is acquiring an accurate topographic survey through which morphological features can be characterized. Light detection and ranging (LiDAR) - also known as airborne laser scanning (ALS), airborne laser swath mapping (ALSM) - is a relatively new technology that helps identifying topography with a reasonably high resolution. Several studies have demonstrated the significance of LiDAR data in identifying landslide prone areas and even locating previously unmapped landslides. (Haneberg et. al, 2009).
In the present case study, a 0.91 m resolution digital elevation model (DEM) acquired with airborne LiDAR has been used to understand the behaviour of the 2014 SR-530 landslide near Oso, Washington. The 2014 landslide provides the industry with some lessons for future mapping of landslide prone areas that are discussed
Geo-Chicago 2016 GSP 269 596
© ASCE
herein. A separate paper presents the failure mechanism and material properties derived from an investigation into the 2014 SR-530 Landslide (Stark et. al, 2016).
SR-530 LANDSLIDE On 22 March 2014, a catastrophic landslide destroyed the Steelhead Haven community near Oso along the North Fork of the Stillaguamish River in Snohomish County, Washington. The landslide is referred to as the SR-530 landslide because the slide debris buried Washington State Route 530 (SR-530) that connects Arlington and Darrington, Washington. The landslide is considered the deadliest landslide event in the American history (Keaton et al., 2014), tragically destroying more than 40 homes and killing 43 people. The slide involved approximately 8.3 million cubic meters of glacial deposits and water filled colluvium from prior landslides present along the slope toe. The 2014 slide debris travelled more than 1.5 km to its distal edge on the south side of SR530.
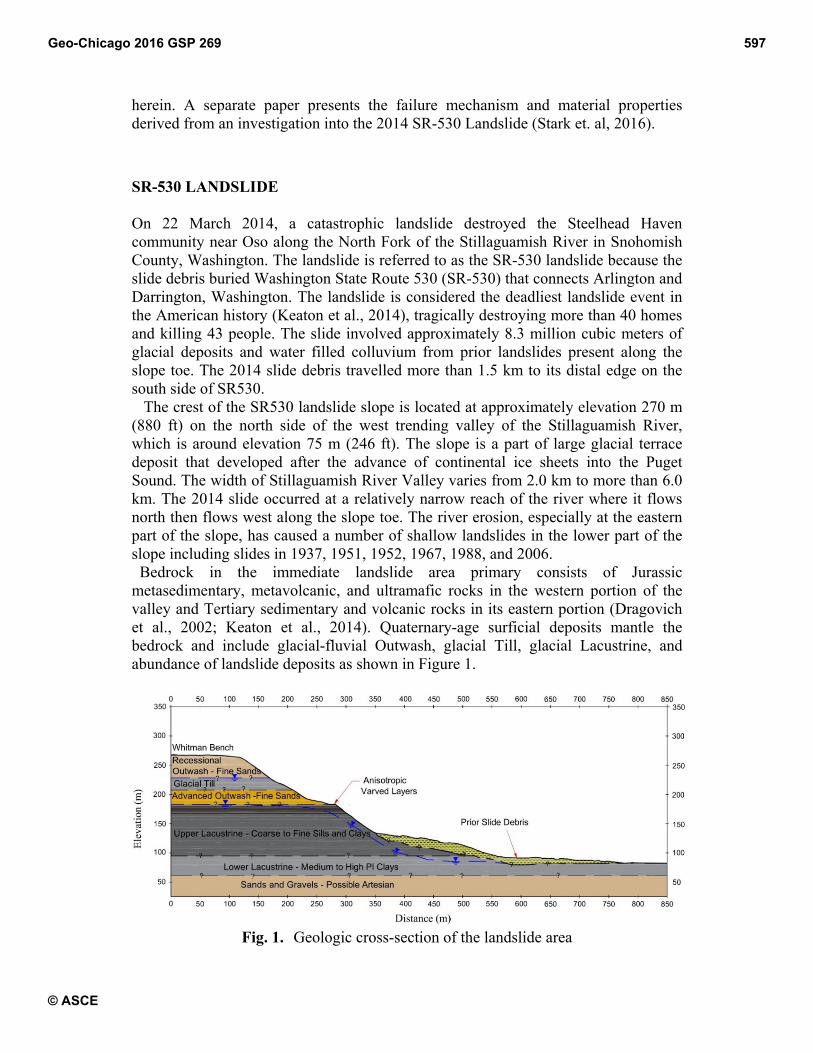
The crest of the SR530 landslide slope is located at approximately elevation 270 m (880 ft) on the north side of the west trending valley of the Stillaguamish River, which is around elevation 75 m (246 ft). The slope is a part of large glacial terrace deposit that developed after the advance of continental ice sheets into the Puget Sound. The width of Stillaguamish River Valley varies from 2.0 km to more than 6.0 km. The 2014 slide occurred at a relatively narrow reach of the river where it flows north then flows west along the slope toe. The river erosion, especially at the eastern part of the slope, has caused a number of shallow landslides in the lower part of the slope including slides in 1937, 1951, 1952, 1967, 1988, and 2006. Bedrock in the immediate landslide area primary consists of Jurassic metasedimentary, metavolcanic, and ultramafic rocks in the western portion of the valley and Tertiary sedimentary and volcanic rocks in its eastern portion (Dragovich et al., 2002; Keaton et al., 2014). Quaternary-age surficial deposits mantle the bedrock and include glacial-fluvial Outwash, glacial Till, glacial Lacustrine, and abundance of landslide deposits as shown in Figure 1.
Fig. 1. Geologic cross-section of the landslide area
Geo-Chicago 2016 GSP 269 597
© ASCE

LiDAR DATA Topographic conditions before and after the 2014 SR530 slope are documented in a series of high resolution airborne LiDAR surveys taken prior the 2006 landslide event (2003) and prior to and after the 2014 SR530 landslide event. Analysis of the LiDAR topographic relief images shows many large prehistoric landslides including one at the location of the 2014 slide. The significant feature of these prehistoric landslides is they all involve the upper glacial terrace, i.e., the Whitman Bench, and are not just shallow slides along the slope toe caused by river erosion. The occurrence of an ancient slide at the location of the 2014 slide is important because it created the Ancient Landslide Bench shown in Fig. 2 that supported and protected the Whitman Bench from the shallow slides below caused by river toe erosion. Based on the geometry of neighboring slides shown in Fig. 2, it is anticipated the ancient landslide at this location occurred through the weak varved lacustrine layers in the upper Glacial Lacustrine deposit and involved the overlying Whitman Bench. After this slide, a bench or ledge was created that buttressed the overlying Whitman Bench and protected the Whitman Bench slope from shallow slides and river toe erosion
Fig. 2. LiDAR-derived topography showing the SR530 landslide in context with
the Ancient Landslide Bench (see shaded area).
Geo-Chicago 2016 GSP 269 598
© ASCE

HISTORICAL LANDSLIDE DATA
The 2014 SR530 landslide occurred in a slope with a history of prior landslides Aerial photographs of the 1932 (Thorsen, 1969), 1937, 1951, 1952, 1967, 1988, and 2006 landslide events, show only the lower portion of the slope was involved and the sliding was confined to the Upper and Lower Lacustrine Clay layers. This shallow sliding removed some of the Ancient Landslide Bench but there was still sufficient width of the bench to support the overlying Whitman Bench until 2014. In each of these shallow slides, the slide mass would move the active river channel to the south away from the slope toe. The river would then start eroding the slide debris until the river was again undermining the Lower Lacustrine Clay and overlying slope. Based on the date of prior slides and aerial photographs, it took about 35 to 40 years to erode enough slide debris to initiate another shallow landslide in the Upper and Lower Lacustrine Clay layers that would remove some of the Ancient Landslide Bench especially on the eastern end.
For example, Fig. 3 presents the slope cross-section shown in Fig. 1 and the difference in slope topography in 2003 and 2013 from LiDAR images. Using the difference in topography from 2003 and 2013, the source and accumulation zones for the 2006 slide were determined and are shown in Fig. 3. These zones show the source of the 2006 slide mass is the Upper and Lower Lacustrine Clays and the resulting slide debris moved the river to the southern extent of the accumulation zone. This is important for concluding the Stillaguamish River did not contribute to the 2014 slide because the river was significantly south of the slope toe.
More importantly, Fig. 3 shows the upper portion of the source zone removed about 21 lineal meter of the Ancient Landslide Bench at this cross-section location, i.e., eastern end of the bench. Fig. 3 shows most of the eastern side of the Ancient Landslide Bench was removed by prior shallow slides and provided little support to the overlying Whitman Bench compared to the wide bench at the western end. The eastern portion of the Ancient Landslide Bench was significantly thinner than the western end because the river flows almost directly north into the slope on the eastern end and then runs parallel to the slope toe towards the west. For example, Fig. 4 shows the river cutting deeper into the slope on the eastern end than the western end in 1947, 1951, 1965, and 2006. As a result, more of the Ancient Landslide Bench was removed by the prior shallow slides on the eastern end than the western end, which left the Whitman Bench marginally stable on the eastern end.
Fig. 4 also shows the changes in the Stillguamish River channel with time and shows the river channel was pushed south after the 1967 and 2006 slides. In each case, these shallow slides were triggered by river erosion undermining the slope toe and the shallow slides removed some of the Ancient Landslide Bench but did not involve the overlying Whitman Bench. Stability analysis of the 1967 and 2006 slopes shows that the factor of safety decreased from 1.18 to 1.02 due to the toe erosion over these 39 years. Therefore, the lower portion of the slope was marginally stable even after a shallow slide event.
Fig. 5 shows the northward progression of the scarps into the Ancient Landslide Bench on the eastern end from 1967 to 2013, which left the Whitman Bench essentially unsupported after the 2006 slide. These recent V-shaped headscarps (see
Geo-Chicago 2016 GSP 269 599
© ASCE

Fig. 5) show the headscarps are retrogressing towards the Whitman Bench and cutting into the Ancient Landslide Bench that was supporting the upper Whitman Bench. Comparison between the pre- and post- topography of the 2006 landslide extracted from LiDAR datasets also indicates that approximately 21 lineal meters (70 ft) of the bench had been removed by the 2006 landslide (Badger, 2015).
Fig. 3. Differences in surface topography 2003 and 2013 and locations of source
and accumulation zones for 2006 slide. 2014 LANDSLIDE
The 2014 landslide is significantly different than the shallow 1937, 1951, 1952, 1967, 1988, and 2006 slides. The slide mass involved in the 2014 slide is much greater than in previous slide and its mobility was much greater resulting in a slide mass travelling more than 1.5 km in comparison to not more than 250 m (820 ft) in previous shallow slides (Iverson, 2015). The main reason behind the 2014 landslide behavior is the Whitman Bench was marginally stable after the 2006 slide, as there was not enough material remaining on the eastern end of the Ancient Landslide Bench to support the Whitman Bench. The 2014 slide mass had a large potential energy because it involved the upper portion of the slope and pushed the water filled and saturated colluvium that had accumulated along the slope toe across the valley enabling it to flow almost 1.5 km (See Fig.1 ).
Geo-Chicago 2016 GSP 269 600
© ASCE

Fig. 4. Changes in Stillaguamish River Channel between 1933 and 2014 due to
prior shallow landslides and location of first 2014 slide.
Fig. 5. Historic Landslide Scarps from 1952 to 2013.
Geo-Chicago 2016 GSP 269 601
© ASCE

LANDSLIDE HAZARD MAPPING
Understanding the failure mechanism for the large landslide in the Stillaguamish River Valley is important for guiding future landslide hazard mapping using LiDAR images, which was expanded by the state legislature after the 2014 landslide. LiDAR images should be used to identify the following two slope configurations that can result in a high elevation landslide that can have a large runout: (1) areas where the entire slope, i.e., upper terrace, has been oversteepened and/or undermined by prior sliding, river erosion, or other activity so they exhibit a steep and high slope and (2) areas that are not steep over the entire slope because of a significant colluvial deposit along the slope toe but do exhibit an ancient landslide bench that is not sufficiently wide to support the upper terrace (2014 landslide). Both of these areas should be identified and labeled as high risk because the upper portion of the slope has high potential energy that can push the involved slope deposits into and possibly across the valley instead of stopping at or near the river as the low elevation landslides do.
Therefore, slope height alone is not a good indicator because many other slopes along the valley have a similar height but the ancient landslide bench supporting the upper terrace, i.e., Whitman Bench, has not been compromised as it was on the eastern end of the 2014 slide area. If the ancient landslide bench is still sufficiently wide to support the upper terrace or Whitman Bench, only shallow slides in the lower portion of the slope will occur which will only impact the river and not the majority of the valley as occurred in 1937, 1951, 1952, 1967, 1988, and 2006.
A slide could involve the Whitman Bench and not impact the valley as occurred in 2014 if the ancient landslide bench is wide enough to slow down or stop the slide mass so it does not cascade off the bench and push or bulldoze the colluvium along the lower portion of the slope across the valley as in 2014. So the key issue for hazard mapping is assessing the width and ability of an ancient landslide bench to support and/or arrest any slide movement that involves the Whitman Bench because it is located about 200 m (650 ft) above the river and has considerable potential energy that could push slope materials into the valley. Figure 6 shows a number of ancient landslide benches supporting the Whitman Bench. The green shaded areas are Ancient Landslide Benches that are currently wide enough to support the upper portion of the slope and they have no potential to create a large and highly mobile landslide similar to the 2014 SR530 Landslide.
Geo-Chicago 2016 GSP 269 602
© ASCE
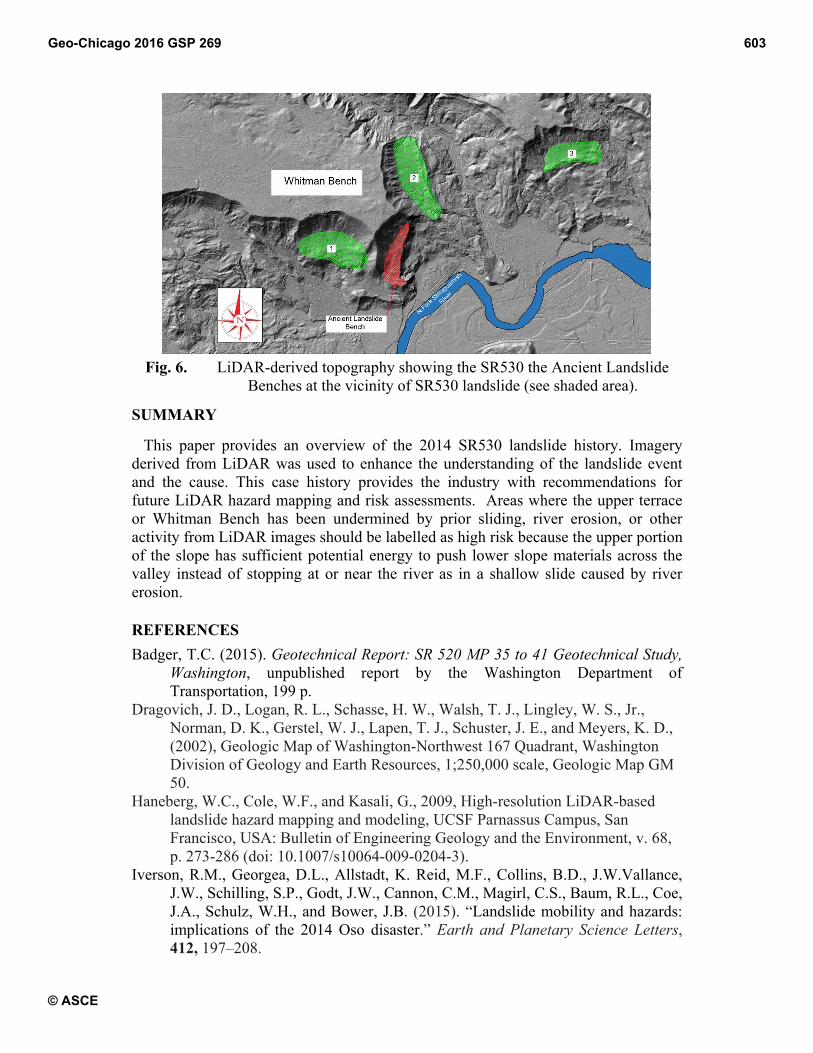
Fig. 6. LiDAR-derived topography showing the SR530 the Ancient Landslide
Benches at the vicinity of SR530 landslide (see shaded area).
SUMMARY
This paper provides an overview of the 2014 SR530 landslide history. Imagery derived from LiDAR was used to enhance the understanding of the landslide event and the cause. This case history provides the industry with recommendations for future LiDAR hazard mapping and risk assessments. Areas where the upper terrace or Whitman Bench has been undermined by prior sliding, river erosion, or other activity from LiDAR images should be labelled as high risk because the upper portion of the slope has sufficient potential energy to push lower slope materials across the valley instead of stopping at or near the river as in a shallow slide caused by river erosion.
REFERENCES
Badger, T.C. (2015). Geotechnical Report: SR 520 MP 35 to 41 Geotechnical Study, Washington, unpublished report by the Washington Department of Transportation, 199 p.
Dragovich, J. D., Logan, R. L., Schasse, H. W., Walsh, T. J., Lingley, W. S., Jr., Norman, D. K., Gerstel, W. J., Lapen, T. J., Schuster, J. E., and Meyers, K. D., (2002), Geologic Map of Washington-Northwest 167 Quadrant, Washington Division of Geology and Earth Resources, 1;250,000 scale, Geologic Map GM 50.
Haneberg, W.C., Cole, W.F., and Kasali, G., 2009, High-resolution LiDAR-based landslide hazard mapping and modeling, UCSF Parnassus Campus, San Francisco, USA: Bulletin of Engineering Geology and the Environment, v. 68, p. 273-286 (doi: 10.1007/s10064-009-0204-3).
Iverson, R.M., Georgea, D.L., Allstadt, K. Reid, M.F., Collins, B.D., J.W.Vallance, J.W., Schilling, S.P., Godt, J.W., Cannon, C.M., Magirl, C.S., Baum, R.L., Coe, J.A., Schulz, W.H., and Bower, J.B. (2015). “Landslide mobility and hazards: implications of the 2014 Oso disaster.” Earth and Planetary Science Letters, 412, 197–208.
Geo-Chicago 2016 GSP 269 603
© ASCE

Keaton, J.R., Wartman, J., Anderson, S., Benoit, J., deLaChapelle, J., Gilbert, R.B., and Montgomery, D. R. (2014). “The 22 March 2014 Oso Landslide, Snohomish County, Washington.” unpublished report by Geotechnical Extreme Event Reconnaissance (GEER), funded by the National Science Foundation, 228 p.
Stark, T.D., Baghdady, A.K., Hungr, O., and Aaron, J. (2016). “SR530 Landslide – Failure Mechanism and Material Properties.” SUBMITTED TO Journal of Geotechnical and Geoenvironmental Engineering, ASCE, September, 30 p.
Thorsen, G. W., (1969), Landslide of January 1967 which diverted the North Fork of the Stillaguamish River near Hazel, Memorandum dated November 28, 1969, to Marshall T. Huntting, Department of Natural Resources, Geology & Earth Resources Division, Olympia, WA.
Geo-Chicago 2016 GSP 269 604
© ASCE