the use of habitat suitability index map for designing ... imron et... · terrain map of indonesia...
TRANSCRIPT
Asian Journal of Conservation Biology, July 2016. Vol. 5 No. 1, pp. 31-39 AJCB: FP0070
ISSN 2278-7666 ©TCRP 2016
The Use of Habitat Suitability Index Map for Designing Population
Monitoring of Banteng (Bos javanicus) in Alas Purwo National
Park-East Java-Indonesia
Muhammad Ali Imron1, Hervina Marda Hastuti1, Ryan Adi Satria1, Mas’ud Ashari3, Rudijanta2, Sandy Nur-
viantoa, Subeno1, Satyawan Pudyatmoko1
1Institution for Ryan Adi Satria, please change into c Javan Wildlife Institute, Dusun Beluran Rt 03, Desa Sidomoyo Godean, Sle-
man Yogyakarta, Indonesia 2Institution for Mas'ud Ashari , please change into a Faculty of Forestry, Universitas Gadjah Mada, Jl. Agro No. 1 Bulaksumur,
Yogyakarta 55281, Indonesia 3PT Matahari Kahuripan Indonesia (MAKIN Group), Jl. K.H. Wahid Hasyim 188-190, Jakarta Pusat, Indonasia
(Accepted June 25, 2016)
ABSTRACT
Despite banteng is assigned as conservation priority species and its population is expected to increase by
10% in the wild, systematic and accurate population estimation including in the Alas Purwo National
Park has been hampered by incomplete estimation. We studied habitat suitability index (HSI) map
model to predict the distribution of banteng in the park as the basis for selecting areas for population
monitoring. The presence of banteng was collected from 2007-2012 based on ranger reports in the field,
whereas pseudo-absence data were generated randomly. We tested 548 points for Binomial Multiple
Logistic Regression analyses and evaluated four different scenarios of habitat factor for predicting the
presence of banteng, and compared their Kappa Index of Agreement for validation analysis. The pres-
ence of banteng was explained by elevation, distance from the beach/ seashore, distance from water/
rivers and distance from roads. The results from the binomial multiple logistic regression then extrapo-
lated to the whole park and resulted in 8441.93 hectares of high suitability area. For establishing a reli-
able population estimation of banteng in the park, surveys should focus on four blocks with the total
area of 9846.69 hectares, which are combination highly suitable area and some suitable areas.
Keywords: Alas Purwo National Park, binomial multiple logistic regression, banteng conservation, habitat
selection, population monitoring.
INTRODUCTION
Banteng (Bos javanicus d’Alton 1832) is the second
remaining largest mammals after Javan rhino on the
Java island, the most densely populated island in the
world. Its population has been threatened by many
factors, i.e. poaching, predators, habitat destruction and
fragmentation in the last century (Pudyatmoko 2004;
Timmins et al., 2015). The conservation status of this
large mammal is Endangered under the current review
of IUCN Red List of Threatened Species (Timmins et
al., 2015) and has been assigned as protected species
(Indonesia 1999) and as a high priority species for
conservation by Indonesian government (Menteri
Kehutanan 2008).
Indonesian government set a target for population
increment at 10% for all species conservation priority,
including banteng population (Menteri Kehutanan
2008). Thus, to provide an accurate measure of conser-
vation programs, population estimation of banteng is a
crucial step as a successful indicator. Recent estimates
showed that Banteng populations were distributed in a
few protected areas on Java Island, which unfortunately
isolation among those protected areas are occurring
(Pudyatmoko 2004). Despite many protected areas on
Java island play important roles for the last remaining
*Corresponding Author’s E-mail: [email protected] 31
habitat for banteng, accurate information about banteng
population and distribution in each protected area is
rarely available. The Alas PurwoNational Park (APNP)
is one of important habitat for banteng in the southeast
corner of the Java island. Population estimation in this
park showed a significant reduction from 300-400 indi-
viduals in 1993 to 80 individuals in 2002(Pudyatmoko
2004; Timmins et al., 2015). However, existing estima-
tion only relied on a concentration count method which
has been applied in a single feeding ground of Sadengan
in the park, whereas, a large area of the APNP, particu-
larly in the core area, never been surveyed, due to logis-
tical and financial issues. Providing population estima-
tion and monitoring for banteng in the APNP should fit
into cost effectiveness consideration. Therefore, an ap-
proach for predicting the potential distribution of ban-
teng in the APNP is needed for the basis of establishing
population estimation under limited condition.
The closed relationship between the presence of
species and habitat attributes have encouraged to use
habitat to predict species distribution (Hirzel, Randin,
and Guisan 2006; Hirzel and Lay 2008). Predicting the
distribution of wildlife can be done using quality or
suitability of certain species using habitat factors which
affect the density of wildlife, commonly call habitat
suitability index (HSI) (M. L. Morrison, Marcot, and
Mannan 2006). The HSI map is one of the important
approaches to predict the distribution of various birds
(Michael A Larson et al., 2004; Jacquin et al., 2005;
Alamets and Pa 2005), lemur (Lahoz-Monfort et al.
2010), carnivores (Imam, Kushwaha, and Singh 2009;
Xiaofeng et al., 2011; LaRue and Nielsen 2008; García-
Rangel and Pettorelli 2013), designing landscapes for
conservation of bear (Merrill et al., 1999), reintroduction
of Eurasian lynx (Schadt, Revilla, et al. 2002), and capy-
bara(Schivo et al., 2015).
The use of HSI for predicting species distribu-
tion is not free from critics due to the wildlife distribu-
tion hypothesis (Ray and Burgman 2006; M. L. Morri-
son, Marcot, and Mannan 2006). However, the limitation
can be reduced by the use of empirical data(Singh et al.,
2009) as well as the use presence-only data (Li, Guo, and
Elkan 2011). The use of logistic regression of presence-
absence data and presence-only data are commonly used
for conservation planning and wildlife management as
well as for population viability analysis (Li, Guo, and
Elkan 2011; Pearce and Ferrier 2000; M. A. Larson et al.
2004). For example, HSI map was used to evaluate the
effectiveness of protected areas for mammals in South-
east Asia (Catullo et al., 2008), and reintroduction of
lynx (Schadt, Revilla, et al., 2002; Schadt, Knauer, et al.,
2002). The use of habitat models for developing a reli-
able plan for conservation measure such as population
estimation, however, has rarely been done. The potential
distribution of banteng will be useful information for
developing a reliable and precise population monitoring.
This present study is aiming to seek the best model for
the development of habitat suitability index maps for
predicting the banteng distribution in the APNP. Sec-
ondly, to provide a possible design for population moni-
toring of banteng in the park. These are expected to con-
tribute to filling the gaps of distribution information of
the banteng in the park and support conservation plan,
particularly for population estimation and possible habi-
tat management.
MATERIALS AND METHODS
Study sites
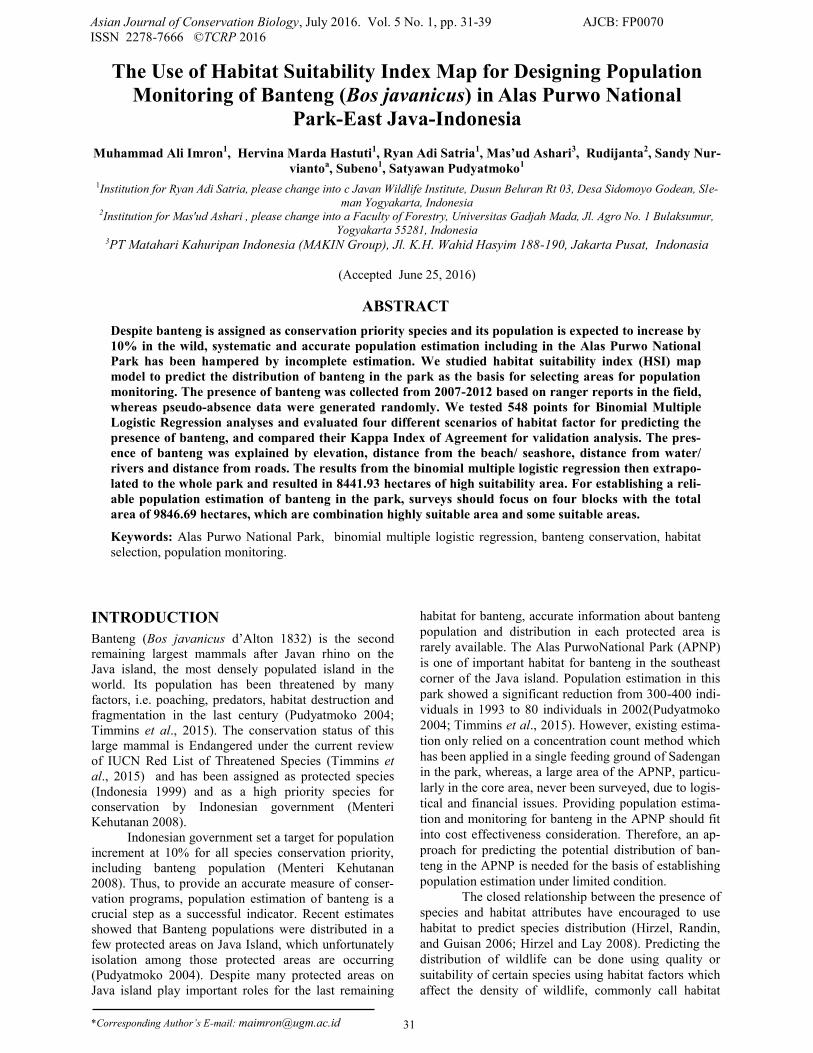
The Alas Purwo National Park (APNP) is situated in the
southeast corner of Java island, between 8° 26' 45“ - 8°
47' 00“ South and 114° 20’ 16“ - 114° 36’ 00“ East. The
total area of the APNP area is 43.420 Ha and divided into
the core zone (17,150 ha), wilderness zone (24,207 ha),
Rehabilitation zone (620 ha), Intensive use zone (660 ha)
and traditional use zone (783 ha). The APNP is one of
the important national parks in Java where banteng popu-
lation has been fluctuating during the last century
(Pudyatmoko 2004). Figure 1 shows the situation of the
APNP in Southeast Java Island. The APNP has natural
and anthropogenic borders, where on the east and south
parts have Bali Strait and Indonesian ocean as the border.
On the west part of the west and north parts are having a
border with local villages and production forest. Ecosys-
tem types of the APNP vary from beach, lowland tropical
forest, Karst (limestone forest) with elevation from 0 –
322 m above sea level.
Map preparation
We used six maps for predicting the presence of banteng
i.e. slope, elevation, the normalized difference vegetation
index (NDVI), distance from the beach (DistBch), dis-
tance from roads (DistRoad) and distance from the river
(DistRiv). The terrain and elevation map were developed
by contour map with 1: 25,000 scale extracted from the
terrain map of Indonesia (Peta Rupa Bumi Indonesia)
from Badan Informasi Geospasial using Triangulated
Irregular Network (TIN) analysis under Arc GIS 10.1
software. We used Landsat 8 Images (downloaded from
http://landsat.usgs.gov) Path 116 Row 66 on 5 May 2014
(wet season) 12 October 2014 (dry season) to develop the
NDVI map. The band 4 and band 5 of the Landsat im-
ages were combined with ENVI 4.5 using Band Math
with the formula: (float(b5)-float(b4))/(float(b5)+float
(b4)). Where b4 is band 4 and b5 is band 5 of the Landsat
images. Then the NDVI map was generated using simple
formula
The DistRoad, DistRiv and DistBch were extracted from
road networks map, rivers and border from the sea re-
spectively. All those maps were originated from the RBI
map and then converted into raster and with a resolution
of 30m x 30m and used to generate data in each presence
and pseudo-absence data.
Imron et al.
32 AJCB Vol. 5 No. 1, pp. 31–39, 2016
Figure 1. Situation Map of the Alas Purwo National Park in
the south-east of Java island and the distribution of presence
and pseudo-absence points. The park is home to banteng
population. Dots represent presence and pseudo-absence from
70% of total samples. Red dots represent presence data, and
white dots are pseudo-absence data.
Presence and Pseudo-absence data collection
The presences of banteng in the field were from reports
of rangers during 2008-2012. Since rangers only col-
lected presence data, we did not use the same method for
absence data, but pseudo-absence data. Pseudo-absence
points were generated randomly within the park area. In
total 619 points of both presence and pseudo-absence
data were collected. If a pseudo-absence point was too
close to a presence data, then the point was excluded for
analysis. Finally, we only used 548 points for the HSI
map development.
Habitat Suitability Map Development and Validation
For the habitat suitability model development, we used
70% of total points (385 points) for binary logistic re-
gression analysis with the distribution of 212 presence
points and 173 pseudo-absence points. All data extracted
from raster maps then used as predictors for the presence
of banteng. IBM-SPPSS 19 was used to conduct bino-
mial multiple logistic regression (BMLR) using presence
and absence data for the response variables. The model
from BMLRT is shown as follows.
P : Binomial proportion
: second explanatory variable constant
: model constant
: explanatory variable number n
: first explanatory variable
: explanatory variable constant number -n
: first explanatory variable constant
: second explanatory variable
Since we did not know which NDVI map (either wet or
dry season) provide good predictor, we compared the
results of the analysis on both dry and wet season data.
The spatial model then developed from the results of the
best predictor model and extrapolated through all areas in
the APNP using Arc GIS 10.1. The model validation
used 30% of the total data (162 points) with 79 presence
points and 83 absence points. The points then used to
calculate the Kappa Index of Agreement – (KIA) for se-
lecting the best model. The best model then used to de-
velop a habitat suitability map of banteng using the
Raster Calculator for the whole area of the Alas Purwo
National Park. Finally, the results of the map were used
to delineate blocks for population monitoring in the park.
RESULTS
Distribution of Presence Points of banteng
Presence points of banteng from 2008-2012 data tended
to clump into certain characteristics of the habitat. The
distribution of banteng is mostly clumped into the lower
area of the APNP, particularly lower than 75 meters
above sea level (m-ASL) whereas it avoided the area
with higher than 225 m-ASL of elevation. Banteng also
sidestepped extreme steep area (> 45% slope) but it pos-
sible to occupy from gentle (0-8%) to very strong slope
(25-45%). Table 1 shows the distribution of presence of
banteng in different predictor variables.
Banteng occupancy showed a clear indication
that banteng tended to be near rivers and the sea but did
not display clearly to avoid the presence humans (roads).
Population Monitoring of Bos javanicus
33
Predictor Variables Num. of presence points Predictor Variables Num. of presence points
Elevation classes (m-asl)
Distance from roads (m)
< 75 192 0 - 5.000 58 75< - 150 17 5.000 - 10.000 15
150< - 225 3 10.000 - 15.000 112 225< - 300 0 15.000 - 20.000 13
> 300 0 20.000 - 25.000 11
> 25.000 3
Slope classes (%) Distance from sea (m)
0 - 8 169 0 - 1500 173 8< - 15 12 1500 - 3000 20
15< - 25 22 3000 - 4500 6 25< - 45 9 4500 - 6000 13
> 45 0 > 6000 0
Distance from River (m) NDVI 0 - 1000 205 (-0,194) - (-0,0366) 0
1000 - 2000 7 (-0,037) - (0,120) 6 2000 - 3000 0 (0,120) - (0,277) 25
3000 - 4000 0 (0,277) - (0,434) 150
> 4000 0 (0,434) - (0,591) 31
Table 1. Number of presence points from each predictor variables of banteng in the Alas Purwo National Park
from 2008-2012 data.
AJCB Vol. 5 No. 1, pp. 31–39, 2016
Banteng preferred to avoid an area with too far distance
from the river (> 2 km) and from mineral/salt sources (>
6 km). Although banteng did not show clear evidence of
the presence of humans, banteng seems to feel comfort-
able at a distance 10-15 km of roads. We also found that
banteng can be in proximity with human within 5 km
(Table 1). Banteng occurrences also indicate that this
large mammal on Java could tolerate various dense of
vegetation (NDVI) from relatively open to dense vegeta-
tion. However, it seems that banteng avoids too dense
and too open area (Table 1).
Predictors for the presence of banteng
During the binomial multiple logistic regression analysis,
we developed four scenarios to select the best predictor
variables. Characteristic of roads and NDVI are the main
consideration for the development of scenarios (see the
difference in Table 2). All predictor variables have a
significant contribution to predicting the presence of
banteng in the APNP, except slope. All scenarios have
significantly explained the binomial proportion of the
presence of banteng (Hosmer and Lemeshow value >
0.05). However, among all scenarios we selected the
only model with the highest value of the Negelkerke R
square, Classification table and Kappa Index of Agree-
ment (Table 2). Thus, altitude, distance from the beach,
NDVI (dry season), distance from the river and distance
from the main roads are contributing significantly to the
presence of banteng,
The final model from the binomial multi-logistic regres-
sion analysis as follow:
Suitability area for banteng
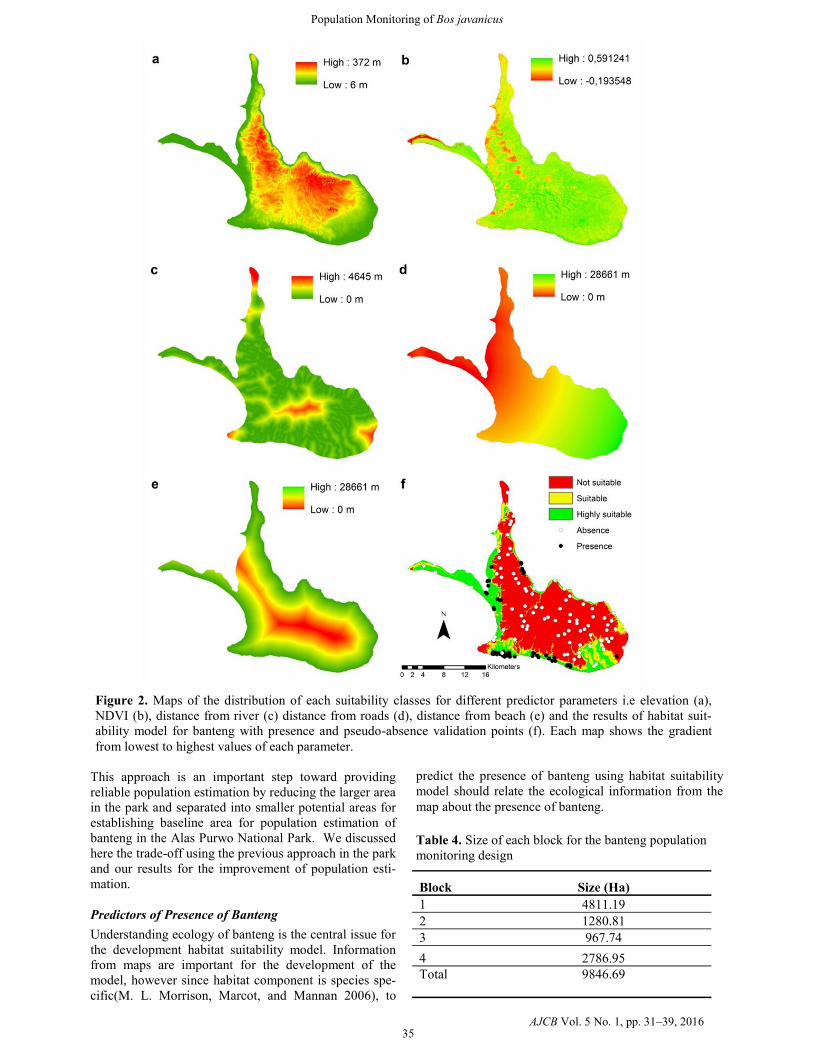
Based on the binomial multi-logistic regression model,
we extrapolated the model for the whole area of the
APNP. The largest proportion of area with not suitable
for banteng was found in the park, and less than half of
the size were suitable and highly suitable for banteng
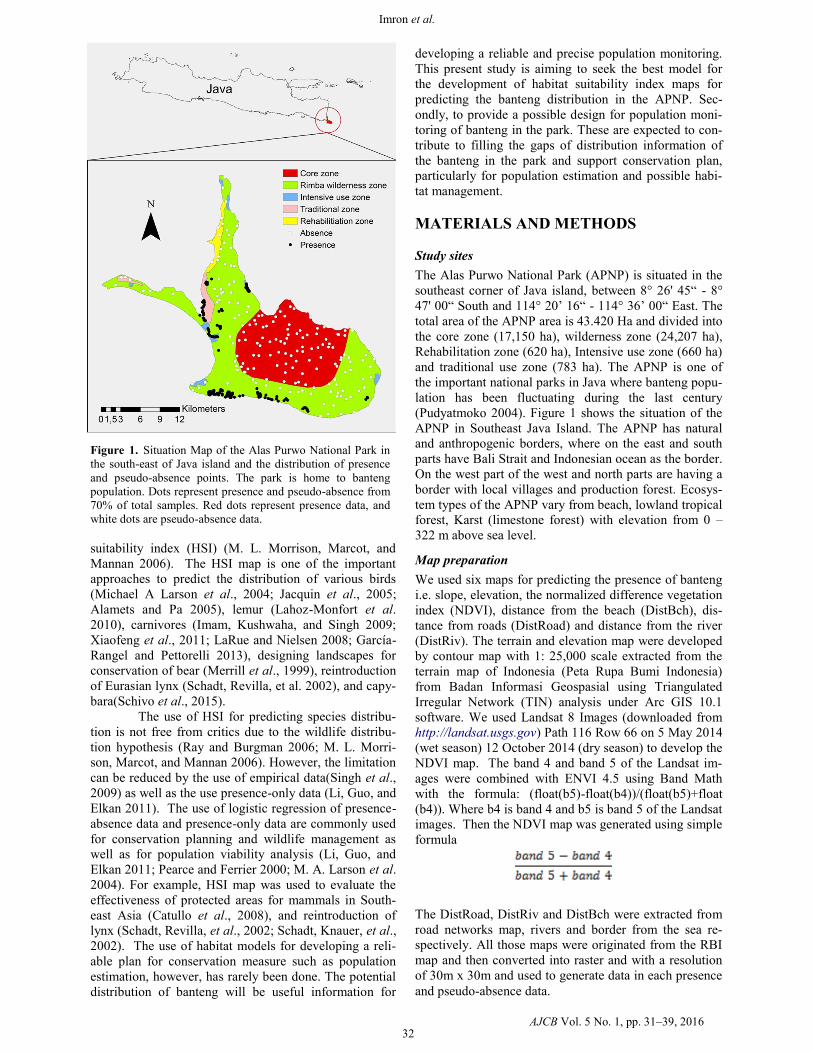
(Table 3). ). Figure 2 shows the distribution of each
class for the best predictor parameters, i.e. elevation,
NDVI, distance from the river, distance from roads, dis-
tance from the beach and the results of a habitat suitabil-
ity model for banteng with presence and pseudo-absence
validation points. The highly suitable area for the pres-
ence of banteng are mainly distributed in the west part of
the park (close to the border), and also in the south and
southeast area of the park. Only a small portion of the
north area and north coast are suitable for banteng
(Figure 2).
Table 3. Size and proportion of each suitability class in
the Alas Purwo National Park
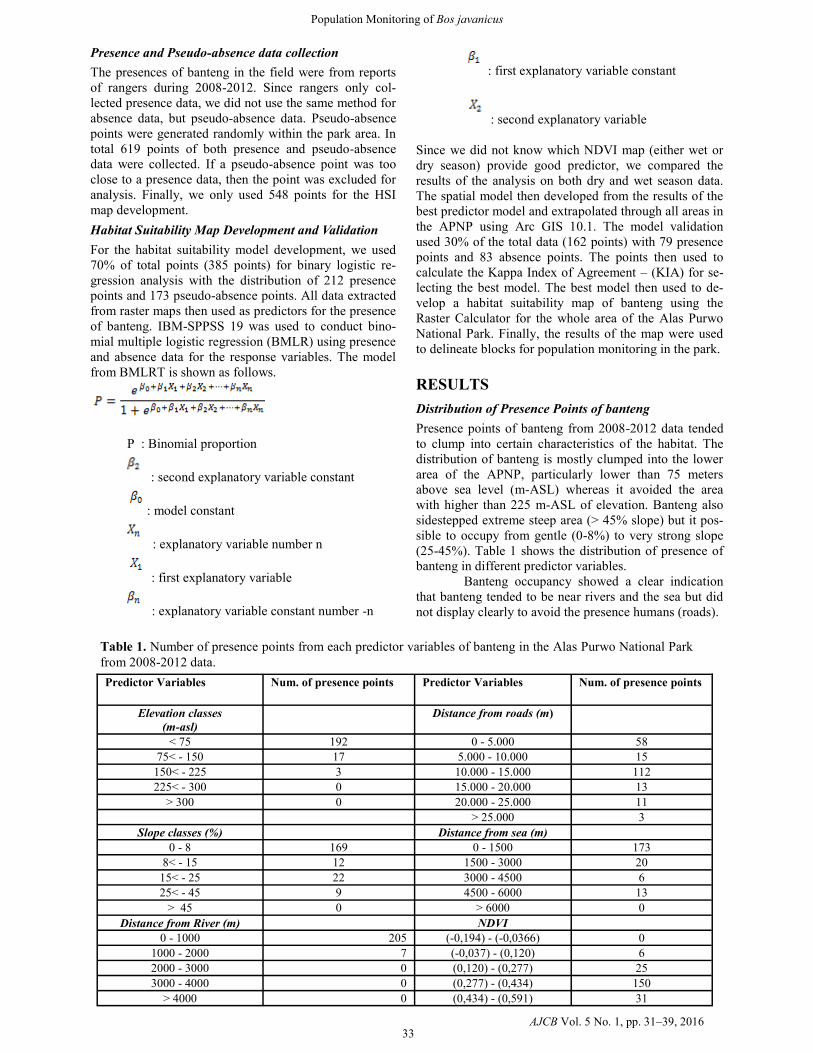
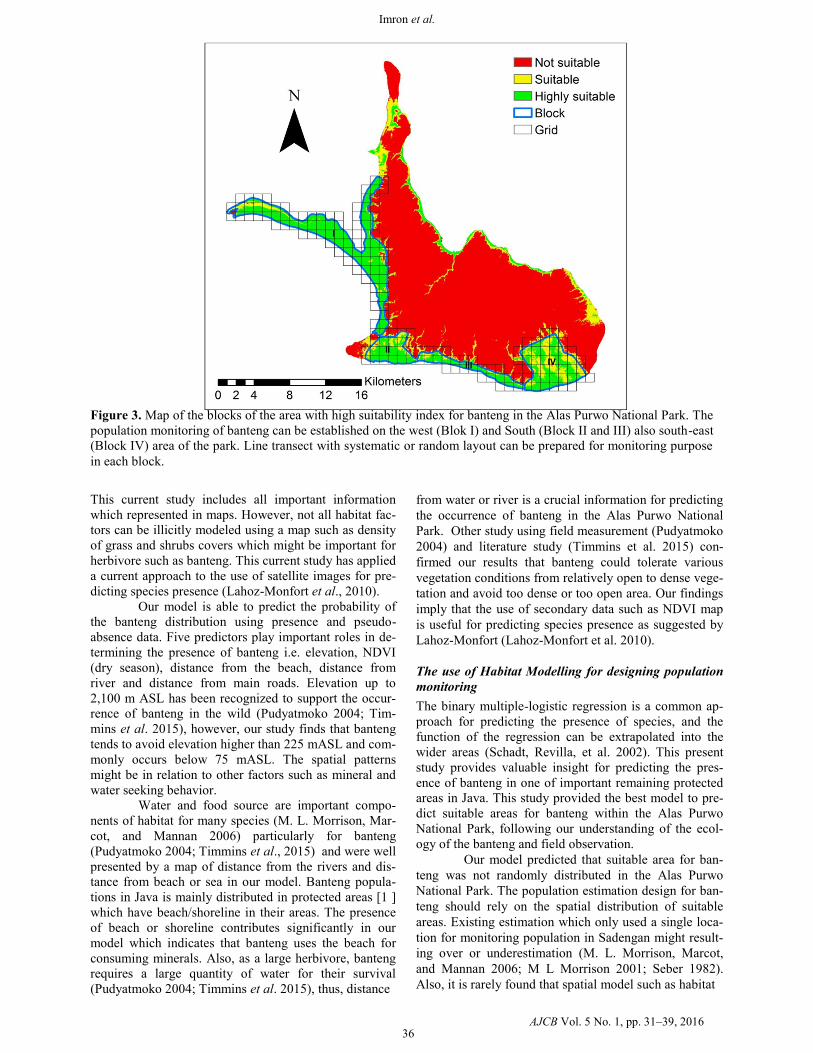
Population monitoring design
There are four possible different blocks in the park with a
high suitability index for the population monitoring
(Figure 3). In total, we could have less than 10.000 ha
for the focus of monitoring of banteng population. The
smallest size of the block is 967.74 ha which is situated
along the south coast of the APNP. Next, the Sadengan
area also has a high suitable area with a total area of
population monitoring of 1280.81 hectares, followed by
the block on the southeast coast of the park with 2,786.95
hectares. The largest area of population monitoring is
distributed from the north to the north-west area in the
park with the size of 4811.19 hectares (Table 4).
DISCUSSION
This present study demonstrated the use of available in-
formation from the field and secondary data particularly
from available maps for the development of habitat suit-
ability map for banteng in the Alas Purwo National Park.
Imron et al.
34
No
Variable
Hosmer and
Lemeshow
Test
Negelk-
erke R
Square
Classifica-
tion Table KIA
1 Altitude, distance from beach, NDVI (wet season),
distance from river, distance from roads (including
path roads)
0,124 0,702 87,0 0,692
2 Altitude, distance from beach, NDVI (wet season),
distance from river, distance from roads (only main
roads)
0,203 0,704 87,3 0,692
3 Altitude, distance from beach, NDVI (dry season),
distance from beach , dist from rivers, distance from
roads (+ path roads)
0,097 0,708 88,3 0,717
4 Altitude, dist from beach, NDVI (dry season), dist
from beach, dist from rivers, dist from roads (only
main roads)
0,061 0,711 89,1 0,729
Table 2. Results of the binary logistic analysis of different combination of predictor variables and Kappa Index of
Agreement (KIA)
Suitability Classifi-
cation
Size (ha)
Proportion (%)
Highly suitable 8441.93
19
Suitable 5347.30 12.03
Not suitable
30646.68
68.97
AJCB Vol. 5 No. 1, pp. 31–39, 2016
This approach is an important step toward providing
reliable population estimation by reducing the larger area
in the park and separated into smaller potential areas for
establishing baseline area for population estimation of
banteng in the Alas Purwo National Park. We discussed
here the trade-off using the previous approach in the park
and our results for the improvement of population esti-
mation.
Predictors of Presence of Banteng
Understanding ecology of banteng is the central issue for
the development habitat suitability model. Information
from maps are important for the development of the
model, however since habitat component is species spe-
cific(M. L. Morrison, Marcot, and Mannan 2006), to
predict the presence of banteng using habitat suitability
model should relate the ecological information from the
map about the presence of banteng.
Population Monitoring of Bos javanicus
35
Figure 2. Maps of the distribution of each suitability classes for different predictor parameters i.e elevation (a),
NDVI (b), distance from river (c) distance from roads (d), distance from beach (e) and the results of habitat suit-
ability model for banteng with presence and pseudo-absence validation points (f). Each map shows the gradient
from lowest to highest values of each parameter.
Block Size (Ha)
1 4811.19
2 1280.81
3 967.74
4 2786.95
Total
9846.69
Table 4. Size of each block for the banteng population
monitoring design
AJCB Vol. 5 No. 1, pp. 31–39, 2016
This current study includes all important information
which represented in maps. However, not all habitat fac-
tors can be illicitly modeled using a map such as density
of grass and shrubs covers which might be important for
herbivore such as banteng. This current study has applied
a current approach to the use of satellite images for pre-
dicting species presence (Lahoz-Monfort et al., 2010).
Our model is able to predict the probability of
the banteng distribution using presence and pseudo-
absence data. Five predictors play important roles in de-
termining the presence of banteng i.e. elevation, NDVI
(dry season), distance from the beach, distance from
river and distance from main roads. Elevation up to
2,100 m ASL has been recognized to support the occur-
rence of banteng in the wild (Pudyatmoko 2004; Tim-
mins et al. 2015), however, our study finds that banteng
tends to avoid elevation higher than 225 mASL and com-
monly occurs below 75 mASL. The spatial patterns
might be in relation to other factors such as mineral and
water seeking behavior.
Water and food source are important compo-
nents of habitat for many species (M. L. Morrison, Mar-
cot, and Mannan 2006) particularly for banteng
(Pudyatmoko 2004; Timmins et al., 2015) and were well
presented by a map of distance from the rivers and dis-
tance from beach or sea in our model. Banteng popula-
tions in Java is mainly distributed in protected areas [1 ]
which have beach/shoreline in their areas. The presence
of beach or shoreline contributes significantly in our
model which indicates that banteng uses the beach for
consuming minerals. Also, as a large herbivore, banteng
requires a large quantity of water for their survival
(Pudyatmoko 2004; Timmins et al. 2015), thus, distance
from water or river is a crucial information for predicting
the occurrence of banteng in the Alas Purwo National
Park. Other study using field measurement (Pudyatmoko
2004) and literature study (Timmins et al. 2015) con-
firmed our results that banteng could tolerate various
vegetation conditions from relatively open to dense vege-
tation and avoid too dense or too open area. Our findings
imply that the use of secondary data such as NDVI map
is useful for predicting species presence as suggested by
Lahoz-Monfort (Lahoz-Monfort et al. 2010).
The use of Habitat Modelling for designing population
monitoring
The binary multiple-logistic regression is a common ap-
proach for predicting the presence of species, and the
function of the regression can be extrapolated into the
wider areas (Schadt, Revilla, et al. 2002). This present
study provides valuable insight for predicting the pres-
ence of banteng in one of important remaining protected
areas in Java. This study provided the best model to pre-
dict suitable areas for banteng within the Alas Purwo
National Park, following our understanding of the ecol-
ogy of the banteng and field observation.
Our model predicted that suitable area for ban-
teng was not randomly distributed in the Alas Purwo
National Park. The population estimation design for ban-
teng should rely on the spatial distribution of suitable
areas. Existing estimation which only used a single loca-
tion for monitoring population in Sadengan might result-
ing over or underestimation (M. L. Morrison, Marcot,
and Mannan 2006; M L Morrison 2001; Seber 1982).
Also, it is rarely found that spatial model such as habitat
Imron et al.
36
Figure 3. Map of the blocks of the area with high suitability index for banteng in the Alas Purwo National Park. The
population monitoring of banteng can be established on the west (Blok I) and South (Block II and III) also south-east
(Block IV) area of the park. Line transect with systematic or random layout can be prepared for monitoring purpose
in each block.
AJCB Vol. 5 No. 1, pp. 31–39, 2016
suitability model being employed for population moni-
toring. Many studies have focusing on the use of spatial
model for population viability analysis and conservation
planning including corridor design (García-Rangel and
Pettorelli 2013; LaRue and Nielsen 2008; Schadt, Re-
villa, et al. 2002; Torres et al. 2010; Xiaofeng et al.
2011; Nikolakaki and Dunnett 2005; M. A. Larson et al.
2004). Existed studies using occupancy methods only
focusing on detecting species presence(Linkie et al.
2015; Hirzel, Randin, and Guisan 2006; García-Rangel
and Pettorelli 2013; Schadt, Revilla, et al. 2002; Hewson
et al. 2011) but missed on the use of these approach for
population monitoring. Thus, this present study provides
new insight to use existing spatial-ecological knowledge
to design population monitoring.
Among population estimation design, the tran-
sect line design is a promising approach for the condition
in Alas Purwo National Park. The line transect technique
has been proven powerful for population estimation of
various species which also useful for understanding the
ecology of studied species (Burnham, Anderson, and
Laake 1980; Biswas and Sankar 2002; Shrestha 2004;
Karanth et al. 2004; M L Morrison 2001).Therefore, us-
ing the results from our study will improve the accuracy
and reliability population estimation of banteng in the
Alas Purwo National Park. Field surveys should focus
on four blocks with a total area of 9846.69 hectares,
which are combination highly suitable and smaller part
of the suitable area. Also, when resources are available,
population estimation can employ non-invasive approach
particularly using molecular study which was success-
fully applied to the Sumatran elephant and other large
mammal species (Moßbrucker et al. 2015; Dixon et al.
2007; Brodie and Giordano 2012; Kawanishi 2002;
Mondol et al. 2009).
Conservation implication
This present study demonstrated the use of important
habitat components that are available in map information
for the development of habitat suitability index map for
banteng population in the Alas Purwo National Park-
East Java – Indonesia and use it to design population
survey. Java island, the most densely populated island in
Indonesia, has potential threats for the conservation of
banteng from development process where many natural
areas are converted into human-induced areas. Protected
areas for banteng in Java island are widely separated due
to fragmentation (Pudyatmoko 2004). Despite the limited
application in this study for the Alas Purwo National
Park, a similar approach can be applied to larger areas
such as in The East part of Java where three national
parks (Baluran National Park, Alas Purwo National
Parks and MeruBetiri National Park) exist. The future of
banteng population in Java will depend on the effective-
ness of landscape to provide protected areas, increasing
suitable habitat and connecting protected areas by corri-
dor (Palomares et al. 2001; Pudyatmoko 2004; Schadt,
Revilla, et al. 2002; Torres et al. 2010; LaRue and Niel-
sen 2008; Imron, Herzog, and Berger 2011). The use of
HSI for predicting corridor between protected areas has
been successfully implemented for a cougar (LaRue and
Nielsen 2008). Thus implementing HSI map in our
results for further detection of the corridor between parks
will be useful information for banteng conservation.
Banteng is a the second largest herbivore in Java
and plays roles as important prey species for predators
such as dhole (Pudyatmoko 2004). Spatial models have
been useful for conservation of some predator species
(García-Rangel and Pettorelli 2013; Imam, Kushwaha,
and Singh 2009; LaRue and Nielsen 2008; Merrill et al.
1999; Schadt, Revilla, et al. 2002; Xiaofeng et al. 2011;
Singh et al. 2009). Thus, the further application of the
habitat suitability model development for the predator of
banteng will also be important for the management of
higher level of trophic and providing support for conser-
vation of umbrella species such as dhole or Javan leop-
ard.
ACKNOWLEDGEMENT
The authors are thankful to Lembaga Penelitian dan Pen-
gabdian pada Masyarakat Universitas Gadjah Mada
(LPPM UGM) for providing funds under the scheme of
Penelitian Unggulan Perguruan Tinggi (Penelitian
Kerjasama Institusi) Universitas Gadjah Mada in 2012.
The field work was supported by the Alas Purwo
National Park, providing permits and data during data
collection. Rangers, Rossy, Ardian, and Irwan for
helping the field work. The authors are grateful to the
anonymous reviewers for constructive suggestions and
helping in reshaping the manuscript.
REFERENCES
Alamets, Katrin, and Henn Pa. 2005. “Modelling Bird
Habitat Suitability Based on Landscape Parameters
at Different Scales” 5: 314–21. doi:10.1016/
j.ecolind.2005.03.008.
Biswas, S, and K Sankar. 2002. “Prey Abundance and
Food Habit of Tigers (Panthera Tigris Tigris) in
Pench National Park, Madhya Pradesh, India.”
Journal of Zoology 256 (3): 411–20. doi:10.1017/
S0952836902000456.
Brodie, Jedediah, and Anthony J. Giordano. 2012.
“Density of the Vulnerable Sunda Clouded Leop-
ard Neofelis Diardi in a Protected Area in Sabah,
Malaysian Borneo.” Oryx 46 (03): 427–30.
doi:10.1017/S0030605312000087.
Burnham, Kenneth P., David R. Anderson, and Jeffrey L.
Laake. 1980. “Estimation of Density from Line
Transect Sampling of Biological Populations.”
Wildlife Monographs 72: 3–202.
Catullo, Gianluca, Monica Masi, Alessandra Falcucci,
Luigi Maiorano, Carlo Rondinini, and Luigi Boi-
tani. 2008. “A Gap Analysis of Southeast Asian
Mammals Based on Habitat Suitability Models.”
Biological Conservation 141 (11): 2730–44.
doi:10.1016/j.biocon.2008.08.019.
Dixon, Jeremy D., Madan K. Oli, Michael C. Wooten,
Thomas H. Eason, J. Walter McCown, and Mark
W. Cunningham. 2007. “Genetic Consequences of
Habitat Fragmentation and Loss: The Case of the
Florida Black Bear (Ursus Americanus Florida-
nus).” Conservation Genetics 8 (2): 455–64.
doi:10.1007/s10592-006-9184-z.
Population Monitoring of Bos javanicus
37 AJCB Vol. 5 No. 1, pp. 31–39, 2016
García-Rangel, S., and N. Pettorelli. 2013. “Thinking
Spatially: The Importance of Geospatial Tech-
niques for Carnivore Conservation.” Ecological
Informatics 14. Elsevier B.V.: 84–89. doi:10.1016/
j.ecoinf.2012.11.009.
Hewson, Chris M., Graham E. Austin, Su J. Gough, and
Robert J. Fuller. 2011. “Species-Specific Re-
sponses of Woodland Birds to Stand-Level Habitat
Characteristics: The Dual Importance of Forest
Structure and Floristics.” Forest Ecology and Man-
agement 261 (7): 1224–40. doi:10.1016/
j.foreco.2011.01.001.
Hirzel, Alexandre H, and Gwenaëlle Le Lay. 2008.
“Habitat Suitability Modelling and Niche Theory,”
1372–81. doi:10.1111/j.1365-2664.2008.01524.x.
Hirzel, Alexandre H, Christophe Randin, and Antoine
Guisan. 2006. “Evaluating the Ability of Habitat
Suitability Models to Predict Species Presences” 9:
142–52. doi:10.1016/j.ecolmodel.2006.05.017.
Imam, Ekwal, S. P S Kushwaha, and Aditya Singh.
2009. “Evaluation of Suitable Tiger Habitat in
Chandoli National Park, India, Using Spatial Mod-
elling of Environmental Variables.” Ecological
Modelling 220 (24): 3621–29. doi:10.1016/
j.ecolmodel.2009.06.044.
Imron, Muhammad Ali, Sven Herzog, and Uta Berger.
2011. “The Influence of Agroforestry and Other
Land-Use Types on the Persistence of a Sumatran
Tiger (Panthera Tigris Sumatrae) Population: An
Individual-Based Model Approach.” Environ-
mental Management 48 (2): 276–88. doi:10.1007/
s00267-010-9577-0.
Indonesia, Presiden Republik. 1999. Peraturan Pemerin-
tah No . 7 Tahun 1999 Tentang : Pengawetan Jenis
Tumbuhan Dan Satwa Oleh Nomor.
Jacquin, Anne, Jean-philippe Denux, Michel Gay, Jona-
than Mitchley, and Panteleimon Xofis. 2005.
“Habitat Suitability Modelling of Capercaillie
( Tetrao Urogallus ) Using Earth Observation
Data” 13. doi:10.1016/j.jnc.2005.02.002.
Karanth, K Ullas, James D Nichols, N Samba Kumar,
William a Link, and James E Hines. 2004. “Tigers
and Their Prey: Predicting Carnivore Densities
from Prey Abundance.” Proceedings of the Na-
tional Academy of Sciences of the United States of
America 101 (14): 4854–58. doi:10.1073/
pnas.0306210101.
Kawanishi, Kae. 2002. “Population Status of Tigers
(Panthera Tigris) in a Primary Rainforest of Penin-
sular Malaysia.” Wildlife Conservation PhD: 133.
h t t p : / / w w w . r h i n o r e s o u r c e c e n t e r . c o m /
ref_files/1175860268.pdf.
Lahoz-Monfort, José J., Gurutzeta Guillera-Arroita, E. J.
Milner-Gulland, Richard P. Young, and Emily
Nicholson. 2010. “Satellite Imagery as a Single
Source of Predictor Variables for Habitat Suitabil-
ity Modelling: How Landsat Can Inform the Con-
servation of a Critically Endangered Lemur.” Jour-
nal of Applied Ecology 47 (5): 1094–1102.
doi:10.1111/j.1365-2664.2010.01854.x.
Larson, M. A., F. R. Thompson, J. J. Millspaugh, W. D.
Dijak, and S. R. Shifley. 2004. “Linking Popula-
tion Viability, Habitat Suitability, and Landscape
Simulation Models for Conservation Planning.”
Ecological Modelling 108: 103–18.
Larson, Michael A, Frank R Thompson III, Joshua J
Millspaugh, William D Dijak, and Stephen R
Shifley. 2004. “Linking Population Viability, Habi-
tat Suitability, and Landscape Simulation Models
for Conservation Planning.” Ecological Modelling
180 (1): 103–18. doi:http://dx.doi.org/10.1016/
j.ecolmodel.2003.12.054.
LaRue, Michelle a., and Clayton K. Nielsen. 2008.
“Modelling Potential Dispersal Corridors for Cou-
gars in Midwestern North America Using Least-
Cost Path Methods.” Ecological Modelling 212 (3-
4): 372–81. doi:10.1016/j.ecolmodel.2007.10.036.
Li, W., Q. Guo, and C. Elkan. 2011. “Can We Model the
Probability of Presence of Species without Absence
Data?” Ecography 34: 1096–1105.
Linkie, Matthew, Deborah J. Martyr, Abishek Harihar,
Dian Risdianto, Rudijanta T. Nugraha, Maryati
Maryati, Nigel Leader-Williams, and Wai-Ming
Wong. 2015. “Safeguarding Sumatran Tigers:
Evaluating Effectiveness of Law Enforcement Pa-
trols and Local Informant Networks.” Journal of
Applied Ecology, no. Bennett 2011: n/a – n/a.
doi:10.1111/1365-2664.12461.
Menteri Kehutanan. 2008. Arahan Strategis Konservasi
Spesies Nasional 2008 - 2018. Jakarta.
Merrill, Troy, David J. Mattson, R. Gerald Wright, and
Howard B. Quigley. 1999. “Defining Landscapes
Suitable for Restoration of Grizzly Bears Ursus
Arctos in Idaho.” Biological Conservation 87 (2):
231–48. doi:10.1016/S0006-3207(98)00057-3.
Mondol, Samrat, K. Ullas Karanth, N. Samba Kumar,
Arjun M. Gopalaswamy, Anish Andheria, and Uma
Ramakrishnan. 2009. “Evaluation of Non-Invasive
Genetic Sampling Methods for Estimating Tiger
Population Size.” Biological Conservation 142
(10). Elsevier Ltd: 2350–60. doi:10.1016/
j.biocon.2009.05.014.
Morrison, M L. 2001. Wildlife Study Design.
Morrison, M. L., Bruce G. Marcot, and R. W. Mannan.
2006. Wildlife-Habitat Relationship: Concept and
Application. Island Press, Washington. Washing-
ton: Island Press.
Moßbrucker, Alexander Markus, Isabella Apriyana, Jörns
Fickel, Muhammad Ali Imron, and Satyawan Pud-
yatmoko. 2015. “Non-Invasive Genotyping of Su-
matran Elephants : Implications for Conservation
The Sumatran Elephant ( Elephas Maximus Suma-
tranus ) Is One of Three Currently Recognized
Subspecies” 8 (3): 745–59.
Nikolakaki, Pantoula, and Nigel Dunnett. 2005. “The
Use of Spatial Concepts as a Basis for Designing a
Viable-Habitat Network: Conserving Redstart
(Phoenicurus Phoenicurus) Populations in Sher-
wood Forest, England.” Journal for Nature Con-
servation 13 (1): 31–48. doi:10.1016/
j.jnc.2005.01.001.
Palomares, F., M. Delibes, E. Revilla, J. Calzada, and J.
M. Fedriani. 2001. “Spatial Ecology of the Iberian
Lynx and Abundance of European Rabbit in South-
western Spain.” Wildlife Monographs 148: 1–36.
Imron et al.
38 AJCB Vol. 5 No. 1, pp. 31–39, 2016

Pearce, J., and S. Ferrier. 2000. “Evaluating the Predic-
tive Performance of Habitat Models Developed
Using Logistic Regression.” Ecological Modelling
133: 225–45.
Pudyatmoko, Satyawan. 2004. “Does the Banteng (Bos
Javanicus) Have a Future in Java? Challenges of
the Conservation of a Large Herbivore in a
Densely Populated Island.” In 3rd IUCN World
Conservation Congress, 17–26.
Ray, N., and M. A. Burgman. 2006. “Subjective Uncer-
tainties in Habitat Suitability Maps.” Ecological
Modelling, no. 195: 172–86.
Schadt, S, E Revilla, T Wiegand, F Knauer, P Kaczen-
sky, U Breitenmoser, L Bufka, et al. 2002.
“Assessing the Suitability of Central European
Landscape for the Reintroduction of Eurasian
Lynx.” Journal of Applied Ecology 39: 189–203.
doi:10.1046/j.1365-2664.2002.00700.x.
Schadt, S., F. Knauer, P. Kaczensky, E. Revilla, T. Wie-
gand, and L. Trepl. 2002. “Rule-Based Assesment
of Suitable Habitat and Patch Connetivity for the
Eurasian Lynx.” Ecological Applications 12: 1469
–83.
Schivo, Facundo, Patricia Kandus, María Luisa, and
Priscilla Gail. 2015. “A Habitat Suitability Model
for Capybara ( Hydrochoerus Hydrochaeris ) at Its
Core Area in” 8 (1): 150–68.
Seber, G.A.F. 1982. The Estimation of Animal Abundace
and Related Parameter. London: Griifin.
Shrestha, M K. 2004. “Relative Ungulate Abundance in a
Fragmented Landscape: Implications for Tiger
Conservation,” no. November: 1–113.
Shrestha_2004_Relative_ungulate_abundance_and
_implications_for_tiger_conservation.pdf.
Singh, R., P. K. Joshi, M. Kumar, P. P. Dash, and B. D.
Joshi. 2009. “Development of Tiger Habitat Suit-
ability Model Using Geospatial Tools - a Case
Study in Achankmar Wildlife Sanctuary
(AMWLS), Chhattisgarh India.” Environ Monit
Asses, no. 155: 555–67.
Timmins, R.J., J.W. Duckworth, S. Hedges, R.
Steinmetz, and A Pattanavibool. 2015. “Bos
Javanicus,” 8235.
Torres, J, J C Brito, M J Vasconcelos, L Catarino, J Gon-
çalves, and J Honrado. 2010. “Ensemble Models of
Habitat Suitability Relate Chimpanzee ( Pan Trog-
lodytes ) Conservation to Forest and Landscape
Dynamics in Western Africa.” Biological Conser-
vation 143 (2). Elsevier Ltd: 416–25. doi:10.1016/
j.biocon.2009.11.007.
Xiaofeng, Luan, Qu Yi, Li Diqiang, Liu Shirong, Wang
Xiulei, Wu Bo, and Zhu Chunquan. 2011. “Habitat
Evaluation of Wild Amur Tiger (Panthera Tigris
Altaica) and Conservation Priority Setting in North
-Eastern China.” Journal of Environmental Man-
agement 92 (1): 31–42. doi:10.1016/
j.jenvman.2010.08.001.
Population Monitoring of Bos javanicus
39 AJCB Vol. 5 No. 1, pp. 31–39, 2016