the use: of fura- for estimating ca buffers and ca...
TRANSCRIPT

Pergamon 002%3908(95)00144-l
The Use: of Fura- for Estimating Fluxes
E. NEHER
Neuropharmacology, Vol. 34, No. 11, pp. 1423-1442, 1995 Copyright 8 1995 Elsevier Science Ltd
Printed in Great Britain. All rights reserved 002s3908/95 $9.50 + 0.00
Ca Buffers and Ca
Max-Planck-Institu t j?ir biophysikalische Chemie, Department of Membranebiophysics, Am Faperg, D-37077, Giittingen, Germany
(Accepted 4 September 1995)
Summary--The compound fura- (Grynkiewicz et al., J. Biol. Chem. 260, 344&3450, 1985) is generally known as an indicator dye for measuring the concentration of free calcium ([Ca”]) inside living cells. It should be appreciated, however, that this is not what it actually is. More accurately, it is a divalent metal ion chelator which changes its fluorescence properties upon complexation. Thus, [Ca ‘1 has to be inferred indirectly by means of the law of mass action. As a chelator, fura- may influence the quantity of interest, the Ca signal. On the other hand, the chelator action may be used for a number of other purposes, some of them more directly related to its molecular properties: as a chelator, competing with endogenous Ca buffers, it can be used to estimate endogenous buffers and their properties. When present at sufficiently high concentration, such that it outcompetes endogenous buffers, fura- reports total Ca changes and is a probe for Ca fluxes across the membrane. Here, theory and methodological considerations of such applications of fura- will be summarized and results on Ca buffer and Ca flux measurements derived from various methods will be compared.
Keywords-Calcium, fura-2, indicator dye, fluorescence, calcium buffer, fractional Ca current.
In order to calculate the change in free Ca concentration in response to a membrane current, one needs to know the proportion of current carried by calcium, the accessible cell volume, and the cellular Ca-binding ratio (the ratio of added calcium over free [Ca2’] changes). Many methods have been suggested in the past to derive these parameters by combining optical Ca measurement with electrophysiological techniques. In most cases the approach was to elicit a change in [Ca2’], to measure it by an indicator dye, and to relate it to the total calcium change, as estimated from current flow, or iontophoretic current, or tracer flux. This readily results in an estimate of Ca-binding ratio, if t.he accessible cell volume is known. When such a measurement is performed once with a Ca specific current and once with a nonspecific current the fraction of current carried by calcium in the latter case can be derived. This “straight-forward” approach is based on the assumption that changes in free calcium are strictly proportional to the change in total calcium. The constant of proportionality has to be determined in each cell individually (it includes the cell volume!), and the result is accurate only if the constant is invariant in time and space. These assumptions are less likely to hold when the Ca. signal is large. Another source of error is calcium being taken up by Ca sequestration mechanisms (as discussed by Schneider et al., 1991 and Guerrero et al., 1994) and Ca release from stores. Both
problems are mitigated by increasing the concentration of the indicator dye. This restricts the size of the Ca signal and, thereby, confines it to a more linear range. It also slows down Ca retrieval processes. With a smaller change in the [Ca2’] signal, however, relative errors may be larger. Also, cellular Ca-binding capacity is, then, strongly influenced by the presence of the dye. Both problems are taken care of, if the analysis is based not on changes in free calcium concentration, but rather on the absolute change of the fluorescence signal at a Ca- sensitive wavelength and if the competition between endogenous and added buffers is considered explicitly. It will be shown below that this results in a method to measure Ca-binding ratio and fractional calcium current on the basis of a single, cell-independent calibration parameter. Since the method relies on the action of an exogenous buffer it will be called the “added buffer”- approach.
Such use of Ca indicator dyes has been considered before. Using quin-2 von Tscharner et al. (1986) and Johansson and Haynes (1988) studied calcium fluxes in neutrophils and platelets, respectively. However, quin- 2’s properties are less favorable than those of fura- for this purpose. Also dichlorophosphonazo III, an absor- bance dye, was considered for such use. However, the complicated stoichiometry of the dye (Baylor et al., 1982) proved to be a problem. Later, Baylor and
1423

1424 E. Neher
Hollingworth (1988) studied the effects of added buffer on Ca transients in skeletal muscle, employing fura-2. However, due to the short duration of these transients, a complicated non-equilibrium situation prevailed in these cells. With neurones and neuroendocrine cells, on the other hand, it recently turned out that calcium buffering by fura- is a convenient way to study many aspects of Ca handling (Neher and Augustine, 1992; Zhou and Neher, 1993a, b).
THEORY
When calcium (Ca”‘) is at equilibrium with a dye (B) and the metal-ion complex (CaB) according to the reaction
[Ca’+] + [B] * [CaB] (1)
a fluorescent signal y is observed which is the sum of the two molecular forms of the dye:
y = SBnB + St3BnChB (2)
Here, nn and ncan are the total molar amounts of free and Ca-bound fura- in the observation volume (such as a cell) and Sn and Scan are proportionality coefficients, according to Grynkiewicz et al. (1985) which describe the fluorescent properties of the free and bound forms of the dye, respectively (see below). nn and ncan are giVeII
by the law of mass action according to:
waB = ntot . [Ca*+]/(b + [Ca*+]) (3)
nB = ntot ’ KD/(KD + [Ca*+]) (4)
where ntot is the total molar amount of dye in the observation volume and KD is the dissociation constant of the dye.
Considering Eqs (2-4) for two different wavelengths leads immediately to the classical equation for calculat- ing free Ca concentration from the fluorescence ratio (Grynkiewicz et d., 1985).
Considering these equations for a single wavelength and applying them to the fluorescent signal of a closed volume (such as a cell) in which-e.g. by Ca influx-an amount Ana binds to the dye, we have due to conservation of total dye:
Ana = AncaB = -Lb@ (5)
With (2), then,
AY = An- (Scti - SB) (f-9
is obtained. The proportionality constants Scan and Sn
depend on the illumination intensity, the fluorescence detection efficiency, and fluorescence properties of the dye, but not on optical path length (for small cells), dye concentration etc. Thus, once these parameters are known for a given experimental set-up, changes in fluorescence represent a direct measure of the amount of Ca binding to fura-2.
In order to quantitatively measure Ca fluxes, however, other processes have to be considered. Ca entering the cell during a short depolarization will partially appear as free Ca; it will bind to endogenous buffers, and it will be sequestered into organelles, or pumped back out of the cell. Considering these processes one can write down the Ca balance:
Aninj = Anfree + An- + Incas + An, (7)
where Ani,j is the amount of Ca injected into the cell and the other indices refer to Ca-bound dye, Ca binding to endogenous buffer S and to Ca being pumped. In the following, it will be argued that the last term in Eq. (7)- the term due to pumping and sequestration-can be neglected, if sufficiently short time intervals are con- sidered. Ca-binding to fura- and to cellular Ca binding proteins occurs within milliseconds and faster, an exception being parvalbumin, which has a dissociation rate constant of approx 1 set-l (Klein et al., 1990). Pump and sequestration mechanisms, on the other hand, together re-establish basal Ca values after a pulse-like influx typically on the time scale of seconds or even tens of seconds. Thus, fluxes due to these processes are small compared to those of the fast redistribution processes between buffers initially. One has to consider, though, that sequestering mechanisms may be heterogeneous or faster. However, any fast component would either return [Ca2’] to basal values quite rapidly (if of sufficient capacity) or it would rapidly saturate. The latter effect would show up as a distinct kinetic component in the Ca time course. Likewise, a Ca-binding protein with slow kinetics would make itself known by a distinct influence on the time course of Ca-decay. In adrenal chromaffin cells, small pulse-like Ca influx led to Ca excursions which decayed exponentially with time constants of approx 10 sec. No deviation from this decay was seen in the time window 10 msec? sec. The same is true for many other cell types (e.g. pituitary cells). There are exceptions, though: in neuronal processes Ca decays with time constants as short as 100-200 msec were observed (Markram and Sakmann, 1994; Yuste and De& 1995). In muscle cells binding to parvalbumin and a potent SR pump lead to Ca transients of only a few tens of milliseconds duration. In these cases, the analysis presented below will meet with difficulty, because diffusional equilibration in the volume of interest, which is another prerequisite for some of the arguments, sets a lower bound to the time interval that can be considered.
Ca buffers and fluxes
we then obtain Also, the analysis neglects possible amplification of Ca influx by release from stores.
1425
Within these limitations, then, the Ca balance is further specified, considering that the differential calcium- binding ratio Kg of a chelator like fura can be defined as:
Anw = AnqKg/(l +K.B+K~) (13)
d[CaB] KD [Bl,, KB = d[Ca2+1 = (KD + [Ca”+])’
and with Eq. (6) the measured change in fluorescence will be:
(8)
AY = Ahj(ScaB - SB)KB/(~ + Q + K,) (14 where [B],, is the total concentration of the dye. This equation is readily derived from Eq. (3) after rewriting in terms of concentrations. Kg, termed “Ca-binding ratio” is the same quantity previously called “Ca-binding capa- city” (see discussion on terminology, p. 1433). It should be noted that Ku defined this way reaches a limiting maximum value, given by [B],,JKo at low Ca concentra- tion, contrary to the “buffer value” p, defined in analogy to pH-buffer which is Ca- added/(-dpCa). *
In the limit of negligible increase in free calcium both quantities are related by:
Ic = I(Za2+p. lnl0
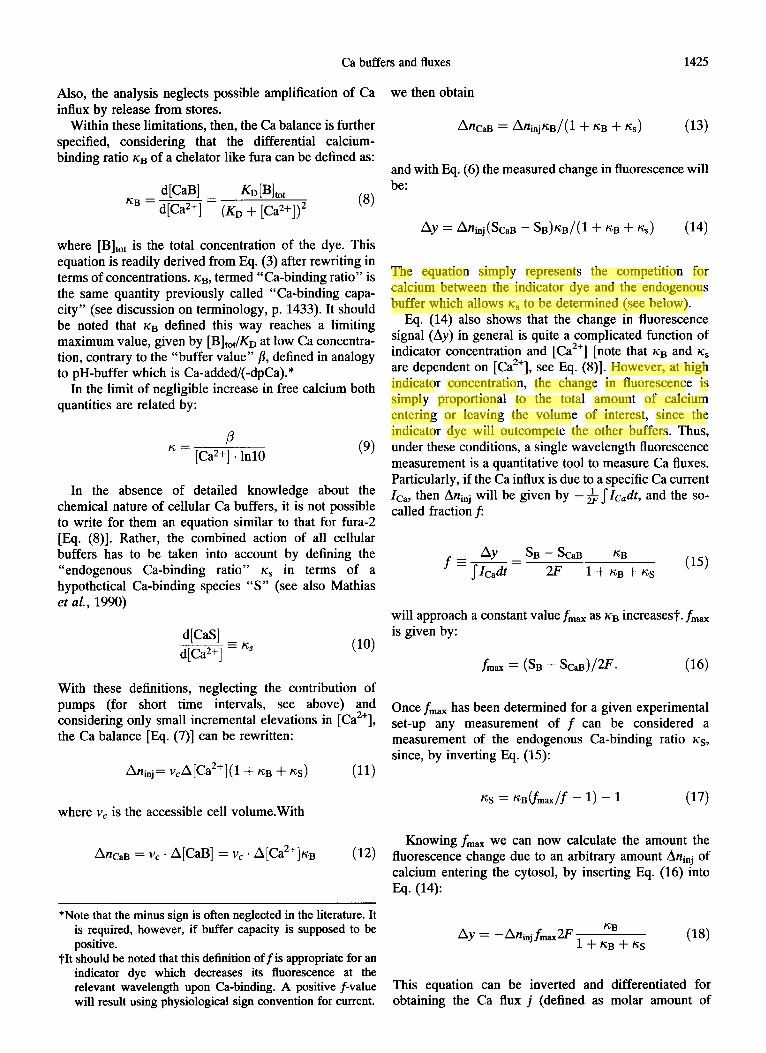
The equation simply represents the competition for calcium between the indicator dye and the endogenous buffer which allows IC, to be determined (see below).
Eq. (14) also shows that the change in fluorescence signal (Ay) in general is quite a complicated function of indicator concentration and [Ca2+] [note that Ku and rc, are dependent on [Ca2’], see Eq. (S)]. However, at high indicator concentration, the change in fluorescence is simply proportional to the total amount of calcium entering or leaving the volume of interest, since the indicator dye will outcompete the other buffers. Thus, under these conditions, a single wavelength fluorescence measurement is a quantitative tool to measure Ca fluxes. Particularly, if the Ca influx is due to a specific Ca current Ica, then Aninj will be given by - & Jlc& and the SO-
called fraction f:
In the absence of detailed knowledge about the chemical nature of cellular Ca buffers, it is not possible to write for them an equation similar to that for fura- [Eq. (S)]. Rather, the combined action of all cellular buffers has to be taken into account by defining the “endogenous Ca-binding ratio” K, in terms of a hypothetical Ca-binding species “S” (see also Mathias et aZ., 1990)
AY f-m= 05)
With these definitions, neglecting the contribution of pumps (for short time intervals, see above) and considering only small incremental elevations in [Ca2’], the Ca balance [Eq. (7)] can be rewritten:
d[CaS] -- = d[Ca2+] - ns
An,= v,A[Ca2’](1 + KB i- KS)
where v, is the accessible cell volume.With
will approach a constant value fmax as +r increasest. fmax
(10) is given by:
fmax = (SB - sCaB>/=. (16)
Once fmax has been determined for a given experimental set-up any measurement of f can be considered a measurement of the endogenous Ca-binding ratio Q, since, by inverting Eq. (15):
(11) KS = fiBCfmax/f - l> - 1 (17)
Ancau = v, . A[CaB] = v, . A[Ca2’]r;n (12) &owing fmax we can now calculate the amount the
fluorescence change due to an arbitrary amount Aninj of calcium entering the cytosol, by inserting Eq. (16) into Eq. (14):
*Note that the minus sign is often neglected in the literature. It is required, however, if buffer capacity is supposed to be positive.
AY = -An, fma2F &’ 1 + &3 + KS (18)
tit should be noted that this definition off is appropriate for an indicator dye which decreases its fluorescence at the relevant wavelength upon Ca-binding. A positive f-value This equation can be inverted and differentiated for will result using physiological sign convention for current. obtaining the Ca flux j (defined as molar amount of

1426 E. Neher
calcium entering the observation volume per set). In the limit of Kg >> fcS it takes the simple form:
1 & j= -2Ffmax.dt7
where F is the Faraday constant. This equation should hold regardless of whether calcium enters through the plasma membrane or whether it is released from stores.
When studying Ca influx through non-specific cation channels, it is convenient to define, in analogy to the fraction f, the quantities
AY f* =-Ja
where Z is the total current (including contributions of monovalent and divalent ions). An expression for the ratio JZcadt/ JZdt, i.e. the relative proportion of current carried by calcium, can easily be derived from Eq. (20) and Eq. (15), by writing
AY j-k&t j-Zcadt
f*=-&%‘SIdf= JZdt ‘fmanl+z+Ks c21)
For the limiting case of Kn>>xs we obtain
j-k& f* _ J-Zdt = f= = ” (22)
This ratio has been termed the Pf-value or “fractional Ca current” of a channel (Schneggenburger et d., 1993). It characterizes the ability to pass Ca ions with respect to monovalent ions.
The next section will concentrate on how such measurements of Ca flux and of endogenous Ca buffer are actually performed and how one can ascertain that the appropriate limiting conditions have been reached.
METHODS
The expressions derived above for Ca buffering and Ca fluxes require a measurement of the change in both the fluorescence signal and in the total calcium entering the cell during a short episode of Ca influx. It is assumed that both these quantities represent changes within the same closed volume (the cell under study). The requirements for a precise measurement can then be stated as follows:
(1) Electrophysiological measurements: in order to estimate the total Ca influx from membrane current the cell under study should be well space clamped. Otherwise local short-circuit currents may contribute to the fluorescence signal, but not to the measured current. This condition may be relaxed, if currents are evoked locally (such as by local iontophoresis). Then, only the region affected by conductance changes need
to be space clamped. For most of the measurements, a particular current component (such as voltage- activated Ca current or a particular glutamate- activated current) has to be isolated. This is a general problem in ion channel research which, for a given cell type, has to be solved by pharmacological tools or by selection of appropriate intracellular and extracellular media (Swandulla and Chow, 1992). A particular problem is the suppression of Ca-activated currents, which may contaminate the current record.
(2) Fluorimetric measurements: total fluorescence from the cell under study has to be collected quantitatively, i.e. under conditions of stable illumination intensity and constant detection efficiency. If Ca fluxes are evoked locally, all parts of the cell, which undergo Ca changes have to be included in the measurement. Care has to be taken that both illumination and detection efficiency are homogeneous in space. A particular problem is the dependence of detection efficiency on focal depth. Some of these problems and caveats on calibrating the fluorescence signal in a given set-up are discussed in detail below.
Of great help in handling the optical problems mentioned above is the use of fluorescent beads. They are being offered by several companies as standards of fluorescence in FACS (fluorescence-activated cell sorter) machines. In our hands fluoresbrite B/B beads, 4.5 pm in diameter (Polyscience, Warrington, Pa, Cats-No. 18340) are very suitable. They have fluorescence magnitude comparable to a cell of approx 15 pm diameter, when loaded with 100 PM fura- and when excited in the wavelength range 360 nm to 390 nm. The signal from these beads (as is the signal from a cell) is proportional to the product of illumination intensity and fluorescence detection efficiency. Thus, spatial uniformity of these properties, as well as constancy in time from experiment to experiment is readily checked with such beads. In fact, it was found that quite some variability, such as due to aging of the light source, can be compensated for by measuring, on each experimental day, the fluorescence of beads placed at the exact locus of recording and dividing all fluorescence readings from that day by this value. Fluorescence is then expressed in so-called “bead units” (BU), one BU being the fluorescence of one bead measured under the conditions of the experiment (see Zhou and Neher, 1993b for more details).
Calibration
Strictly speaking, a given experimental set-up should be calibrated in BU (bead units) per mole of calcium binding to the indicator dye. In practise, this is done by calculating the ratio of the change in fluorescence signal and Ca current integral, termed fraction f [see Eq. (15)] under conditions where currents are carried exclusively by calcium and all calcium entering the cell binds to the indicator dye. This is the case when the current is a highly selective Ca current (such as a classical voltage-
Ca buffers and fluxes 1427
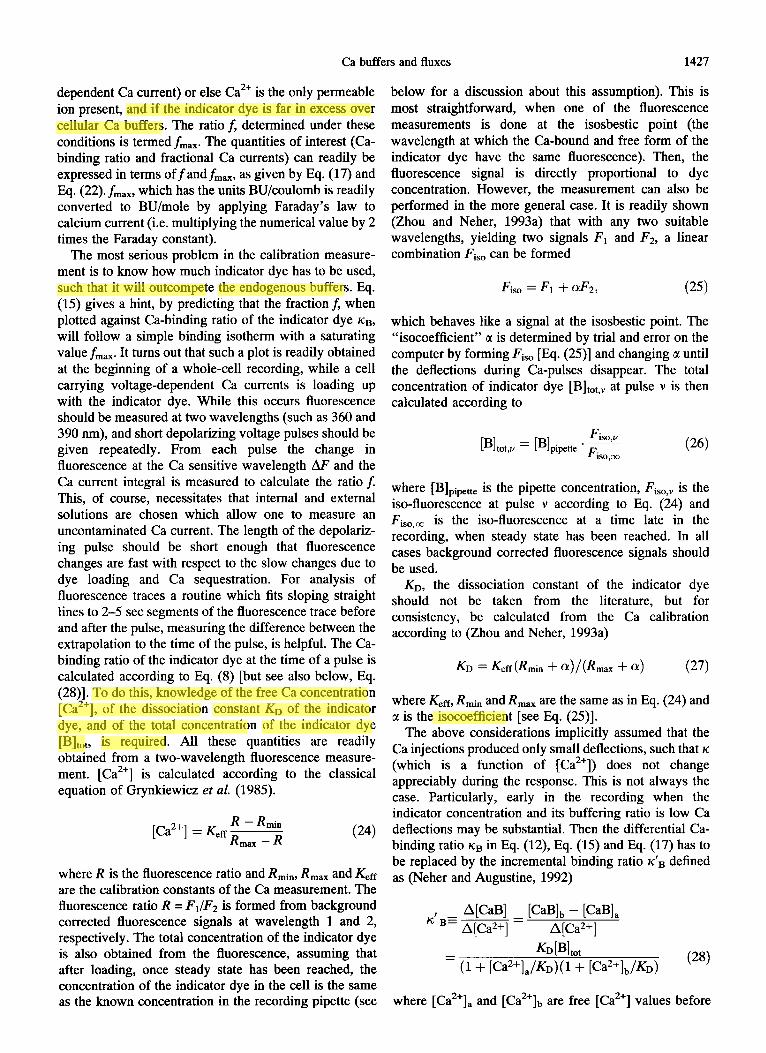
dependent Ca current) or else Ca2+ is the only permeable ion present, and if the indicator dye is far in excess over cellular Ca buffers. The ratio f, determined under these conditions is termed fmax. The quantities of interest (Ca- binding ratio and fractional Ca currents) can readily be expressed in terms off and fmax, as given by Eq. (17) and
Eq. (22). Lax, which has the units BWoulomb is readily converted to BU/mole by applying Faraday’s law to calcium current (i.e. multiplying the numerical value by 2 times the Faraday constant).
The most serious problem in the calibration measure- ment is to know how much indicator dye has to be used, such that it will outcompete the endogenous buffers. Eq. (15) gives a hint, by predicting that the fraction f, when plotted against Ca-binding ratio of the indicator dye Kg, will follow a simple binding isotherm with a saturating value fmax. It turns out that such a plot is readily obtained at the beginning of a whole-cell recording, while a cell carrying voltage-dependent Ca currents is loading up with the indicator dye. While this occurs fluorescence should be measured at two wavelengths (such as 360 and 390 nm), and short depolarizing voltage pulses should be given repeatedly. From each pulse the change in fluorescence at the Ca sensitive wavelength AF and the Ca current integral is meiasured to calculate the ratio J This, of course, necessitates that internal and external solutions are chosen which allow one to measure an uncontaminated Ca current. The length of the depolariz- ing pulse should be short enough that fluorescence changes are fast with respect to the slow changes due to dye loading and Ca sequestration. For analysis of fluorescence traces a routine which fits sloping straight lines to 2-5 set segments of the fluorescence trace before and after the pulse, measuring the difference between the extrapolation to the time of the pulse, is helpful. The Ca- binding ratio of the indicator dye at the time of a pulse is calculated according to Elq. (8) [but see also below, Eq. (28)]. To do this, knowledge of the free Ca concentration [Ca2’], of the dissociation constant Ko of the indicator dye, and of the total concentration of the indicator dye
Mm is required. All these quantities are readily obtained from a two-wavelength fluorescence measure- ment. [Ca”] is calculated according to the classical equation of Grynkiewicz d al. (1985).
where R is the fluorescence ratio and R,i,, R,,, and K,a are the calibration constants of the Ca measurement. The fluorescence ratio R = Fl/F2 is formed from background corrected fluorescence signals at wavelength 1 and 2, respectively. The total concentration of the indicator dye is also obtained from the fluorescence, assuming that after loading, once steady state has been reached, the concentration of the indicator dye in the cell is the same as the known concentration in the recording pipette (see
below for a discussion about this assumption). This is most straightforward, when one of the fluorescence measurements is done at the isosbestic point (the wavelength at which the Ca-bound and free form of the indicator dye have the same fluorescence). Then, the fluorescence signal is directly proportional to dye concentration. However, the measurement can also be performed in the more general case. It is readily shown (Zhou and Neher, 1993a) that with any two suitable wavelengths, yielding two signals PI and F2, a linear combination Fiso can be formed
which behaves like a signal at the isosbestic point. The “isocoefficient” a is determined by trial and error on the computer by forming Fiso [Eq. (25)] and changing a until the deflections during Ca-pulses disappear. The total concentration of indicator dye [B]t,t,, at pulse v is then calculated according to
PI tot,v = LBlpipette . * (26) 1s0,cc
where PIpipette is the pipette concentration, Fiso,v is the iso-fluorescence at pulse v according to Eq. (24) and
Fi,,, m is the iso-fluorescence at a time late in the recording, when steady state has been reached. In all cases background corrected fluorescence signals should be used.
KD, the dissociation constant of the indicator dye should not be taken from the literature, but for consistency, be calculated from the Ca calibration according to (Zhou and Neher, 1993a)
KD = Keff(Rmin + a)/(R,,, + a) (27)
where K,R, Rmin and R,,, are the same as in Eq. (24) and a is the isocoefficient [see Eq. (25)].
The above considerations implicitly assumed that the Ca injections produced only small deflections, such that K (which is a function of [Ca2’]) does not change appreciably during the response. This is not always the case. Particularly, early in the recording when the indicator concentration and its buffering ratio is low Ca deflections may be substantial. Then the differential Ca- binding ratio Kg in Eq. (12), Eq. (15) and Eq. (17) has to be replaced by the incremental binding ratio K’g defined as (Neher and Augustine, 1992)
A[CaB] K/B=-=
[CaB], - [CaB],
A[Ca2+]
Ko[B], = (I + [Ca2+],/&)(1 + [Ca2+]b/Ko)
(28)
where [Ca2’], and [Ca2+lb are free [Ca2’] values before

1428 E. Neher
and after the pulse. This follows readily from Eq. (3). In practice rc-values are always evaluated according to Eq. (28) since this is identical to the definition of rc [Eq. (S)] for small changes in [Ca*‘].
Examples of calibration measurements have been published by Neher and Augustine (1992), Schneggen- burger et al. (1993), Bumashev et al. (1995) and Frings et al. (1995). In the latter two cases the procedure had to be modified because the cells under study did not have voltage-dependent Ca currents. Therefore, Bumashev et al. (1995), working with HEK cells, elicited currents by glutamate in cells transfected with the GluR-A homo- merit channel. In these experiments 10 mM Ca*+ was the only permeable ion, since all Na+ and K+, both inside and outside, was replaced by 100 mM N-methylglucamine. Frings et al. (1995), also working with HEK cells, transfected the cells with N-type Ca channels from brain. In all these cases a wavelength between 380 and 390 nm was selected as the Ca-sensitive wavelength, such that pronounced fluorescence-decrements were observed (see Fig. 1). The example of Fig. 1 shows that the fluorescence at 380 nm changes by 7.93 bead units (fluorescence of a standard bead) per nanoCoulomb, or 1.54 bead units per femtomole calcium being taken up by fura-2. The calibration constant should depend only on the spectral properties of the indicator and of the standard (fluores- cence beads). Unfortunately, the supplier of beads (Polyscience) does not guarantee spectral constancy of the beads. Also, the numerical value depends on the wavelengths chosen (discussed in more detail by Zhou and Neher, 1993b) and on the Ca concentration at which bead fluorescence is being measured (Hoth, 1995). Nevertheless, fmax values quoted in three publications originating from different experimental setups (with similar equipment for fluorimetry) are very close: 8.7 (Zhou and Neher, 1993b), 9.3 (Schneggenburger et al., 1993), and 9.5 (Burnashev et al., 1995). Furthermore, f,,,-values measured on the same set-up using adrenal chromaffin cells and medial septum neurones were indistinguishable (Z. Zhou and R. Schneggenburger, personal communication). It should be pointed out though, that bead fluorescence should always be measured in the same bath fluid (Hoth, 1995).
Ca-buffer measurements
The calibration procedure described above constitutes a measurement of cellular Ca buffers, since according to Eq. (15) the Ca-binding ratio of the endogenous buffer, ICY, is equal to (rcn-1) at the point where f reaches half its maximum value.
rcc, can be evaluated more accurately when a double reciprocal plot is made, where the data points can be approximated by a straight line. In such a plot the negative x-axis intercept yields ll(l+rc,). This experiment is not optimal for measuring rcs, however, since it is usually performed with high fura- concentration inside the pipette, in order to obtain final f-values close to fmax.
Thus, the interesting range of f-values is passed very early in the recording, at a time when intracellular concentrations of small ions may not have reached steady state yet, such that accurate recording of Ca currents may be a problem. As pointed out by Zhou and Neher (1993a) several types of errors are minimized when the Ca- binding ratio of the indicator dye, Kg, is approximately equal to the endogenous Ca-binding ratio. For fiua-2 and bovine adrenal chromaffin cells at resting [Ca2’], this is the case at a dye concentration of approx 70 PM. Thus, it is advisable to use this concentration for filling pipettes and to calculate rcs according to Eq. (17). Then, however, fluorescence rises quite slowly at the beginning of a whole-cell recording, which implies a relatively large error during the first few seconds of a recording. The early part, on the other hand, is the most interesting period, when trying to measure truly endogenous buffer, unperturbed by washout effects. To overcome these problems Zhou and Neher (1993a) preloaded cells using fura-AM-ester and recorded in the perforated patch configuration. It turned out, however, that incomplete deesterification and uptake of fura- into organelles constitutes a problem which readily leads to quite substantial errors. The method of choice for measuring endogenous buffer, therefore, was a modification of the preloading procedure: the cell was loaded by a very short (2-5 set) episode of whole-cell recording, using a pipette with 3 mM fura-2. The pipette was removed, leaving behind a cell with approx 70 PM fura-2. Subsequently, a perforated patch recording was performed with a pipette containing 70 PM of fura-2. Following an episode of recording and analysing rcs according to Eq. (17) a standard whole-cell recording was established. Also, the fluorescence at the isosbestic wavelength was recorded and its value after reaching steady state was used as Fiso,m when evaluating Eq. (26). The transition from perforated- patch to whole-cell recording is of particular interest, since it allows one to observe washout of mobile endogenous buffers, which largely determine the effec- tive diffusion coefficient of free calcium.
Fluorimetric Ca jlux measurement
The approach to measure Ca fluxes, as outlined in the theory section, so far has mainly been used to study the so-called fractional Ca current (PJ of non-specific cationic currents. Pf is the relative (or fractional) contribution of the Ca2+ ion to the measured current, and, according to Eq. (22) is given by the ratio off* over
f ITlax, where f * is defined [Eq. (20)] as the fluorescence change divided by the current integral during a short pulse of current. The latter now includes both contribu- tions from monovalent and divalent ions. Experimental problems in this type of experiment are similar to those discussed in the calibration section. In addition, the problem arises that the conductances under study (usually agonist-activated currents) very often cannot be switched on and off as rapidly as voltage-activated currents. Thus,
Ca buffers and fluxes 1429
3 BU
(F3t30)
C
(1 6 ___-___---__---____
0 .*---•
. 3 6 1 ‘.
1. _* .*. l
k ,Q
l * s 4 .
. c 2
T I I I
0 !iOO loop 1500 *do0 5
Wli 000 IlM -_L ____________________-~-~
ICal, 1000 nM
I 200 ms
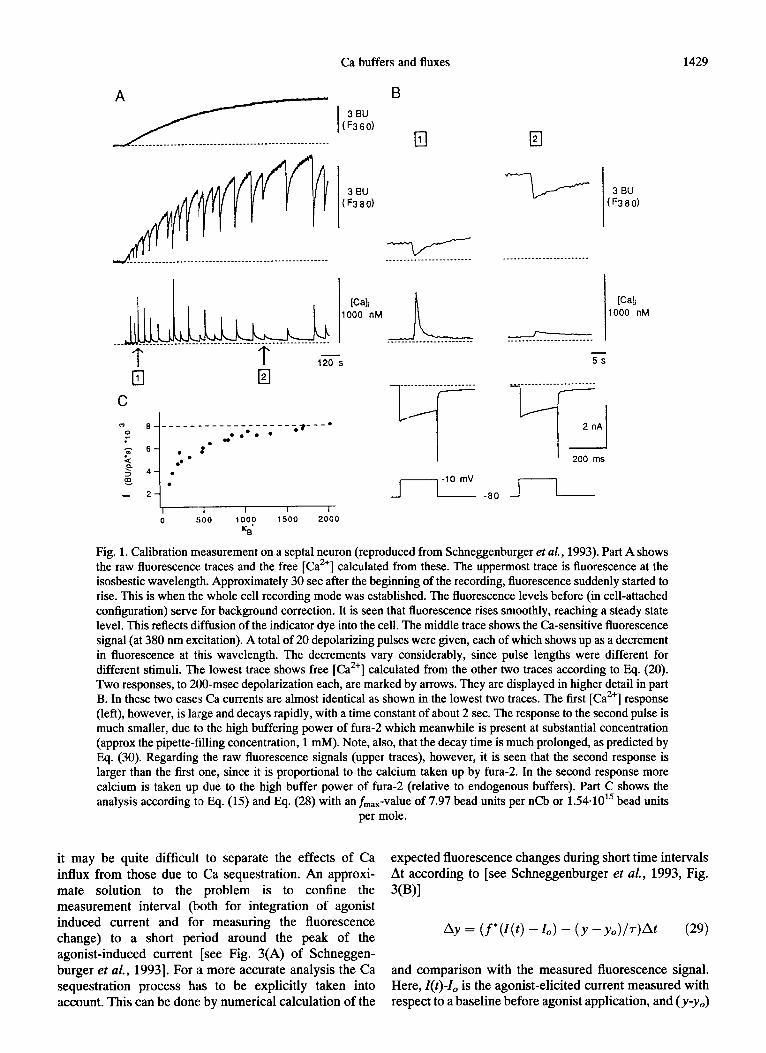
Fig. 1. Calibration measurement on a septal neuron (reproduced from Schneggenburger et al., 1993). Part A shows the raw fluorescence traces and the free [Ca”] calculated from these. The uppermost trace is fluorescence at the isosbestic wavelength. Approximately 30 set after the beginning of the recording, fluorescence suddenly started to rise. This is when the whole cell recording mode was established. The fluorescence levels before (in cell-attached configuration) serve for background correction. It is seen that fluorescence rises smoothly, reaching a steady state level. This reflects diffusion of the indicator dye into the cell. The middle trace shows the Ca-sensitive fluorescence signal (at 380 nm excitation). A total of 20 depolarizing pulses were given, each of which shows up as a decrement in fluorescence at this wavelength. The decrements vary considerably, since pulse lengths were different for different stimuli. The lowest trace shows free [Ca”] calculated from the other two traces according to Eq. (20). Two responses, to 200-msec depolarization each, are marked by arrows. They are displayed in higher detail in part B. In these two cases Ca currents are almost identical as shown in the lowest two traces. The first [Ca”] response (left), however, is large and decays rapidly, with a time constant of about 2 sec. The response to the second pulse is much smaller, due to the high buffering power of fura- which meanwhile is present at substantial concentration (approx the pipette-filling concentration, 1 mM). Note, also, that the decay time is much prolonged, as predicted by Eq. (30). Regarding the raw fluorescence signals (upper traces), however, it is seen that the second response is larger than the first one, since it is proportional to the calcium taken up by fura-2. In the second response more calcium is taken up due to the high buffer power of fura- (relative to endogenous buffers). Part C shows the analysis according to Eq. (15) and Eq. (28) with an fmax- value of 7.97 bead units per nCb or 1.54.101’ bead units
per mole.
it may be quite difficult to separate the effects of Ca influx from those due to Ca sequestration. An approxi- mate solution to the problem is to confine the measurement interval (both for integration of agonist induced current and fo’r measuring the fluorescence change) to a short period around the peak of the agonist-induced current [see Fig. 3(A) of Schneggen- burger et al,, 19931. For a more accurate analysis the Ca sequestration process has to be explicitly taken into account. This can be done by numerical calculation of the
expected fluorescence changes during short time intervals At according to [see Schneggenburger et al., 1993, Fig.
3@)1
AY = (f*(Z(t) - 1,) - (Y - yo)/+t (29)
and comparison with the measured fluorescence signal. Here, Z(t)-Z. is the agonist-elicited current measured with respect to a baseline before agonist application, and ( y-yJ

1430 E. Neher
is the fluorescence signal measured the same way. f * and r are two free parameters which are adjusted such that the calculated time course agrees with the measured one. f *, then, is an appropriate estimate in the sense of the analysis above, and z is the time constant of the relaxation back to baseline. r is quite large in the presence of high concentrations of indicator dye, such that the second term in Eq. (29) is a minor contribution as long as there is substantial current flow.
ALTERNATIVE METHODS
Ca bufering
The method described here is based on changes in the fluorescence signal, due to additions of exogenous buffer. Therefore it is termed “added-buffer” method to distinguish it from other approaches (see introduction). Traditionally, Ca buffering has been measured by Ca injection into cells by means of a iontophoresis electrode (Ahmed and Connor, 1988) and measuring the resulting change in free calcium. This method is confined to relatively large cells, such as snail neurones, which tolerate penetration by several microelectrodes. The large size of the cells implies relatively slow equilibration of calcium throughout the cell, such that no clear kinetic separation between Ca changes due to injection and retrieval may be possible. In smaller cells Ca injection is readily replaced by activating Ca channels as described by Guerrero et al, (1994) and by Tse et al. (1994). Calcium-binding ratio in these studies was calculated as the ratio of total calcium concentration change over free calcium concentration change, when the latter was calculated from indo-l fluorescence, and the former from the total amount of calcium injected by Ca current. The method has the disadvantage that it needs an estimate of the accessible volume of the cell. Total Ca-binding ratio was measured at a number of different indo-l concentra- tions and extrapolated to the case of no dye (Tse et al. (1994). This, however, was done with a new cell for each concentration, such that differences in accessible volume cause variations. It, thus, seems that the method is quite complex in spite of its apparent simplicity. Several variations of this general approach are described below.
The “added-buffer” approach can also be used analysing changes in the kinetics of Ca retrieval. Assuming a linear sequestration mechanism, a simple relationship can be derived between the time constant z of Ca-decay and the Ca-binding ratio of the added buffer (Neher and Augustine, 1992):
r=r,(l+nn+Ks)/(l+Ics) (30)
were z, is the Ca-decay time constant at zero added buffer. Thus, the X-aXiS interCqt of a plot of r versus Kg is at -(l+~~).
Fractional Ca current and Ca selectivity
Traditionally, the Ca permeability of a channel is estimated from reversal potentials assuming an extended constant field equation (Meves and Vogel, 1973). This provides permeability ratios (Ca2+ over monovalent ions) valid at the reversal potential. However, it is also restricted to that situation. Values measured this way will be compared to values derived from fura- measurements below.
Several investigators (see below) determined fractional Ca current by measuring the ratio of the change in [Ca2’] over charge transfer and relating this to the same quantity obtained with a Ca specific current. This approach is quite similar to the one described above, except that no attempt is made to reduce the influence of endogenous buffers. Rather, it relies on the assumption that this influence is the same in both measurements. Rogers and Dani (1995) recently refined this approach. They used high fura- concentrations to reduce the influence of endogenous buffers. Unlike the single wavelength procedure described here, however, they analysed changes in free Ca concentration based on the classical two-wavelength formula of Grynkiewicz et al. (1985). Due to the high buffer capacity of fura-2, then, the changes in free [Ca2’] are very small. Rogers and Dani (1995) performed calibrations on each individual cell and emphasized that it is very important to use for the calibration exactly the set of channels which is under study, because the spatial distribution may be different for different sets of channels. This, of course, is particularly important, if the influx is estimated not by a quantity which is directly proportional to total Ca- change but rather by a tiny fraction of it (the free calcium) with contributions from separate regions of the cell adding up non-linearly (see discussion below). Never- theless results obtained by using the different calibration measurements agree roughly within 20%.
Guerrero et al. (1994) used estimates of Ca-binding ratio together with estimates of accessible cell volume to calculate total Ca change from free Ca change. They obtained fractional Ca current by comparing total Ca change with the expected one (if all current were Ca current). They also correct for Ca being removed by pumps using an independently measured parameter describing the removal process. Except for this correc- tion, the method is quite similar to the one used by others. The estimate of Ca-binding ratio is based on [Ca2’] signals in response to activation of voltage-dependent Ca currents. In essence, therefore, Ca responses of a given non-specific current are compared to those of a voltage- activated current (which is assumed to be Ca specific).
BASIC PROBLEMS IN MEASURING CA-BINDING RATIO
When measuring Ca-binding ratio, the aim is to estimate the differential ratio of change in total Ca in some compartment over the change in free calcium. Total
Ca buffers and fluxes 1431
calcium changes can be estimated quite accurately in many types of experiments (e.g. by Ca specific current flow, iontophoretic current, or Ca injection). Free calcium change, however, can only be estimated as a concentration change (by some activity sensor, such as an indicator dye or a microelectrode). In most investigations so far, this dilemma has been solved by estimating the volume of the compartment (such as the accessible cell volume), calculating total concentration change, and forming the ratio of two concentrations. Free Ca concentration is usually measured by means of an indicator dye. The contribution of the indicator dye to Ca-binding ratio, then, has to be subtracted from the result a posteriori. In the “added buffer” approach the competition between the indicator dye and the endogen- ous buffers is explicitly used to estimate the binding capacity of the latter. In both cases the Ca-binding ratio of the indicator dye has lo be known. Both approaches have problems, which will be discussed in turn here.
Calibration of the Ca measurement Estimating Ca-binding ratio of the indicator dye
This problem is common to both types of measure- ment. In most cases calibration of indicator dyes or Ca electrodes is performed in terms of Ca concentration (not Ca-activity!) in the calibrating solution. This calibration is specific to the ionic milieu of the calibration solution. It has been repeatedly demonstrated that Ca indicator dyes have different properties in cytosol as compared to simple electrolytes (Baylor and Hollingworth, 1988; Hove-Madsen and Bers, 1992) and therefore do not indicate correct concentrations. The same is true for microelectrodes, which would indicate the correct concentration only if activity coefficients were the same in cytosol and in the calibration solution. In vivo calibration of indicator dyes (such as described in Neher, 1989) is only a partial solution to the problem. It does account for changes in indicator dye properties, but it relies on constancy of [Ca2’] (set by the calibration buffer, such as EGTA) between cytosol and pipette solution. However, during an in vivo calibration mea- surement, an equilibrium situation would dictate that the activity of calcium is the same in the calibration buffer and the cytosol such that
In the “added-buffer” approach, it is simply assumed that at steady state the Ca binding ratio of the dye is the same in the cytosol and in the pipette. In muscle cells, however, there is good evidence that cytosolic fura- is partially bound to proteins (Baylor and Hollingworth, 1988; Blatter and Wier, 1990). Hove-Madsen and Bers (1992) furthermore found that dyes actually accumulate in cytoplasm and that 72% of indo-l is bound to proteins, with the majority bound to a soluble fraction. They also found that fluorescence emission is reduced, and that its dissociation constant is increased up to a factor of four when the dye is bound to protein (see also Baylor and Hollingworth, 1988; Blatter and Wier, 1990). These influences of cellular constituents, however, seem to be particularly drastic in muscle cells, since in vivo dissociation constants of fura- in adrenal chromaffin cells were not very different from in vitro ones (Zhou and Neher, 1993a). Some of theses effects are accommo- dated, if in vivo calibration constants [Eq. (27)] are used for calculation of the dye’s Ca-binding ratio. However, accumulation of the dye in the cell would lead to an error in the estimate of its Ca-binding ratio unless protein- bound dye neither fluoresces nor binds Ca.
[Ca2+lcytosol = [Ca2+lcdibr. ’ E (31)
where y denotes single ion activity coefficients of calcium in the respective media. Since yCa,cyto is unknown-and probably hard to estimate-all in vivo Ca measurements are subject to an unknown error. This is the case both for measurements with indicator dyes and with Ca electrodes. A way to be aware of this error is to interpret the measured [Ca2’] as that concentration in a calibration buffer which has the same activity as the cellular calcium during the given measurement. In this
sense all Ca buffer measurements are wrong by a factor
of YCa,pipJYCa,cyto-
Estimating accessible cell volume
This problem is specific to the “straightforward” technique. Accessible volume very often is equated to the geometric cell volume. Sometimes the electrical cell capacitance is used as an indicator for cell thickness (Tse et al., 1994; Thomas et al., 1990). Also fluorescence of a dye can be used in comparison to the fluorescence of the same dye within a known volume (Zhou and Neher, 1993a). The latter approach assumes that the dye does not change its fluorescent properties--a problem that will be addressed below. In any case, estimation of cell volume will add to cell-to-cell variability.
The relationship between the estimate of the dye’s Ca- binding ratio IC,,~ and its “true” Ca-binding ratio in cytosol r+, is not straightforward, if we consider activity coefficients in the pipette solution to be different from those in the cytosol. At low [Ca2’], we have
K, h,pip
est = - 6
where &,pip is the total dye concentration in the pipette and KI; is the dissociation constant of the dye, as

Tab
le
1. C
&bi
ndin
g ca
paci
ty:
com
pari
son
of t
echn
ique
s an
d pr
epar
atio
ns.
The
col
umn
K g
ives
th
e C
a-bi
ndin
g ra
tio;
the
colu
mn
Ca-
calib
ratio
n gi
ves
the
resu
lts
of,
or t
he a
ssum
ptio
ns
mad
e in
Ca-
ca
libra
tion:
Kh
,+
, m
eans
in
vivo
val
ue o
f th
e dy
e’s
Ko,
est
imat
ed
acco
rdin
g to
Eq.
(27
); &
dye
mea
ns i
n vi
tro
or o
ther
val
ue u
sed
for
the
calib
ratio
n;
KD
,che
lato
r is t
he K
D o
f th
e ch
elat
or
used
in
an i
n vi
vo
calib
ratio
n in
cas
es
whe
re K
i w
as n
ot g
iven
Cel
l ty
pe
Ref
eren
ce
Met
hod
K
Ca-
calib
ratio
n C
omm
ent
Snai
l ne
uron
s (H
elix
por
n.)
Schw
ieni
ng
and
Tho
mas
(1
995)
Sn
ail
neur
ons
(Hel
ix p
orn.
) M
iille
r et
al.,
19
93
Snai
l ne
uron
s (L
ymne
a st
ag.)
Jo
hnso
n an
d B
yerl
y,
1993
R
etin
al
rods
(tig
er s
alam
ande
r)
Lag
nado
et
al.,
19
92
Neu
rohy
poph
ysia
l ne
rve
endi
ngs
Stue
nkel
, 19
94
Gon
adot
roph
s T
se e
t al
., 19
94
Mel
anot
roph
s T
hom
as
et a
l, 19
90
GH
s-ce
lls
(wild
typ
e)
Lle
do
et a
l., 1
992
GH
a-ce
lls
(Cal
bind
in-t
rans
fect
ed)
Lle
do
et a
l., 1
992
Adr
enal
ch
rom
affi
n ce
lls,
bovi
ne
Neh
er
and
Aug
ustin
e,
1992
A
dren
al
chro
maf
hn
cells
, bo
vine
N
eher
an
d A
ugus
tine,
19
92
Adr
enal
ch
rom
affi
n ce
lls,
bovi
ne
Zho
u an
d N
eher
, 19
93a
Bra
in s
ynap
toso
mes
(r
at)
Cer
eb.
Eur
kinj
e ce
lls (
rat)
Fo
ntan
a an
d B
laus
tein
, 19
93
Lla
no e
t al
., 19
94
Neu
rons
of
the
rat
nuc
leus
ba
salis
R
etin
al b
ipol
ar
cells
(go
ldfi
sh)
Ven
tric
ular
m
yocy
tes
(rat
) Sm
ooth
m
uscl
e,
coro
nary
ar
tery
(g
uine
a pi
g)
Stom
ach
smoo
th
mus
cle
(buf
o m
arin
us)
Tat
sum
i an
d K
atay
ama,
19
93
Kob
ayas
hi
and
Tac
hiba
na,
1995
B
erlin
er
al,
1994
G
anitk
evic
h an
d ls
enbe
rg,
1995
Gue
rrer
o et
al.,
19
94
fura
-2;
iont
opho
resi
s 36
0 fu
ra-2
, &
imag
ing,
ad
ded
buff
er
480
flu0
3;
cage
d-C
a 10
0 ae
quor
in;
Na-
Ca
exch
ange
cu
rren
t 36
4 fu
ra-2
, ad
ded
buff
er
174
indo
-1,
infl
ux v
s [C
ar”]
10
0 fu
ra-2
, in
flux
vs
[Ca*
+]
100
indo
-l,
infl
ux v
s [C
a2’]
13
0 in
do-1
, in
flux
vs
[Ca’
2]
310
fura
-2,
adde
d bu
ffer
75
tim
e co
nsta
nt,
adde
d bu
ffer
90
fu
ra-2
, ad
ded
buff
er
40
fura
-2;
radi
otra
cer
flux
fu
ra-2
, ad
ded
buff
er
x 10
00
4700
fura
-2,
infl
ux v
s [C
a”]
fura
-2;
infl
ux v
s [C
a”]
indo
-1,
infl
ux v
s [C
a2’]
in
do-1
, in
flux
vs
[Ca”
]
125
15&
300
128*
z
150
fura
-2;
infl
ux v
s [C
a2+
] 82
K D
,fur
a = 2
20 n
M
KD
, E~
TA
= 1
50 n
M
K D
,flu
aJ
= 65
6 nM
KD
, ~,y
p, =
400
nM
(pH
7.0
) K
Q ~
c+-p
, = 7
0 nM
@H
7.4
) K
h,tir
a =
770
nM
b K
D, i
ndo =
250
nM
a K
D, i
ndo =
250
nM
a K
;),f
ura_
2 = 1
50 n
M
K;)
,tira
_2 = 1
50 n
M
K;)
,fur
a_2 =
238
nM
K D
,fur
.+2 =
224
nM
K
l;,ti
ra_2
= 2
00 n
M
K;,
fura
_2 = 2
00 n
M=
K
Q E
GT
A = 1
78 n
M @
H 7
.2)
KD
, ind
o-1 =
330
nM
K
D, i
&,-
l =
200
nM
KD
,fur
a_2 =
200
nM
cons
tant
be
twee
n 20
and
120
nM
as
sum
ing
radi
al s
ymm
etry
maj
or
part
slo
wly
m
obile
extr
apol
ated
to
zer
o [i
ndo-
1]
incl
. th
e co
ntri
butio
n of
100
PM
fur
a-
incl
udes
20
-50
PM i
ndo-
l in
clud
es
20-5
0 PM
ind
o-l
cons
tant
be
twee
n 10
0 nM
and
1 P
M
cons
tant
be
twee
n 10
0 nM
and
1 P
M
incl
. ap
prox
25
% o
f sl
owly
m
obile
bu
ffer
calc
ulat
ed
from
A
[Ca2
’] b
etw
een
2 va
lues
of
[fu
ra-2
] in
clud
es
10 P
M [
fura
-2]
posi
tive
coop
erat
ivity
B
r =
123
PM
; K
D =
0.9
6 PM
ry
anod
ine-
inse
nsiti
ve
com
pone
nt
incl
udin
g 50
PM
fur
a-
a V
alue
fro
m G
rynk
iew
icz
et a
Z.,
1985
b C
alcu
late
d fr
om
in v
ivo
calib
ratio
n co
nsta
nts
and
Sn/S
br,
give
n by
the
aut
hors
. ’
Usi
ng
a re
lativ
ely
low
ion
ic
stre
ngth
ca
libra
tion
solu
tion.
*
A v
alue
of
50 i
s ob
tain
ed,
if t
he i
n vi
vo K
D o
f in
do-l
re
cent
ly
dete
rmin
ed
by B
assa
ni
et a
l. (1
995)
is
used
.
Ca buffers and fluxes 1433
estimated by an in viva calibration. The actual Ca- binding ratio k+,, however is:
BT kyto =
7cyto
KD,cyto (33)
where BT,cyto ad KD,cyto are total concentration and (concentration-based!) dissociation constant of the dye in the cytosol, respectively. ‘Therefore, we have
n b,pip KDTcyto est =--*-’
BT KG n to
cy (34) ,cyto
At low [Ca2’] & is almost identical to the free form of the dye, such that diffusional equilibrium requires
BT,pip/BT,cytoYB,cyto*/YB,piFl. KG, which represents the Ca concentration in the cytosol for which concentrations of the Ca-bound and free dye are identical, carries the same error as estimates of cytosolic Ca concentrations (see above), such that QYtO = K~ycOP~/~ca,cyrO. There- fore,
n ?B,cyto ‘Ypip
est = -- . - * kyto yB,pip Ycyto
(35)
The estimated value, thus, carries both the error due to uncertainties in the measurement of [Ca2+],,, (as do all other methods) and the error due to partitioning of the dye. The latter is specific for the “added-buffer” method. In alternative methods it shows up only in the correction for the dye. However, this error is traded for uncertainties in estimating accessible volume. Neher and Augustine (1992) showed that a relationship between these uncertain parameters can be established. From knowl-
edge off,,, one can calculate the accessible cell volume under the assumption that Br,pip is equal to Br,cyto. They found, that on average 85% of the geometrical cell volume was accessible which indicates that the error cannot be too large. This conclusion is in line with that of Tse ef al. (1994), that the indicator dye (indo-l in their case) probably is not accumulated to a large extent in their cells.
ESTIMATES OF CYTOSOLIC CALCIUM-BINDING RATIO IN VARIOUS CELL TYPES
In the following an overview will be given on published estimates of cellular Ca-binding ratio irrespec- tive of the method used. Unfortunately the terminology and the use of symbols in the literature on Ca buffering is quite confusing, probably because interest in Ca buffers arose in several subfields of cellular physiology. Traditionally, Ca buffering power was defined in analogy to pH-buffer as d[Ca2+ltot,r /dpCa (Ahmed and Connor, 1988) and, very often, the symbol /I was used to describe this “buffering power”. The same symbol #I was then used to denote “Ca-binding ratio”, as defined here, but NP 34:11-o
also the inverse of Ca-binding ratio was designated with the same symbol (Mathias et al., 1990; Wagner and Keizer, 1994). To circumvent ambiguities Neher and Augustine (1992) introduced the symbol IC and used the term “Ca-binding capacity” throughout to distinguish it from “Ca buffer capacity”, defined in terms of pCa. Tse et al. (1994) used the symbol fi and called the quantity “buffer strength”. They stress that /I denotes the ratio of finite differences, as opposed to the “differential binding capacity” IC. For the finite differences Neher and Augustine (1992) used the symbol rc’. Meanwhile it was pointed out (B. Hille, personal communication) that the term “capacity” is more appropriate for some “max- imum amount”, such as the total concentration of binding sites. Thus, the term “Ca-binding ratio” is used in this article with the expectation that all ambiguities are avoided this way.
Ca-binding ratio K, contrary to Ca buffering capacity (defined in terms of pCa), has the convenient property that it reaches a constant value for small Ca concentra- tions, which is given by the ratio of the molar concentration of the buffer divided by its dissociation constant [Eq. (8)]. This limiting value at low [Ca2’] will be extracted from literature data and listed in Table 1.
Squid axon and molluscan neurons
The earliest estimates of the ratio of bound calcium over free calcium go back to Hodgkin and Keynes (1957). They observed the diffusional broadening of a bolus of 45Ca injected into a squid axon and concluded that only about one fiftieth of the 45Ca is free to diffuse. These and other measurements using radio tracer methods were reviewed by Brinley (1978). The early measurements were made over many hours and undoubtedly are influenced by Ca-redistribution between cytosol and organelles. Nevertheless relatively low values for the ratio (x 40-50) were obtained.
Smith and Zucker (1980) stimulated Aplysia neurones and measured the change in free calcium by aequorin. They found that the increment in free Ca was only about 1% of the concentration change expected from knowl- edge of cell volume and the charge carried by calcium during depolarizing pulses. More recently, Belan et al. (1993) estimated Ca buffering in snail neurones (Helix pomatia) by applying a “Ca-clamp” (measuring [Cal by fura- and applying iontophoresis in a feedback loop). Imposing a step change they observed a transient of injection current followed by a plateau and interpreted the transient as the calcium required to load Ca-binding sites. They obtained a ratio of bound calcium over free of 360, which however, includes the Ca-binding ratio of fura-2. According to the parameters given by Belan et al. (1993) this should contribute x 100 at low [Ca2’]. Similarly, Schwiening and Thomas (1995) measured [Ca2+]-changes during iontophoresis in Helix aspersa. They point out difficulties in separating effects of true buffering from those of Ca sequestration and, therefore,

1434 E. Neher
propose the term “muffling” for the cellular action to limit Ca changes (Thomas et al., 1991). They arrive at a “muffling ratio” of 360 which would be equivalent to the Ca-binding ratio as defined here, if a satisfactory kinetic separation between Ca-binding and Ca sequestration were possible. This, however, may be difficult in cells as large as snail neurones, because diffusional redistribution within the cell is on the order of seconds, such that a precise kinetic separation is obscured. In order to explicitly take into account Ca gradients and diffisional redistribution, Mtiller et al. (1993) performed Ca- imaging measurements on Helix pomatia neurons, using fura-2. They extended the “added-buffer” approach to allow for spatial inhomogeneities. Assuming spherical symmetry within the cell they derived expression equivalent to Eq. (8) and Eq. (15) and found a Ca- binding ratio of 480. This value did not change with the amount of Ca influx, suggesting that the buffer is not saturated at Ca concentrations of up to 1 PM.
Johnson and Byerly (1993) circumvented problems of spatial inhomogeneity by using the caged-calcium compound DM-nitrophen. They found that [Ca2’], as measured by fluo-3, was elevated uniformly by UV- flashes. Maximal Ca-elevations for full flashes were about lOO-fold smaller when DM-nitrophen was loaded into neurones (Lymnea stagnalis) as compared to DM- nitrophen in microdroplets. No initial transient was seen in experiments with neurones, from which it was concluded that cellular Ca buffers bind Ca very rapidly with rate constants larger than 5*107 M-l set-‘. The Ca- binding ratio of cytoplasm was estimated as approx 100.
Photoreceptors and auditory hair cells
In salamander rod outer segments a short exposure to IBMX elicits a Ca rise, which, upon bright light exposure (which closes CGMP-gated channels) within a few seconds is reversed by a potent Na-Ca exchanger. Total Ca flux was estimated from the integral of the Na-Ca exchange current and free Ca change was measured by aequorin or else estimated from the peak Na-Ca exchange current (Lagnado et aZ., 1992). It was found that dialized outer segments, loaded with aequorin, had a low affinity buffer with a Ca-binding ratio of 16. In addition only a minor amount (z 17 ,uM) of high-affinity buffer was present. In contrast, intact rods had about 240 PM high affinity buffer with an estimated KD of 0.66 PM. This results in a total Ca-binding ratio at low [Ca2’] of w 360. The high affinity buffer was washed out with a time constant of about 15 min, indicating that the buffering is associated with a large diffusible molecule. Ca fluxes and Ca buffering play an important role in light adaptation.
In certain auditory hair cells Ca buffers act on a much faster time scale, being an important element in frequency tuning. Roberts (1994) analysed the role of Ca-channel clustering, Ca diffusion, and Ca buffering. By investigating the effect of added buffers on the kinetics of
Ca-activated K+ currents, he concluded that the endo- genous buffer is equivalent to 0.8-1.6 mM BAPTA or else = 1.5 mM of calbindin D28K (Roberts, 1993; Roberts, 1994). However, the relevant parameter for this comparison is not equilibrium Ca-binding ratio, but Ca- binding rate and buffer mobility.
Other neurons and neuroendocrine cells
Stuenkel (1994) evaluated cytosolic Ca-binding ratio of neurohypophysial nerve endings with the “added- buffer” technique and found a value of 174. This value was constant over a recording period of 300 set, which suggests that the endogeneous buffer has low mobility. It was concluded that the Ca-binding site must have a molecular weight >125 kDa or else be bound to cellular structures. In addition, a low-affinity, high-capacity buffering system was described, which limits [Ca2’] to M 600 nM.
In gonadotrophs of the pituitary Tse et al. (1994) estimated Ca-binding ratio by plotting total Ca influx (from depolarization-induced Ca current), versus change in free [Ca2’]. Such plots were linear up to increments (in free [Ca*‘]) of about 150 nM. The measurement was performed in several cells loaded with different concen- trations of indo-1. Subsequently, the slope of the plots was plotted against the concentration of indo-1. This allowed an extrapolation to zero [indo-11. The resulting “endogenous” Ca-binding ratio was found to be 100. Ca- binding ratio was constant over 10 min in the whole cell recording configuration, again indicating that the en- dogenous buffer is immobile. Thomas et al. (1990) performed a similar measurement using a single concentration of fura- (100 PM). They obtained a slope corresponding to a Ca-binding ratio of 100. The relationship between total Ca change and free Ca change was linear up to about 1 ,uM, a concentration at which the Ca-binding ratio of fura- should be negligible.
Lledo et al. (1992) measured Ca changes upon opening of Ca channels in a pituitary tumor cell line GHa. They compared wild-type cells with cells stably transfected with calbindinD28K. For wild-type cells they arrived at a Ca-binding ratio of 130, very similar to values found in pituitary cells. For transfected cells they found a value of 310. It is not known how much the indicator dye added to Ca-binding ratio, since cells were ester-loaded with indo- 1. However, it should be clear that the high values found in transfected should be dominated by calbindinD28k. Lledo et al. (1992) also found a slowing of recovery of [Ca*+]-elevations with transfection, as predicted by Eq.
(30). Neher and Augustine (1992) used the “added-buffer”
technique to study bovine adrenal chromaflm cells. They found a Ca-binding ratio of 75 which did not change when [Ca2’] was varied in the range 100 nM-1 PM. The Ca-binding ratio did not wash out during prolongued episodes of whole-cell recording, which led to the conclusion that buffers are not mobile. Zhou and Neher
Ca buffers and fluxes 1435
(1993a) made a special effort to detect mobile Ca buffers (see Methods), because their contribution is particularly important for Ca diffusion. They could not find any evidence for highly mobile Ca-binding sites, which might be due to nucleotides or low molecular weight metabo- lites. However, they found that in part of the cells a fraction of the Ca-binding ratio did wash out slowly. The time course pointed towards a Ca-binding protein of molecular weight between 7 and 20 kDa.
Thayer and Miller (1990) studied Ca buffering in rat dorsal root ganglion cells. They found that for short Ca current pulses approx l/180 of the injected calcium can be observed as free calcium. It is not clear, however, how much of this buffering was due to the indicator dye. Thayer and Miller (1990) also described a very potent mechanism of limiting Ca increases at higher [Ca2’], which they ascribed to mitochondrial Ca uptake.
Fontana and Blaustein (1993) studied radiotracer flux in rat brain synaptosomes. Comparing this with the fura- signal, they concluded that the Ca-binding ratio is approx 1000. Very high values of Ca-binding ratio were also inferred by Llano et al. (1994) for cerebellar Purkinje cells. They found that with 500 ,uM fura- depolariza- tion-induced Ca signals were only little attenuated with respect to those measured with 5&125 PM. From the small difference they obta:ined as coarse estimate for the Ca-binding ratio a value of 4700.
Tatsumi and Katayama (,1993) related Ca-entry evoked by depolarization of voltage clamped neurones from rat nucleus basalis to the fura- [Ca2’] signal. They arrived at a Ca-binding ratio of z 125. The contribution of fura- 2 should be negligible in th’&e measurements, since its concentration was only 10 PM.
Kobayashi and Tachibana (1995) studied Ca-regula- tion in presynaptic terminals of goldfish retina. They measured changes in [Ca2’] as a function of total Ca influx (estimated from voltage-dependent Ca currents). The relationship was strongly saturating with an initial slope of 150-300. In contrast to dorsal root ganglion cells (Thayer and Miller, 1990) and in contrast to rat chromaffin cells (Park et al., 1995) the saturation was not influenced by ruthenium red, which led the authors to conclude that mitochondrial Ca-uptake is not involved and that endogenous Ca buffering must have strong positive cooperativity.
Muscle cells
Fabiato (1983) discussed the various Ca-binding components in cardiac muscle in the context of Ca- induced Ca-release. Adding up all components he arrived at w 50 pmol per liter of cell volume for a change in free calcium from 0.1 to lpmol. The so-called passive Ca- binding (i.e. residual Ca-binding after blockage of “active” Ca retrieval mechanisms by ruthenium red and thapsigargin) was later measured by Hove-Madsen and Bers (1993) and compared to Fabiato’s model. Permeabilized rabbit ventricular myocytes were titrated
using Ca-selective electrodes and it was found that 97 ,umol/l cell water was required to raise [Ca2’] from 0.1 to 1pM. This is about twice the value predicted from Fabiato’s model. The data were best fitted by a binding curve assuming two sites (K1 = 0.42 PM; nl = 215 pmol/l cell water and & = 79 ,uM; n2 = 702 pmol/l cell water). At low [Ca2’] this would result in a x-value of 520.
Berlin et al. (1994) studied rat ventricular myocytes using single, indo-l loaded cells under whole-cell patch clamp conditions. They estimated Ca-binding ratio from the total Ca influx (calculated from the Ca current integral) and the change in free [Ca2’]. The decay of Ca- excursions is very fast in these cells due to potent Ca sequestration mechanisms. However, using ruthenium red and thapsigargin to block Ca-uptake, and working in Na-free conditions (to prevent Na-Ca exchange) Ca- decay can be slowed down into the 10 seconds range. Then, passive Ca-binding can be described by a single binding site with B,,, = 123 pmol/l cell water and a dissociation constant Ko = 0.96 ,uM. This results in IC = 128, a value only about one quarter of the value obtained with permealized cells. Berlin et al. (1994) discuss causes of this discrepancy, possibly very slow binding by Ca-Mg binding sites. The values given are based on an independent estimate of accessible cell volume and on the in vitro dissociation constant for indo- 1. If the dissociation constant of indo-l were increased in cytosol, as recently shown by Bassani et al. (1995) then the KD of the estimated buffer would also be increased and IC would be decreased to about 50. In contrast to these studies, microprobe x-ray analysis gave values for Ca- binding ratio approx 10 times higher (Wendt-Gallitelli and Isenberg, 1991). The differences may be explained by the fact that the x-ray analysis considers Ca changes on the pm and msec scale, whereas all other types of analysis take averages over the whole cell and over seconds.
In skeletal muscle a quantitative understanding of Ca binding to various cellular Ca-binding proteins is particularly important, because Ca binding and Ca removal occur simultaneously with Ca release from the SR. In order to study the latter, Melzer et al. (1986) developed a mathematical model which includes Ca binding to troponin C, parvalbumin and to the SR Ca- pump (Klein et al., 1990). The parameters which gave the best fit would predict a Ca-binding ratio of troponin of 32 (at low Ca; [Trop] = 250 PM; KD, Trap = 7.7 PM) and w 100 for SR Ca-binding sites of ([sites] = 200 PM; KD r=z 2 PM). Parvalbumin binds Ca relatively slowly (x 1 set-I) and, thus, should not be considered part of a “fast” Ca buffer. Baylor and Hollingworth (1988) used a total concentration of troponin Ca-binding site of 240 PM and a KD of 1.3 PM for calculating Ca-release from SR. This would result in an equilibrium Ca-binding ratio of 184. It should be pointed out, however, that during the short Ca-transient in a muscle twitch steady state is not
1436 E. Neher
reached, such that the concept of Ca-binding ratio, as used here, does not apply.
In smooth muscle cells Ganitkevich and Isenberg (1995) estimated Ca buffer capacity after blocking Ca release with ryanodine. Using indo-l they arrived at a value of 309. It was estimated that the contribution of indo-l was approximately half of this, such that the endogenous binding ratio should be z 150. Guerrero et al. (1994) arrived at a value of 82, which includes the contribution of 50 PM fura-2.
Buffer summary
Some of the results discussed above are summarized in Table 1. The numbers given are Ca-binding ratios at low [Ca2’]. In some cases this is calculated from total concentrations [Br] and a dissociation constant Ko according to IC = [Br]&. When available, the assump- tions or results regarding the Ca calibration are also given, because the Ca-binding ratio scales inversely with this quantity. This is typically seen, when comparing values given by Neher and Augustine (1992), which were based on an EGTA calibration, with those by Zhou and Neher (1993a) who used BAPTA for calibration. The former resulted in an in vivo KD of fura- of 150 nM while the latter gave an in vivo KD of 238 nM. Correspondingly all rc-values are much smaller in the latter work.
Some of the variability of K-values is probably due to differences in the techniques used. However, it is also clear that there are substantial differences between cell types. This is also apparent when comparing wild type and calbindin-transfected GHa cells. It appears, though, that cells which do not have any special requirement for Ca buffering can be expected to have a Ca-binding ratio between 50 and 150. In most cases studied, the majority of this binding was immobile, and in most cases it was relatively constant between resting [Ca2’] and z 1 PM.
FRACTIONAL CA PERMEABILITY OF SOME CA SPECIFIC AND NON-SPECIFIC CATIONIC CHANNEL
TYPES
In the method outlined above, the current through voltage-dependent Ca specific channels is taken as perfectly Ca-selective. In the following, the question will be discussed, how strictly this is the case and how other Ca specific currents relate to that. Also, a summary will be given on the fractional Ca permeability of some cationic, non-specific currents such as acetylcholine-, purinergic-, cyclicnucleotide- and glutamate-activated currents. The material presented is summarized in Table 2. It should be pointed out that fractional Ca-currents will depend on ion concentrations (particularly on [Ca2’],). Therfore, [Ca2’], is given in Table 2 together with Pf
Ca specific currents
Zhou and Neher (1993b) measured fmax values of voltage-activated Ca currents in chromaffin cells [which,
according to Eq. (22) are the “yardstick” for Ca permeation] under various extracellular Ca concentra- tions ([Ca2’],). They confirmed, that, within cell-to-cell variation, fmax was not different between [Ca2’], of l- 2 mM and 5-10 mM. Hoth (1995) measured the frac- tional Ca permeability of Ca-release activated current (IcRAc). He compared IcRAc in different preparations with voltage-activated current from 2 preparations and found IcRAc values consistently somewhat higher than 100%. This may indicate that there actually are current pathways which are more Ca specific than voltage- activated Ca currents. On the other hand IcRAc-currents are quite small, such that systematic errors may be more severe than those with voltage-activated currents.
Glutamate-activated currents
Among the non-specific cationic currents those activated by glutamate definitely attracted the most attention recently due to their Ca-carrying properties. The interest is focused on their involvement in generation of LTP and other neuromodulatory effects (for review see Bliss and Collingridge, 1993). Detailed knowledge of their Ca-carrying properties is required, since they are present in different structures of the brain in a variety of pharmacologically and molecularly distinguishable forms. Ca selectivity has been characterized extensively in the past by means of reversal potential measurement, and it became clear that channels of the NMDA-type are much more Ca selective than AMPAikainate-type channels (Mayer and Westbrook, 1987; Bumashev et al., 1992). When Schneggenburger et al. (1993) first studied fractional Ca current in septal neurons, they found that the relative difference in Ca-carrying ability between NMDA (Pf = 6.8%) and AMPA/kainate type channels (Pf = 1.4%) was not as large as expected from previous reversal potential measurements. Bumashev et al. (1995), then, studied systematically Pf-values of various recombinant receptor subunit combinations expressed in HEK-cells. They found variations in Pf- values over a more than 50-fold range, with NMDA- receptor combinations in the range 8-ll%, various AMPA-receptor combinations occupying a middle range in Pfvalues between 3.9 and 0.5% and some channels of the fully edited R-form of kainate receptors having a Pf- value as small as 0.2% (see numbers in Table 2). This shows that various AMPA-receptor subunit combinations can contribute significantly to Ca influx, and that AMPA receptor channels may contribute as much to peak Ca influx during an EPSP (due to the large current amplitude) as NMDA-type current (discussed by Koh et al., 1995). It also became clear that combinations of the known subunits provide a multitude of Ca-carrying features which allows fine tuning of the Ca signal.
One feature of NMDA currents, which was apparent both in the work on neurons (Schneggenburger et al., 1993) and in the work on cloned receptor subunit combinations was that block of current by Mg2+ does

Tab
le
2. F
ract
iona
l C
a-cu
rren
ts:
the
prop
ortio
n of
tot
al m
embr
ane
curr
ent
carr
ied
by C
a*+,
as
estim
ated
fr
om
Eq.
(15
), u
nles
s sp
ecif
ied
othe
rwis
e
Cur
rent
typ
e C
ell
type
R
efer
ence
frac
tiona
l C
a-cu
rren
t %
[C
a2’]
, m
M
Ca-
rele
ase
activ
ated
1-
c C
a-re
leas
e ac
tivat
ed
1-c
Ca-
rele
ase
activ
ated
1-
c G
luta
mat
e-ac
tivat
ed
@M
DA
-typ
e)
Glu
tam
ate-
activ
ated
(A
MPA
/kai
nate
) re
com
b.
NR
l-N
R2A
(N
MD
A-t
ype)
re
com
b.
NR
l-N
R2C
(N
MD
A-t
ype)
re
com
b.
Glu
R-A
(A
MPA
-typ
e)
reco
mb.
G
luR
-D (
AM
PA-t
ype)
re
com
b.
Glu
R-B
(Q)
(AM
PA-t
ype)
re
com
b.
Glu
R-6
(V,C
,Q)(
kain
ate_
type
) re
com
b.
Glu
R-6
(V,C
,R)(
kain
ate_
type
) G
luta
mat
e-ac
tivat
ed
(NM
DA
-typ
e)
Glu
tam
ate-
activ
ated
(N
MD
A-t
ype)
G
luta
mat
e-ac
tivat
ed
(non
-NM
DA
-typ
e)
Ace
tylc
holin
e-ac
tivat
ed,
nico
t. A
cety
lcho
line-
activ
ated
, ni
cot.
Ace
tylc
holin
e-ac
tivat
ed,
nico
t. A
cety
lcho
line-
activ
ated
, ni
cot.
Ace
tylc
holin
e-ac
tivat
ed,
nico
t.
mas
t ce
lls
RB
L c
ells
Ju
rkat
cel
ls
sept
al
neur
ons
sept
al
neur
ons
expr
esse
d in
HE
K 2
93 c
ells
ex
pres
sed
in H
EK
293
cel
ls
expr
esse
d in
HE
K 2
93 c
ells
ex
pres
sed
in H
EK
293
cel
ls
expr
esse
d in
HE
K 2
93 c
ells
ex
pres
sed
in H
EK
293
cel
ls
expr
esse
d in
HE
K 2
93 c
ells
hi
ppoc
ampa
l ne
uron
s C
Al-
pyra
mid
al
neur
ons
CA
l-py
ram
idal
ne
uron
s m
uscl
e B
C3H
l ce
lls
adre
nal
chro
maf
fin
cells
(r
at)
adre
nal
chro
maf
fin
cells
(b
ovin
e)
sym
path
etic
ne
uron
es
(rat
) sy
mpa
thet
ic
neur
ones
(r
at)
AT
P-ac
itvat
ed
smoo
th
mus
cle
(gui
nea
pig)
AT
P-ac
itvat
ed
secr
etag
ogue
-act
ivat
ed
caff
eine
-ind
uced
sym
path
etic
ne
uron
s (r
at)
mas
t ce
lls
(rat
) sm
ooth
m
uscl
e (b
ufo
mar
inus
)
c-G
MP
activ
ated
re
tinal
ro
ds (
tiger
sal
aman
der)
c-G
MP
activ
ated
c-
GM
P ac
tivat
ed,
bovi
ne
retin
al
rod
c-G
MP
activ
ated
, bo
vine
re
tinal
ro
d c-
GM
P ac
tivat
ed,
bovi
ne
olfa
ct.
neur
ons
retin
al
cone
s (t
iger
sa
lam
ande
r)
expr
esse
d in
HE
K 2
93 c
ells
ex
pres
sed
in H
EK
293
cel
ls
expr
esse
d in
HE
K 2
93 c
ells
Hot
h,
1995
98
H
oth,
19
95
107
Hot
h,
1995
10
3 Sc
hneg
genb
urge
r et
al.
, 19
93
6.8
Schn
egge
nbur
ger
et a
l.,
1993
1.
4 B
umas
hev
ei a
l.,
1995
11
.04
Bum
ashe
v et
al.,
19
95
8.2
Bum
ashe
v et
aZ
., 19
95
3.2
Bum
ashe
v ef
aZ
., 19
95
3.9
Bum
ashe
v et
al.,
19
95
3.4
Bum
ashe
v et
aZ
., 19
95
1.55
B
umas
hev
et a
l., 1
995
<0.
2 R
oger
s an
d D
ani,
1995
12
.4
Gar
asch
uk
et a
l.,
1995
11
G
aras
chuk
ef
al.,
19
95
0.6
Vem
ino
et a
l.,
1994
2
Vem
ino
et a
l.,
1994
4.
1 Z
hou
and
Neh
er,
1993
b 2.
5 R
oger
s an
d D
ani,
1995
4.
7 T
rous
lard
er
al.
, 19
93
2.2
Schn
eide
r et
af.
, 19
91
7
Rog
ers
and
Dan
i, 19
95
Faso
lato
et
al.,
19
93
Gue
rrer
o er
uZ
., 19
94
6.5
2.5
mM
3.
6 2m
M
20
1.8
mM
Lag
nado
et
al.,
199
2 9.
7
Perr
y an
d M
cNau
ghto
n,
1991
21
Fr
ings
et
al.,
19
95
2.5
Frin
gs
et a
l.,
1995
5.
8 Fr
ings
et
al.,
199
5 3.
9
10 m
M
10 m
M
10 m
M
1.6
mM
* 1.
6 m
M*
1.8
mM
1.
8 m
M
1.8
mM
1.
8 m
M
1.8
mM
1.
8 m
M
1.8
mM
2.
5 m
M
1.6
mM
* 1.
6 m
M*
2.5
mM
2.
5 m
M
2mM
2.
5 m
M
2.5
mM
3.6
mM
1mM
1mM
0.
3 m
M
0.3
mM
0.
3 m
M
rela
tive
to m
ean
of v
olta
ge-a
ctiv
ated
C
a-cu
rren
ts
from
va
riou
s ce
ll ty
pes
rela
tive
to c
ontr
ol
whe
re
Ca2
+ is
the
onl
y pe
rmea
nt
ion
B
s
rela
tive
to c
ontr
ol
whe
re
Ca2
+ is
the
onl
y pe
rmea
nt
ion
,”
rela
tive
to c
ontr
ol
whe
re
Ca2
+ is
the
onl
y pe
rmea
nt
ion
2 in
crea
ses
with
hy
perp
olar
izat
ion
E
rela
tive
to c
ontr
ol
whe
re
Ca’
+ i
s th
e on
ly p
erm
eant
io
n co
mpa
riso
n of
ago
nist
in
duce
d an
d vo
ltage
-act
ivat
ed
?
curr
ents
at
100
PM
Ind
o-l
z co
mpa
riso
n of
ago
nist
in
duce
d an
d vo
ltage
-act
ivat
ed
curr
ents
at
100
PM
Ind
o-l
rela
tive
to c
ontr
ol
whe
re
Ca2
+ is
the
onl
y pe
rmea
nt
ion
from
se
para
te
estim
ates
of
[C
a”]
sign
al,
acce
ssib
le
volu
me,
an
d C
a-bi
ndin
g ca
paci
ty
ratio
of
Ca-
curr
ent,
as e
stim
ated
fr
om
Na+
-Ca*
+,
K
exch
ange
cu
rren
t ov
er
dark
cur
rent
alm
ost
entir
ely
carr
ied
by C
a*+
at
[Ca2
’],
= 3
mM
‘Tot
al b
ath
calc
ium
co
ncen
trat
ion
was
2 m
M;
a re
duce
d [C
a*‘]
, w
as e
nter
ed
due
to C
a-bi
ndin
g to
bic
arbo
nate
bu
ffer
.
1438 E. Neher
not influence the Pf value. This can be interpreted in the sense that Mg2+-block is all or nothing: the ratio of Ca2+ over monovalent flux is normal during episodes of unblock whereas neither Ca2+ nor other ions permeate during blocked periods. The independence of Pf on Mg2+ was confirmed by Garaschuk et al. (1995) who studied Pf values of hippocampal CAl-pyramidal neurons. These authors, in addition, showed that Pfvalues of channels in the proximal dendrites are identical to those in the soma (NMDA: Pf = 11%; non-NMDA: Pf = 0.6%). In all studies on glutamate channels, so far, the Pfvalue was quite constant in the voltage range between -25 and - 80 mV.
Other nonspecific currents
Ca permeability of acetylcholine activated currents also received ample attention. It was found both by reversal potential measurement (Vernino et al., 1992) and by determination of Pf (Vernino et al., 1994; see section on alternate techniques for a description of the method used) that neuronal nicotinic acetylcholine receptor channels from chromaffin cells or sympathetic neurons (Rogers and Dani, 1995) are about twice as permeable to Ca2+ as muscle-type nicotinic acetylcholine receptor channels. Zhou and Neher (1993b) also found a relatively high value for Pf in adrenal chromaffin cells (bovine). They showed that the fractional Ca current increases with hyperpolarization-a feature expected from simple barrier models of ion permeation. Trouslard et al. (1993) measured the ratio of A[Ca”‘] to total charge transfer during nicotinic stimulation in sympathetic ganglia and found this to be 2.2% of the value obtained when activating voltage-dependent Ca current.
Purinergic currents also received much attention after the initial report of a relatively high Ca selectivity of ATP-activated currents in smooth muscle cells by Benham and Tsien (1987). Schneider et al. (1991) estimated fractional Ca current in myocytes from urinary bladder and arrived at a value of 5.8%, quite close to what they predicted from a barrier model of ion permeation (7%) which was designed to reproduce the reversal potential shifts in the same preparation. Rogers and Dani (1995) gave a value of 6.5% for the fractional Ca current of purinergic currents in rat sympathetic neurons. These values are higher than those of both neuronal and muscle type acetylcholine receptor channels.
Fasolato et al. (1993) measured fractional Ca current of nonspecific cationic current in mast cells. Their value (3.6%) is in between that of the two nicotinic types. A very high fractional Ca current of = 20% (1.8 mM external [Ca2’] was observed by Guerrero et al. (1994) for caffeine-induced nonspecific currents in smooth muscle cells (stomach of Bufo marinus).
Cyclic-nucleotide guted channels
In photoreceptor cells Ca influx through cGMP-gated channels plays an important role in adaptation. In
olfactory neurons, in addition, CAMP-gated channels activate other current components. Thus, many attempts were made in the past to estimate fractional Ca current by various techniques. Values ranged from = 10% (Lagna- do et al., 1992) to 19% (Nakatani and Yau, 1988) for rods and around 20% for cones (Perry and McNaughton, 1991). More recently, Frings et al. (1995) compared Pr values between rod channels, cone channels, and olfactory channels, expressed in HEK cells. They did their measurements in whole-cell recording and thus were not able to apply short pulses of “agonists” (cGMP or CAMP). Instead, they infused the nucleotides perma- nently through the patch pipette and blocked the developing current by extracellular Mg2+ except for short episodes. To keep Ca influx within limits these experiments were restricted to relatively small concen- trations of extracellular calcium ([Ca2’],). At 0.3 mM [Ca2’], P,-values (see Table 2) roughly agree with those predicted from reversal potentials. However, at higher concentrations marked deviations were apparent. With olfactory-type channels Frings et al. (1995) managed to measure Pfvalues up to 3 mM [Ca2’],. It was found that Pf rises steeply with [Ca2’], and that already at 3 mM almost 100% of the current is carried by calcium.
COMPARISON BETWEEN CA SELECTIVITY MEASURED BY REVERSAL POTENTIAL AND BY
THE ELUORIMETRIC FLUX TECHNIQUE
Traditionally selectivity has been determined at the reversal potential, i.e. at the point of zero current. The fluorimetric flux technique, as described here, implies division by the current integral, which is not possible at the reversal potential. Thus, results of the two techniques cannot be compared in the strict sense. However, it is possible, by making constant field assumptions, to calculate Pf at any potential when PcaIPM is given, and vice versa. Here PM means the permeability of mono- valent ions, which, for simplicity, is assumed to be the same for all permeable monovalent cations. Furthermore, it is assumed that total monovalent ion concentrations inside and outside are the same ([M+]), and that internal [Ca2’] is negligible for flux. In that case, a simple relationship is obtained (Bumashev et al., 1995):
l/Pf = 1+ (~lu/~~~>([~‘]/[C~“‘])
(1 - exp(2V,I;/RT))/4 (36)
Several authors (Schneggenburger et al., 1993; Buma- shev et al., 1995; Frings et al., 1995) compared P,-values with permeability ratios on the basis of Eq. (36). Both, Bumashev et al. (1995) and Frings et al. (1995) found that values roughly agree for very low [Ca2’], (< 0.3 mM). However, at physiological concentration most channel types show deviations. This was particu- larly apparent in olfactory channels, where at 3 mM [Ca2’], practically all current was carried by Ca whereas
Ca buffers and fluxes 1439
bionic reversal potential indicated a P&PM of 4.6 (Frings et al., 1995). For the recombinant glutamate channels deviations were in both directions for different subunit combinations. Further analysis and detailed comparison between the two measures of permeability undoubtedly will lead to a better understanding of the dual role of calcium as both a channel blocker and a charge carrier.
IMPROVED PRECISION IN FLUORIMETRIC FLUX MEASUREMENT
So far, the techniques of fluorimetric flux measure- ment, described earlier in this chapter, have proved to be quite robust and reproducible. Pfvalues, typically, have a coefficient of variation of about 0.1 for values between 5 and 10% and 0.1-0.3 for smaller values. For a quantitative analysis of ion permeation mechanisms somewhat higher accuracy would be desirable. Rogers and Dani (1995) proposed to perform the calibration on each individual cell and .with the very same channels which are tested (by using media with Ca2+ as the only permeable cation). This may be possible in certain cases. However, in other cases, this may either imply very small currents or else massive Cai influx which readily activates Ca-dependent currents. The procedure is, of course, mandatory if, as chosen b:y Rogers and Dani (1995) the total amount of Ca influx is estimated by the change in concentration of free calcium, which, under the condi- tions of the measurement represents only a tiny fraction of total calcium. Under stringent conditions the Ca- concentration change may be proportional to the total amount of Ca-influx. H;owever, the proportionality constant is different from cell to cell (it includes cell volume). It will be different for different regions of a given cell (due to variations in thickness) even if the dye is the dominating buffer throughout. These variations have to be taken care of by a cell-specific calibration. Even then spatial variations in the signal lead to errors unless the Ca signal during the calibration measurement is exactly proportional throughout the cell to that of the test measurement (see alscl Introduction).
With the methods described above neither cell volume variations nor spatial heterogeneity within a cell matters unless there are regions inside the cell where the term &/(K’~ + KS) of Eq. (21) markedly deviates from unity. This, to a certain degree, will always happen with finite dye concentration. ThereBore, it may actually be more accurate, to determine inax in Eq. (22) not by an extrapolation (as is necessary for obtaining the “best” fmax for the analysis of endogenous buffers, Eq. (17). Rather, one should determine fmax as that F-Q-ratio, which is obtained for a pure Ca current under the same concentration of dye and with fluorescence signals similar in amplitude to those of the test measurement. Further improvement maly be obtained by a better fluorescence standard. Particularly, it would be advanta- geous, if a standard were available, whose absorption
spectrum and Stokes-shift matches that of the Ca-free form of the dye. Possibly measurements at other wavelength or with other Ca indicator dyes may be more precise. Finally, care should be taken to avoid a positive pressure head in the pipette and misadjustments of tonicity in the pipette filling solution, since cell swelling most likely changes fmax (Zhou and Neher, 1993b).
COMPARISON OF METHODS
The various methods discussed for measuring Ca buffer and Ca fluxes each have their advantages and disadvantages. These are best discussed in the light of the question why it might be advisable to measure these two quantities. Some of the possible reasons are as follows:
(1) To calculate the change in free [Ca2’] as a function of a measured membrane current. To this end both an estimate of fractional Ca current, of accessible cell volume, and of the total buffer capacity under the condition of the experiment is required.
(2) To study ion-permeation mechanisms. In that case a Pf measurement as accurate as possible is necessary.
(3) To learn about Ca-binding proteins. This obviously requires an accurate estimate of its cellular Ca- binding ratio.
(4) To understand the process of Ca-diffusion. To this end not only an estimate of Ca-binding ratio, but also of the mobility of the buffer is required.
(5) To be able to dissociate between Ca influx and Ca release from intracellular stores. This can be accomplished under the assumption that any changes in fluorescence not accounted for by influx (on the basis of fractional Ca current) or by slow sequestra- tion mechanisms are due to Ca release (Guerrero et al., 1994).
(6) To estimate how severely the [Ca2’] measurement is influenced by the chelating action of the dye.
When comparing methods for Ca flux and Ca selectivity it is obvious that fluorimetric flux measure- ment and the measurement of the permeability ratio by reversal potential are complementary in many aspects. This is particularly true for goal (2) (understanding permeation mechanisms). Permeability ratios from re- versal potential measurements are extremly valuable because many simplifications and predictions can be made in the theoretical treatment of ion permeation at the reversal potential. For predicting Ca changes and fluxes, on the other hand, Pfvalues will usually be superior, because predictions from permeability ratios will always imply an extrapolation to non-zero-current. Also, Pr values turn out to be the best possible means of

1440 E. Neher
estimating C&permeation during synaptic activation in branched neuronal processes, where ion substitution is not possible (Garaschuk et al., 1995). Comparing the approach suggested by Rogers and Dani (1995) with that described by Schneggenburger et al. (1993) and Zhou and Neher (1993b) it can be stated, that cell-specific calibration by exactly the set of channels under study may lead to more accurate results in some cases. However, it is much more laborious and may invoke additional problems (see above, p. 1439).
When discussing problems and errors in methods of buffer measurement, it was pointed out that all methods suffer the problem of misjudging Ca concentration changes, measuring instead the cytosolic Ca activity which is at equilibrium with either a pipette filling solution or the solution used for calibrating a Ca electrode. What we usually refer to as a Ca-binding ratio is therefore a mixed ratio of total Ca concentration change over free-activity change. This is actually not a disadvantage, since for all purposes listed above we are interested in the action of free calcium (such as binding to regulatory proteins) which is determined by its thermo- dynamically defined “activity” and not by its concentra- tion. Other influencess of the cytosolic environment on the fluorescence signal (such as that of viscosity, fluorescence quenching by other constituents, etc.) are quite complex, but should be taken care of by an in vivo calibration measurement.
It was discussed in the section on “basic problems” (p. 1431, above) that each class of methods, in addition, suffers from a problem which is specific to the method. The traditional technique of relating total Ca change to change in free calcium needs an estimate of accessible cell volume, the “added buffer” approach needs an estimate of the binding capacity of an added chelator (usually the indicator dye itself). The former problem can be approached with a wide range of effort-from a simple estimation of geometric volume to fluorescence and radiotracer techniques. The latter problem is mainly that of possible accumulation of the dye inside the cell by binding to cellular constituents. For many of the aims specified above it is only important to learn about relative changes in Ca-binding ratio (in response to some manipulation). Then, -both classes of methods should give equivalent results, as long as either the acessible volume fraction or the partitioning coefficient of the dye stays constant. Comparison of the merits of the one or the other technique should then mainly regard ease of performing the measurement and reproducibility. In other cases the absolute value of Ca-binding ratio is actually required. Then, the safest approach is to compare results from both methods and to define brackets of reliability. There is one point, however, in which the added buffer approach should be exactly what is needed-when estimating the influence of the indicator dye on the measurement of [Ca2’]. This is because it is based explicitly on the evaluation of the competition
between the dye and the endogeneous buffer. Regarding this problem it must be stated that the scientific community is unbelievably forgiving. In spite of hundreds of publications, that have appeared using fura- and other indicator dyes, only a few attempts have been reported to quantitatively assess the degree to which the Ca signal is actually attenuated by the presence of the dye. This is quite unlike other areas of research, electrophysiology providing an example. The basic measuring techniques “current clamp” and “voltage clamp” are somewhat analogous to the two extreme situations relevant to Ca indicator dyes. On the one hand, at very low indicator dye, an unperturbed [Ca2’] signal is measured (just like an unperturbed voltage signal which is measured in current clamp). At high indicator concentration [Ca2’] is fixed (as is the voltage in voltage clamp) and a flux is being measured. If a publication would not specify whether some measurement was performed in voltage clamp or current clamp it would be considered worthless. With Ca indicator dyes, on the other hand, it is the rule, not to know in how far the dye influences the result. Measuring endogenous Ca binding ratio by the “added buffer” technique evaluates exactly how the added indicator dye influences the Ca balance. Even if the exact chelator concentration inside the cell is not known, the value obtained is in terms of whatever is in diffusional equilibrium with a pipette solution of known composition. Adjusting, then, Ca-binding ratio of the pipette filling solution either to values much lower or much higher than the “endogenous” one, will allow one to either measure unperturbed signals in free [Ca2’] or else Ca fluxes at fixed [Ca2’].
Acknowledgements-I would like to thank my colleagues, particularly Donald Bers, John Dani, Bertil Hille, Markus Hoth, Gerrit Isenberg, Benjamin Kaupp, Arthur Konnerth, Ralf Schneggenburger, Christof Schwiening, Amy Tse and Zhuan Zhou for pointing out relevant literature and for providing unpublished material. Research in my laboratory is being supported presently by grants from the EC Networks Program (Nr. CHRXCl940500) and by the Human Science Frontier Program (Ref. Nr.: RG4/95B).
REFERENCES
Ahmed Z. and Connor J. A. (1988) Calcium regulation by and buffer capacity of molluscan neurons during calcium transients. Cell Calcium 9: 57-69.
Bassani J. W. M., Bassani R. A. and Bers D. M. (1995). Calibration of Indo-l and resting intracellular [Cali in intact rabbit cardiac myocytes. Biophys. J. 68: 1453-1460.
Baylor S. M. and Hollingworth S. (1988) Fura- calcium transients in frog skeletal muscle fibres. J. Physiol. 403: 151- 192.
Baylor S. M., Chandler W. K. and Marshall M. W. (1982) Use of metallocbromic dyes to measure changes in myoplasmic calcium during activity in frog skeletal muscle fibres. J. Physiol. 331: 139-177.
Belan P., Kostyuk P., Snitsarev V. and Tepikin, A. (1993)
Ca buffe :rs and fluxes 1441
Calcium clamp in isolated neurones of the snail Helir pomatia. J. Physiol. 462: 47-58.
Benham C. D. and Tsien K. W. (1987) A novel receptor- operated Ca*+-permeable channel activated by ATP in smooth muscle. Nature 328: 275-278.
Berlin J. R., Bassani, J. W. M. and Bers D. M. (1994) Intrinsic cytosolic calcium buffering properties of single rat cardiac myocytes. Biophys. J. 67: 1775-1787.
Blatter L. A. and Wier W. G. (1990) Intracellular diffusion, binding, and compartmentalization of the fluorescent cal- cium indicators indo-l and fura-2. Biophys. J. 58: 1491- 1499.
Bliss T. V. P. and Collingridge G. L. (1993) A synaptic model of memory: long-term potentiation in the hippocampus. Nature 361: 31-39.
Brinley F. J. (1978) Calcium buffering in squid axons. A. Rev. Biophys. Bioeng. 7: 363-392.
Bumashev N., Schoepfer R., Monyer H., Ruppersberg J. P., Gunther W., Seeburg P.H. and Sakmann B. (1992) Control by asparagine residues of calcium permeability and magne- sium blockade in the NMDA receptor. Science 257: 141% 1419.
Bumashev N., Zhou Z., Neher E. and Sakmann B. (1995) Fractional calcium currents through recombinant GluR channels of the NMDA, AMPA and kainate receptor subtypes. J. Physiol. 485: 403-418.
Fabiato A. (1983) Calcium-induced release of calcium from the cardiac sarcoplasmic reticulum. Am. J. Physiol. 245: Cl- c14.
Fasolato C., Hoth M., Matthews G. and Penner R. (1993) Ca*+ and Mn*+ influx through receptor-mediated activation of nonspecific cation channels in mast cells. Proc. Natn. Acad. Sci. U.S.A. 90: 3068-3072.
Fontana G. and Blaustein M. P. (1993) Calcium buffering and free Ca*+ in rat brain synaptosomes. J. Neurochem. 60: 843- 850.
Frings S., Seifert R., Godde M. and Kaupp U. B. (1995) Profoundly different calcium permeation and blockage determine the specific function of distinct cyclic nucleo- tide-gated channels. Neuron. 15: 169-179.
Ganitkevich V.Y. and Isenberg G. (1995) Efficacy of peak Ca*+ currents (Zti) as trigger of sarcoplasmic reticulum Ca*+ release in myocytes from the guinea-pig coronary artery. J. Physiol. 484: 287-306.
Garaschuk O., Schneggenburger R., Schirra C., Tempia F. and Konnerth A. (1995) Fractional calcium currents through somatic and dendritic glutamate receptor channels of hippocampaL CA1 pyramidal neurons. J. Physiol. In press.
Grynkiewicz G., Poenie M. and Tsien R. Y. (1985) A new generation of Ca2+ in’dicators with greatly improved fluorescence properties. J. Biol. Chem. 260: 3440-3450.
Guerrero A., Singer J. J. and Fay F. S. (1994) Simultaneous measurement of Ca*+ release and influx into smooth muscle cells in response to caffeine. J. Gen. Physiol. 104: 395422.
Hodgkin A. and Keynes R. D. (1957) Movement of labelled calcium in squid giant axons. J. Physiol. 138: 253-281.
Hoth M. (1995) Calcium and barium permeation through calcium release-activated. calcium (CRAC) channels. Pflii- gers Arch. 430: 315-322.
Hove-Madsen L. and Bers D. M. (1992) Indo-l binding to protein in permeabilized ventricular myocytes alters its spectral and Ca binding properties. Biophys. J. 63: 89-97.
Hove-Madsen L. and Bers D. M. (1993) Passive Ca buffering
and SR Ca uptake in permeabilized rabbit ventricular myocytes. Am. J. Physiol. 264: C677-C686.
Johansson J. S. and Haynes D. H. (1988) Deliberate quin-2 overload as a method for in situ characterization of active calcium extrusion systems and cytoplasmic calcium binding: application to the human platelet. J. Membr. Biol. 104: 147- 163.
Johnson B. D. and Byerly L. lular Ca*+ rapidly blocks 1
1993) Photo-released intracel- Ba + current in Lymnaea neurons.
J. Physiol. 462: 321-347. Klein M. G., Simon B. J. and Schneider M. F. (1990) Effects of
caffeine on calcium release from the sarcoplasmic reticulum in frog skeletal muscle fibres. J. Physiol. 425: 599-626.
Kobayashi K. and Tachibana M. (1995) Ca2+ regulation in the presynaptic terminals of goldfish retinal bipolar cells. J. Physiol. 483: 79-94.
Koh D.-S., Geiger J.R.P., Jonas P. and Sakmann B. (1995) Ca*+-permeable AMPA and NMDA receptor channels in basket cells of rat hippocampal dentate gyms. J. Physiol. 485: 383-402.
Lagnado L., Cervetto L. and McNaughton P. A. (1992) Calcium homeostasis in the outer segments of retinal rods from the tiger salamander. J. Physiol. 455: 111-142.
Llano I., DiPolo R. and Marty A. (1994) Calcium-induced calcium release in cerebellar Purkinje cells. Neuron 12: 663- 673.
Lledo P.-M., Somasundaram B., Morton A. J., Emson P. C. and Mason W. T. (1992) Stable transfection of calbindin-Dak into the GHs cell line alters calcium currents and intracellular calcium homeostasis. Neuron 9: 943-954.
Markram H. and Sakmann B. (1994) Calcium transients in dendrites of neocortical neurons evoked by single subthres- hold excitatory postsynaptic potentials via low-voltage- activated calcium channels. Proc. Natn. Acad. Sci. U.S.A. 91: 5207-5211.
Mathias R. T., Cohen I. S. and Oliva C. (1990) Limitations of the whole cell patch clamp technique in the control of intracellular concentrations. Biophys. J. 58: 759-770.
Mayer M. L. and Westbrook G. L. (1987) Permeation and block of N-methyl-D-aspartic acid receptor channels by divalent cations in mouse cultured central neurones. J. Physiol. 394: 501-527.
Melzer W., Rios E. and Schneider M. F. (1986) The removal of myoplasmic free calcium following calcium release in frog skeletal muscle. J. Physiol. 372: 261-292.
Meves H. and Vogel W. (1973) Calcium inward currents in internally perfused giant axons. J. Physiol. 235: 225-265.
Miiller T. H., Partridge L. D. and Swandulla D. (1993) Calcium buffering in bursting Helix pacemaker neurons. Pjltigers Arch. 425: 499-505.
Nakatani K. and Yau K.-W. (1988) Calcium and magnesium fluxes across the plasma membrane of the toad rod outer segment. J. Physiol. 395: 695-729.
Neher E. (1989) Combined fura- and patch clamp measure- ments in rat peritoneal mast cells. In: Neuromuscular Junction (Sellin L. C., Libelius R. and Thesleff S., Eds.), pp. 65-76. Elsevier, Amsterdam.
Neher E. and Augustine G. J. (1992) Calcium gradients and buffers in bovine chromaftin cells. J. Physiol. 450: 273-301.
Park Y. B., Herrington J. and Hille B. (1995) Calcium homeostasis in rat adrenal chromaffin cells. Biophys. J. 68: A230.
Perry R. J. and McNaughton P. A. (1991) Response properties

1442 E. Neher
of cones from the retina of the tiger salamander. J. Physiol. 433: 561-587.
Roberts W. M. (1993) Spatial calcium buffering in saccular hair cells. Nature 363: 74-76.
Roberts W. M. (1994) Localization of calcium signals by a mobile calcium buffer in frog saccular hair cells. J. Neurosci. 14: 3246-3262.
Rogers M. and Dani J. A. (1995) Comparison of quantitative calcium flux through NMDA, ATP, and ACh receptor channels. Biophys. J. 68: 501-506.
Schneggenburger R., Zhou Z., Konnerth A. and Neher E. (1993) Fractional contribution of calcium to the cation current through glutamate receptor channels. Neuron 11: 133-143.
Thomas P., Surprenant A. and Almers W. (1990) Cytosolic Ca2+, exocytosis, and endocytosis in single melanotrophs of the rat pituitary. Neuron 5: 723-733.
Thomas R. C., Coles J. A. and Deitmer J. W. (1991) Homeostatic muffling. Nature 350: 564.
Trouslard J., Marsh S. J. and Brown D. A. (1993) Calcium entry through nicotinic receptor channels and calcium channels in cultured rat superior cervical gangion cells. J. Physiol. 468: 53-71.
Schneider P., Hopp H.H. and Isenberg G. (1991) Ca2’ influx through ATP-gated channels increments [Ca’+]i and inacti- vates Ica in myocytes from Guinea-pig urinary bladder. J. Physiol. 440: 479-496.
Schwiening C. J. and Thomas R. C. (1995) Relationship between intracellular calcium and its muffling measured by calcium iontophoresis in snail neurones. J. Physiol. In press.
Smith S. J. and Zucker R. S. (1980) Aequorin response facilitation and intracellular calcium accumulation in molluscan neurones. .7. Physiol. 300: 167-196.
Stuenkel E. L. (1994) Regulation of intracellular calcium and calcium buffering properties of rat isolated neurohypophysial nerve endings. J. Physiol. 481: 251-271.
Swandulla D. and Chow R.H. (1992) Recording solutions for isolating specific ionic channel currents. In: Practical Electrophysiological Methods (Kettemnann H. and Grantyn R., Eds.), pp. 164-168. Wiley-Liss, New York.
Tatsumi H. and Katayama Y. (1993) Regulation of the intracellular free calcium concentration in acutely disso- ciated neurones from rat nucleus basalis. J. Physiol. 464: 165-181.
von Tschamer V., Deranleau D. A. and Baggiolini M. (1986) Calcium fluxes and calcium buffering in human neutrophils. J. Biol Chem. 261: 10163-10168.
Tse A., Tse F. W. and Hille B. (1994) Calcium homeostasis in identified rat gonadotrophs. J. Physiol. 477: 511-525.
Vemino S., Amador M., Luetje C. W., Patrick J. and Dani J. A. (1992) Calcium modulation and high calcium permeability of neuronal nicotinic acetylcholine receptors. Neuron. 8: 127-134.
Vemino S., Rogers M., Radcliffe K. A. and Dani J. A. (1994) Quantitative measurement of calcium flux through muscle and neuronal nicotinic acetylcholine receptors. J. Neurosci. 14: 55145524
Wagner J. and Keizer J. (1994) Effects of rapid buffers on Ca2+ diffusion and ca2+ oscillations. Biophys. J. 67: 447-456.
Wendt-Gallitelli M. F. and Isenberg G. (1991) Total and free myoplasmic calcium during a contraction cycle: X-ray microanalysis in Guinea-pig ventricular myocytes. J. Physiol. 435: 349-372.
Yuste R. and Denk W. (1995) Dendritic spines as basic functional units of neuronal investigation. Nature 375: 682- 684.
Zhou Z. and Neher E. (1993a) Mobile and immobile calcium buffers in bovine adrenal chromaffin cells. J. Physiol. 469: 245-273.
Thayer S. A. and Miller R. J. (1990) Regulation of the Zhou Z. and Neher E. (1993b) Calcium permeability of intracellular free calcium concentration in single rat dorsal nicotinic acetylcholine receptor channels in bovine adrenal root ganglion neurones in vitro. J. Physiol. 425: 85-115. chromaffin cells. Pfliigers Arch. 425: 511-517.