the use of business intelligence tool to support busi
TRANSCRIPT

The Use of Business Intelligence Tool to Support Busi-
ness Decision Making
BI on Product Portfolio Decision to a New Product of MLS Company
Yiling Liu
Bachelor’s Thesis
Degree Programme in BITe
2015

Abstract
Päiväys May 2015
Author(s) Yiling Liu
Degree programme
Report/thesis title The Use of Business Intelligence Tool to Support Business Decision Making
Number of pages and appendix pages 42 + 3
Business intelligence is a term that be mentioned very often in recent years. More and more organizations applied business intelligence to survive and to be more competitive than be-fore. Simultaneously, a lot of BI tool suppliers emerge in this market. Besides, most nowa-days BI tool supports self-service without professional IT background requirements. Decision makers benefits a lot from BI tool utilization. The purpose of this thesis is to explore BI capabilities and how BI tool could assist users to achieve the goal. More specifically, the author of the thesis will present how self-service BI tool that be used to analyse business patterns and trends, in order to help the author make decision and suggestion. The thesis consists of two parts: the first part is the theory part, as a support to the empirical part, that review the basic knowledge of business intelligence such as the definition, the ca-pabilities and the basic process; in the second part, the empirical one, the author will show the process of BI tool usage to a real company case. The research method covers both qualitative and quantitative method, but the former one is the major method. Specifically, the approaches include literature research, market research through questionnaire, data collection, management and analysis, and quantitative analysis as well. The research result aims to give suggestion on product portfolio to a real company case. To do so, the thesis will be progressed from a variety of aspects regarding to the product portfo-lio. And all the reports and analysis will be presented in the empirical part.
Keywords Business Intelligence, BI Tool, Self-Service, Decision Making
Table of contents
1 Introduction ................................................................................................................... 1
1.1 Research Questions ............................................................................................. 1
1.2 Research Methods ................................................................................................ 2
1.3 Research Scope ................................................................................................... 2
2 Literature Review on Business Intelligence ................................................................... 4
2.1 Definition of Business Intelligence ......................................................................... 4
2.2 Business Intelligence‘s Architecture and Four Capabilities .................................... 5
2.3 Using of BI Tools ................................................................................................... 7
2.3.1 Why Microsoft Excel and PowerPivot for BI................................................ 7
2.3.2 How Does Microsoft PowerPivot for Excel Support Case Study ............... 10
2.3.3 How Could PivotTable and PivotChart Reports Help Us........................... 17
2.4 Summary to Research Question ......................................................................... 18
3 Empirical part .............................................................................................................. 19
3.1 Case Background Introduction ............................................................................ 19
3.2 Process Roadmap .............................................................................................. 20
3.3 Research Design and Implementation ................................................................ 21
3.4 Overview of the Achievements with PowerPivot Support .................................... 22
3.5 The PivotTable and PivotChart Reports and Analysis ......................................... 24
3.5.1 Business Model Analysis .......................................................................... 25
3.5.2 Product Target Consumer Analysis .......................................................... 28
3.5.3 Product Designing Analysis ...................................................................... 29
3.5.4 Product Advantages Analysis ................................................................... 35
3.5.5 Pricing Strategy Analysis .......................................................................... 36
3.6 Summary to Research Objectives ....................................................................... 38
4 Conclusion and Discussion ......................................................................................... 40
4.1 Research Results Review ................................................................................... 40
4.2 Further Research Development .......................................................................... 40
4.3 Self-learning Summary ........................................................................................ 41
References ...................................................................................................................... 43
Appendices ...................................................................................................................... 46
Appendix 1. Questionnaire for the parents .................................................................. 46

Glossary of Terms
ERP Enterprise Resource Planning
CRM Customer Relationship Management
IT Information Technology
BI Business Intelligence
DAX Data Analysis Expressions
B2B Business-to-Business
B2C Business-to-Consumers

1
1 Introduction
The era we are living in is full of data and information. Someone calls this “the Era of Big
Data” because there are tons of data and information exploded every single second. Es-
pecially with the development of the internet and computer technology, data and infor-
mation could be managed and presented in various ways. Besides, data and information
are not closed and isolated like before. More and more people and organizations are real-
izing the importance of sharing data and information. Therefore, some software appeared
such as ERP system and CRM system to facilitate information sharing.
However, to make organizations survival and to make sure the business continuity in this
competitive society, neither ERP system nor CRM system is enough for organizations.
Although the two systems might be good at managing information and integrating busi-
ness processes, they still cannot meet most decision-makers’ desire.
At the same time, another commonly known technology is developing and growing fast
and it is most matched to satisfy managers’ needs – business intelligence. At the begin-
ning, BI has just two basic functions: producing data and reports, and organizing it and
visualizing it in a presentable way. (History of Business Intelligence 2014.) Nowadays, in
this data-driven environment, BI is more powerful. For example, it could be accessed
through Cloud service, and this improvement simplifies the reach of BI platform. Moreo-
ver, it supports real-time processing, which enable users to make quick reaction to the
most recent information. Most importantly, it supports self-service access for non-expert
users, rather than limited to only IT experts. (History of Business Intelligence 2014.)
So, after realizing the magical and powerful functions of BI, readers might be interested in
the topic that how does it empower users to make business decision in real business
world? Is there any tool or platform could help users to achieve those functions? These
questions are also the theme of the thesis and I will use real business case to prove the
role and performance of BI on decision making.
1.1 Research Questions
Due to the BI capability on decision making, in this thesis, I will use the knowledge on
business intelligence to help me make my decision and suggestion on the new product’s
portfolio for MLS Company, a Finnish-based language teaching organization. The deci-
sion and suggestion will be analysed and given from the following aspects: business
model, product consumer target, product portfolio, product advantages, and pricing strat-
2
egy. And before the practical research, I will also study on how could BI tool support busi-
ness intelligence.
To sum up, my thesis research question is:
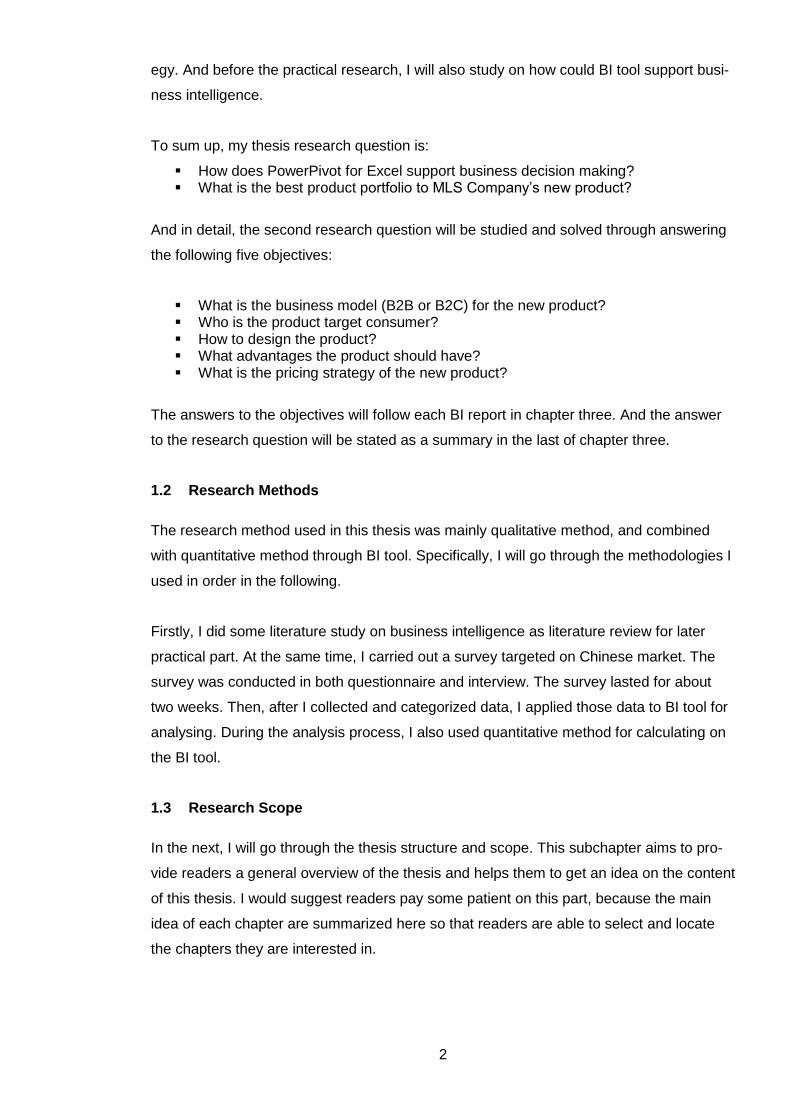
How does PowerPivot for Excel support business decision making? What is the best product portfolio to MLS Company’s new product?
And in detail, the second research question will be studied and solved through answering
the following five objectives:
What is the business model (B2B or B2C) for the new product? Who is the product target consumer? How to design the product? What advantages the product should have? What is the pricing strategy of the new product?
The answers to the objectives will follow each BI report in chapter three. And the answer
to the research question will be stated as a summary in the last of chapter three.
1.2 Research Methods
The research method used in this thesis was mainly qualitative method, and combined
with quantitative method through BI tool. Specifically, I will go through the methodologies I
used in order in the following.
Firstly, I did some literature study on business intelligence as literature review for later
practical part. At the same time, I carried out a survey targeted on Chinese market. The
survey was conducted in both questionnaire and interview. The survey lasted for about
two weeks. Then, after I collected and categorized data, I applied those data to BI tool for
analysing. During the analysis process, I also used quantitative method for calculating on
the BI tool.
1.3 Research Scope
In the next, I will go through the thesis structure and scope. This subchapter aims to pro-
vide readers a general overview of the thesis and helps them to get an idea on the content
of this thesis. I would suggest readers pay some patient on this part, because the main
idea of each chapter are summarized here so that readers are able to select and locate
the chapters they are interested in.

3
This thesis consists of four major chapters, some of them also includes several subchap-
ters. At the beginning before the main thesis body, I summarized a list of terminologies
that used as abbreviation in the thesis. Readers could check the full name there. In the
end, references list and appendix follows the main chapter.
Chapter one is for introduction. Readers could find what phenomenon the thesis is related
to at first. Other issues such as research question and research objectives, research
methods, and research structure are discussed as well.
Chapter two is for literature review, which builds the knowledge foundation on BI and sup-
ports the whole practical work. This chapter explains what BI is, the capabilities of BI, and
BI tools. More specifically, this chapter will explain which BI tool is the most matched one
to this case and how it works.
Chapter three is another important component. This part is for the empirical presentation.
Firstly, I will give a brief introduction on the case background, the practical process, and
the research design and implementation. Then I will review my achievements on BI tool,
which are the base for analysis. In the last, I will present the report generated from BI tool,
and the research objectives will be answered separately in this part. In the end of this
chapter, I will give my answer to the research question as a summary.
Chapter four, in the end, is for conclusion and discussion. This chapter reviews what I
have learned from the case study, evaluates what I have done, and also discusses about
the further research development.

4
2 Literature Review on Business Intelligence
This chapter presents a background information of business intelligence (BI) before I start
the real research study. The background information includes the definition of basic terms
needed in the research study, the introduction of BI capabilities, and also, the process
description on how to achieve BI with BI tool. All the relevant information included in this
chapter were referenced from several major textbooks, from which the main idea of the
research study was founded.
While the literature review is a continuous process normally runs through the whole re-
search study, most of the review work was carried out before the practical one. By doing
so, the literature acted as a knowledge foundation and guideline for me to develop my
following real case study in the right direction, as well as a criterion used again to check
the study findings I got compared to what I have learned.
2.1 Definition of Business Intelligence
The organizations in nowadays is more complicated and diversified than they were dec-
ades ago. With the development of the internet technology and the globalization of busi-
ness, the organization needs to be more competitive in order to survive. Living in the In-
formation Age, and there are numerous data and information generated every second,
how to appropriately manipulate those data and information is the “first of first” question
every decision makers have to face in the business.
Realizing the necessity of real-time and accurate data and information, the importance of
the integration and sharing of data and information within the organization, and the value
of the hidden business patterns and potential business trends behind the measures, more
and more organizations started adopting Business Intelligence to help the manager mak-
ing better decision.
Although we heard this terminology quite often, many people always confused it with an-
other term “business analysis”. There are different ways to define this terminology, while
all of the definition has something in common.
From the general view of BI, it is an umbrella term that includes architectures, tools, data-
bases, applications, and methodologies. As stated by Turban, Sharda, E. Aronson and
King (2007, 9.) “It is a content-free expression, so it means different things to different
people.”

5
The definition given by Wikipedia is simpler but points out the objective and approach of
business intelligence (Business Intelligence 2015.): “Business intelligence is the set of
techniques and tools for the transformation of raw data into meaningful and useful infor-
mation for business analysis purposes”.
According to these, we could summarize some features of BI from the above definitions
and they are:
Enabling interactive access to the data Converting raw data into valuable information Supporting business managers to make decisions better and faster
So, the essence of BI is actually to help managers making strategic decisions out of tons
of data efficiently. And this also explains why BI draws a great attention and make lots of
organizations survived.
2.2 Business Intelligence‘s Architecture and Four Capabilities
The BI solution has four major capabilities and is supported by BI tools. Conversely, the
achievements of the four capabilities relies on BI tools during the whole BI process.
In nature, the four capabilities are mutually synergistic. They are organizational memory,
information integration, insight creation and presentation respectively from the foundation
level to the top level. Figure 1 depicts the architecture of these four capabilities.

6
Figure 1. Four Synergistic Business Intelligence Capabilities (Sabherwal & Becerra-
Fernandez 2010, 27.)
These four levels each relies on the previous level and benefits from the previous one.
More specifically, I will go through each of them in the following.
The base level is called organizational memory. According to Sabherwal and Becerra-
Fernandez (2010, 29.), “organizational memory capability represents an organization’s
accumulated history, including data, information and explicit knowledge. Data, information
or explicit knowledge stored in the organizational memory may be either structures or un-
structured.” But mainly, this level focuses on the structured resources within the organiza-
tion and those resources are ready for the later accessed and used.
The second level is information integration. This capability could be understood easily
from its name. Since the organizational memory level provides the resources only about
the past, it may not be able to satisfy the demanding for the decision making. Therefore,
the information integration capability plays a very important role and is responsible for
linking the past structured and unstructured content from a variety of resources that com-
prise organizational memory with the new, real-time content. (Sabherwal & Becerra-
Fernandez 2010, 33.)
In a word, no matter the content is structured or unstructured, which is either from internal
or from external, the information integration capability aims to link them together and to
facilitate the insight creation capability.

7
Then, the third one is called insight creations. After vast amounts of data and information
are collected and stored, even though they are integrated, be more completed and accu-
rate for the later use, the essence of the output from the second capability is still the data
and information recorded and they are meaningless to decision makers.
Therefore, “the third BI capability, insight creation, focuses on the utilization of these raw
materials to produce valuable new insights and enable effective decision making based on
continual rather than periodic analysis.” (Sabherwal & Becerra-Fernandez 2010, 36.)
To enable this insight creation capability, there are some technologies to do so including
Data Mining, Business Analytics and Real-time Decision Support. (Sabherwal & Becerra-
Fernandez 2010, 38.) These technologies could assist to generate new insights out of the
existed data and information, and hence, the insight creation capability can help manag-
ers identifying business patterns, business trends and so forth.
In the last, the top level is for presentation. As we can see from the above introduction, the
result of the insight creation capability is used for either real-time decision making or
learning. But either intention, the output provided to the user should be in an easily-
understood way or in the manner of what they preferred and required.
In other words, the results we got from the third level need to be user-friendly to satisfy
different users’ needs. Therefore, as the last capability, presentation still plays a neces-
sary role because it is actually a bridge linked between the BI solution and a wide range of
users.
2.3 Using of BI Tools
After the introduction of what is Business Intelligence and its capabilities, the question
then is how to fix the gap between numerous data and the business insights generated for
further decision-making use. The magic here is attributed to BI tool. Among various BI
products provided by more than 100 BI software companies today, they all could fulfil the
four BI capabilities. In this subchapter, I will introduce which BI tool helped me to achieve
the goal, and also, I will explain in detail how it performed.
2.3.1 Why Microsoft Excel and PowerPivot for BI
Nowadays, there are increasing demands for BI solution after people realizing its im-
portance. And meanwhile, BI tool is no longer a luxury afforded by a few leading vendors,

8
neither just limited to corporate using, rather, more BI tool companies rising with focus
shifting to self-service BI as well. (Serra 14 March 2013.)
Furthermore, since BI aims to support business decision-making, the designing of the BI
tool is more user-friendly, and the applications could be used directly by business users,
not only accessed by IT specialists. (Serra 14 March 2013.)
The chart below shows the latest ranking of BI & Analytics platforms researched by Gart-
ner, which makes BI quadrant ranking annually based on lots of customer-survey.
Figure 2. 2014 Gartner Magic Quadrant for BI & Analytics Platforms (Henschen 2014.)
As we could see from the chart, Microsoft is one of the leading BI vendors in the market.
Besides, Microsoft BI builds on the foundation of SQL Server, which is also one of the
leading data platforms worldwide. (Passionned Group 2015.)
According to the “Business intelligence tools survey 2015” covering at least 90% of BI
market and including major BI tools and analytics platforms given by Passionned Group
(An analyst and consultancy company offering in-depth vendor independent research and
business intelligence consulting.) (Passionned Group 2015.), Microsoft combines Analyt-

9
ics with BI seamlessly and is primarily doing Business Intelligence. It offers the following
BI components / tools: (Passionned Group 2015.)
SQL Server Integration Services (ETL) SQL Server Analysis Services (SSAS) SQL Server Reporting Services (SSRS) SharePoint Excel BI PowerPivot Power BI
Microsoft is so powerful in BI field, and in this thesis research, I will use Microsoft Excel
and the add-in PowerPivot to facilitate self-service business intelligence. In the following, I
will give a brief explanation why I chose Excel to do so.
First of all, the Microsoft Office suite of programs are already the lifeblood of most organi-
zations and also of private using. Besides the low-cost of installation, most people appre-
ciate the easy access and convenient operation of Microsoft Office programs. Especially
the latest version Excel 2013 is also available for mobile devices, this improvement con-
nects people with it closer. (Walkenbach 2013, xxxix)
Secondly, data is the most important part of Excel, through which the data could be sum-
marized and presented efficiently. And as we introduced earlier, data is also the major
components of raw materials in BI for later insights creation. In other words, Excel pro-
vides a wide range of tools that enable user to store, manage, summarize and present
data effectively into meaningful business knowledge. (Frye 2013, 45)
Thirdly, as an add-in available in Excel 2010 and 2013, Power Pivot for Excel is used to
perform more surprisingly powerful data analysis and create more complicated data mod-
els. There are some features in common in both Excel and in Power Pivot, for example,
any data imported into Excel worksheet is also available in Power Pivot and vice versa.
However, Power Pivot has better performance than Excel, and the following summarizes
the major advantages: (Microsoft 2015 A.)
1. Power Pivot enables user to filter data, rename columns and tables when importing data.
2. Users could write advanced formulas with DAX expression language in Power Pivot, while could only use Excel formulas in Excel.
3. Power Pivot supports Hierarchies to use everywhere in a workbook. 4. Users is able to create KPIs in PivotTables and Power View reports. 5. People can create Perspectives to limit the number of columns and tables that could
be seen.
10
All in all, as I explained above, Power Pivot in Microsoft Excel is the most suitable tool to
do self-service business intelligence in my thesis research.
2.3.2 How Does Microsoft PowerPivot for Excel Support Case Study
PowerPivot is a free-for-use additional features for Excel with more powerful data analysis
capability. It empowers people to do self-service BI. Currently it is only available to Excel
2010 and to some certain versions of Excel 2013. And people could open PowerPivot
workbooks in Excel 2007, but they cannot get access to the whole PowerPivot features
from Excel 2007 due to the version requirements. In other words, PowerPivot could only
be opened but operated in Excel 2007 or lower versions.
To enable PowerPivot, Excel users with version 2010 need to download and install Pow-
erPivot before using, while with version 2013, users are able to enable it through just a
couple of clicks. In this thesis case, I will use Excel version 2013 to do business intelli-
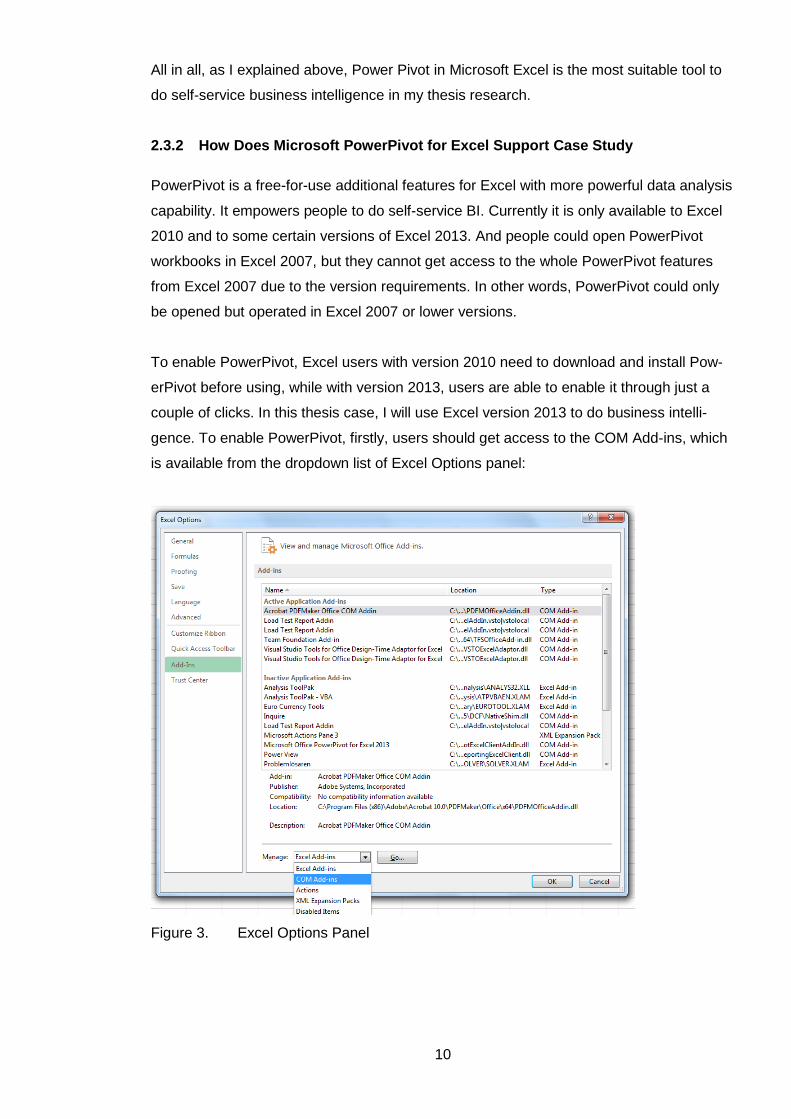
gence. To enable PowerPivot, firstly, users should get access to the COM Add-ins, which
is available from the dropdown list of Excel Options panel:
Figure 3. Excel Options Panel

11
After the access, we will have a window contained the list of all COM Add-ins pop up.
Then the checkbox for “Microsoft Office PowerPivot for Excel” should be checked and it
will be activated with the last confirm click on button “OK”:
Figure 4. COM Add-Ins Pop Up Window
After the configuration, now the PowerPivot should be available to use directly from the
Excel ribbon as other normal tabs. This additional features has no difference from other
existed tabs and allows user to get access to PowerPivot workbook easily. As you can
see the figure below, PowerPivot is activated and appears in the Excel ribbon:
Figure 5. PowerPivot for Excel in Excel Ribbon
The PowerPivot, by default, isn’t built in the Excel. So users have to enable it at the be-
ginning and then have it just as the other normal tabs.
As self-service BI platform, PowerPivot for Excel supports a series of process to make it
competent on the four business intelligence capabilities introduced earlier. Normally the
PowerPivot serves people to do business intelligence through the following steps:

12
Figure 6. Self-service BI process in PowerPivot for Excel
These steps help to accomplish the four BI capabilities. In the rest part of this subchapter,
I will give a brief introduction on how PowerPivot can help me through the basic process
to finally generate report for business using. (Microsoft 2015 B.)
Step 1, all needed data should be imported into the workbook. In PowerPivot for Excel,
users are allowed to add data from a wide range of data sources such as SQL Server
database, Access databases, Excel worksheets and text files. And PowerPivot supports
users to import data in different ways, including: using Table Import Wizard, specifying
Custom Query, Copy and Paste from existed worksheet and linking directly to Excel work-
sheet. (Microsoft 2015 C.)
Due to the case situation, since all raw data will be loaded to Excel sheet, I will use linked
table to import data to the PowerPivot workbook. To do so, firstly the user should select
the data area included title for each column and format the area as a table. Then link the
formatted table from Excel sheet to workbook through the function “Add to Data Model”
under PowerPivot tab. The advantage is that the “connected data” in PowerPivot work-
book could be updated automatically once there is any changes to the raw data source in
the referenced Excel worksheet.
Figure 7. Function “Add to Data Model”

13
Step 2, relationships between tables would be needed especially when the data comes
from different sources. This connection makes data from different tables not isolated and
this is good for digging out invisible business patterns. More importantly, users could ben-
efit a lot from creating relationship when they try to integrate the data from multiple tables
into one PivotChart or PivotTable. (Microsoft 2015 D.) Sometimes, the system is able to
automatically recognize the relationship between some tables, but normally users have to
do this themselves. There are two approaches to do so: created manually by joining ta-
bles in PowerPivot window or by joining columns in Diagram View. (Microsoft 2015 D.)
Step 3, for the purpose of business needs sometimes, calculated column will be added to
the existed table. Basically, calculated column is not different from already existed col-
umns so that it could be used in PivotTable and PivotChart. (Microsoft 2015 E.) The way
to create formulas is almost the same to do it in Excel, while in PowerPivot, a new formula
language is supported – Data Analysis Expressions (DAX). The DAX formula is more
powerful and complicated than the basic formulas in Excel. (Microsoft 2015 F.)
Step 4, create hierarchy could make columns more logically. And for my understanding,
it’s more like a category, which helps user to efficiently find out and use data. Since nor-
mally there are dozens or even more of columns in the workbook, finding specific columns
or digging out business patterns could be difficult and time-wasted. The most common
hierarchy is the Calendar hierarchy includes year, quarter and month. (Microsoft 2015 G.)
The hierarchy could be created easily in Diagram View with just right-click anywhere in-
side the selected table and the function “Create Hierarchy” appears. Drag any needed
columns to the created hierarchy and renamed the hierarchy. The hierarchy is separated
from other columns within the table. Figure below shows the approach:
Figure 8. Hierarchy Creation

14
Step 5, creating PivotTable will help users efficiently view and analyse data. There would
be many possibilities of the combination of fields from different table and therefore em-
power users to discover business trends and to detect business patterns.
The PivotTable is normally generated in the PowerPivot workbook through the function
“PivotTable” under “Home” tab:
Figure 9. PivotTable Create Function
Then a window popped up to ask whether to create a PivotTable in an existed sheet or in
a new one. In the end, a new PivotTable form will be created with a specific area for the
fields setting:
Figure 10. PivotTable Fields
According to users’ needs, the fileds will be added to the Fileds area. Generally,
nonnumeric fields are normally added to Rows area while numeric fields to Values area
for calculation, and Online Analytical Processing date and time hierarchies are added to
Columns area. (Microsoft 2015 H.) Besides, both Rows area and Columns area support
the hierarchy fields, in other words, fields could be arranged as a nested-list under these

15
two areas. For example, the following figure depicts the nested fields (two red frames on
the left)and the corresponding appearance in the PivotTable report (two red frames on the
right):
Figure 11. Nested Fields
Furthermore, there are two helpful dialog box to improve the performance of the PivotTa-
ble report: PivotTable Options dialog box and Value Fields Settings dialog box. The figure
following depicts the appearances of these two dialog boxes:
Figure 12. PivotTable Options Dialog Box & Value Field Settings Dialog Box
From the PivotTable Options dialog box, users are allowed to make various settings to the
PivotTable report such as the layout and format setting. I appreciate the “Totals & Filters”
setting since this function enables user to control the display of results and only desired
result will be shown. And also the “Display” section helps user to format the PivotTable
report as the classic layout automatically. (Microsoft 2015 I.)
From the Value Field Settings dialog box, this dialog provides more calculation options to
the fields under Values area. The first tab “Summarize Values By” offers calculation such
as Sum, Count and so forth. And the second tab “Show Values As” tab supports user to
show data in percent version. (Jelen & Alexander 2013.)

16
Step 6, PivotChart creating is almost the same way as PivotTable. PivotChart report pre-
sents in a more visualized way, so that people could easily tell the business trends and
business patterns, especially it is good at comparisons.
PivotChart could be generated in the PowerPivot workbook as the figure shows below:
Figure 13. PivotChart Creation
Besides the same Fields setting area, PowerPivot supports various chart type meet users’
different needs. Except the basic chart type such as pie chart, column chart and line chart,
other advanced chart type such stock chart and radar chart are also available. Besides,
each main chart type consists a series of subtypes.
Figure 14. Chart Type Window
Step 7, adding slicers to PivotTable or PivotChart report could help users view the result
more efficient and purposeful. It could filter out the unneeded information and make users
focus on the contents they are concerned and interested.

17
“PivotTable Tools” toolbar on the Excel ribbon appears when users click somewhere in-
side the PivotTable or PivotChart report and the toolbar allows user adding slicers directly
with just one-click. (Microsoft 2015 J; Microsoft 2015 K.)
Figure 15. PivotTable Tools Toolbar
Step 8, sometimes based on the demands, measures and KPIs are essential to improve
data analysis and to evaluate the organization performance during a period.
Differed from calculated column, measures are created in the specific area called “Calcu-
lation Area” inside the PowerPivot workbook. But measures creating is also through defin-
ing formulas, and both basic standard functions and advanced DAX formulas are support-
ed. Another difference between measures and calculated column is that measures are
most often used in the Values area of PivotTable or PivotChart report, while calculated
column not. (Microsoft 2015 L.)
Key performance indicator, according to the instruction given by Microsoft, is a quantifia-
ble measurement for gauging business objectives. (Microsoft 2015 M.) It is created based
on the measure. This measurement empowers user to evaluate how the business trends
going through the comparison between performance over the past history as a based
measure and the target value. (Microsoft 2015 M.)
2.3.3 How Could PivotTable and PivotChart Reports Help Us
The PivotTable report is used to summarize data from a wide range of data resources and
is most used to calculate the total of categorized figures. PivotChart, more visualized, pro-
vides a graphical presentation of the data analyzed in PivotTable report.
Both reports support users to create insight as we introduced earlier about the BI capabili-
ties and make business decisions later. However, PivotTable focuses more on summarize,

18
analyze, explore and present data. While PivotChart is better on comparing data, and pre-
senting business patterns and business trends. (Microsoft 2015 N.)
2.4 Summary to Research Question
In a conclusion, the PowerPivot for Excel supports self-service to do business intelligence.
The normal process will goes through the following steps: firstly, the tool allows user to
import data into the workbook and manage data; then PowerPivot enables user to make
generated data tables meaningful to each other, such as by creating relationship and hi-
erarchy; in the next, the tool supports user to create reports and charts for analyzing; in
the end, the generated reports and charts could be improved according to specific analy-
sis needs by adding slicers or creating KPIs.
The above explains “How does PowerPivot for Excel support business decision making”,
and in the following chapter, I will show how it helps me in a real case study.
19
3 Empirical part
The literature review makes me prepared well for my practical process. And the
knowledge and the basic progress guideline support the development of the empirical part.
In this chapter, I will go through the case introduction and the research process at first.
Then I will explain how I designed the survey and carried it out, and accordingly, the
achievements during the process will be presented after that. In the end, I will give my
detailed analysis to those reports and make a chapter summary in order to answer the
research objectives and research question.
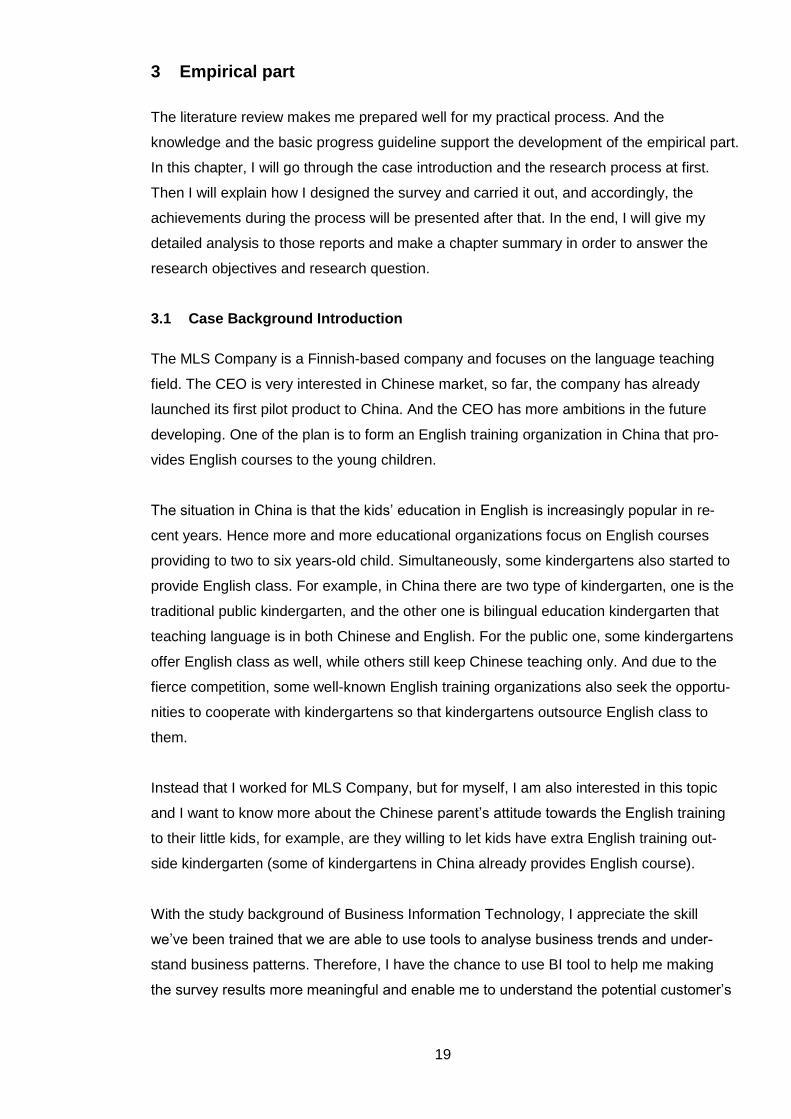
3.1 Case Background Introduction
The MLS Company is a Finnish-based company and focuses on the language teaching
field. The CEO is very interested in Chinese market, so far, the company has already
launched its first pilot product to China. And the CEO has more ambitions in the future
developing. One of the plan is to form an English training organization in China that pro-
vides English courses to the young children.
The situation in China is that the kids’ education in English is increasingly popular in re-
cent years. Hence more and more educational organizations focus on English courses
providing to two to six years-old child. Simultaneously, some kindergartens also started to
provide English class. For example, in China there are two type of kindergarten, one is the
traditional public kindergarten, and the other one is bilingual education kindergarten that
teaching language is in both Chinese and English. For the public one, some kindergartens
offer English class as well, while others still keep Chinese teaching only. And due to the
fierce competition, some well-known English training organizations also seek the opportu-
nities to cooperate with kindergartens so that kindergartens outsource English class to
them.
Instead that I worked for MLS Company, but for myself, I am also interested in this topic
and I want to know more about the Chinese parent’s attitude towards the English training
to their little kids, for example, are they willing to let kids have extra English training out-
side kindergarten (some of kindergartens in China already provides English course).
With the study background of Business Information Technology, I appreciate the skill
we’ve been trained that we are able to use tools to analyse business trends and under-
stand business patterns. Therefore, I have the chance to use BI tool to help me making
the survey results more meaningful and enable me to understand the potential customer’s

20
needs. Conversely, I believe this research result will be valuable to MLS Company as
well, because at least the company will have some clues from the customer’s view on how
to design the English courses to be more attractive to Chinese market and etc.
3.2 Process Roadmap
This research aims to find the answer to the research question: what is the best product
portfolio to MLS Company’s new product. In other words, I will analyse potential custom-
er’s behaviour and their expectations about the planned product – English training cours-
es. To make the result more reasonable and logical, the research question will be studied
from various aspects: business model, product target consumer, product portfolio, product
advantages and pricing strategy.
So, at beginning, to understand customers’ behaviour and expectation, I started with sur-
vey from questions design, survey proceeding and data collection. After that, I used Pow-
erPivot to manage data and generate report for business analysis. The process could be
depicted in the following figure:
Figure 16. Process Roadmap
In the following subchapters, I will explain what I did in research phase and how I use
PowerPivot for Excel to achieve business intelligence on decision making.

21
3.3 Research Design and Implementation
According to the research question and the purposed objectives, I designed a question-
naire consists of 17 questions to help me understand potential customers’ thought. The
questionnaire is attached to this thesis and could be found in Appendix.
Since the English courses will targets on kids in kindergarten as planned, the participants
of the survey will be limited to parents who have child age between one and six years old.
The survey was carried out through internet for two weeks. I published the questionnaire
online, and sent the link to my friends who currently live in China and asked them to
resend the link to the people they know. So the way I did the survey is through the
“friends’ friendship circles”. The advantage of this approach is that the data I collected is
representative as much as possible, because those friends I asked are almost from differ-
ent friend groups and their friendship circles are barely familiar with each other. This en-
sures the participants of the survey are from different fields and regions, and so that guar-
antees the diversification of data. Also, I interviewed some people I knew with the same
questions.
And also, since the MLS Company currently focuses on opening the Chinese market spe-
cifically in Beijing and Shanghai, the participants of the survey tended to be centralized on
these two areas.
The data collection process was progressed from 13.04.2015 to 27.04.2015. At the end of
the survey, I gathered 33 valid responses in total. The figure followed is the screenshot of
the online survey result.
Figure 17. Online Survey Result
The website is a Chinese website provides survey model to generate online survey with
self-service. The title of the survey is “Survey on parents’ opinion regarding English train-

22
ing to young kids”. And the reason I have two surveys is that I made some small modifica-
tions to the first one, but the idea of main questions are same. The two red circles mark
the responses I got and you could see that I have 33 answers in total.
In the rest of this chapter, I will present my achievements from PowerPivot for Excel and
explain my analysis regarding to the generated reports.
3.4 Overview of the Achievements with PowerPivot Support
The processes and approaches of PowerPivot to do business intelligence were introduced
in last chapter. However, since the study case is to make decision based on potential cus-
tomers’ opinion, this case is less complicated than the real ones. For example, the data
consists of 33 records and could be imported into PowerPivot from just one data source.
Therefore, the process for this case will be simplified as it is shown in Figure 16. The de-
tailed process explanation will not be provided in this thesis, but I will go through the major
process and the achievements in PowerPivot workbook in order.
Firstly, I imported data to Excel sheet and connected the worksheet with PowerPivot table
by Excel Linked Table.
Figure 18. Tables Overview in PowerPivot Workbook
According to research goal and the question category, I have four tables in my workbook.
These four tables are: “PotentialCustomerInfo”, which covers the basic information of
participants who are also the potential customer target; “KindergartenPerformance”, the
table records some informations about the kindergartens that parents send their kids to
and how the parents feel about the kindergartens; “MotivationAndDeterminantFactor”, this
table aims to find out the determinant factors that will affect parent’s decision whether to
choose an extra English training organization or not; and the last one
23
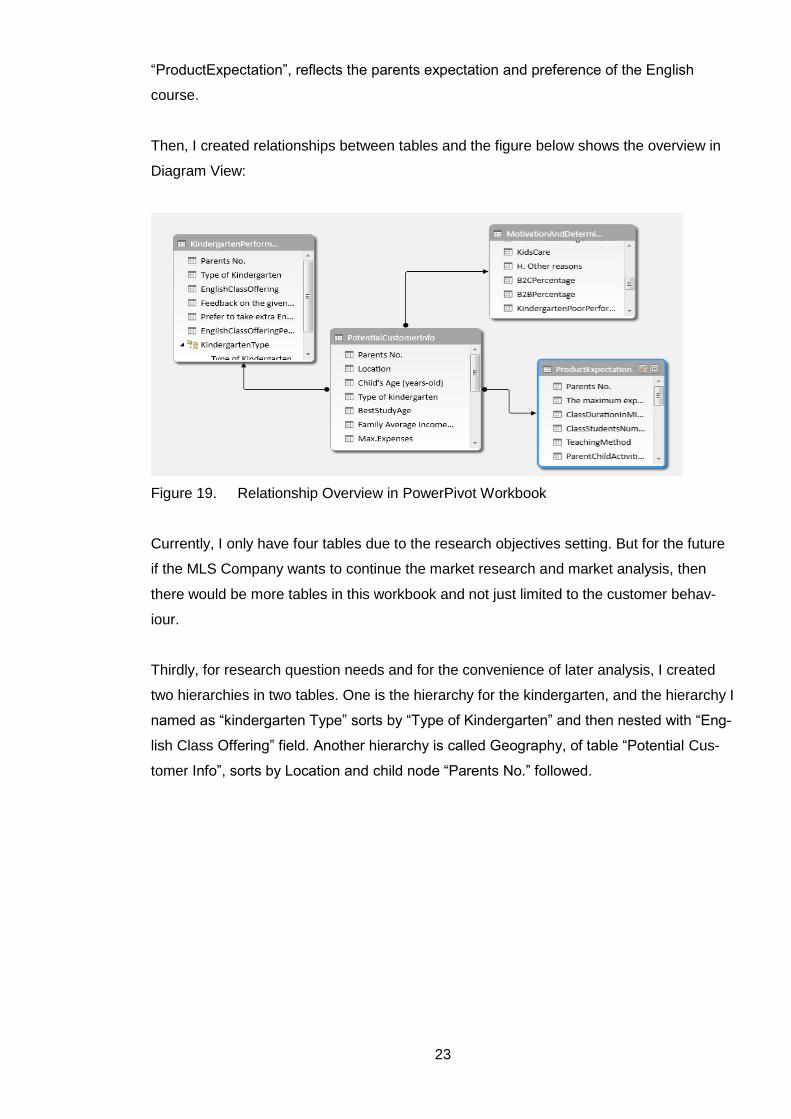
“ProductExpectation”, reflects the parents expectation and preference of the English
course.
Then, I created relationships between tables and the figure below shows the overview in
Diagram View:
Figure 19. Relationship Overview in PowerPivot Workbook
Currently, I only have four tables due to the research objectives setting. But for the future
if the MLS Company wants to continue the market research and market analysis, then
there would be more tables in this workbook and not just limited to the customer behav-
iour.
Thirdly, for research question needs and for the convenience of later analysis, I created
two hierarchies in two tables. One is the hierarchy for the kindergarten, and the hierarchy I
named as “kindergarten Type” sorts by “Type of Kindergarten” and then nested with “Eng-
lish Class Offering” field. Another hierarchy is called Geography, of table “Potential Cus-
tomer Info”, sorts by Location and child node “Parents No.” followed.

24
Figure 20. Hierarchy Overview in PowerPivot Workbook
Geography Hierarchy is helful to understand the business patterns and the customers’
preference in different regions. KindertargenType Hierarchy was designed to analyze the
business opportunity for B2B business model (the organization provides English courses
directly to kindergarten instead of just targets on individual students.) by recognizing how
much percentage kindergartens exists without offering English class.
Last, after all needed stuff ready, PivotTable and PivotChart reports could be created for
analysis. According to the research objectives, the reports were generated in five work-
sheets:
Figure 21. Overview of Reports in Excel
The reports reflect participants’ opinion from the following aspects: business model, prod-
uct target, product designing, product advantages and pricing strategy. I will present the
reports in next subchapter with my analysis.
3.5 The PivotTable and PivotChart Reports and Analysis
This subchapter aims to give my analysis from each report and to achieve the research
objectives. Based on the features of PivotTable report and PivotChart report, for some
objectives, I used both reports to do the analysis.

25
3.5.1 Business Model Analysis
As we introduced earlier about the situation of English training organizations, the business
model of the organization could be either providing English class directly to individual stu-
dents or cooperating with kindergartens that outsource English class. However, with Eng-
lish class available already from some kindergartens, are parents willing to let their kids
take extra English course is the first problem to MLS Company. So we need to know
whether focus on English course providing to individual students (B2C business model) is
still a wise choice, or should the company also need to consider cooperating with kinder-
gartens (B2B business model). In the next, the business model will be analysed from both
B2B opportunities and B2C markets.
For the purpose to analyse business model, I created both PivotTable report and Piv-
otChart report. First of all, I will analyse B2C model. Next figure depicts the PivotTable
report for understanding B2C market:
Figure 22. PivotTable Report for B2C Analysis
This report was designed for analyse if English course is already available in kindergarten,
will parents consider to take extra English training.
In this report, each row shows the location of the participants and the counts of their votes
from different region. Based on the company’s concerned city, there are three options:
Beijing, Shanghai and Other. And each location category could be expanded to see the
included parent’s number. For example parents with number 25, 26, 27, 28, 31 and 33
come from city Shanghai. The column titled with “Extra Training Willingness” are divided
into two situations: “No” means that parents are not willing to take extra English course to
their kids, while “Yes” on the contrary. And we could see the subtotal for these two votes
in different region.

26
From this report, we could tell that generally speaking, the willingness of taking extra Eng-
lish training is roughly “half and half”. This report is good at presenting the grand total of
votes and showing us detailed information regarding each participant’s choice.
To visualize the result and to compare the difference between different regions, Piv-
otChart is better on this:
Figure 23. PivotChart Report for B2C Analysis
It seems that the B2C business model is more adaptive in Beijing than in Shanghai. And
the straight comparison explained the big difference in Shanghai made the balance in the
grand total.
As for the B2B business model analysis, I also created both PivotTable and PivotChart
report. The PivotTable will be explained first:
Figure 24. PivotTable Report for B2B Analysis

27
This report aims to show how much percent of the current kindergarten still doesn’t pro-
vide English class. Then we could tell is there an opportunity to consider B2B business
model.
There are two fields in the table: one is “type of kindergarten” to see what kind of kinder-
garten participants send their kids to and the other one is “English class offering” to see
whether the specific type of kindergarten offers English class. This two fields consist of
one hierarchy called “Kindergarten Type” and this report is actually calculated the value
based on this hierarchy. The row of this table shows the type of kindergarten and there
are two types in the table: Bilingual and Public. Each type could be expanded to see
whether the kindergarten offers English class or not. As you could see there is only one
option from Bilingual one because this type of kindergarten is designed to have two teach-
ing language and therefore it must provide English class. As for Public one, there are two
possibilities to be counted separately how much percent each one takes.
The calculation for this table is to take percentage and take the grand total as base for
calculation. The report tells us that bilingual type of kindergarten accounts for 32% of the
total kindergarten market and public accounts for the rest. Although most of the kindergar-
tens nowadays already provide English course, there are still 16% kindergartens lack of
this education.
Figure 25. PivotChart Report for B2B Analysis
The report is also presented through PivotChart report, the chart used is Pie of Pie chart
which could perform the hierarchy well. The parent pie chart presents the composition of

28
kindergarten’s types, and the child pie chart shows the composition of public kindergarten.
The grey area of the child pie chart represents the percentage of kindergartens that do not
provide English course and these kindergartens are all public kindergartens.
According to both B2B and B2C possibilities analysis, I would suggest MLS Company that
do not limited to B2C business model, I think the company should also expand the B2B
market. And the company could seek some cooperation opportunities with public kinder-
garten, after all it seems that there could be some needs. Besides, if the MLS Company
becomes more competitive, there definitely will be more chances for the company to de-
velop more kindergarten partners that may currently cooperated with others.
3.5.2 Product Target Consumer Analysis
After analysing the business model, the second objective is to know the most possible
target consumer. Since most competitors in China focus on English training provided to
kids aged between two years old and six years old, MLS Company supposed that the
parent whose kid is within this age group is the most possible purchaser. But is this true?
I designed one question regarding to this topic in the questionnaire. And the question is to
ask what age period does the participant think is the best English study age. There are
three answer options: three-to-six years old, seven-to-nine years old, and above nine
years old. The figure below shows how I analysed target consumer.
Figure 26. PivotTable Report for Target Consumer Analysis
I did the product target consumer analysis based on the answer to the “best English study
age” question and combined with parents’ willingness to take extra English training also.
The reason I combined the study age and the willingness to take extra English training is
because even though an age period is the most voted by parents, it could happen that
most parents who voted to that age period are not willing to take extra English training. In
that case, the analysis only based on “the best English study age” to judge the target con-
sumer would be an arbitrary decision. Therefore, to make sure the conclusion is precise, I

29
also studied the percentage of parents’ willingness regarding extra English training of the
total amounts of participants.
So from the PivotTable report, we could tell that parents who have kids between three to
six years-old would be our target consumer. Besides that, English course designed to
seven to nine years-old child could be one more option to enrich company’s product line.
Figure 27. PivotChart Report for Target Consumer Analysis
Although the values are shown in percentage from PivotTable report, it sometimes hard to
recognize and compare. Hence, I also created a column chart to make the comparison.
The results are categorized based on the “best study age”, and in each category users
could see clearly the comparison between “willingness” and “unwillingness” regards to
parents’ attitude towards extra English training.
The chart report also verified us the inference again. Furthermore, from most voted age
period and the second most voted age period, the ratio of parents who are willing to get
extra English training accounts for almost half. So we could say that both three-to-six
years old and seven-to-nine years old could be our target age period.
3.5.3 Product Designing Analysis
The product designing report is planned to build the ideal model for the expected English
class from parents’ point of view and relect their thoughts straightly. According to the
common parents’ interests and concerns, the analysis will be carried out through the fol-
30
lowing aspects: class length of time, frequency of class per week, teaching method, the
amount of students each class, and the parent-child activity.
However, aspects listed above are not all isolated. For example, the length of time per
class and the frequency of class per week should be analyzed together, because they
have influence and dependence on the other much or less. Besides, the parent-child
activities could be analyzed with frequency of class per week to find the best combination
of these two. Furthermore, teaching method combined the amount of maximum students
each class could decide the class size to the most prefered teaching method.
Firstly, I will analyse the class length of time and the frequency of class per week. There
are four options regarding the class length of time in the questionnaire: 30 minutes each
class, 45 minute each class, 60 minutes each class and 75 minutes each class. For the
frequency of class per week, three options are available: once per week, twice or three
times per week, and more than three times per week.
To analyze the most voted pattern of the combination of these two aspects, the sum of the
votes to each category should be calculated. Hence, I categorized with frequency of class
per week and then counted the votes for “length of time per class” for each category.
Following is the report:
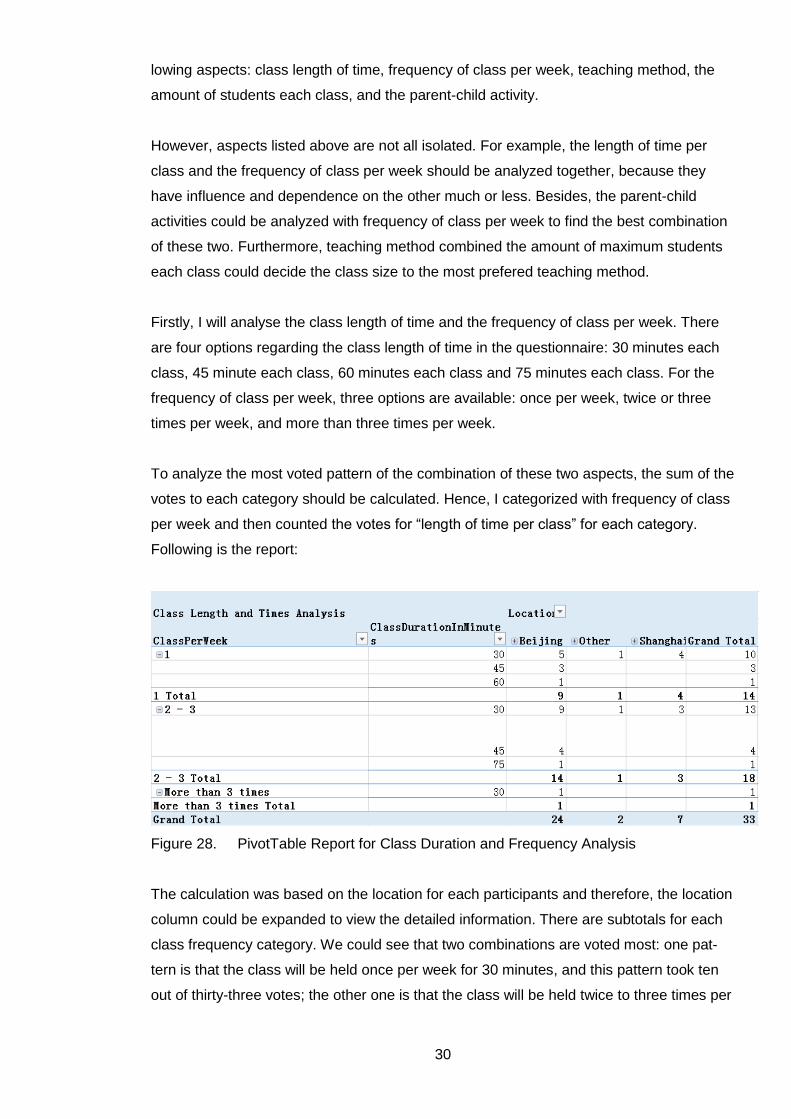
Figure 28. PivotTable Report for Class Duration and Frequency Analysis
The calculation was based on the location for each participants and therefore, the location
column could be expanded to view the detailed information. There are subtotals for each
class frequency category. We could see that two combinations are voted most: one pat-
tern is that the class will be held once per week for 30 minutes, and this pattern took ten
out of thirty-three votes; the other one is that the class will be held twice to three times per

31
week with class length of time as 30 minutes, and this one took thirteen out of thirty-three
votes.
Moreover, the chart below shows that regardless of the frequency of class per week, class
duration in 30 minutes is the most accepted setting:
Figure 29. PivotChart Report for Class Duration Analysis
Next, I want to find out the relationship between the frequency of class per week and the
preference of parent-child activity. Since parent-child activity could encourage parents
involved into the class with their child together and conversely, they could evaluate teach-
er’s performance, this feature supposed to be a popular element. However, I still need to
know parents’ attitude towards this feature. In questionnaire, this question was asked to
check whether the parents are glad to have this kind of interactive activities. And the an-
swer could be either “No” or “Yes”. Again, the combination of this two fields is presented in
PivotTable report:
Figure 30. PivotTable Report for Parent-Child Activity and Class Frequency Analysis
Each row of this report represents a category of the times of class per week, correspond-
ingly, the column area consists of two options “No” and “Yes”. According to the report,
most parents appreciate the parent-child activities held during the class session, while still

32
some of them may feel uncomfortable with the interactive activities. So I would suggest
MLS Company to arrange two series of classes: one should build in the parent-child activi-
ties while the other one without. And the class without parent-child activities could be ar-
ranged not that often.
In the last, I will analyse the teaching method and the class size to end product designing
part.
To figure out what kind of teaching method could attract parents most, I made of a list of
most common English teaching methods in the existed English training market. The list
includes five options: Local teacher teaching based on the teaching discs; Native-speak
teacher teaching based on teaching discs; The class is leading by a native-speak teacher
with a local teacher’s assist; New words explanation and teaching goes first by a local
teacher, and then the class is leading by a native-speak teacher; The class is leading by a
local teacher, while a native-speak teacher will help kids to practise related contents
through conversations and games. In the report, the description of these five options will
be simplified for the convenience to analyse. You will see the options presented in the
following way: Local teacher with discs; Native teacher with discs; Local teacher assisting;
Words explanation method and Local teacher plus Native teacher.
As for the class size, there are also four possibilities in the questionnaire: under five per-
sons; five to ten persons; ten to fifteen persons; and above 15 persons.
The figure below depicts the report. The calculation for each category provides both count
and percent values:

33
Figure 31. PivotTable Report for Teaching Method and Class Size Analysis
As I mentioned earlier, actually there are five answer options regarding the teaching
method. However, we could only view four categories from the row labels, and the option
“Local teacher with discs.” is invisible from current report. This is because there was no
vote for this teaching method from existed participants.
According to the column “count of teaching method”, the way “Local teacher plus Native
teacher” accounts for nearly half of the total amount. And method option “Local teacher
assisting” and “Words explanation method” followed, with eight votes out of thirty-three
participants separately.
Then according to the column “Percent of teaching method”, percentage of class size as
“Under five persons” and “five to ten persons” all exceeds ten percent.
The chart report is more visualized to view the patterns:

34
Figure 32. PivotChart Report for Teaching Method and Class Size Analysis.
This Stacked Area chart presents votes for class size with area in four different colours:
the yellow area refers to the votes for class size with students less than five; orange area
refers to class size with five to ten students; blue area means class size with students ten
to fifteen; and grey area means the amount of students is above fifteen in class. From the
size of these areas, it is easily to recognize that orange area is the biggest one followed
by yellow area. This means that most parents prefer to have class size limited to five to
ten persons or even less than five students.
As for the teaching method analysis from the chart, the voted teaching methods lie on the
horizontal axis with amount labels. The vertical axis sums up the total amount votes for
each teaching method. The highest votes is method “Local teacher plus Native teacher”
with fifteen supporters.
To sum up the product designing analysis, I would suggest MLS Company have different
product portfolio. The English course could be arranged once per week, or twice to three
times per week. And regardless of the frequency of the class, the length of time should be
controlled within 30 minutes. Furthermore, some English class provides parent-child ac-
tivities while still a few English class should keep traditional class teaching. And the train-
ing organization could have three types of English class due to different teaching methods:
the class is leading by a local teacher while practising with native-speak teacher; the class

35
is leading by a native-speak teacher with local teacher’s assisting; the class is leading by
a native-speak teacher only after local teacher finish words explanation. Regarding to the
parent-child activity, the parents’ preference could be divided into two sides. So I would
suggest MLS Company arrange some parent-child activity to part of the class so that the
parents are free to choose. And the last, the class size could be normal size as five to ten
students, or the VIP class size could be limited to less than five students.
In this case, with enough product portfolio available, consumers are allowed to make their
choice from a wide range of options and have more possibilities to pick up the most satis-
fied one from MLS Company.
3.5.4 Product Advantages Analysis
In the following, I will analyse consumers’ motivation to see what kind of determinant fac-
tors that will drive parents to take extra English training into consider and what kind of
features of the provided English class would attract parents.
In the questionnaire, there was a list of options and for this question, survey participants
are allowed to pick more than one option as long as they think the factor is important and
determinant. The factors may influence parent’s decision cover the following aspect: kin-
dergarten poor performance, fierce social competition, strong reputation of English train-
ing organization, professional Native-speak teacher provided, best price-performance ratio,
positive learning environment and role as kids-care.
To make the report looks clear, I simplified the description of these factors. And for this
analysis, bar chart is the best way to present the difference:
Figure 33. PivotChart Report for Product Advantages Analysis

36
In this report, each bar with a unique colour represents the vote for one factor. And there
is a data label in the end of each bar to show the counts of vote in total.
As we could see from above chart, the organization has professional native-speak English
teacher would be the first determinant factor that leads parents to choose that English
training organization. Except the teacher staff, an organization that can provide positive
and interactive learning environment is also parents’ concern. Another crucial factor that
drive parents consider outside English training organization is due to the poor perfor-
mance of English class provided by kindergarten.
The rest of the options also are took into considered by consumers, but it seems that the
three factors mentioned above are more attractive and crucial when parents make deci-
sions.
Therefore, due to the analysis, my recommendation to MLS Company is that the English
training organization should hire some native-speak English teachers. And also, the or-
ganization should pay attention to do teachers training so that qualified teachers are able
to build an attractive learning environment. Moreover, one motivation that makes parents
to consider extra English training is the kindergarten’s poor performance. So this one also
verifies the B2B business model that if some kindergartens cannot provide satisfied Eng-
lish course or cooperated with such organization, this is an opportunity for MLS Company
to expand more B2B business partners
3.5.5 Pricing Strategy Analysis
In the last, I will do some analysis to find out the common accepted price by public and the
opportunity to expand high-end customers as well.
This analysis is based on the question “what is the maximum price that you are willing to
spend on the English training per year?” from questionnaire. For this question, I set five
cost level: under 800 RMB; 800 to 1500 RMB; 1500 to 3000 RMB; 3000 to 5000 RMB;
above 5000 RMB. And the consumers who would like to spend more than 5000 RMB per
year in English training would be categorized as “high-end customer”.
Firstly, I will analyse the common accepted price through PivotTable report:
37
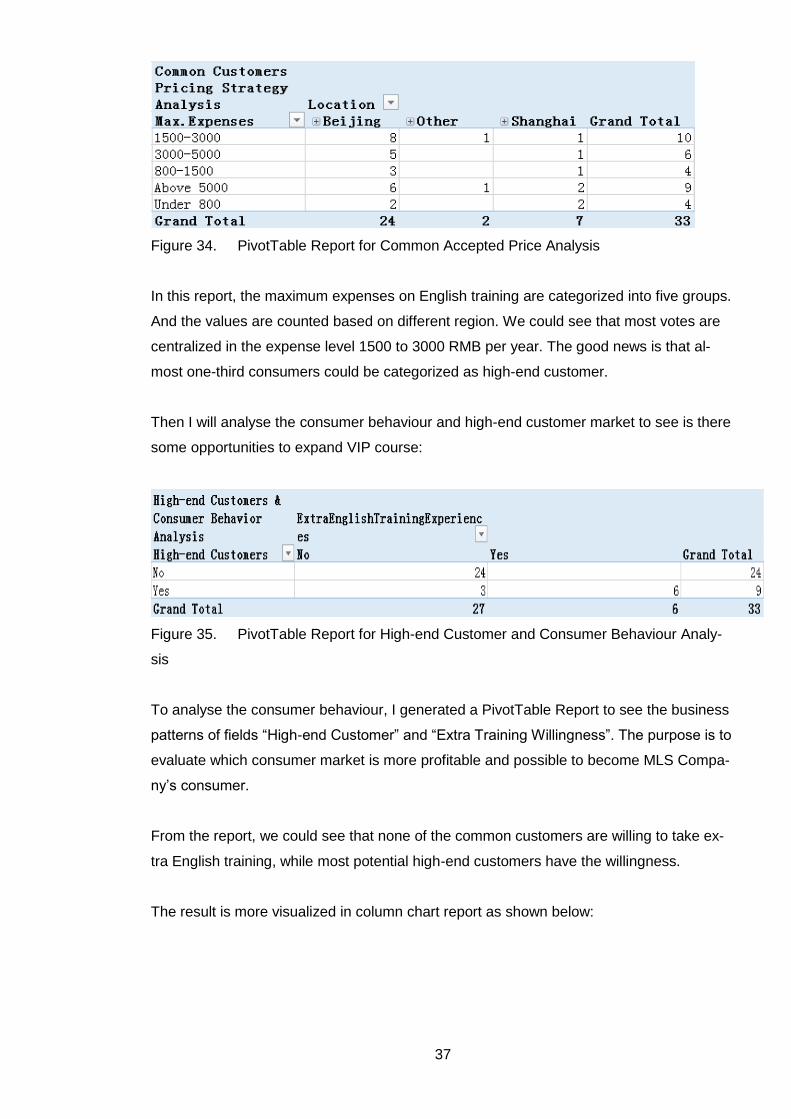
Figure 34. PivotTable Report for Common Accepted Price Analysis
In this report, the maximum expenses on English training are categorized into five groups.
And the values are counted based on different region. We could see that most votes are
centralized in the expense level 1500 to 3000 RMB per year. The good news is that al-
most one-third consumers could be categorized as high-end customer.
Then I will analyse the consumer behaviour and high-end customer market to see is there
some opportunities to expand VIP course:
Figure 35. PivotTable Report for High-end Customer and Consumer Behaviour Analy-
sis
To analyse the consumer behaviour, I generated a PivotTable Report to see the business
patterns of fields “High-end Customer” and “Extra Training Willingness”. The purpose is to
evaluate which consumer market is more profitable and possible to become MLS Compa-
ny’s consumer.
From the report, we could see that none of the common customers are willing to take ex-
tra English training, while most potential high-end customers have the willingness.
The result is more visualized in column chart report as shown below:

38
Figure 36. PivotChart Report for High-end Customer and Consumer Behaviour Analysis
So, my conclusion on pricing strategy to common consumer is that the product could be
priced something around 3000 RMB per year. While for the high-end consumer, I would
like to suggest MLS Company pay more attention to the high-end customer market, be-
cause they prefer to spend more money in extra English training and simultaneously, they
are more possible to take extra English course.
3.6 Summary to Research Objectives
The above five subchapters explained specifically the research method and process, the
BI tool to support analysis, the achievements and reports generated from the tool, my
analysis and conclusion.
In a summary, my conclusion and suggestion for the product portfolio of MLS Company is
stated in the order of objectives:
The first research objective is: What is the business model (B2B or B2C) for the new
product? I think the MLS Company could not only focus on B2C market, but also pay
some attention to B2B market and start cooperation with public kindergarten.
Then the second research objective is: Who is the product target consumer? My answer is
that the product would be designed mainly to three-to-six years-old kids. And also, the
MLS Company could consider provide English course to seven-to-nine years-old child at
the same time or in the near future.

39
Following is the suggestion to the third research objective: How to design the product?
The English course is better to be designed as 30 minutes per class. And MLS Company
could arrange class both once and twice to three times per week, so the consumers could
have more options according to their needs.
The course could be categorized into three types: the class is leading by a local teacher
while practising with native-speak teacher; the class is leading by a native-speak teacher
with local teacher’s assisting; the class is leading by a native-speak teacher only after
local teacher finish words explanation.
The class size would better be five to ten students with normal price, while arrange less
than five students as VIP class. Besides, the parent-child activity could be a plus to some
normal class and to the VIP class.
Regarding to the fourth research objective: “What advantages the product should have?” I
would suggest MLS Company hire some professional native-speak English teacher be-
cause most consumers regard this feature as the most important one. Besides, the organ-
ization should take some methods to ensure the positive and interactive teaching envi-
ronment and make this as the company teaching culture. The way could be giving a
teacher’s training, or carrying out teacher performance evaluation to encourage teachers
for better performance.
As for the last research objective: “What is the pricing strategy of the new product?”, since
the average consumption level is about 3000 RMB per year, MLS Company would set the
price around this amount. For the high-end consumer, the English course could charge
more with more features available, such as the course provides more activities between
professional native-speak English teacher and students, the class is arranged as VIP
class or the class arranged more parent-child activities.

40
4 Conclusion and Discussion
In this report, the theory part played as a role to support the development of the empirical
part, and the empirical part was progressed in order. In this final chapter, I will summarize
what I have done so far, what is the plan for the future developing, and what I have
learned from the research.
4.1 Research Results Review
In general, I am satisfied with the research process and the result. There might be more
than one answer and suggestion to each objective, however, there is more possibilities of
the combination of those aspects. Since any English training organization normally has
multiple business lines, I would like to leave MLS Company more options to design its
products so that it is able to satisfy more consumers’ needs and attract a wide range of
consumers.
Although there are more than one product portfolio solution, all conclusions are inferred
from the report, which reflects participants’ thought come from different job field and living
region. Besides, the reports were generated based on the responses to the survey, and
the survey (attached in the Appendix) could be checked through internet and that is the
way how I collected data. So the result is trustworthy and reliable.
The only limitation of this research result is that, although all data are real and valid, the
sample I researched is still a small group. The reports generated based on 33 participants’
answer from Beijing and Shanghai (two out of them are from other regions.) However,
since the survey was carried out through the “friends’ friendship circles”, and the partici-
pants come from various work field and living environment, the result is still representative
and reflects the common consumer power.
4.2 Further Research Development
Although current research questions were figured out so far, the PowerPivot workbook is
still in use. In the future utilization of the PowerPivot worksheet I created, the tables are
still available and the data could be updated automatically. So users could insert data and
create table directly and generate more reports for analysis.
Furthermore, since the survey was carried out on my own with time and location re-
strictions as well, the responses I collected are limited. However, if MLS Company forms a

41
market research team to do the survey, it will definitely gather much more samples and
the result will be more representative.
When there is a large amount of data, PowerPivot worksheet would also works well. But
at that time, I would suggest MLS Company to apply more functions in PowerPivot, such
as the calculated column to manage measures.
4.3 Self-learning Summary
The thesis takes me about two months to finish. I started the thesis project at the begin-
ning of March 2015, and ended in the end of May 2015. The total working hours is approx-
imately 350 hours and five to six hours per day in average. And the empirical process
takes me most effort and time during the whole thesis research. I did learned a lot from
this thesis research. I will explain in detail below.
Firstly, I improved my self-learning ability with the literature research process. During the
literature research process, a various resources supported the literature review part. The
resources included some textbooks and some websites.
Secondly, since the empirical part was related to market research, I practised the whole
process regarding the market research form designing to implementation. And the survey
was well done, because at the last I got 33 valid responses.
Thirdly, I improved my business analysis ability during the analysis part. All business re-
ports were designed and generated according to the analysis needs. And I was trained to
analyse business patterns and understood business trends.
Then, as a whole, I practised my project management skill, time management skill also
included. The management was advised and supervised by my thesis advisor at the same
time, so that I could finish it with the correct direction.
Besides, I enriched myself knowledge on business intelligence and deepen my under-
standing on this field. Also, I was more familiar with the use of PowerPivot to do business
intelligence.
Furthermore, I was glad that I have the chance to practise and improve my problem-
solving skill. In fact, I had obstacles and problems during the research. The first obstacle,
for example, was that my first research attempt was failed due to the overestimated on the
target market performance. Then, I shifted my research target immediately and got high-

42
quality responses in the end. The other problem was that I had some structure problem for
my first version of my thesis. And after advices from my advisor and my rethinking of the
structure, I almost rewrote the empirical part and changed my theory part as well. Both
these past obstacles and problems practised my ability to give a quick response to the
accidents and figure them out on time.
The last but not least, I also practised my academic writing skill. In the theory part, I prac-
tised my ability to summary what I have read and described in my own word. And in the
empirical part, I practised to report the whole process.
All in all, I am satisfied with the research result and my performance. And I believe the
knowledge and skill I gained from this research will also be valuable for my future devel-
oping. Besides, I really appreciate my thesis advisor, who gave me a lot of guidance and
help. Without him, I may not achieve what I expected.

43
References
Business Intelligence 2015. URL: http://en.wikipedia.org/wiki/Business_intelligence. Ac-
cessed: 24 April 2015.
Frye, C. 2013. Microsoft Excel 2013. 1st ed. O’ Reilly Media. Sebastopol, California.
Henschen, D. 2014. Gartner BI Magic Quadrant: Winners & Losers 2014. URL:
http://www.informationweek.com/big-data/big-data-analytics/gartner-bi-magic-quadrant-
winners-and-losers/a/d-id/1114013?image_number=1. Accessed: 24 April 2015.
History of Business Intelligence 2014. URL: http://www.betterbuys.com/bi/history-of-
business-intelligence/. Accessed: 12 May 2015
Jelen, B. & Alexander, M. 2013. Excel 2013 Pivot Table Data Crunching.
Microsoft 2015 A. Power Pivot: Powerful data analysis and data modelling in Excel. URL:
https://support.office.com/en-ca/article/Power-Pivot-Powerful-data-analysis-and-data-
modeling-in-Excel-d7b119ed-1b3b-4f23-b634-445ab141b59b. Accessed: 25 April 2015.
Microsoft 2015 B. PowerPivot for Excel Tutorial Introduction. URL:
https://technet.microsoft.com/en-us/library/gg413497%28v=sql.110%29.aspx. Accessed:
27 April 2015.
Microsoft 2015 C. Add Data to Your PowerPivot Workbook. URL:
https://technet.microsoft.com/en-us/library/gg413468%28v=sql.110%29.aspx. Accessed:
27 April 2015.
Microsoft 2015 D. Create Relationships Between Tables (Tutorial). URL:
https://technet.microsoft.com/en-us/library/gg413437%28v=sql.110%29.aspx. Accessed:
03 May 2015.
Microsoft 2015 E. Calculated Columns. URL: https://technet.microsoft.com/en-
us/library/gg413492%28v=sql.110%29.aspx. Accessed: 03 May 2015.
Microsoft 2015 F. Build Formulas for Calculations. URL: https://technet.microsoft.com/en-
us/library/gg399193%28v=sql.110%29.aspx. Accessed: 03 May 2015.

44
Microsoft 2015 G. Create a Hierarchy in a Table (Tutorial). URL:
https://technet.microsoft.com/en-us/library/hh272056%28v=sql.110%29.aspx. Accessed:
07 May 2015.
Microsoft 2015 H. Use the Field List to arrange fields in a PivotTable. URL:
https://support.office.com/en-us/article/Use-the-Field-List-to-arrange-fields-in-a-
PivotTable-43980e05-a585-4fcd-bd91-80160adfebec. Accessed: 08 May 2015.
Microsoft 2015 I. PivotTable options. URL: https://support.office.com/en-
in/article/PivotTable-options-27c02eb7-27de-4b3f-9677-c48e3fe7637b. Accessed: 08 May
2015.
Microsoft 2015 J. Add Slicers to PivotTables (Tutorial). URL:
https://technet.microsoft.com/en-us/library/gg399135%28v=sql.110%29.aspx. Accessed:
12 May 2015.
Microsoft 2015 K. Add Slicers to PivotCharts (Tutorial). URL:
https://technet.microsoft.com/en-us/library/gg399133%28v=sql.110%29.aspx. Accessed:
12 May 2015.
Microsoft 2015 L. Measures in PowerPivot. URL: https://technet.microsoft.com/en-
us/library/gg399077%28v=sql.110%29.aspx. Accessed: 12 May 2015.
Microsoft 2015 M. Key Performance Indicators (KPIs) in PowerPivot. URL:
https://technet.microsoft.com/en-us/library/hh272050%28v=sql.110%29.aspx. Accessed:
12 May 2015.
Microsoft 2015 N. Overview of PivotTable and PivotChart reports. URL:
https://support.office.com/en-sg/article/Overview-of-PivotTable-and-PivotChart-reports-
00a5bf71-65cb-49f9-b321-85bb7b0b06c2. Accessed: 17 May 2015.
Passionned Group. BI & IT Vendor: Microsoft. URL:
https://www.passionned.com/business-intelligence/business-intelligence-
vendors/microsoft/. Accessed: 24 April 2015
Sabherwal, R. & Becerra-Fernandez, I. 2010. Business Intelligence: Practices, Technolo-
gies, and Management. 1st ed. John Wiley & Sons. Hoboken.

45
Serra, J. 13 March 2013. Why you need Business Intelligence. James Serra’s Blog. URL:
http://www.jamesserra.com/archive/2013/03/why-you-need-business-intelligence/. Ac-
cesses: 24 April 2015.
Turban, E., Sharda, R., E. Aronson, J. & King D. 2007. Business Intelligence: A Manage-
rial Approach. 1st ed. Pearson Prentice Hall. Upper Saddle River.
Walkenbach, J. 2013. Excel 2013 Bible. 1st ed. John Wiley & Sons. Indianapolis.

46
Appendices
Appendix 1. Questionnaire for the parents
Questionnaire for the parents
Title: Opinion research to parents regarding the English training to children under
6-years old
Q1. Where do you live currently?
A. Beijing
B. Shanghai
C. Other cities
Q2. How old is your child?
A. Under 3 years-old
B. 3 years-old
C. 4 years-old
D. 5 years-old
E. 6 years old
F. Above 6 years-old
Q3. What is the type of your child’s kindergarten?
A. Public (Normally without English teaching)
B. Teaching language in both English and Chinese
C. Teaching language only in English
D. The child is too young to be sent to kindergarten
Q4. How old do you think is the best time to learn English?
A. 3-6 years-old
B. 7-9 years-old
C. Above 9 years –old
Q5. What is your family’s average income monthly?
A. Under 5000 RMB
B. 5000-10000 RMB
C. 10000-15000 RMB
D. 15000-20000 RMB
E. Above 20000 RMB
Q6. What is the maximum price that you are willing to spend on the English train-
ing per year?
A. Under 800 RMB
B. 800-1500 RMB
C. 1500-3000 RMB
D. 3000-5000 RMB
E. Above 5000 RMB

47
Q7. What is your opinion regarding to the extra English training lessons if the kin-
dergarten your child in provides its own English lessons?
A. It the English lesson trained well by the kindergarten, then the extra English
training is not considered.
B. Even though the English lesson trained well by the kindergarten, the extra
English training is still considered.
C. Even though the English lesson trained not well by the kindergarten, the ex-
tra English training is not considered.
D. It the English lesson trained not well by the kindergarten, then the extra
English training will be considered.
Q8. What kind of factors will lead you to join an extra English training?
A. The English lesson provided by kindergarten is disappointed.
B. The increased requirements for the social competition.
C. The organization which offers the extra English training has very good repu-
tation and professional teachers.
D. The lesson is taught by Native speaker with teaching qualification and the
teacher is able to build an active and positive learning environment.
E. The price is moderate and the organization has a better price/performance
ratio.
F. Very good learning environment, which can encourage children involved
and be more interactive with each other.
G. Parents are busy during weekend, the child could be took care of by the or-
ganization and study at the same time.
H. Other reasons which is___________________.
Q9. Does your child has an extra English training currently? (If the answer is B or
C, then the question will be directed to question 12.)
A. Yes. Please specify the name of the organization and the related cost if it is
possible:___________.
B. No.
C. The child is too young to be sent to kindergarten.
Q10. Is there anything makes you unsatisfied with the extra English training?
A. No Native speaker teachers.
B. Lack of the interaction and communication between the teacher and the
child.
C. The effect of the training is poor.
D. Child is hardly attracted by the teaching.
E. The price is a little bit high.
F. Other reasons: ______________.
Q11. How did you know about this organization?
A. Strong reputation that spread throughout around.
B. Recommended by the kindergarten.
C. Advertisement on the website.
D. Hand-out flyer.

48
E. From other resources: ___________.
Q12. Will you choose other English training organizations if the kindergarten al-
ready offers English lesson?
A. Yes.
B. No.
C. If the offered English lesson is not taught by Native-speaker teacher, then
an extra training with Native-speaker teacher will be considered.
D. If the offered English lesson is taught by Native-speaker teacher, then an
extra training with different Native-speaker teacher will be considered.
Q13. How long do you think is proper each lesson for a child?
A. 30 minutes.
B. 45 minutes.
C. 60 minutes.
D. 75 minutes.
Q14. How many children do you think is perfect in a class?
A. Under 5 persons.
B. 5-10 persons.
C. 10-15 persons.
D. Above 15 persons.
Q15. Which following teaching method do you prefer?
A. Local teacher teaching according to the teaching discs.
B. Native-speak teacher teaching according to the teaching discs.
C. The class is leading by a Native-speak teacher with a local teacher’s help.
D. New words explanation and teaching goes first by a local teacher, and then
the class is leading by a Native-speak teacher.
E. The class is leading by a local teacher, while the Native-speak teacher will
help children to practice related contents through conversation and some
games.
Q16. Are you willing to have parent-child activities during the training?
A. Yes.
B. Doesn’t matter.
Q17. How often the lessons are arranged per week is the best for children’s learn-
ing?
A. Once a week, otherwise the children will lose the interest and patience.
B. Twice or three times per week, because it is better for kids to memorize.
C. Other: ______________.