the use of bim to analyse the energy performance of a retrofitted educational building in ireland -...
TRANSCRIPT
THE USE OF BIM TO ANALYSE
THE BUILDING ENERGY
PERFORMANCE OF A
RETROFITTED EDUCATIONAL
BUILDING IN IRELAND (Building and Civil Engineering Department – GMIT)
By
MARK THORNTON
B.SC. (HONS) IN ARCHITECTURAL TECHNOLOGY
A TECHNICAL REPORT SUBMITTED IN PARTIAL FULFILMENT OF THE REQUIREMENTS
FOR THE BACHELOR OF SCIENCE (HONOURS) IN ARCHITECTURAL TECHNOLOGY
GALWAY MAYO INSTITUTE OF TECHNOLOGY
2015
The use of BIM to analyse the building energy performance of a retrofitted educational building in Ireland
i
Executive Summary
With global warming and climate change a major issue in today’s world, it is now more than ever
that a shift towards energy efficient buildings is needed. The construction industry consumes a large
amount of energy throughout the world and now measures are being taken to combat this. Within
Ireland, Technical Guidance Documents Part L 2008 Buildings other than dwellings and 2011
dwellings regulate how a building is designed for energy efficiency. These documents are to be
changed in 2015 to help push Ireland towards nearly zero energy buildings. These NZEB targets
come from the EU Directive 2010/31 and in place to help Europe reach nearly zero energy buildings
by 2020. The stricter regulations call for a primary energy use of 45 kWh/m2/annum for a new
building, 55-60 kWh/m2/annum and 125 to 150kWh/m2/annum for an existing building. The
Department of the Environment’s paper “Towards Nearly Zero Energy Buildings in Ireland 2012” and
“Statutory Instruments SI no 243 2012” looks at the how Ireland is to achieve the targets set out by
the EU by 2018.
With Building Information Modelling (BIM) becoming more prominent with in the construction
industry it opens up the possibilities to analyse the projected energy usage within a building at the
design stage. There are various building energy simulation software options available that can be
used with a BIM model. This report looks at using a Revit model with Integrated Environment
Solutions Virtual Environment (IES VE) or Autodesk Green Building Studio to perform an energy
analysis to get the total energy usage within the building to try and reach compliance with the NZEB
targets. A suitable software option is chosen and the analysis is performed with various design
options looked at and the results are compared and checked to see if any option complies with the
NZEB. The limitations of the software are looked at and the accuracy of the results is called into
question by being validated against similar research in the area of building performance simulation.
The use of BIM to analyse the building energy performance of a retrofitted educational building in Ireland
ii
Table of Contents
ACKNOWLEDGEMENTS ............................................................................................................................ i
LIST OF TABLES ......................................................................................................................................... i
LIST OF FIGURES ...................................................................................................................................... ii
LIST OF ABBREVIATIONS ........................................................................................................................ iv
SECTION 1.0 ............................................................................................................................................ 1
1.1 Introduction .................................................................................................................................. 1
1.2 Aim of the report .......................................................................................................................... 2
1.3 Objectives of the Report ............................................................................................................... 2
1.4 Scopes and limitations .................................................................................................................. 3
1.4.1 Scope of the report ................................................................................................................ 3
1.4.2 Limitations of the report ........................................................................................................ 3
SECTION 2.0 ............................................................................................................................................ 3
2.1 Methodology ................................................................................................................................. 3
2.1.1 Primary ................................................................................................................................... 3
2.1.2 Secondary ............................................................................................................................... 4
SECTION 3.0 Research ............................................................................................................................. 5
3.1 Secondary research ....................................................................................................................... 5
3.1.1 Irish Regulations for Building Energy Performance - Technical Guidance Documents ......... 5
3.1.2 NZEB – Nearly Zero Energy Buildings Targets for 2020 ......................................................... 6
3.1.3 Use of BIM and Building Performance Simulation Software in Energy Efficient Design ....... 8
3.1.4 Conclusion .............................................................................................................................. 9
3.2 Primary research ......................................................................................................................... 10
3.2.1 Building and Civil Engineering Department - GMIT ............................................................. 10
3.2.2 BIM model making process for energy analysis ................................................................... 11
3.2.1.1 Existing Building ............................................................................................................ 11
3.2.1.2 Proposed upgrade to existing Building ......................................................................... 12
3.2.1.3 Architectural model to analytical model: Preparation for analysis .............................. 13
3.2.1.4 Importing the model for analysis .................................................................................. 16
3.2.2 Renewable technologies ...................................................................................................... 16
3.2.2.1 Using BIM and analysis software for aiding renewable technologies decisions .......... 16
3.2.3 Selecting the HVAC Systems ................................................................................................ 19
3.2.3 Analysis ................................................................................................................................ 19

The use of BIM to analyse the building energy performance of a retrofitted educational building in Ireland
iii
3.2.3.1 Base Run results ............................................................................................................ 20
3.2.3.2 Air Source Heat pump results ....................................................................................... 23
3.2.3.3 Gas Condensing Boiler .................................................................................................. 26
3.2.3.4 Comparisons ................................................................................................................. 29
SECTION 4.0 Results .............................................................................................................................. 30
SECTION 5.0 Conclusions and Recommendations ................................................................................ 30
5.1 Conclusion ................................................................................................................................... 30
5.2 Recommendations ...................................................................................................................... 31
APPENDICES .......................................................................................................................................... 32
Appendix A: Plagiarism Declaration .................................................................................................. 32
Appendix B: Weather Data – Wind Roses ......................................................................................... 33
Appendix C: Base Run Costs .............................................................................................................. 34
Appendix D: Air Source Heat Pump Costs ......................................................................................... 35
Appendix E: Gas Condensing Boiler Costs......................................................................................... 37
Appendix F: Cost Comparison ........................................................................................................... 38
REFERENCES .......................................................................................................................................... 39
BIBLIOGRAPHY ...................................................................................................................................... 40
The use of BIM to analyse the building energy performance of a retrofitted educational building in Ireland
i
ACKNOWLEDGEMENTS
This Technical Report would not have been possible without the support of many people. The author
wishes to express his gratitude to his supervisors; Irene Hayden and Siobhaun Cawley, lecturers in
GMIT, who were abundantly helpful and offered invaluable assistance, support and guidance. The
author would also like to convey thanks to his friends and classmates for their support throughout
the research and writing of this report. The author wishes to express a special thanks and gratitude
to his family and girlfriend for their understanding and endless support through the duration of his
studies.
LIST OF TABLES
Table 1: Total energy usage per month-Base run ................................................................................. 21
Table 2: total electricity usage per month-base run ............................................................................. 22
Table 3: fuel usage per month-base run ............................................................................................... 22
Table 4: Monthly usage for energy – Air Source Heat Pump ................................................................ 24
Table 5: monthly usage for electricity – air source heat pump ............................................................ 25
Table 6: monthly usage for fuel – air source heat pump ...................................................................... 25
Table 7: monthly usage for energy – gas condensing boiler ................................................................ 27
Table 8: monthly usage for electricity –gas condensing boiler ............................................................ 28
Table 9: monthly usage for fuel – gas condensing boiler ..................................................................... 28
Table 10: Total monthly and cost per m2 energy costs......................................................................... 34
Table 11: total monthly and cost per m2 electricity costs .................................................................... 34
Table 12: total monthly and cost per m2 fuel costs .............................................................................. 35
Table 13: total monthly and cost per m2 energy costs - air source heat pump .................................... 35
Table 14: total monthly and cost per m2 electricity costs - air source heat pump ............................... 36
Table 15: total monthly and cost per m2 fuel costs - air source heat pump......................................... 36
Table 16: total monthly and cost per m2 energy costs - gas condensing boiler ................................... 37
Table 17: total monthly and cost per m2 electricity costs - gas condensing boiler .............................. 37
Table 18: total monthly and cost per m2 fuel costs - gas condensing boiler ........................................ 38
The use of BIM to analyse the building energy performance of a retrofitted educational building in Ireland
ii
LIST OF FIGURES
Figure 1: Potential energy savings at the design stage. .......................................................................... 7
Figure 2: How BIM is used....................................................................................................................... 8
Figure 3: South Elevation of Galway Mayo Institute of Technology Building and Civil Engineering
Department ........................................................................................................................................... 10
Figure 4: Revit model of existing Building and Civil Engineering Department ..................................... 11
Figure 5: Revit model of the upgraded Building and Civil Engineering Department ............................ 12
Figure 6: Thermal image of heat loss through external wall at corner junction ................................. 12
Figure 7: Thermal image of heat loss through exterior wall ................................................................. 12
Figure 8: U-value calculation using u-wert.net for the existing external WALL ................................... 13
Figure 9: U-value calculation using u-wert.net for the proposed upgrade of the external wall .......... 13
Figure 10: Architectural model ............................................................................................................. 14
Figure 11: Analysis model ..................................................................................................................... 14
Figure 12: Architectural model interior ................................................................................................ 15
Figure 13: Analysis model interior ........................................................................................................ 15
Figure 14: Export settings using room .................................................................................................. 15
Figure 15: Weather data from green building studio ........................................................................... 17
Figure 16: Wind frequency distribution chart for 12 months showing wind speed in m2 and
percentage of time ................................................................................................................................ 17
Figure 17: Direct normal radiation frequency distribution chart ......................................................... 18
Figure 18: Photovoltaic potential from green building studio .............................................................. 18
Figure 19: examples of some of the HVAC systems available in Green Building Studio ...................... 19
Figure 20: Energy carbon and cost summary of Base run .................................................................... 20
Figure 21: carbon neutral potential ...................................................................................................... 20
Figure 22: Electrical power sources ...................................................................................................... 20
Figure 23: Annual electrical use within the building............................................................................. 21
Figure 24: Annual fuel end use ............................................................................................................. 21
Figure 25: monthly data for total energy usage – Base Run ................................................................. 21
Figure 26: monthly data for total electricity usage – Base Run ............................................................ 22
Figure 27: monthly data for total fuel usage – Base Run ...................................................................... 22
Figure 28: Energy carbon and cost summary using an air source heat pump ...................................... 23
Figure 29: carbon neutral potential using an air source heat pump .................................................... 23
Figure 30: annual fuel end use using an air source heat pump ............................................................ 24
The use of BIM to analyse the building energy performance of a retrofitted educational building in Ireland
iii
Figure 31: annual electrical use within the building using an air source heat pump ........................... 24
Figure 32: monthly data for total energy usage – air source heat pump ............................................. 24
Figure 33: monthly data for total electricity usage – air source heat pump ....................................... 25
Figure 34: monthly data for total fuel usage – air source heat pump .................................................. 25
Figure 35: energy carbon and cost summary using a gas condensing boiler ....................................... 26
Figure 36: carbon neutral potential using a gas condensing boiler ...................................................... 26
Figure 37: annual fuel end use using a gas condensing boiler.............................................................. 27
Figure 38: annual electrical use within the building using a gas condensing boiler ............................. 27
Figure 39: monthly data for total energy usage – gas condensing boiler ............................................ 27
Figure 40: monthly data for total electricity usage – gas condensing boiler ........................................ 28
Figure 41: monthly data for total fuel usage – gas condensing boiler ................................................. 28
Figure 42: total energy used (kwh/m2/annum) for each run compared to nzeb targets ..................... 29
Figure 43: winter and summer wind roses ........................................................................................... 33
Figure 44: annual wind rose chart showing wind direction along with the wind speed ...................... 33
Figure 45: total energy costs - base run ................................................................................................ 34
Figure 46: Total electricity costs - Base Run ......................................................................................... 34
Figure 47: total fuel costs - base run..................................................................................................... 35
Figure 48: total energy costs - air source heat pump ........................................................................... 35
Figure 49: total electricity costs - air source heat pump ...................................................................... 36
Figure 50: total fuel costs - air source heat pump ................................................................................ 36
Figure 51: total energy costs - gas condensing boiler ........................................................................... 37
Figure 52: total electricity costs - gas condensing boiler ...................................................................... 37
Figure 53: total fuel costs - gas condensing boiler................................................................................ 38
Figure 54: total energy cost per year for each design option ............................................................... 38
The use of BIM to analyse the building energy performance of a retrofitted educational building in Ireland
iv
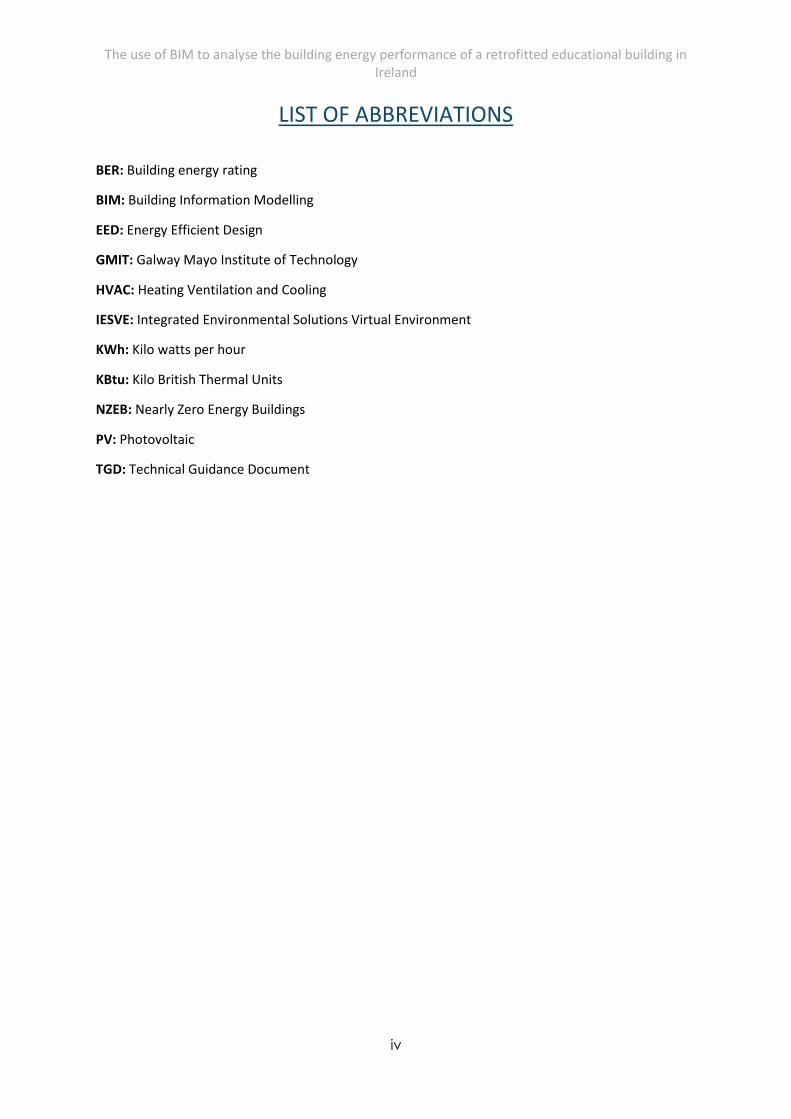
LIST OF ABBREVIATIONS
BER: Building energy rating
BIM: Building Information Modelling
EED: Energy Efficient Design
GMIT: Galway Mayo Institute of Technology
HVAC: Heating Ventilation and Cooling
IESVE: Integrated Environmental Solutions Virtual Environment
KWh: Kilo watts per hour
KBtu: Kilo British Thermal Units
NZEB: Nearly Zero Energy Buildings
PV: Photovoltaic
TGD: Technical Guidance Document
The use of BIM to analyse the building energy performance of a retrofitted educational building in Ireland
1
SECTION 1.0
1.1 Introduction
With climate change a major issue in today’s world there is a major shift towards more energy
conservation and reducing our carbon footprint.
"Buildings consume 40% of global primary energy and contribute to in excess of 30% CO2 emissions.”
(Costa, Keane et al. 2013).
These figures are very high proportion of total global energy use and carbon dioxide emissions and
contribute significantly to climate change. It is now more than ever that steps have to be taken to
reduce these figures. Within the construction sector steps are being taken to reduce the carbon foot
print and environmental impact when building, but a lot of this is being done in the design phase,
such as sourcing local materials to reduce transport costs, environmental impact statements which
are required prior to planning permission, and the use of various renewable technologies. A lot more
can be achieved in the early stages of the design stage with the use of Building Information
Modelling and various energy simulation software. This can be done as early as the concept and
sketch design stage from orientating the building to maximising the solar gain and sunlight as well as
deciding what type of HVAC system is used and where the energy is sourced.
The construction industry is now starting to grow again, it is now more than ever that there needs to
be a change in the way buildings are designed and build with bigger emphasis on enhanced energy
performance and energy conservation. There is also a large stock of buildings within Ireland that
have poor energy performance and are poorly constructed. This opens up an opportunity to address
this with retrofitting instead of new construction. When the recession hit it left a lot of unfinished
buildings in Ireland and these building can now be looked at to being completed instead of starting
new construction. There are also a lot of finished buildings that have a poor energy rating and
performance and retrofitting these buildings can also be looked at. The Irish government is now
looking at energy conservation with the revision of the Technical Guidance Document Part L –
Conservation of fuel and energy 2008 and 2011. One of the new revisions is that all buildings must
comply with a higher building energy rating (BER). This would mean that all new buildings must
comply with these new guidelines but if the same guidelines are followed when retrofitting a current
building the same rating and energy performance can be achieved.
The use of BIM to analyse the building energy performance of a retrofitted educational building in Ireland
2
With the Building and Civil Engineering department in Galway Mayo Institute of Technology being
built in 1972, energy performance was not a major concern at the time and this then led to future
problems, mainly the poor energy performance with in the building and poor thermal performance.
The purpose of this report is to investigate the use of a Revit model and building performance
simulation software, like Autodesk Green Building Studio and Integrated Environmental Solutions
Virtual Environment to analyse the overall energy performance of a proposed retro fit of an
educational building in Ireland as a case study of Building and Civil Engineering Department in
Galway Mayo Institute of Technology, a wing of the original 1972 GMIT building.
1.2 Aim of the report
The aim of this report is to investigate how the use of a BIM model and building performance
simulation software such as Autodesk Green Building Studio and Integrated Environmental Solutions
Virtual Environment can be used to analyse the energy performance of a proposed retro fit of an
educational building in Ireland as a case study. The report will look at the chosen software and the
advantages and limitations associated with it when running the simulations, while also looking at the
accuracy associated with this sort of simulation. The results will aim to comply with Technical
Guidance Document Part L - Conservation of Fuel and Energy – Dwellings (2011) and NZEB targets.
The building that will be used is the Building and Civil Engineering Department in Galway Mayo
Institute of Technology.
1.3 Objectives of the Report
1. To Analyse the energy performance and Technical Guidance Document Part L 2011 and
NZEB compliance as a case study of an upgraded educational building using BIM software
(Revit) and building energy performance simulation software
2. Compare findings and limitations of the software and analyse the accuracy of the results.
The use of BIM to analyse the building energy performance of a retrofitted educational building in Ireland
3
1.4 Scopes and limitations
1.4.1 Scope of the report The scope of this report aims to use a BIM model produced from Revit which was produced in
conjunction with a Design and Detail project. The model shows the upgraded elements of the
Building and Civil Engineering Department of Galway Mayo Institute of Technology and is to be used
as a case study for the building energy performance analysis using Autodesk Green Building Studio
and Integrated Environmental Solutions Virtual Environment. Various Heating Ventilation and
Cooling systems (HVAC) will be analysed by the software and the output will be analysed and
compared and compliance with current building regulations will checked along with the accuracy of
the results from the simulation software.
1.4.2 Limitations of the report The limitations of this report will be the various software options that need to be looked at and the
time frame for the completion of the report. There will also be a learning curved associated with all
the software which could be a limitation of this report. Another limitation would be the speed of the
process associated with the analysis and reliance upon the results to prove compliance.
SECTION 2.0
2.1 Methodology
2.1.1 Primary
A Revit model was completed of the proposed upgrade of the Building and Civil Engineering
Department of GMIT as a case study. Then 3 different runs for analysis were done with different
HVAC systems and renewable technologies. The 3 runs were;
1. Base Run – analysis of just the upgraded envelope of the building and boiler
2. Air source heat pump– analysis with an air source heat pump with renewable technologies
3. Gas Condensing Boiler – analysis with a gas condensing boiler and renewable technologies
A fourth run was to be done using a bio mass boiler but due to limitations in the software this was
not achievable.
Various building performance software like Autodesk Green Building Studio and Integrated
Environmental Solutions Virtual Environment were looked at for the analysis.
The use of BIM to analyse the building energy performance of a retrofitted educational building in Ireland
4
Autodesk Green building studio is a cloud based service that allows for building performance
simulations. It can be used as a standalone web service or linked to a Revit model for whole building
energy analysis. It is designed to simplify the task of whole building performance analysis and looks
at energy use, water use and carbon emissions
The second option was Integrated Environmental Solutions Virtual Environment (IESVE). IESVE is a
software suite that with 2 options, one for architects and one for engineers. For this report it will be
looking at VE (virtual environment) for architects. The package is fully compatible with sketch up and
all BIM packages including Revit. Just like green building studio it does analysis for solar, shading and
lighting. It also does analysis for energy usage, thermal analysis, heating/cooling and ventilation and
air flow while also provide costs.
With all the options looked at and analysed the results were gathered and compared to see if they
comply with the current building regulations or the nearly zero energy building targets for 2020 and
a conclusion was reached. The software will be analysed for accuracy of results and be validated
against other peer reviewed papers which looks at the same subject. These papers are; “Validation
of building energy modelling tools: Ecotect, Green Building Studio and IES VE” (Reeves, Olbina et al.
2012) and “Assessing the Operational Energy Profiles of UK educational buildings: findings from
detailed surveys and modelling compared to consumption”. (Knight, Stravoravdis et al. 2007)
2.1.2 Secondary
Research was done into the area of Irish building regulations which are Technical Guidance
Document Part L Conservation of Fuel and Energy – Dwellings (2011). This research looked at the
regulations in place and the minimum requirements that needed to achieve compliance. Various
peer reviewed publications which looked at building energy performance and how Building
Information Modelling and computer software can be used to analyse building energy performance
at a design stage were looked at. The government’s paper entitled “Towards nearly zero energy
buildings in Ireland – Planning for 2020 and beyond” (Dept. of Environment 2012) and the “Statutory
Instruments S.I. No. 243 of 2012” (Government of Ireland 2012) which is the Laws that are enforce
the regulations. These look at BER certifications along with energy systems. Building Information
Modelling in general is researched and the impact it has upon building energy performance analysis.
The use of BIM to analyse the building energy performance of a retrofitted educational building in Ireland
5
SECTION 3.0 Research
3.1 Secondary research
3.1.1 Irish Regulations for Building Energy Performance - Technical Guidance
Documents
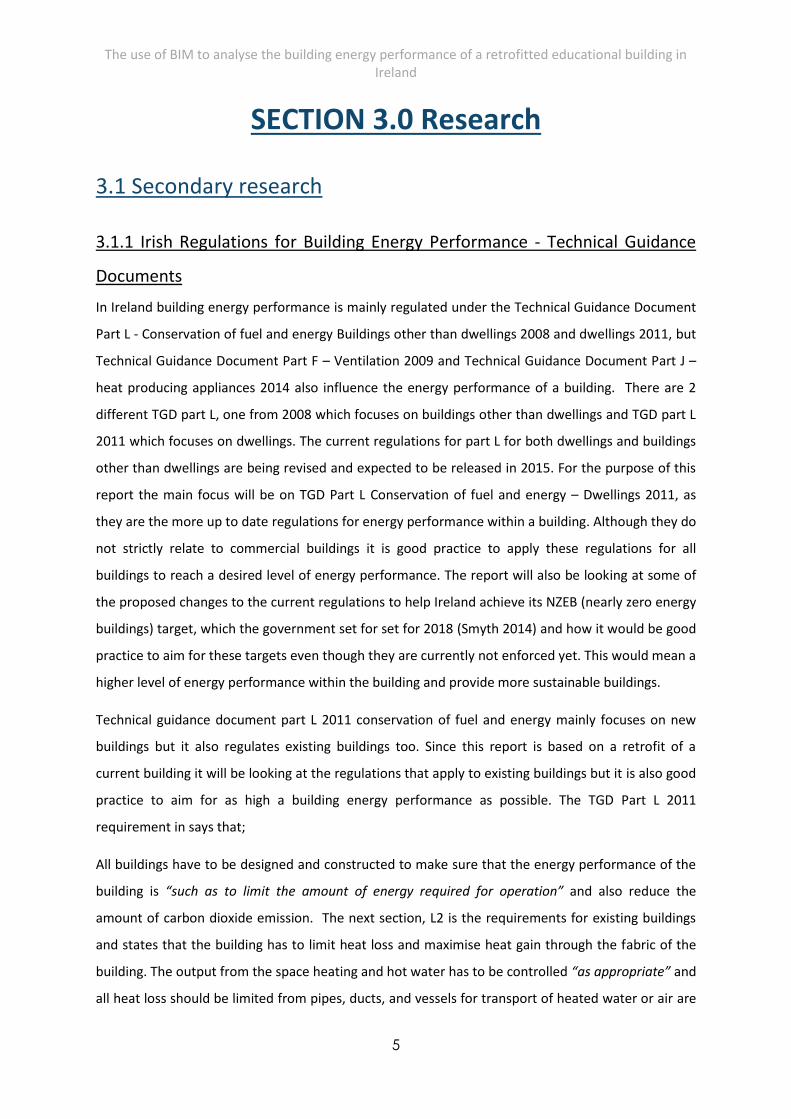
In Ireland building energy performance is mainly regulated under the Technical Guidance Document
Part L - Conservation of fuel and energy Buildings other than dwellings 2008 and dwellings 2011, but
Technical Guidance Document Part F – Ventilation 2009 and Technical Guidance Document Part J –
heat producing appliances 2014 also influence the energy performance of a building. There are 2
different TGD part L, one from 2008 which focuses on buildings other than dwellings and TGD part L
2011 which focuses on dwellings. The current regulations for part L for both dwellings and buildings
other than dwellings are being revised and expected to be released in 2015. For the purpose of this
report the main focus will be on TGD Part L Conservation of fuel and energy – Dwellings 2011, as
they are the more up to date regulations for energy performance within a building. Although they do
not strictly relate to commercial buildings it is good practice to apply these regulations for all
buildings to reach a desired level of energy performance. The report will also be looking at some of
the proposed changes to the current regulations to help Ireland achieve its NZEB (nearly zero energy
buildings) target, which the government set for set for 2018 (Smyth 2014) and how it would be good
practice to aim for these targets even though they are currently not enforced yet. This would mean a
higher level of energy performance within the building and provide more sustainable buildings.
Technical guidance document part L 2011 conservation of fuel and energy mainly focuses on new
buildings but it also regulates existing buildings too. Since this report is based on a retrofit of a
current building it will be looking at the regulations that apply to existing buildings but it is also good
practice to aim for as high a building energy performance as possible. The TGD Part L 2011
requirement in says that;
All buildings have to be designed and constructed to make sure that the energy performance of the
building is “such as to limit the amount of energy required for operation” and also reduce the
amount of carbon dioxide emission. The next section, L2 is the requirements for existing buildings
and states that the building has to limit heat loss and maximise heat gain through the fabric of the
building. The output from the space heating and hot water has to be controlled “as appropriate” and
all heat loss should be limited from pipes, ducts, and vessels for transport of heated water or air are
The use of BIM to analyse the building energy performance of a retrofitted educational building in Ireland
6
limited. It also states that any gas or oil fired boilers have an efficiency of 90% “where practicable”
(TGD Part L 2011)
This would mean, in terms of design that the careful consideration should be taken when it comes
to the energy performance within the building and to try and reduce as much energy as possible that
is required to run the building. The design of the building can impact this greatly with the choice of
building materials that should be used and the performance value of each material. Calculations
must also be done reach the desired level of energy performance and U-values that are required to
meet the regulations. U-Values are the measure of heat loss from a building element like a wall or
roofs. It measures how well each building element transfers heat. The higher the U-Value the worse
the thermal performance of the envelope is. TGD L 2011 sets out minimum u-value that need to be
achieved to comply with the regulations and each building element like the walls and roofs have
specific minimum u-value that each building has to achieve to comply. TGD part L 2011 has backstop
elemental U-Values of 0.21W/m2K for floors, walls, roofs and soffits, whereas the guidance from Des
Murphy (Chartered Engineer) at a recent engineers Ireland talk suggested that a target of 0.15
W/m2K might be more realistic to achieve compliance with TGD part L. (Murphy 2014)
Another area of building energy performance would be services within the building. This is also
looked at with TGD part L 2011 and it states that any oil or gas fired burners should have an
efficiency of 90%. (TGD Part L 2011). Ventilation is another area that needs to be looked at and
mechanical ventilation should be limited where possible, with passive ventilation incorporated
instead. This would mean that less energy is used to run these services and thus would help with the
overall building energy performance of the building. All these factors must be taken into account
when retrofitting a current building, and with the current changes to our regulations to get Ireland
to reach the NZEB (nearly zero energy buildings) target set for 2020 it is now more than ever that
good design and planning must be implemented at an early stage.
3.1.2 NZEB – Nearly Zero Energy Buildings Targets for 2020
“A total of 12.6 million tonnes of CO2 equivalent was generated by the building sector in Ireland in
2010. This accounted for 28.8% of 2010 non-ETS emissions” (Dept. of Environment 2012).
These figures show the amount of CO2 that is produced by the building sector in Ireland and shows
that there is a need to move towards more sustainable and green building. The targets set out that
a building should achieve a BER (building energy rating) of A3 or higher which equates to a primary
The use of BIM to analyse the building energy performance of a retrofitted educational building in Ireland
7
energy uses of 45kWh/m2/annum1. There are also targets set out for educational buildings which is
55-60 kWh/m2 1 but these targets are intermediate targets and will be assessed even more in the
revised TGD L 2014. The NZEB for existing buildings on the other hand isn’t very high with target set
out for BER rating of C1 or higher which equates to 125 to 150kWh/m2/annum1 but also states that a
“reasonable” proportion of the energy used be sourced from a renewable sources where as in a new
building would equate to 22% of the energy used in a building be from renewable sources of
energy1.
The current technical guidance
documents for energy performance are
being revised to make sure that all new
buildings comply with a better
standard of energy performance and
help Ireland reach these targets and
reduce CO2 emissions. It is now more
than ever that all steps need to be
taken in the construction industry to
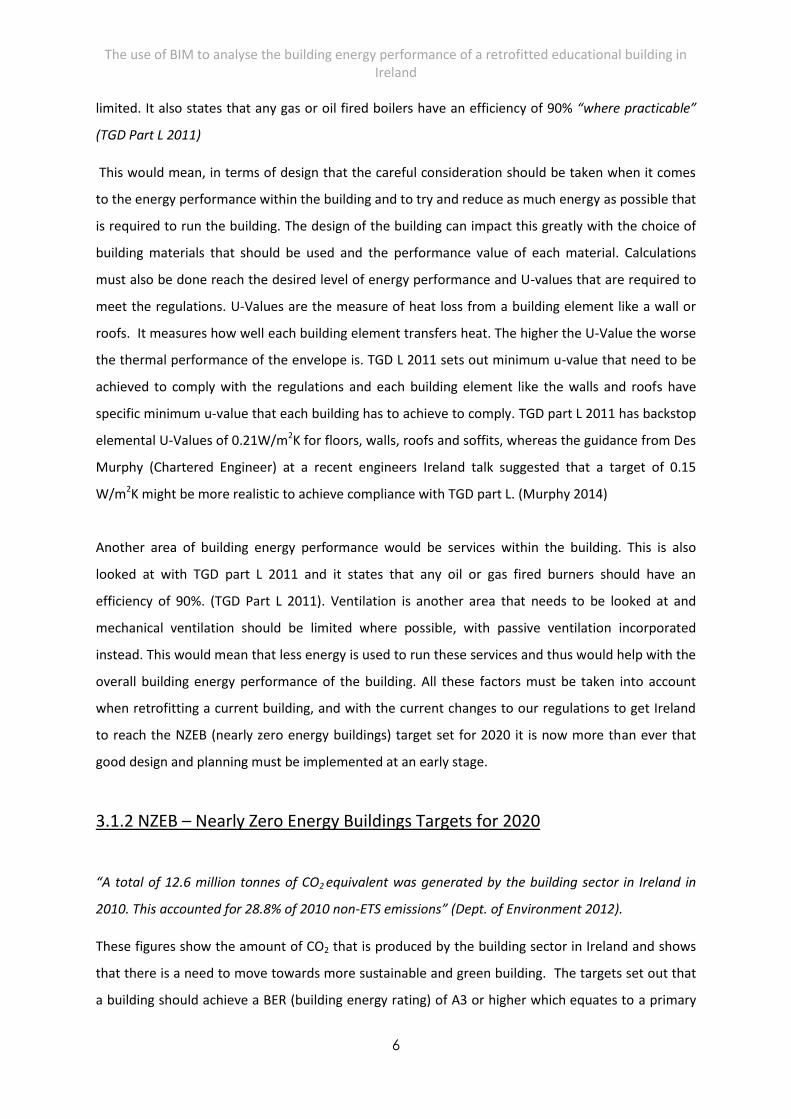
help achieve these targets. The report,
“towards nearly zero energy buildings in Ireland planning for 2020 and beyond” by the department
of the environment, community and local government also looks at how energy savings can be
achieved at the design stage. The graph in Fig. 4 shows how much energy savings can be achieved.
The graph also looks at how much investment is need at each stage of the life of a building and it is
clearly seen that there is very little investment needed at the design stage as compared to each
other stage of the building. “As well as being more cost-effective, it is also easier if energy efficiency
is integrated into capital projects from the outset.” (Dept. of Environment 2012) The report also
pushes for Energy Efficient Design (EED) which means that the construction and the management of
buildings should consume as little energy as possible during the operation of the building. EED lets
you save money by reducing energy use within the building and this is where BIM and building
performance simulation software can be a major advantage in building design and save money and
energy in a project. These targets and methodology set out in the NZEB targets mainly apply for new
builds but this report aims to show how these targets and energy savings can be achieved when
retrofitting an existing building with poor energy performance and how these savings can be shown
as early as the design stage.
1 DEPT OF ENVIRONMENT, 2012. TOWARDS NEARLY ZERO ENERGY BUILDINGS IN IRELAND.
FIGURE 1: POTENTIAL ENERGY SAVINGS AT THE DESIGN STAGE. (DEPT. OF
ENVIRONMENT 2012)
The use of BIM to analyse the building energy performance of a retrofitted educational building in Ireland
8
3.1.3 Use of BIM and Building Performance Simulation Software in Energy
Efficient Design
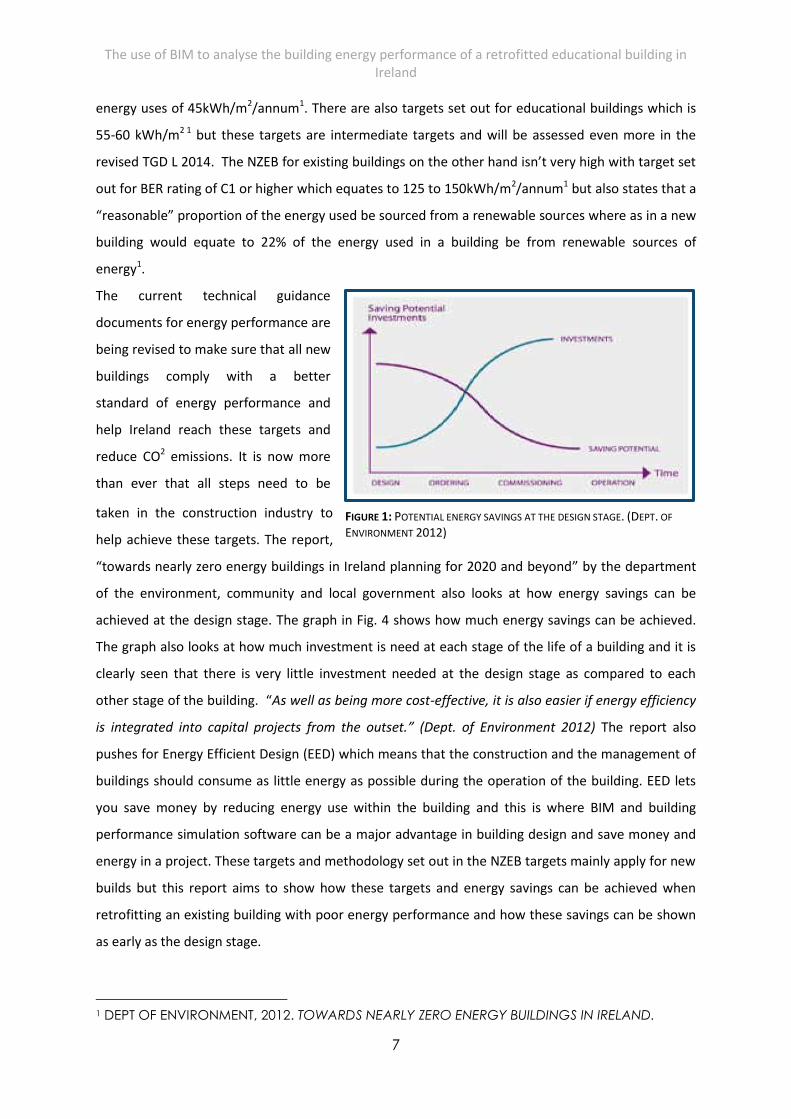
Over the last decade building information modelling (BIM) has been more influential within the
construction industry throughout the world. Traditionally when designing a building 2D drawings
usually drafted in AutoCAD are used throughout the design and construction phase. With BIM a 3D
model is used and the one model is shared and collaborated on with everyone involved within the
construction of a building from structural engineer, architect, contractors etc. It can used to help
schedule and manage projects and energy analysis on a building.
FIGURE 2: HOW BIM IS USED
Source: http://www.directionsmag.com/articles/why-we-care-about-bim/368436
The use of BIM to analyse the building energy performance of a retrofitted educational building in Ireland
9
With the world more aware of climate change and the construction industry producing a large
percentage CO2 building professionals are looking more at sustainable building and better energy
performance. The Irish government has addressed this issue with the NZEB targets for 2020 (refer to
section 3.1.3) and BIM can used to help reach these targets.
“Quality sustainable design requires an understanding of how a building will perform after it's built,
which in turn requires computer-based simulation software for rigorous building analysis”(Rundell,
Rick 2007) What Rundell refers to is that we need to look at a building in terms of its operation and
the energy used over its life. In the past sustainable design was just an “interesting idea” (Rundell,
Rick 2007) but now the focus is on nearly zero energy buildings which means that we have to use
less energy in the operation of the building. BIM allows us to do this by producing an accurate virtual
model of the building with the correct information and running it through an energy analysis
software, but there are a lot of factors that have to be looked at to produce accurate results. HVAC
system, location and weather patterns all have to be looked (Mustafaraj, Marini et al. 2014).
Mustafaraj argues that there are drawbacks to computer simulations like the amount of detailed
data and time that is required and that it might not be cost effective and that this area is a
specialised area of building design. The integration of BIM models, and various building performance
simulation software addresses this issue - “providing an easy way for architects and engineers to
examine the implications of alternative design strategies, helping them achieve higher operational
efficiency and building performance” (Rundell, Rick 2007). This integration means various design
options can be looked at by the designer at an early stage and give you indication of the future
building performance. With the Irish government targeting nearly zero energy buildings which
influences the changes to the current technical guidance document part L it means that designers
must look at building performance at an early stage in the design. The growing use of BIM within the
construction industry gives designers that option by linking them to various building performance
software and providing with various options at an early stage and implement them in the
construction phase. This report looks at how this approach to building performance analysis and
sustainable design can be applied to a retrofit of an existing building by linking a Revit model to 2 of
these software options and how it can produce the desired results to comply with the targets set out
in the NZEB.
3.1.4 Conclusion
With all the research gathered and building energy performance investigated it is clear to see there
needs to be a major shift towards a higher standard of building going forward. With the changes to
the current TGD Part L 2008 and 20011 which are due in 2015, there will be a major influence on
building energy performance. These regulations are being introduced to push Ireland towards its
The use of BIM to analyse the building energy performance of a retrofitted educational building in Ireland
10
2018 target of nearly zero energy buildings by introducing that all buildings must receive a higher
Building Energy Rating of A3 or higher. With BIM becoming more and more influential in
construction this creates an opportunity for designers to analyse the projected building energy
performance of a building in the design stages. For this report a Revit model of the upgraded Galway
Mayo Institute of Technology is used along with Green Building for analysis. Green Building Studio is
to be used due the built in compatibility with Revit and that it is a cloud base software that allows
for safe storage and fast analysis of results. The results from the primary research will be compared
and checked against the NZEB targets and at a minimum the current building regulations to check
for compliance while the accuracy of the analysis needs to be validated.
3.2 Primary research
Case Study: Building energy performance analysis of a proposed retrofit of
GMIT Building and Civil Engineering Department
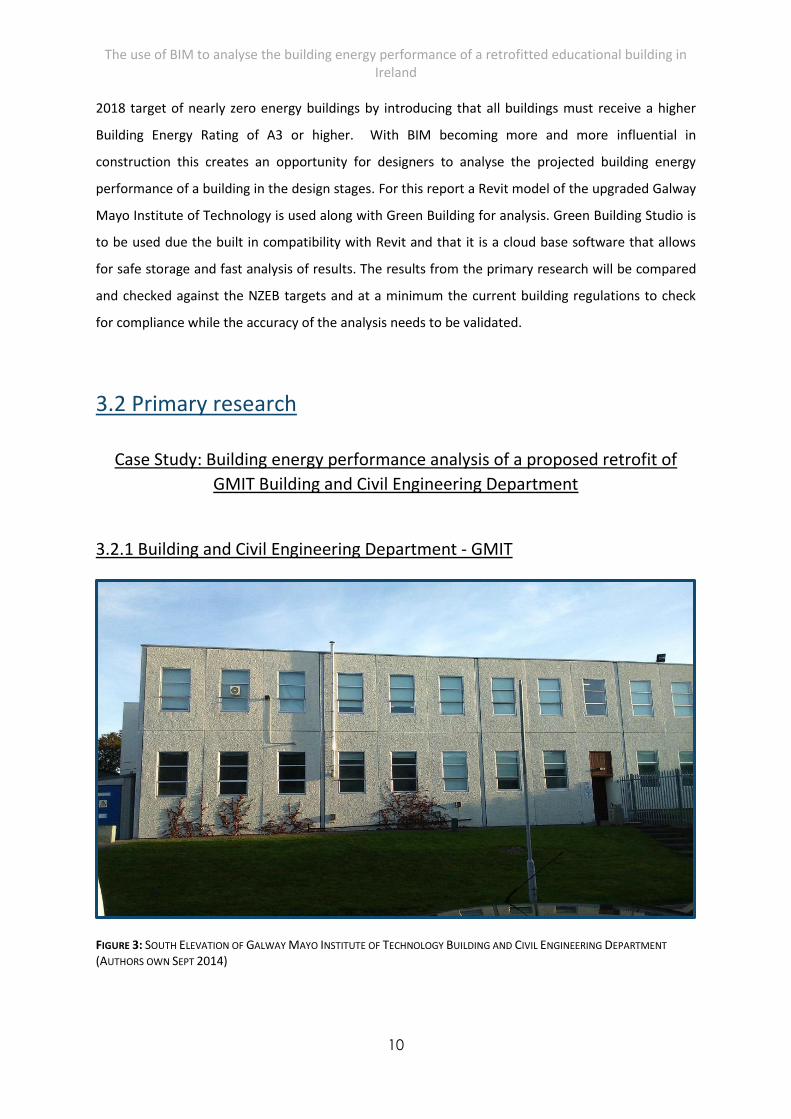
3.2.1 Building and Civil Engineering Department - GMIT
FIGURE 3: SOUTH ELEVATION OF GALWAY MAYO INSTITUTE OF TECHNOLOGY BUILDING AND CIVIL ENGINEERING DEPARTMENT
(AUTHORS OWN SEPT 2014)
The use of BIM to analyse the building energy performance of a retrofitted educational building in Ireland
11
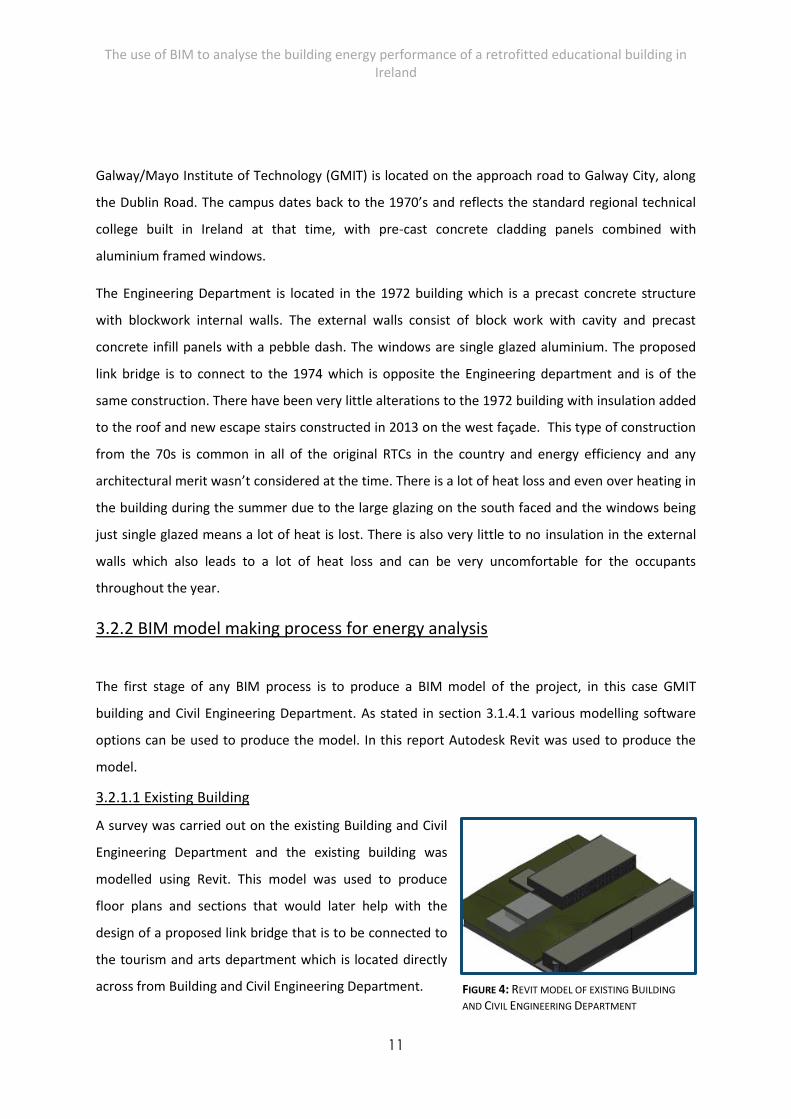
FIGURE 4: REVIT MODEL OF EXISTING BUILDING
AND CIVIL ENGINEERING DEPARTMENT
Galway/Mayo Institute of Technology (GMIT) is located on the approach road to Galway City, along
the Dublin Road. The campus dates back to the 1970’s and reflects the standard regional technical
college built in Ireland at that time, with pre-cast concrete cladding panels combined with
aluminium framed windows.
The Engineering Department is located in the 1972 building which is a precast concrete structure
with blockwork internal walls. The external walls consist of block work with cavity and precast
concrete infill panels with a pebble dash. The windows are single glazed aluminium. The proposed
link bridge is to connect to the 1974 which is opposite the Engineering department and is of the
same construction. There have been very little alterations to the 1972 building with insulation added
to the roof and new escape stairs constructed in 2013 on the west façade. This type of construction
from the 70s is common in all of the original RTCs in the country and energy efficiency and any
architectural merit wasn’t considered at the time. There is a lot of heat loss and even over heating in
the building during the summer due to the large glazing on the south faced and the windows being
just single glazed means a lot of heat is lost. There is also very little to no insulation in the external
walls which also leads to a lot of heat loss and can be very uncomfortable for the occupants
throughout the year.
3.2.2 BIM model making process for energy analysis
The first stage of any BIM process is to produce a BIM model of the project, in this case GMIT
building and Civil Engineering Department. As stated in section 3.1.4.1 various modelling software
options can be used to produce the model. In this report Autodesk Revit was used to produce the
model.
3.2.1.1 Existing Building
A survey was carried out on the existing Building and Civil
Engineering Department and the existing building was
modelled using Revit. This model was used to produce
floor plans and sections that would later help with the
design of a proposed link bridge that is to be connected to
the tourism and arts department which is located directly
across from Building and Civil Engineering Department.
The use of BIM to analyse the building energy performance of a retrofitted educational building in Ireland
12
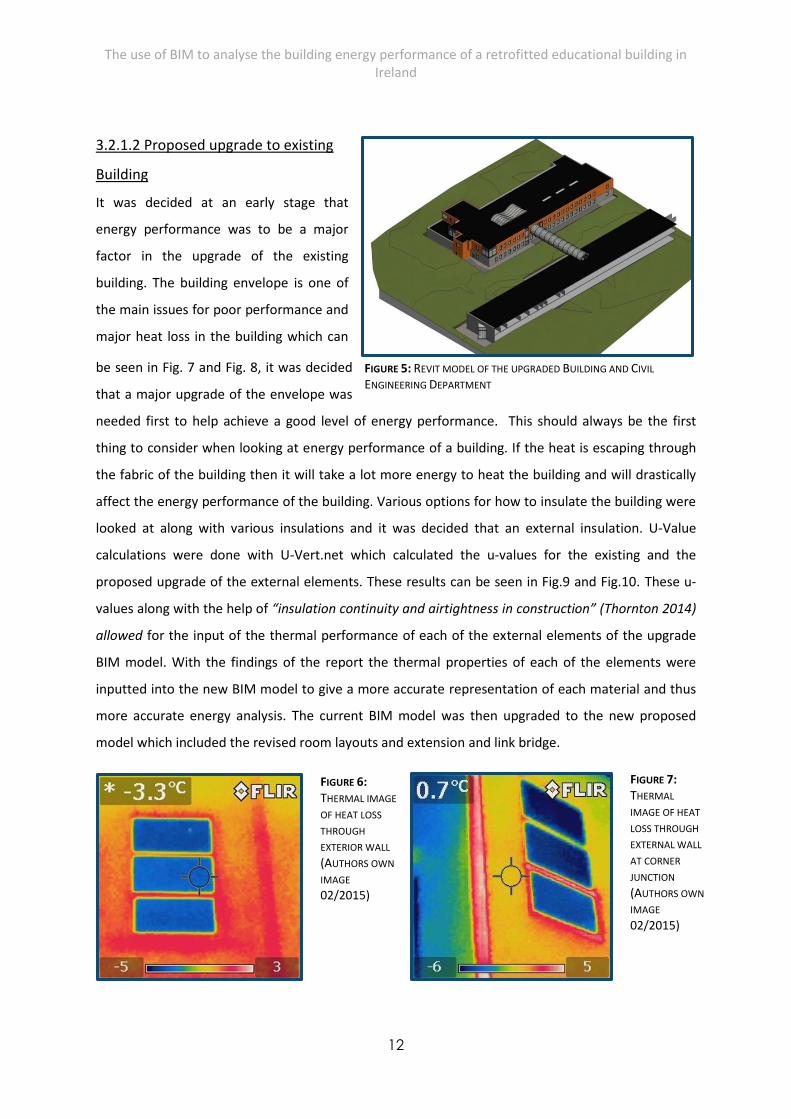
3.2.1.2 Proposed upgrade to existing
Building
It was decided at an early stage that
energy performance was to be a major
factor in the upgrade of the existing
building. The building envelope is one of
the main issues for poor performance and
major heat loss in the building which can
be seen in Fig. 7 and Fig. 8, it was decided
that a major upgrade of the envelope was
needed first to help achieve a good level of energy performance. This should always be the first
thing to consider when looking at energy performance of a building. If the heat is escaping through
the fabric of the building then it will take a lot more energy to heat the building and will drastically
affect the energy performance of the building. Various options for how to insulate the building were
looked at along with various insulations and it was decided that an external insulation. U-Value
calculations were done with U-Vert.net which calculated the u-values for the existing and the
proposed upgrade of the external elements. These results can be seen in Fig.9 and Fig.10. These u-
values along with the help of “insulation continuity and airtightness in construction” (Thornton 2014)
allowed for the input of the thermal performance of each of the external elements of the upgrade
BIM model. With the findings of the report the thermal properties of each of the elements were
inputted into the new BIM model to give a more accurate representation of each material and thus
more accurate energy analysis. The current BIM model was then upgraded to the new proposed
model which included the revised room layouts and extension and link bridge.
FIGURE 5: REVIT MODEL OF THE UPGRADED BUILDING AND CIVIL
ENGINEERING DEPARTMENT
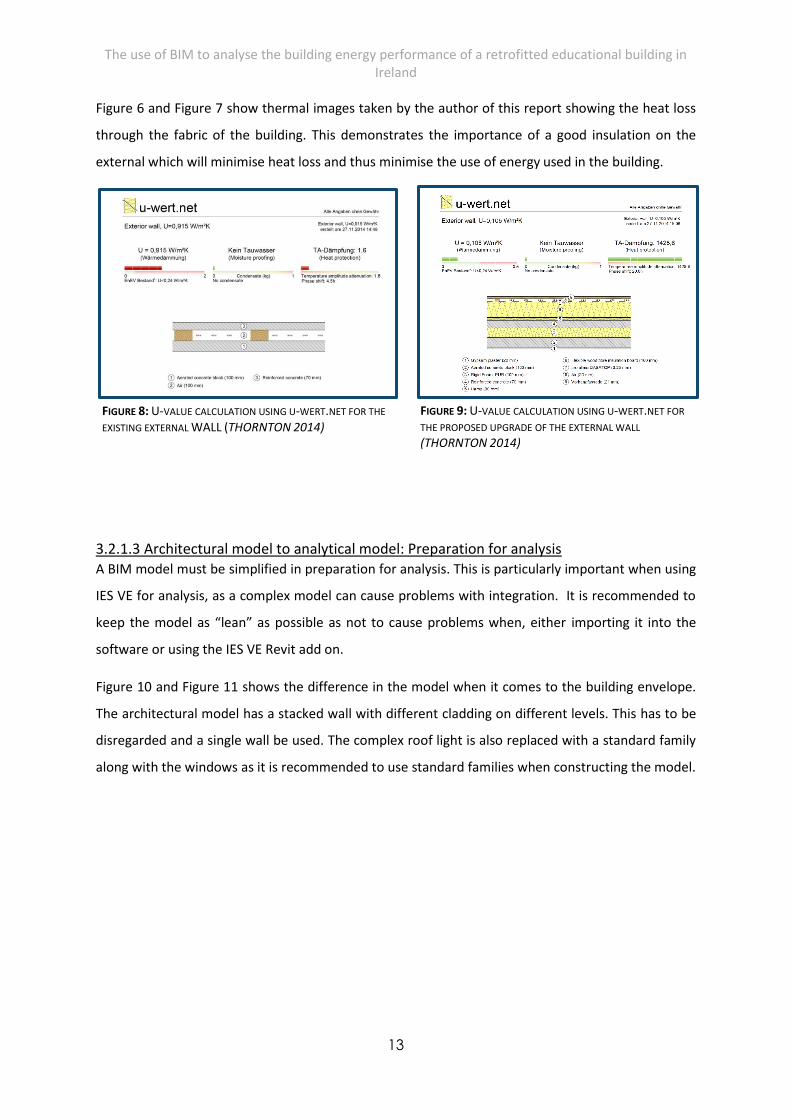
FIGURE 6: THERMAL IMAGE
OF HEAT LOSS
THROUGH
EXTERIOR WALL
(AUTHORS OWN
IMAGE
02/2015)
FIGURE 7: THERMAL
IMAGE OF HEAT
LOSS THROUGH
EXTERNAL WALL
AT CORNER
JUNCTION
(AUTHORS OWN
IMAGE
02/2015)
The use of BIM to analyse the building energy performance of a retrofitted educational building in Ireland
13
FIGURE 9: U-VALUE CALCULATION USING U-WERT.NET FOR
THE PROPOSED UPGRADE OF THE EXTERNAL WALL
(THORNTON 2014)
FIGURE 8: U-VALUE CALCULATION USING U-WERT.NET FOR THE
EXISTING EXTERNAL WALL (THORNTON 2014)
Figure 6 and Figure 7 show thermal images taken by the author of this report showing the heat loss
through the fabric of the building. This demonstrates the importance of a good insulation on the
external which will minimise heat loss and thus minimise the use of energy used in the building.
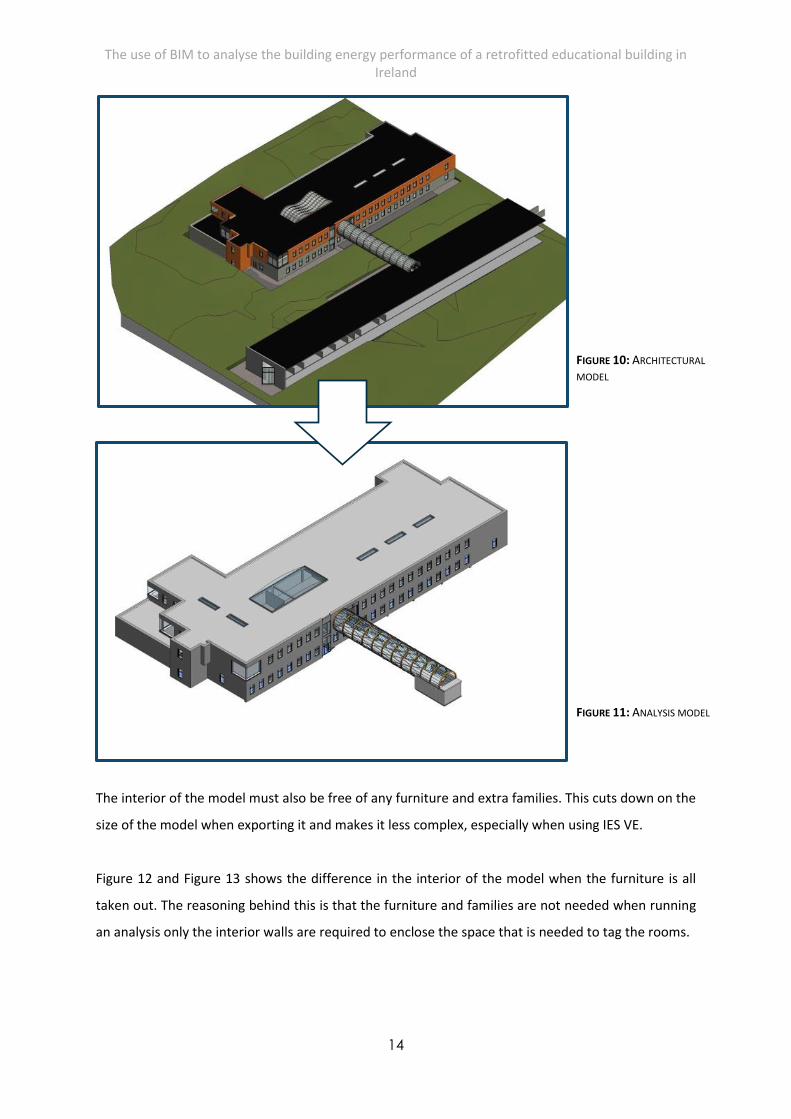
3.2.1.3 Architectural model to analytical model: Preparation for analysis A BIM model must be simplified in preparation for analysis. This is particularly important when using
IES VE for analysis, as a complex model can cause problems with integration. It is recommended to
keep the model as “lean” as possible as not to cause problems when, either importing it into the
software or using the IES VE Revit add on.
Figure 10 and Figure 11 shows the difference in the model when it comes to the building envelope.
The architectural model has a stacked wall with different cladding on different levels. This has to be
disregarded and a single wall be used. The complex roof light is also replaced with a standard family
along with the windows as it is recommended to use standard families when constructing the model.
The use of BIM to analyse the building energy performance of a retrofitted educational building in Ireland
14
FIGURE 10: ARCHITECTURAL
MODEL
FIGURE 11: ANALYSIS MODEL
The interior of the model must also be free of any furniture and extra families. This cuts down on the
size of the model when exporting it and makes it less complex, especially when using IES VE.
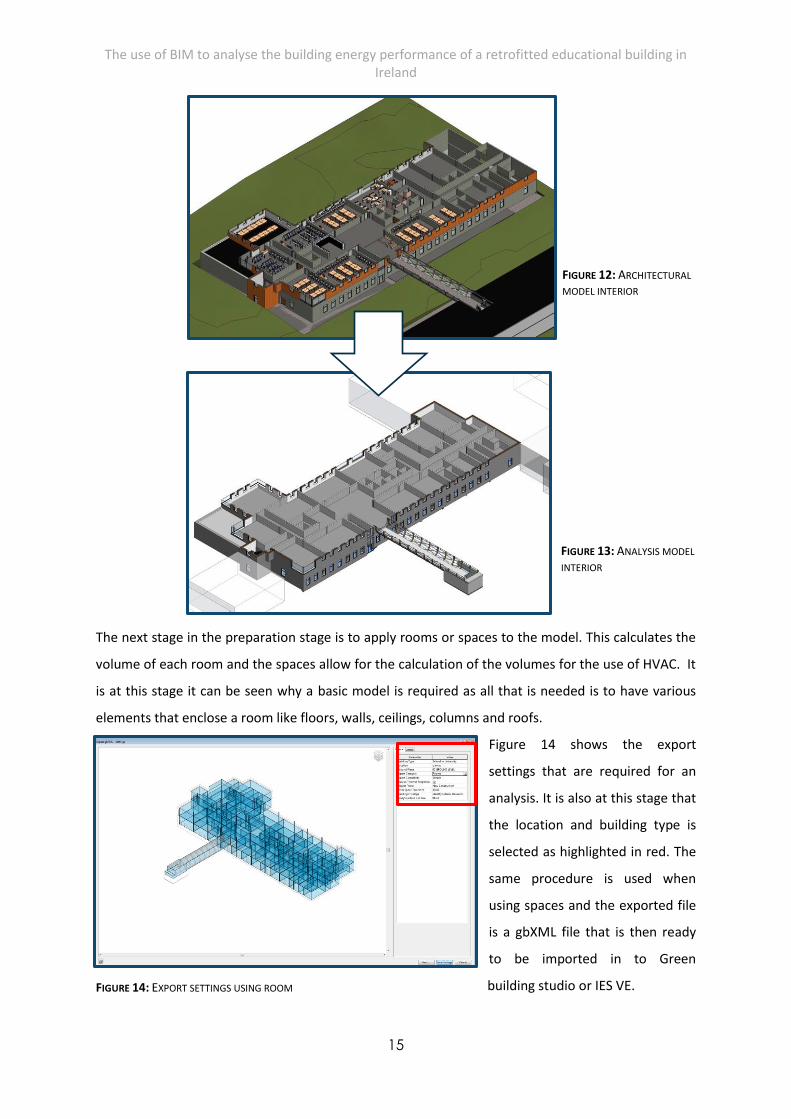
Figure 12 and Figure 13 shows the difference in the interior of the model when the furniture is all
taken out. The reasoning behind this is that the furniture and families are not needed when running
an analysis only the interior walls are required to enclose the space that is needed to tag the rooms.
The use of BIM to analyse the building energy performance of a retrofitted educational building in Ireland
15
FIGURE 12: ARCHITECTURAL
MODEL INTERIOR
FIGURE 13: ANALYSIS MODEL
INTERIOR
FIGURE 14: EXPORT SETTINGS USING ROOM
The next stage in the preparation stage is to apply rooms or spaces to the model. This calculates the
volume of each room and the spaces allow for the calculation of the volumes for the use of HVAC. It
is at this stage it can be seen why a basic model is required as all that is needed is to have various
elements that enclose a room like floors, walls, ceilings, columns and roofs.
Figure 14 shows the export
settings that are required for an
analysis. It is also at this stage that
the location and building type is
selected as highlighted in red. The
same procedure is used when
using spaces and the exported file
is a gbXML file that is then ready
to be imported in to Green
building studio or IES VE.
The use of BIM to analyse the building energy performance of a retrofitted educational building in Ireland
16
3.2.1.4 Importing the model for analysis When it came to importing the model into the software there were no issues regarding Green
Building Studio. Unfortunately when importing the model to IES VE big issues arose regarding
compatibility and this even arose with the add on for Revit. IES VE was having compatibility issues
regarding the model even though it imported correctly but at later stages an error arose. This
unexplained error stopped any analysis from continuing.
With the time constraints on this report there was no time to find a solution and the steep learning
curve involved in IES VE meant that Green Building Studio was chosen to run the analysis.
3.2.2 Renewable technologies
As stated in section 3.1.3 it is states that a “reasonable “amount of energy used be sourced from
renewable technologies. (Dept. of Environment 2012) This section of the reports looks at the various
types of renewable technologies selected to be incorporated within the proposed retrofit of the
building. The technologies were selected with the aid of IES VE and Green Building Studio analysis.
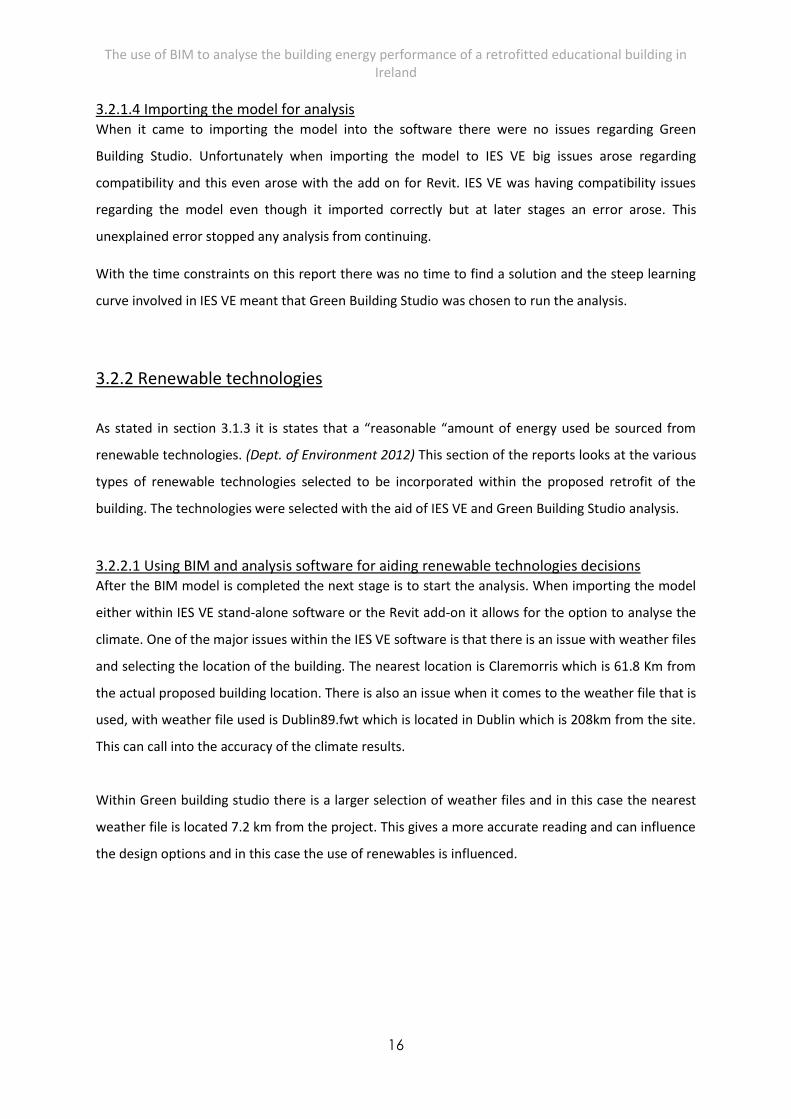
3.2.2.1 Using BIM and analysis software for aiding renewable technologies decisions After the BIM model is completed the next stage is to start the analysis. When importing the model
either within IES VE stand-alone software or the Revit add-on it allows for the option to analyse the
climate. One of the major issues within the IES VE software is that there is an issue with weather files
and selecting the location of the building. The nearest location is Claremorris which is 61.8 Km from
the actual proposed building location. There is also an issue when it comes to the weather file that is
used, with weather file used is Dublin89.fwt which is located in Dublin which is 208km from the site.
This can call into the accuracy of the climate results.
Within Green building studio there is a larger selection of weather files and in this case the nearest
weather file is located 7.2 km from the project. This gives a more accurate reading and can influence
the design options and in this case the use of renewables is influenced.
The use of BIM to analyse the building energy performance of a retrofitted educational building in Ireland
17
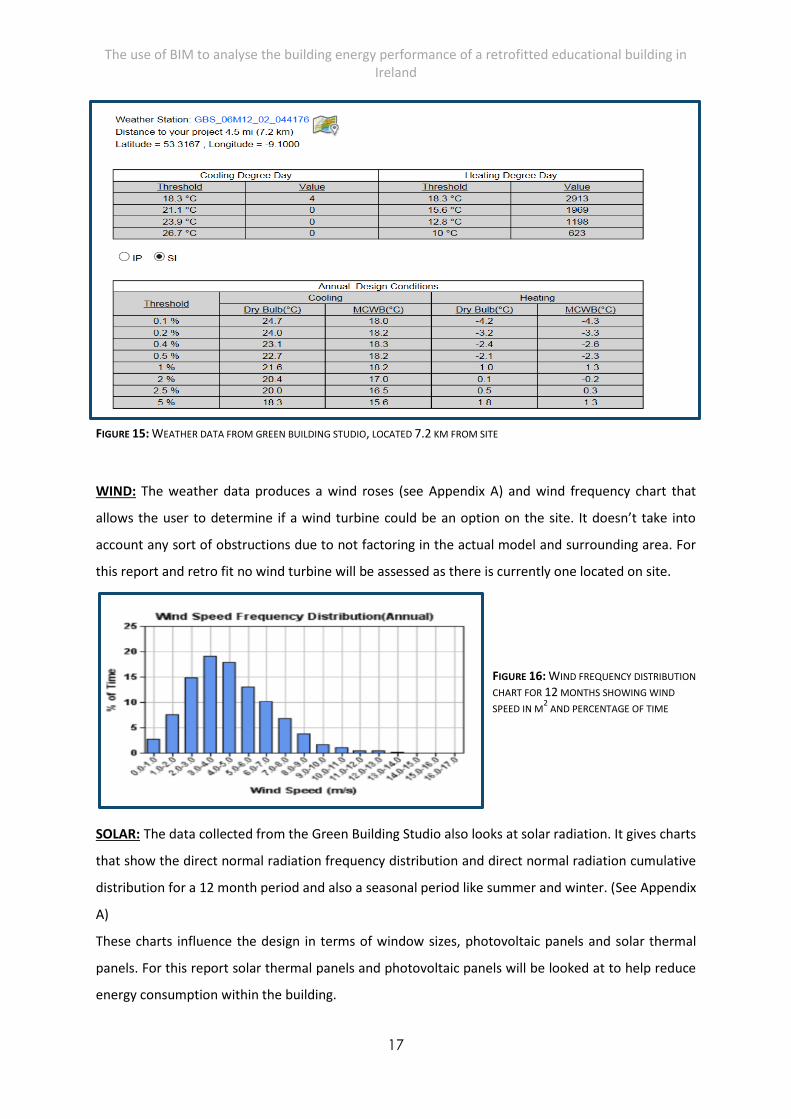
FIGURE 16: WIND FREQUENCY DISTRIBUTION
CHART FOR 12 MONTHS SHOWING WIND
SPEED IN M2 AND PERCENTAGE OF TIME
WIND: The weather data produces a wind roses (see Appendix A) and wind frequency chart that
allows the user to determine if a wind turbine could be an option on the site. It doesn’t take into
account any sort of obstructions due to not factoring in the actual model and surrounding area. For
this report and retro fit no wind turbine will be assessed as there is currently one located on site.
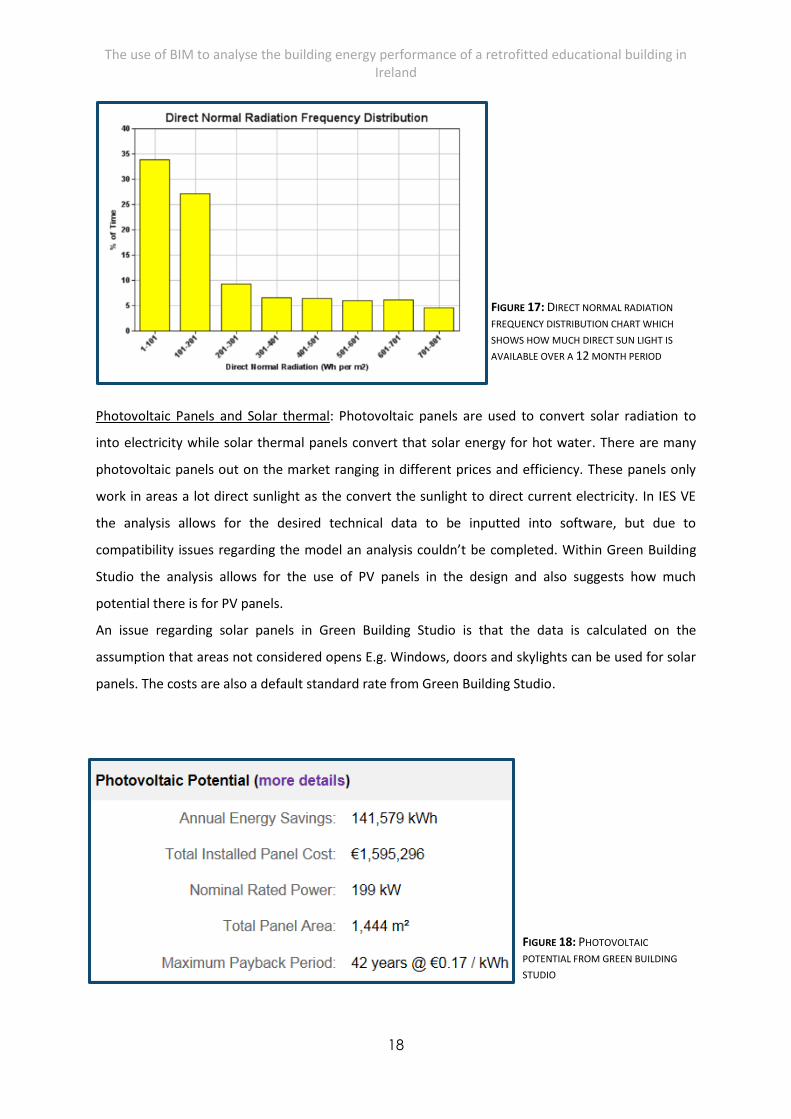
SOLAR: The data collected from the Green Building Studio also looks at solar radiation. It gives charts
that show the direct normal radiation frequency distribution and direct normal radiation cumulative
distribution for a 12 month period and also a seasonal period like summer and winter. (See Appendix
A)
These charts influence the design in terms of window sizes, photovoltaic panels and solar thermal
panels. For this report solar thermal panels and photovoltaic panels will be looked at to help reduce
energy consumption within the building.
FIGURE 15: WEATHER DATA FROM GREEN BUILDING STUDIO, LOCATED 7.2 KM FROM SITE
The use of BIM to analyse the building energy performance of a retrofitted educational building in Ireland
18
FIGURE 17: DIRECT NORMAL RADIATION
FREQUENCY DISTRIBUTION CHART WHICH
SHOWS HOW MUCH DIRECT SUN LIGHT IS
AVAILABLE OVER A 12 MONTH PERIOD
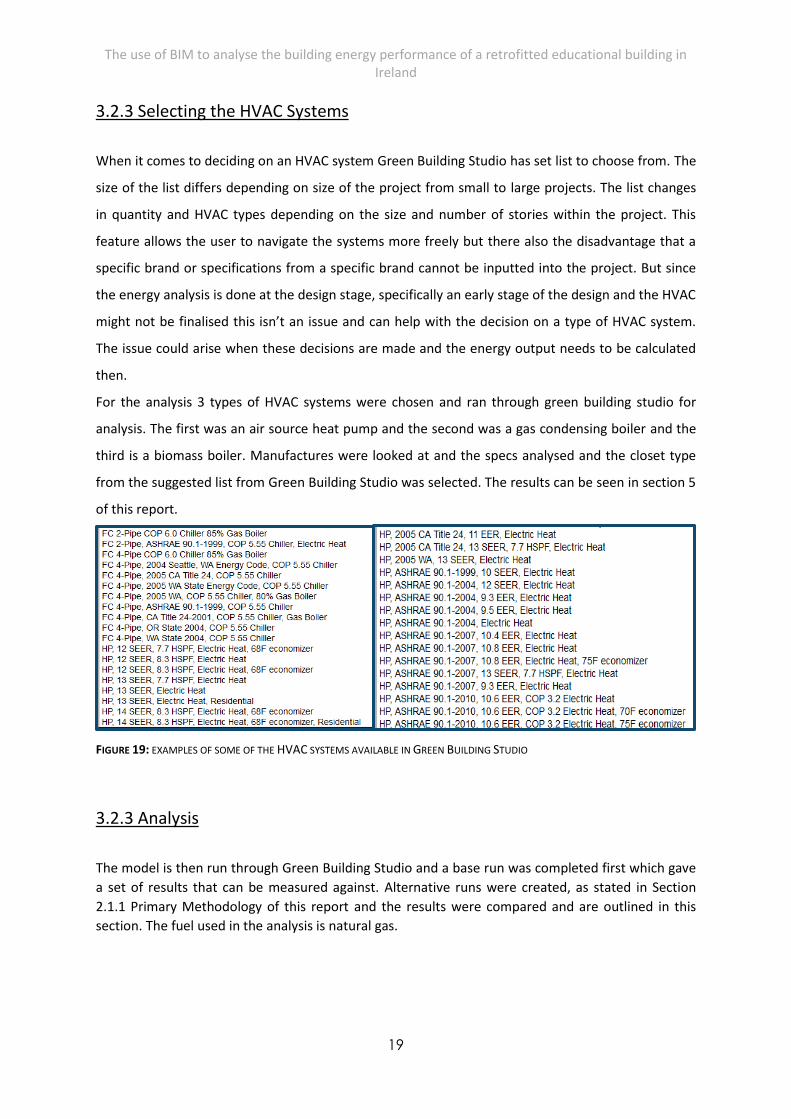
FIGURE 18: PHOTOVOLTAIC
POTENTIAL FROM GREEN BUILDING
STUDIO
Photovoltaic Panels and Solar thermal: Photovoltaic panels are used to convert solar radiation to
into electricity while solar thermal panels convert that solar energy for hot water. There are many
photovoltaic panels out on the market ranging in different prices and efficiency. These panels only
work in areas a lot direct sunlight as the convert the sunlight to direct current electricity. In IES VE
the analysis allows for the desired technical data to be inputted into software, but due to
compatibility issues regarding the model an analysis couldn’t be completed. Within Green Building
Studio the analysis allows for the use of PV panels in the design and also suggests how much
potential there is for PV panels.
An issue regarding solar panels in Green Building Studio is that the data is calculated on the
assumption that areas not considered opens E.g. Windows, doors and skylights can be used for solar
panels. The costs are also a default standard rate from Green Building Studio.
The use of BIM to analyse the building energy performance of a retrofitted educational building in Ireland
19
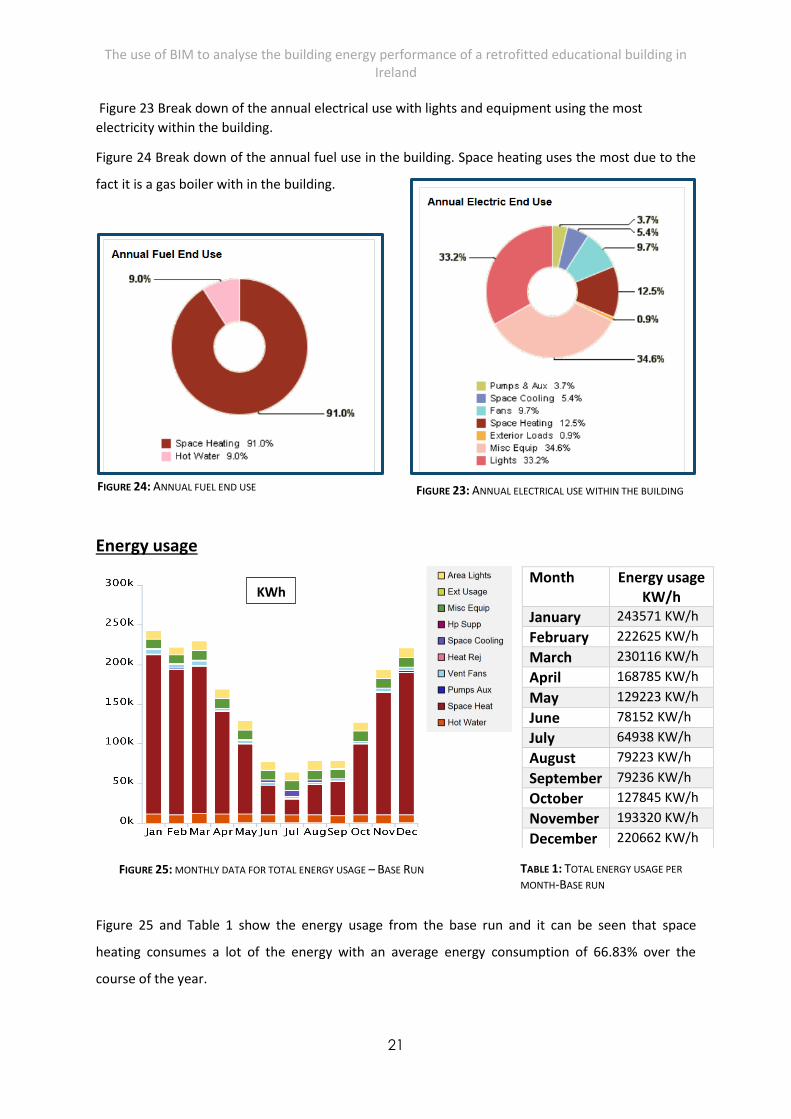
FIGURE 19: EXAMPLES OF SOME OF THE HVAC SYSTEMS AVAILABLE IN GREEN BUILDING STUDIO
3.2.3 Selecting the HVAC Systems
When it comes to deciding on an HVAC system Green Building Studio has set list to choose from. The
size of the list differs depending on size of the project from small to large projects. The list changes
in quantity and HVAC types depending on the size and number of stories within the project. This
feature allows the user to navigate the systems more freely but there also the disadvantage that a
specific brand or specifications from a specific brand cannot be inputted into the project. But since
the energy analysis is done at the design stage, specifically an early stage of the design and the HVAC
might not be finalised this isn’t an issue and can help with the decision on a type of HVAC system.
The issue could arise when these decisions are made and the energy output needs to be calculated
then.
For the analysis 3 types of HVAC systems were chosen and ran through green building studio for
analysis. The first was an air source heat pump and the second was a gas condensing boiler and the
third is a biomass boiler. Manufactures were looked at and the specs analysed and the closet type
from the suggested list from Green Building Studio was selected. The results can be seen in section 5
of this report.
3.2.3 Analysis
The model is then run through Green Building Studio and a base run was completed first which gave
a set of results that can be measured against. Alternative runs were created, as stated in Section
2.1.1 Primary Methodology of this report and the results were compared and are outlined in this
section. The fuel used in the analysis is natural gas.

The use of BIM to analyse the building energy performance of a retrofitted educational building in Ireland
20
FIGURE 21: CARBON NEUTRAL POTENTIAL
FIGURE 20: ENERGY CARBON AND COST SUMMARY OF
BASE RUN
FIGURE 22: ELECTRICAL POWER SOURCES
3.2.3.1 Base Run results
The base model with the upgraded fabric was run through Green Building Studio and the following
results were achieved.
Figure 20 shows a breakdown and a summary of
the carbon emission per year. It also simplifies the
results by comparing the emissions to SUV
equivalent. This feature is allows for people that
aren’t familiar with carbon emissions to grasp how
much CO2 are produced by a building each year.
The areas highlighted in red are the main areas that
need to be reduced to help reduce the buildings
energy usage and head towards NZEB targets
Figure 21 looks at the carbon neutral potential that
can be achieved by looking at design alternatives.
Figure 22 shows the electricity sources that are
available in the region. This looks at the potential
amount of power electrical that can be sourced. This
can be sourced from fossil fuel burning power plants
and it also looks at the potential for renewables.
The use of BIM to analyse the building energy performance of a retrofitted educational building in Ireland
21
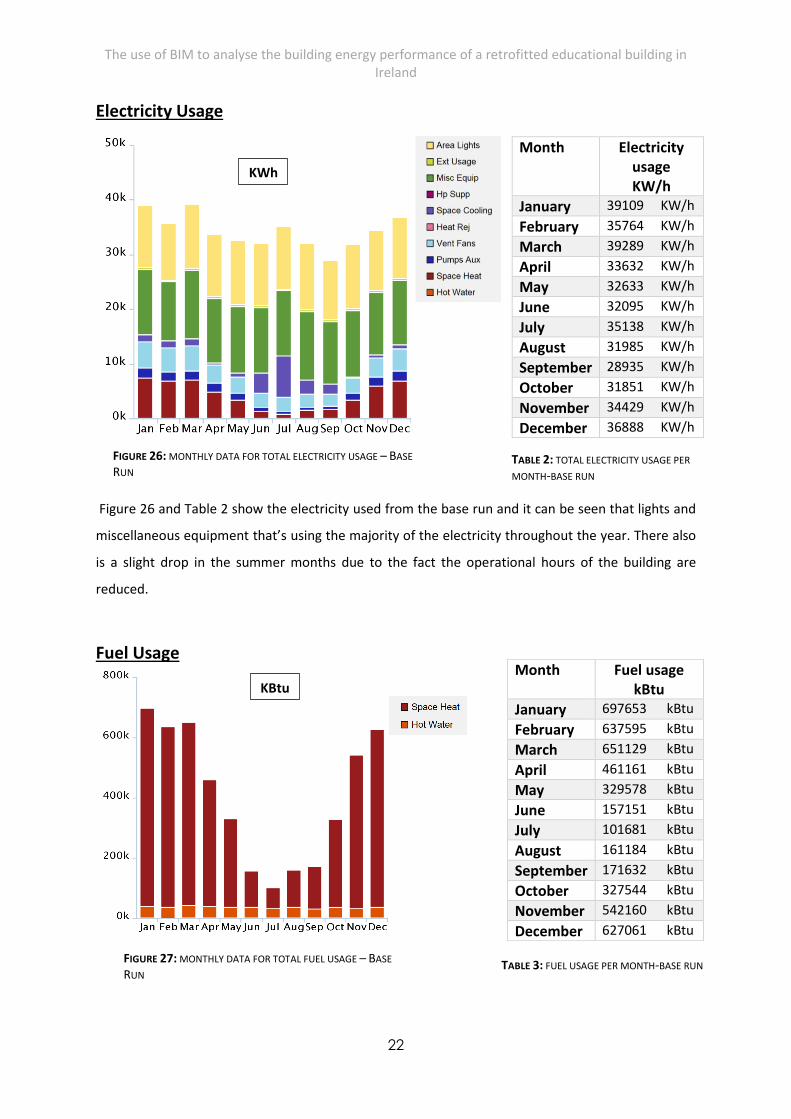
FIGURE 23: ANNUAL ELECTRICAL USE WITHIN THE BUILDING FIGURE 24: ANNUAL FUEL END USE
FIGURE 25: MONTHLY DATA FOR TOTAL ENERGY USAGE – BASE RUN
Figure 23 Break down of the annual electrical use with lights and equipment using the most
electricity within the building.
Figure 24 Break down of the annual fuel use in the building. Space heating uses the most due to the
fact it is a gas boiler with in the building.
Energy usage
Figure 25 and Table 1 show the energy usage from the base run and it can be seen that space
heating consumes a lot of the energy with an average energy consumption of 66.83% over the
course of the year.
Month Energy usage KW/h
January 243571 KW/h February 222625 KW/h March 230116 KW/h
April 168785 KW/h
May 129223 KW/h
June 78152 KW/h July 64938 KW/h August 79223 KW/h September 79236 KW/h October 127845 KW/h November 193320 KW/h December 220662 KW/h
TABLE 1: TOTAL ENERGY USAGE PER
MONTH-BASE RUN
KWh
The use of BIM to analyse the building energy performance of a retrofitted educational building in Ireland
22
FIGURE 27: MONTHLY DATA FOR TOTAL FUEL USAGE – BASE
RUN
KBtu
FIGURE 26: MONTHLY DATA FOR TOTAL ELECTRICITY USAGE – BASE
RUN
Electricity Usage
Figure 26 and Table 2 show the electricity used from the base run and it can be seen that lights and
miscellaneous equipment that’s using the majority of the electricity throughout the year. There also
is a slight drop in the summer months due to the fact the operational hours of the building are
reduced.
Fuel Usage
Month Electricity usage KW/h
January 39109 KW/h February 35764 KW/h March 39289 KW/h
April 33632 KW/h
May 32633 KW/h
June 32095 KW/h July 35138 KW/h August 31985 KW/h September 28935 KW/h October 31851 KW/h November 34429 KW/h December 36888 KW/h
TABLE 2: TOTAL ELECTRICITY USAGE PER
MONTH-BASE RUN
Month Fuel usage kBtu
January 697653 kBtu February 637595 kBtu March 651129 kBtu
April 461161 kBtu
May 329578 kBtu
June 157151 kBtu July 101681 kBtu August 161184 kBtu September 171632 kBtu October 327544 kBtu November 542160 kBtu December 627061 kBtu
TABLE 3: FUEL USAGE PER MONTH-BASE RUN
KWh
KBtu
The use of BIM to analyse the building energy performance of a retrofitted educational building in Ireland
23
FIGURE 29: CARBON NEUTRAL POTENTIAL USING AN AIR
SOURCE HEAT PUMP
FIGURE 28: ENERGY CARBON AND COST SUMMARY USING
AN AIR SOURCE HEAT PUMP
Figure 27 and Table 3 show the fuel usage for the base run. Again it is clearly seen that the majority
of the fuel is being used for space heating, on average of 86.83% used for heating and the rest for
hot water. The winter months using up to 3 times as much fuel and there is a significant fall in fuel
usage during the summer months for space heating.
Costs
The cost of the energy, electricity and fuel usage can be seen in Appendix B. These costs are based
off the default costs in Green Building Studio and aren’t an accurate reflection on true cost of the
energy used in the building. The default costs don’t have to be used if the cost of electricity and fuel
per unit is known. These values can be entered at the start of project but cannot be changed after
that.
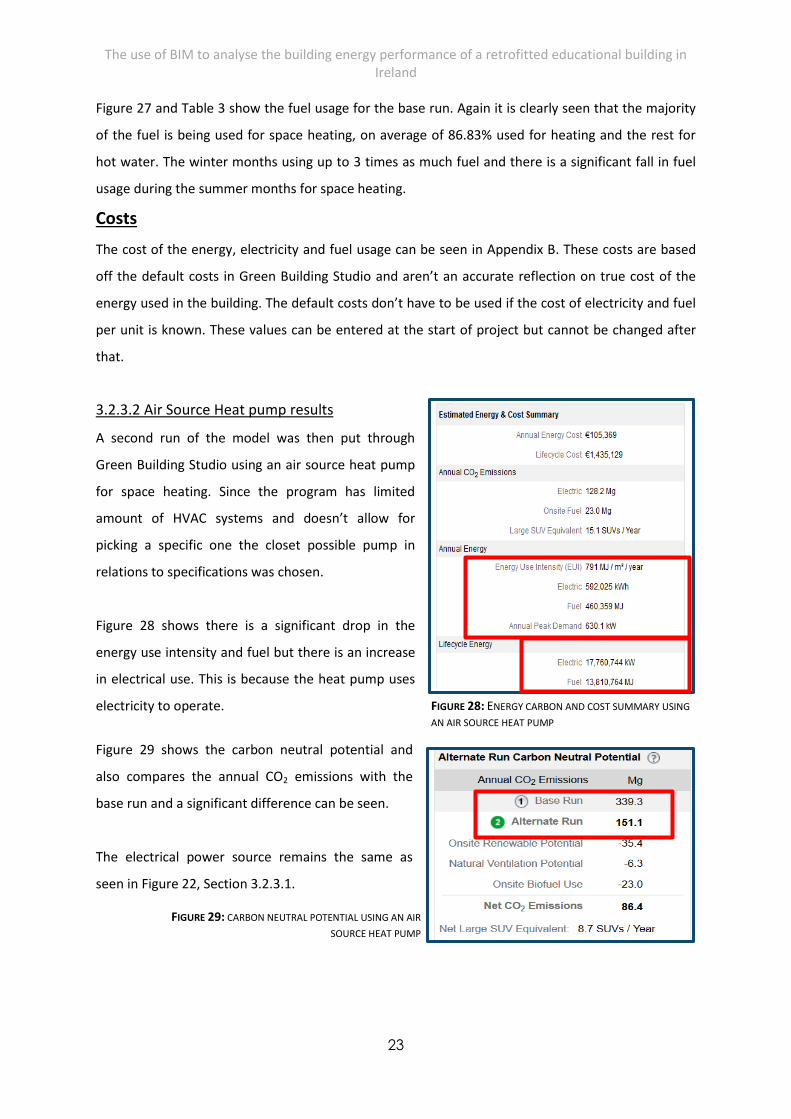
3.2.3.2 Air Source Heat pump results
A second run of the model was then put through
Green Building Studio using an air source heat pump
for space heating. Since the program has limited
amount of HVAC systems and doesn’t allow for
picking a specific one the closet possible pump in
relations to specifications was chosen.
Figure 28 shows there is a significant drop in the
energy use intensity and fuel but there is an increase
in electrical use. This is because the heat pump uses
electricity to operate.
Figure 29 shows the carbon neutral potential and
also compares the annual CO2 emissions with the
base run and a significant difference can be seen.
The electrical power source remains the same as
seen in Figure 22, Section 3.2.3.1.

The use of BIM to analyse the building energy performance of a retrofitted educational building in Ireland
24
FIGURE 32: MONTHLY DATA FOR TOTAL ENERGY USAGE – AIR SOURCE
HEAT PUMP
FIGURE 31: ANNUAL ELECTRICAL USE WITHIN THE BUILDING
USING AN AIR SOURCE HEAT PUMP
Figure 31 shows the annual electrical usage with an air source heat pump. It can be seen that 23.7%
of the total electrical use is now being used by space heating as compared to 12.5% being used in
the base run. The fuel usage drastically changes
with the air source heat pump which can be seen
in figure 30 with 100% of the fuel usage being
used for hot water rather than space heating.
Energy usage
Month Energy usage KW/h
January 85013 KW/h February 76458 KW/h March 82944 KW/h
April 58528 KW/h
May 52082 KW/h
June 46518 KW/h July 45517 KW/h August 46564 KW/h September 42761 KW/h October 51842 KW/h November 60751 KW/h December 70925 KW/h
TABLE 4: MONTHLY USAGE FOR ENERGY –
AIR SOURCE HEAT PUMP
KWh
FIGURE 30: ANNUAL FUEL END USE USING AN AIR SOURCE
HEAT PUMP
The use of BIM to analyse the building energy performance of a retrofitted educational building in Ireland
25
FIGURE 34: MONTHLY DATA FOR TOTAL FUEL USAGE – AIR SOURCE
HEAT PUMP
FIGURE 33: MONTHLY DATA FOR TOTAL ELECTRICITY USAGE – AIR
SOURCE HEAT PUMP
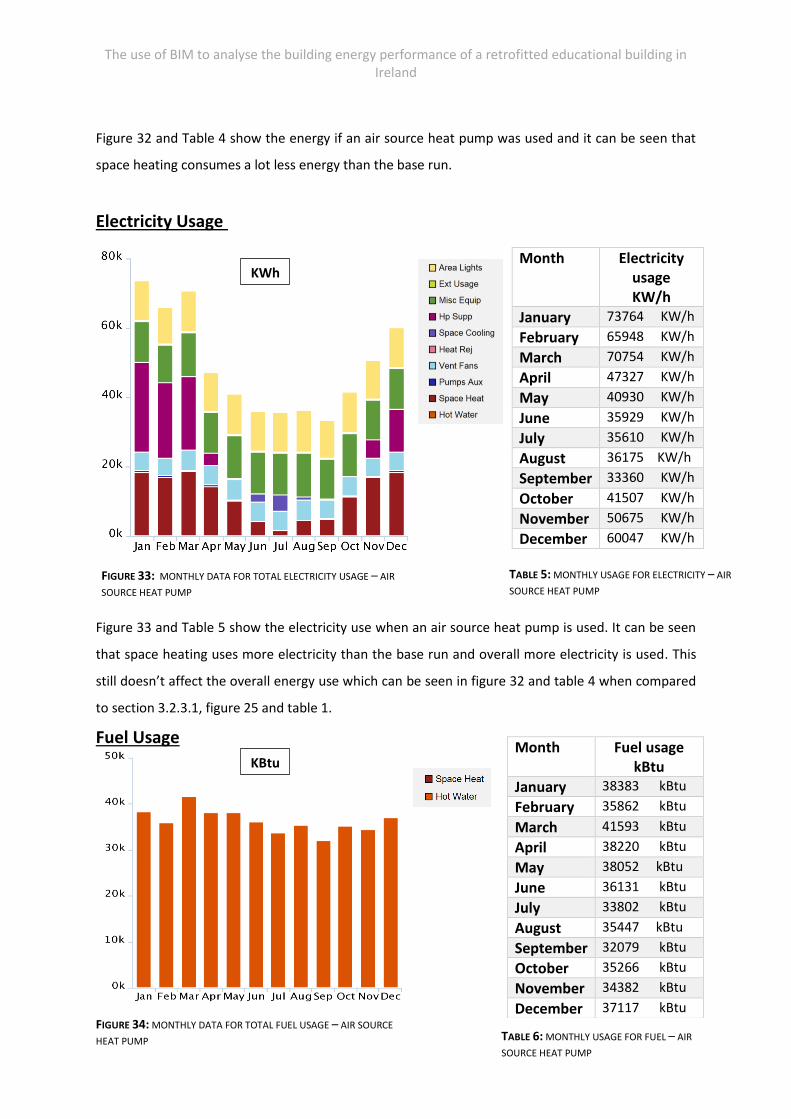
Figure 32 and Table 4 show the energy if an air source heat pump was used and it can be seen that
space heating consumes a lot less energy than the base run.
Electricity Usage
Figure 33 and Table 5 show the electricity use when an air source heat pump is used. It can be seen
that space heating uses more electricity than the base run and overall more electricity is used. This
still doesn’t affect the overall energy use which can be seen in figure 32 and table 4 when compared
to section 3.2.3.1, figure 25 and table 1.
Fuel Usage
Month Electricity usage KW/h
January 73764 KW/h February 65948 KW/h March 70754 KW/h
April 47327 KW/h
May 40930 KW/h
June 35929 KW/h July 35610 KW/h August 36175 KW/h September 33360 KW/h October 41507 KW/h November 50675 KW/h December 60047 KW/h
TABLE 5: MONTHLY USAGE FOR ELECTRICITY – AIR
SOURCE HEAT PUMP
Month Fuel usage kBtu
January 38383 kBtu February 35862 kBtu March 41593 kBtu
April 38220 kBtu
May 38052 kBtu
June 36131 kBtu July 33802 kBtu August 35447 kBtu September 32079 kBtu October 35266 kBtu November 34382 kBtu December 37117 kBtu
TABLE 6: MONTHLY USAGE FOR FUEL – AIR
SOURCE HEAT PUMP
KBtu
KWh
The use of BIM to analyse the building energy performance of a retrofitted educational building in Ireland
26
FIGURE 35: ENERGY CARBON AND COST SUMMARY USING A
GAS CONDENSING BOILER
FIGURE 36: CARBON NEUTRAL POTENTIAL USING A GAS
CONDENSING BOILER
Figure 34 and Table 6 show the fuel usage for an air source heat pump. This run clearly shows that
the all of the fuel is being used for hot water. The fuel usage is fairly consistent throughout the year.
There is also a significant drop in fuel usage when compared to the base run and this is seen when
the figures are compared to section 3.2.3.1 figure 37 and table 3.
Costs
The cost of the energy, electricity and fuel usage can be seen in Appendix E.
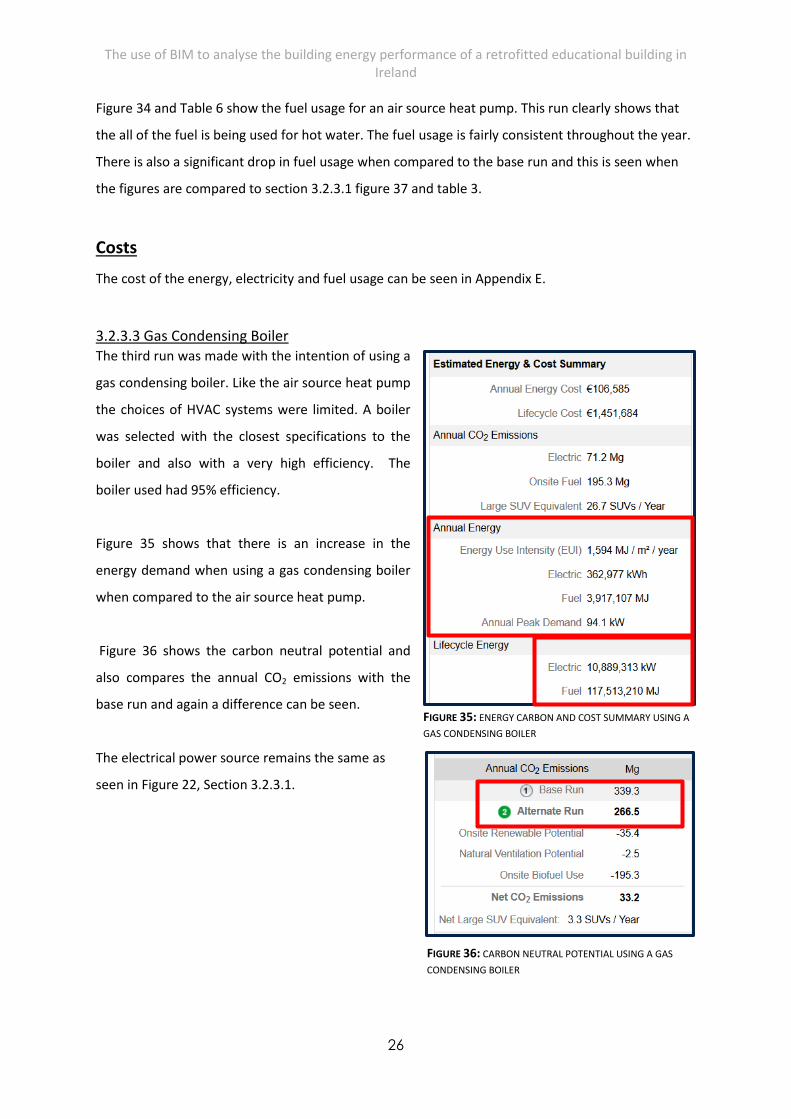
3.2.3.3 Gas Condensing Boiler The third run was made with the intention of using a
gas condensing boiler. Like the air source heat pump
the choices of HVAC systems were limited. A boiler
was selected with the closest specifications to the
boiler and also with a very high efficiency. The
boiler used had 95% efficiency.
Figure 35 shows that there is an increase in the
energy demand when using a gas condensing boiler
when compared to the air source heat pump.
Figure 36 shows the carbon neutral potential and
also compares the annual CO2 emissions with the
base run and again a difference can be seen.
The electrical power source remains the same as
seen in Figure 22, Section 3.2.3.1.
The use of BIM to analyse the building energy performance of a retrofitted educational building in Ireland
27
FIGURE 38: ANNUAL ELECTRICAL USE WITHIN THE BUILDING
USING A GAS CONDENSING BOILER
FIGURE 39: MONTHLY DATA FOR TOTAL ENERGY USAGE – GAS
CONDENSING BOILER
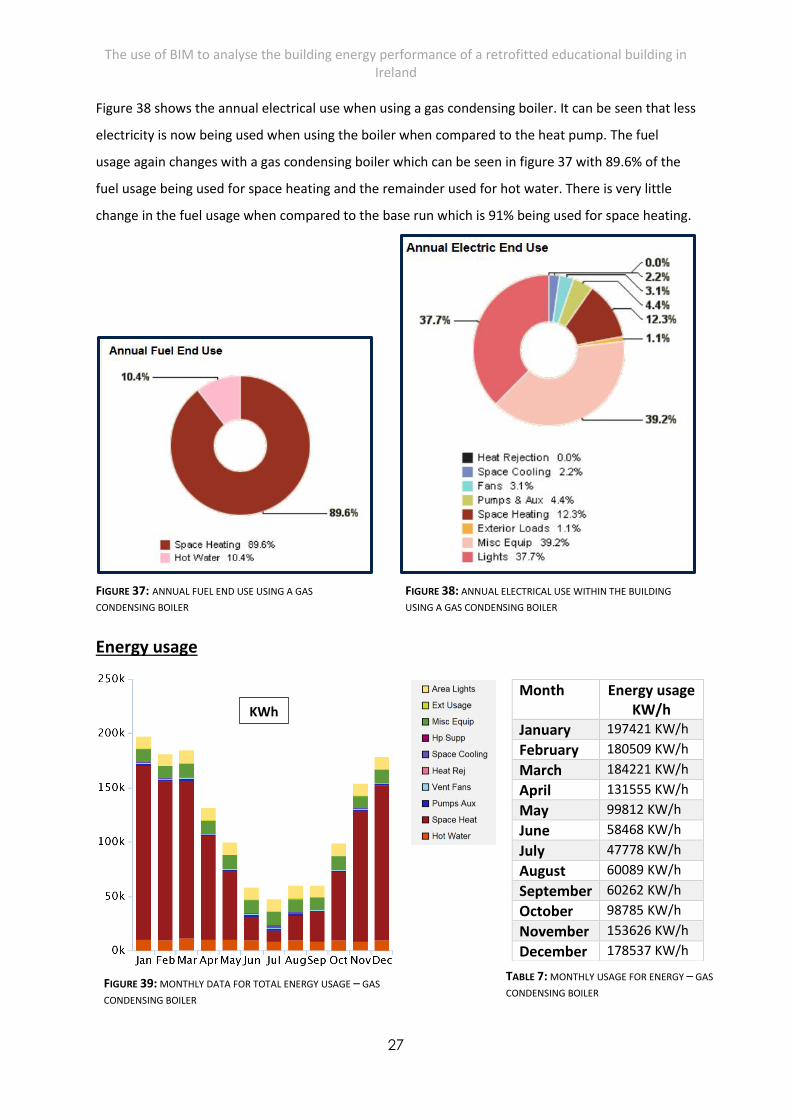
Figure 38 shows the annual electrical use when using a gas condensing boiler. It can be seen that less
electricity is now being used when using the boiler when compared to the heat pump. The fuel
usage again changes with a gas condensing boiler which can be seen in figure 37 with 89.6% of the
fuel usage being used for space heating and the remainder used for hot water. There is very little
change in the fuel usage when compared to the base run which is 91% being used for space heating.
Energy usage
Month Energy usage KW/h
January 197421 KW/h February 180509 KW/h March 184221 KW/h
April 131555 KW/h
May 99812 KW/h
June 58468 KW/h July 47778 KW/h August 60089 KW/h September 60262 KW/h October 98785 KW/h November 153626 KW/h December 178537 KW/h
TABLE 7: MONTHLY USAGE FOR ENERGY – GAS
CONDENSING BOILER
KWh
FIGURE 37: ANNUAL FUEL END USE USING A GAS
CONDENSING BOILER
The use of BIM to analyse the building energy performance of a retrofitted educational building in Ireland
28
FIGURE 40: MONTHLY DATA FOR TOTAL ELECTRICITY USAGE – GAS
CONDENSING BOILER
FIGURE 41: MONTHLY DATA FOR TOTAL FUEL USAGE – GAS
CONDENSING BOILER
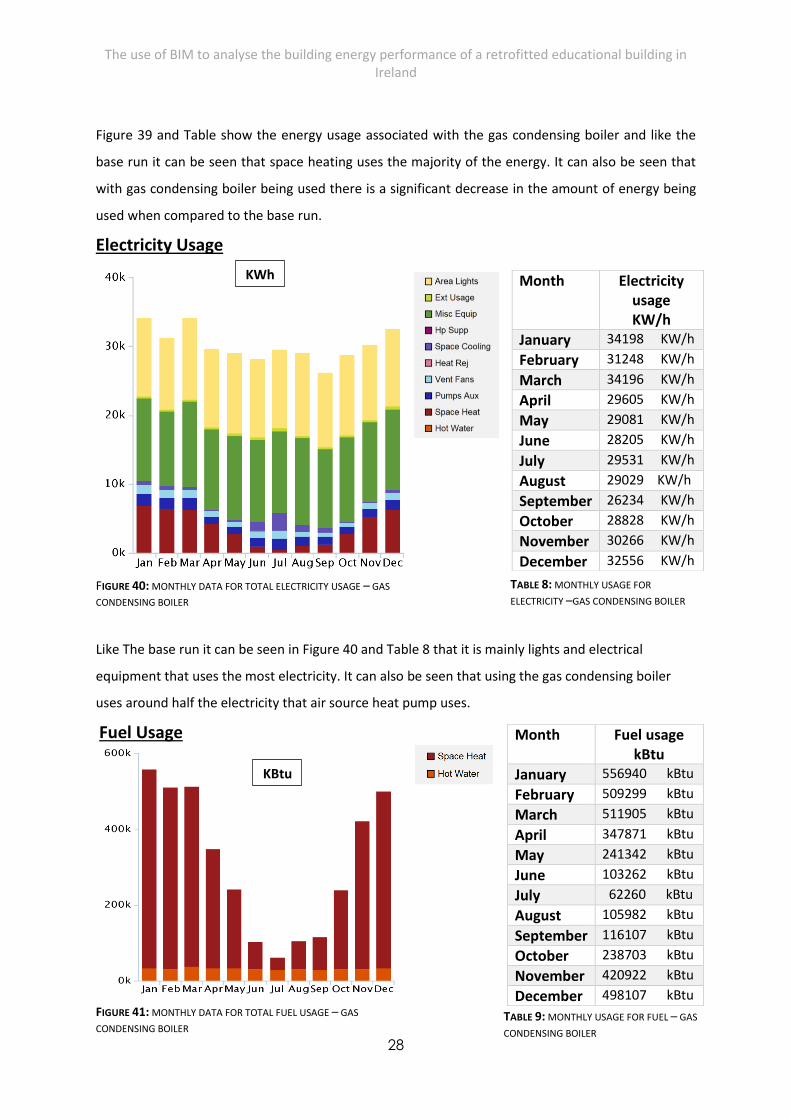
Figure 39 and Table show the energy usage associated with the gas condensing boiler and like the
base run it can be seen that space heating uses the majority of the energy. It can also be seen that
with gas condensing boiler being used there is a significant decrease in the amount of energy being
used when compared to the base run.
Electricity Usage
Like The base run it can be seen in Figure 40 and Table 8 that it is mainly lights and electrical
equipment that uses the most electricity. It can also be seen that using the gas condensing boiler
uses around half the electricity that air source heat pump uses.
Fuel Usage
Month Electricity usage KW/h
January 34198 KW/h February 31248 KW/h March 34196 KW/h
April 29605 KW/h
May 29081 KW/h
June 28205 KW/h July 29531 KW/h August 29029 KW/h September 26234 KW/h October 28828 KW/h November 30266 KW/h December 32556 KW/h
TABLE 8: MONTHLY USAGE FOR
ELECTRICITY –GAS CONDENSING BOILER
Month Fuel usage kBtu
January 556940 kBtu February 509299 kBtu March 511905 kBtu
April 347871 kBtu
May 241342 kBtu
June 103262 kBtu July 62260 kBtu August 105982 kBtu September 116107 kBtu October 238703 kBtu November 420922 kBtu December 498107 kBtu
TABLE 9: MONTHLY USAGE FOR FUEL – GAS
CONDENSING BOILER
KWh
KBtu
The use of BIM to analyse the building energy performance of a retrofitted educational building in Ireland
29
Figure 41 and Table 9 show the fuel usage within the building and it is seen that the majority of the
fuel is being used for space heating, much like the base run. The higher efficiency of the boiler being
used means that less fuel is being used over all when compared to the bas run results shown in
Figure 27 and Table 3.
Costs
The cost of the energy, electricity and fuel usage can be seen in Appendix E.
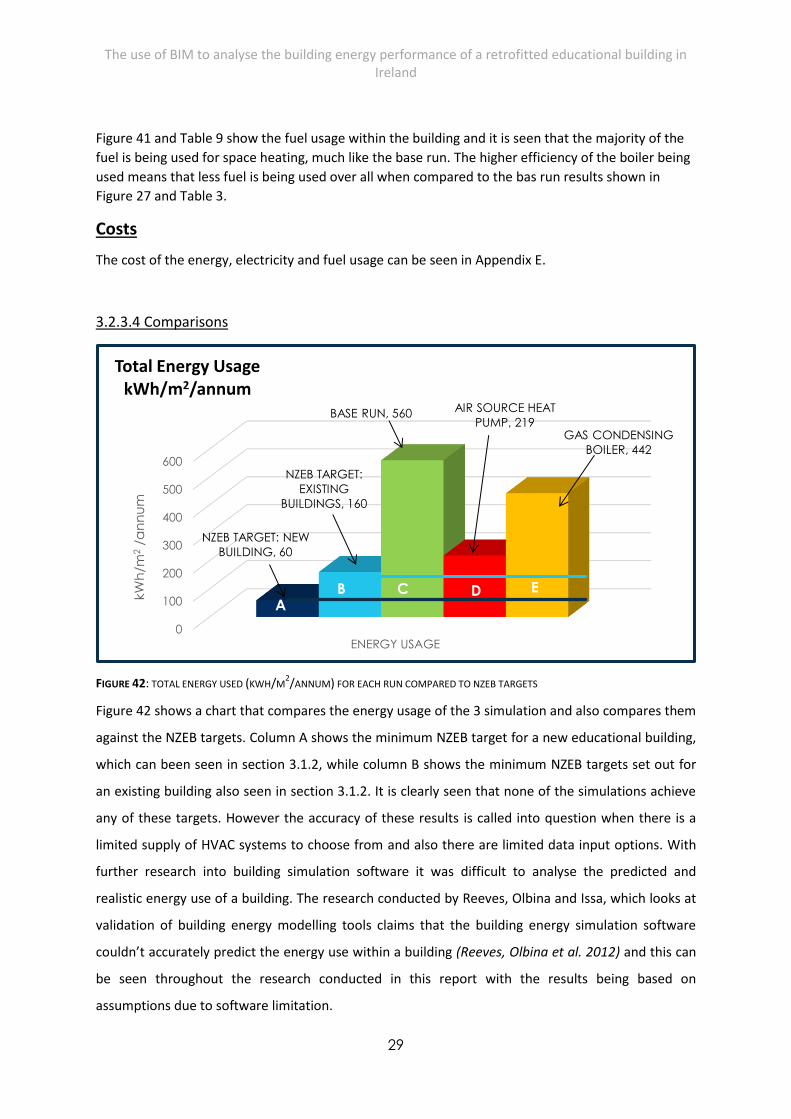
3.2.3.4 Comparisons
FIGURE 42: TOTAL ENERGY USED (KWH/M2/ANNUM) FOR EACH RUN COMPARED TO NZEB TARGETS
Figure 42 shows a chart that compares the energy usage of the 3 simulation and also compares them
against the NZEB targets. Column A shows the minimum NZEB target for a new educational building,
which can been seen in section 3.1.2, while column B shows the minimum NZEB targets set out for
an existing building also seen in section 3.1.2. It is clearly seen that none of the simulations achieve
any of these targets. However the accuracy of these results is called into question when there is a
limited supply of HVAC systems to choose from and also there are limited data input options. With
further research into building simulation software it was difficult to analyse the predicted and
realistic energy use of a building. The research conducted by Reeves, Olbina and Issa, which looks at
validation of building energy modelling tools claims that the building energy simulation software
couldn’t accurately predict the energy use within a building (Reeves, Olbina et al. 2012) and this can
be seen throughout the research conducted in this report with the results being based on
assumptions due to software limitation.
0
100
200
300
400
500
600
ENERGY USAGE
NZEB TARGET: NEW
BUILDING, 60
NZEB TARGET:
EXISTING
BUILDINGS, 160
BASE RUN, 560 AIR SOURCE HEAT
PUMP, 219 GAS CONDENSING
BOILER, 442
kW
h/m
2 /
an
nu
m
Total Energy Usage kWh/m2/annum
D A
NNBAG
01000
kT
B
NNBAG
01000
kT
C
NNBAG
01000
kT
E
NNBAG
01000
kT
The use of BIM to analyse the building energy performance of a retrofitted educational building in Ireland
30
SECTION 4.0 Results
This research conducted into this area gave unexpected results. It was to be expected at the start of
this report that using BIM and building performance simulation software would be a quick and
accurate way to help a designer analyse the energy usage within a building. It was also expected to
show how this type of software and new innovations in building design can help buildings reach the
targets set out in the Technical Guidance Documents Part L 2011 and NZEB targets that are set for
2018, but none of the simulations meet the minimum targets set out. It is clearly seen that in Figure
42 that an Air Source Heat Pump uses less energy of the 3 simulations. While a gas condensing boiler
uses less energy when compared to the standard boiler used in the base run, but as stated above
none reach the desired targets.
The accuracy of these results can be questioned since Green Building Studio uses assumptions when
looking photovoltaic potential, occupancy of the building, HVAC systems etc. The software doesn’t
allow for more precise data to be inputted, giving a more accurate representation of energy use
within the building. Knight, Stravoravdis & Lasvaux states that the results from an analysis using
building energy performance software can prove to be inaccurate mainly due to the data input and
in the future there needs to be a greater accuracy in the data used by the software and allow for
more accurate input to the simulation. (Knight, Stravoravdis et al. 2007)
SECTION 5.0 Conclusions and Recommendations
5.1 Conclusion
There are a number of software options available all with different levels of difficulty to use. From
the research acquired from the secondary research, IES VE software would have produced more
accurate results but that software has a very steep learning curve and require training to use to
produce accurate results. Another major issue was the compatibility with the Revit model with many
unknown problems arising when importing the model. However even IES VE wouldn’t of produced
an accurate representation of the energy use in the building. (Reeves, Olbina et al. 2012)
The use of BIM to analyse the building energy performance of a retrofitted educational building in Ireland
31
Autodesk Green Building Studio was the alternative option but again there was a learning curve
involved with it. The software had many limitations mainly being the limited HVAC systems that can
be used and the use of assumptions when it came to the PV potential and building occupancy.
These limitations didn’t allow for an accurate representation of the energy use within the building
and the results didn’t reach the desired NZEB targets. Further research into this area showed that it
is very difficult to accurately predict the energy use of a building using simulation software and that
more accurate data will be required from the software to produce more accurate results. (Knight,
Stravoravdis et al. 2007)
In conclusion the area of building energy performance simulation is a specialised area and should be
done by someone who specialises in this field. There is a need for training in the software along with
a good knowledge of HVAC systems, renewable technologies and building technologies. For a
designer not trained in this area the results should be used as a guide and help with design decisions
at an early stage and help achieve the NZEB target for the building.
5.2 Recommendations
More research into this area is recommended and the results should be compared to hand
calculations to test the accuracy of the results. Before deciding on which software option to use the
user needs to have an understanding and training using the software and an understanding of
building services along with renewable technologies and building technologies.
The use of BIM to analyse the building energy performance of a retrofitted educational building in Ireland
32
APPENDICES
Appendix A: Plagiarism Declaration
Galway Mayo Institute of Technology
B.Sc. (Honours) in Architectural Technology
PLAGIARISM- DECLARATION COVER SHEET
PLAGIARISM
Plagiarism consists of a person presenting another person’s ideas, findings or work as one’s own by copying or
reproducing the work without due acknowledgement of the source. Plagiarism is the theft of intellectual
property. The Institute regards plagiarism as a very serious offence. At the very least, it is a misuse of
academic conventions or the result of poor referencing practice. Where it is deliberate and systematic,
plagiarism is cheating.
Plagiarism can take several forms, examples of which are given below:
a. Presenting substantial extracts from books, journal articles, these and other published or unpublished work
(e.g. working papers, seminars and conference papers, internal reports, computer software, lecture notes
or tapes, and other students’ work) without clearly indicating the source of the material;
b. Using very close paraphrasing of sentences or whole paragraphs without due acknowledgement in the
form of reference to the original work;
c. Quoting directly from a source and failing to insert quotation marks around the quoted passages. In such
cases it is not adequate merely to acknowledge the source;
d. Copying essays or essay extracts or buying existing essays from Internet websites or other sources;
e. Closely replicating the structure of someone else’s argument without clear reference to the source.
The Institute is committed to detecting all cases of student plagiarism. All cases will be dealt with in
accordance with the Institute’s Examination Regulations:
Penalties for plagiarism include:
a. Awarding lower marks or no marks for the Technical Report;
c. Awarding a lower class of degree or other academic award;
d. Excluding the student from the award of a degree or other academic award, which may be either
permanent or for a stated period.
PLAGIARISM DECLARATION
By signing this declaration, you are confirming in writing that the work you are submitting is original and
does not contain any plagiarised material.
I confirm that this Technical Report is my own work, and that the work of other persons has been fully
acknowledged.
Your signature: . . . . . . . . . . . . . . . . . . . . . . . . . . . . . . . . . .. . . . . Date: ………………………..
Name: Mark Thornton
Technical Report Title: The use of BIM to analyse the building energy performance of a retrofitted
educational building in Ireland (Building and Civil Engineering Department – GMIT)
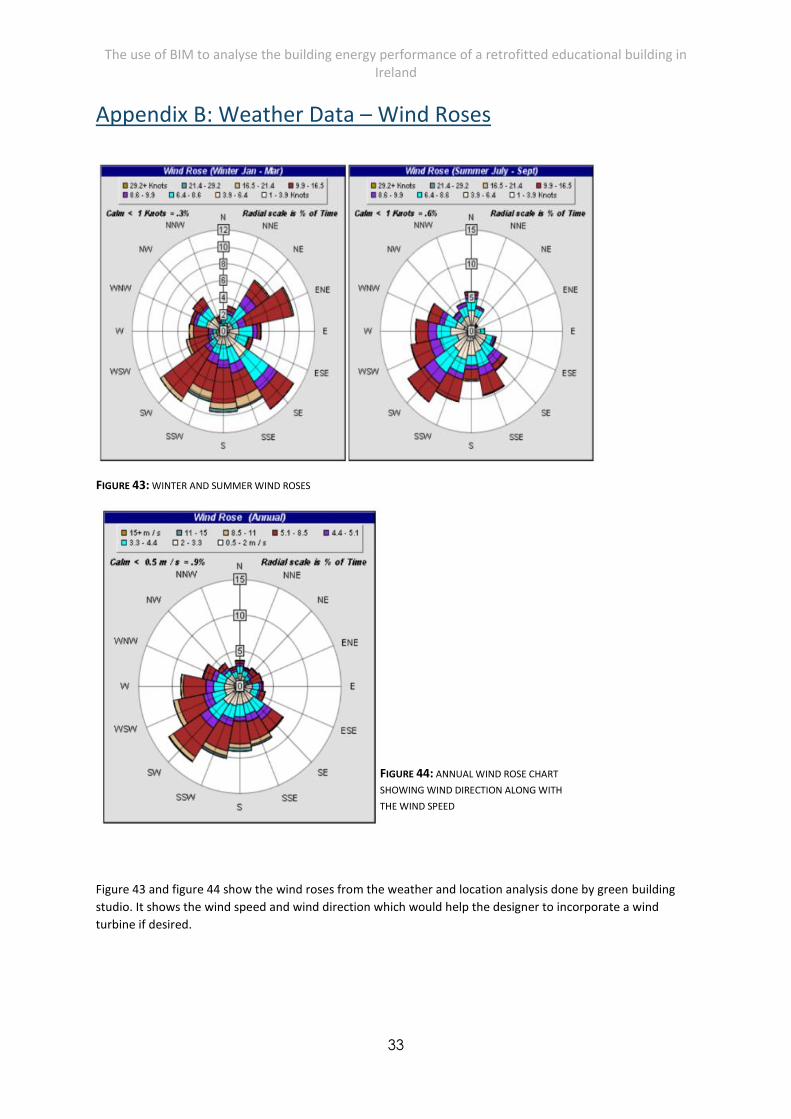
The use of BIM to analyse the building energy performance of a retrofitted educational building in Ireland
33
Appendix B: Weather Data – Wind Roses
Figure 43 and figure 44 show the wind roses from the weather and location analysis done by green building
studio. It shows the wind speed and wind direction which would help the designer to incorporate a wind
turbine if desired.
FIGURE 43: WINTER AND SUMMER WIND ROSES
FIGURE 44: ANNUAL WIND ROSE CHART
SHOWING WIND DIRECTION ALONG WITH
THE WIND SPEED
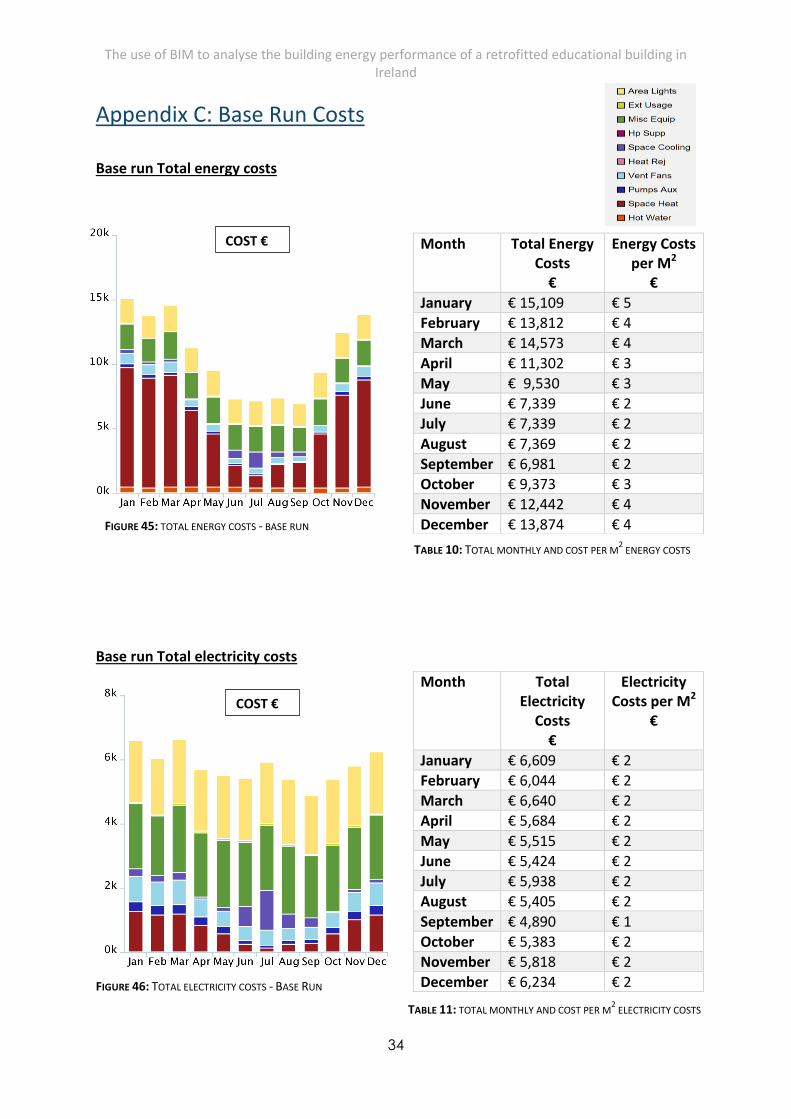
The use of BIM to analyse the building energy performance of a retrofitted educational building in Ireland
34
Appendix C: Base Run Costs
Base run Total energy costs
Base run Total electricity costs
Month Total Energy Costs
€
Energy Costs per M2
€
January € 15,109 € 5
February € 13,812 € 4
March € 14,573 € 4
April € 11,302 € 3
May € 9,530 € 3
June € 7,339 € 2
July € 7,339 € 2
August € 7,369 € 2
September € 6,981 € 2
October € 9,373 € 3
November € 12,442 € 4
December € 13,874 € 4
TABLE 10: TOTAL MONTHLY AND COST PER M2 ENERGY COSTS
TABLE 11: TOTAL MONTHLY AND COST PER M2 ELECTRICITY COSTS
Month Total Electricity
Costs €
Electricity Costs per M2
€
January € 6,609 € 2
February € 6,044 € 2
March € 6,640 € 2
April € 5,684 € 2
May € 5,515 € 2
June € 5,424 € 2
July € 5,938 € 2
August € 5,405 € 2
September € 4,890 € 1
October € 5,383 € 2
November € 5,818 € 2
December € 6,234 € 2
COST €
COST €
FIGURE 45: TOTAL ENERGY COSTS - BASE RUN
FIGURE 46: TOTAL ELECTRICITY COSTS - BASE RUN
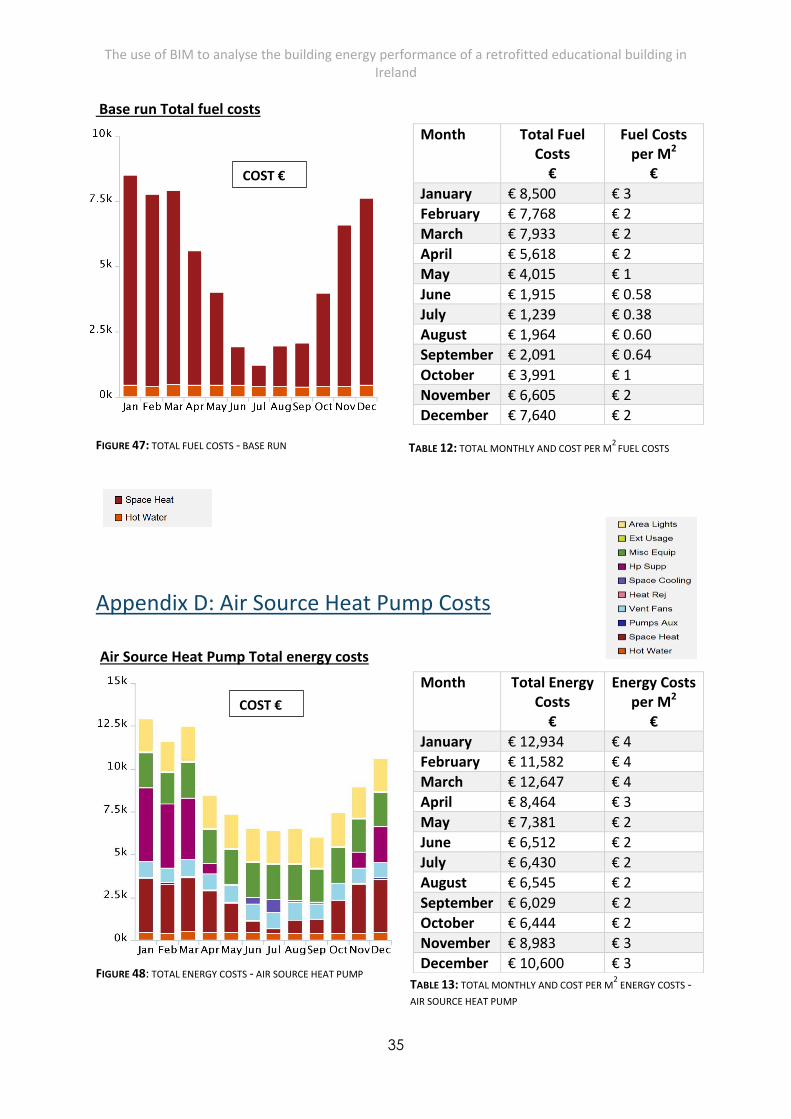
The use of BIM to analyse the building energy performance of a retrofitted educational building in Ireland
35
Base run Total fuel costs
Appendix D: Air Source Heat Pump Costs
Air Source Heat Pump Total energy costs
Month Total Fuel Costs
€
Fuel Costs per M2
€
January € 8,500 € 3
February € 7,768 € 2
March € 7,933 € 2
April € 5,618 € 2
May € 4,015 € 1
June € 1,915 € 0.58
July € 1,239 € 0.38
August € 1,964 € 0.60
September € 2,091 € 0.64
October € 3,991 € 1
November € 6,605 € 2
December € 7,640 € 2
TABLE 12: TOTAL MONTHLY AND COST PER M2
FUEL COSTS
Month Total Energy Costs
€
Energy Costs per M2
€
January € 12,934 € 4
February € 11,582 € 4
March € 12,647 € 4
April € 8,464 € 3
May € 7,381 € 2
June € 6,512 € 2
July € 6,430 € 2
August € 6,545 € 2
September € 6,029 € 2
October € 6,444 € 2
November € 8,983 € 3
December € 10,600 € 3
TABLE 13: TOTAL MONTHLY AND COST PER M2 ENERGY COSTS -
AIR SOURCE HEAT PUMP
COST €
COST €
COST €
FIGURE 47: TOTAL FUEL COSTS - BASE RUN
FIGURE 48: TOTAL ENERGY COSTS - AIR SOURCE HEAT PUMP
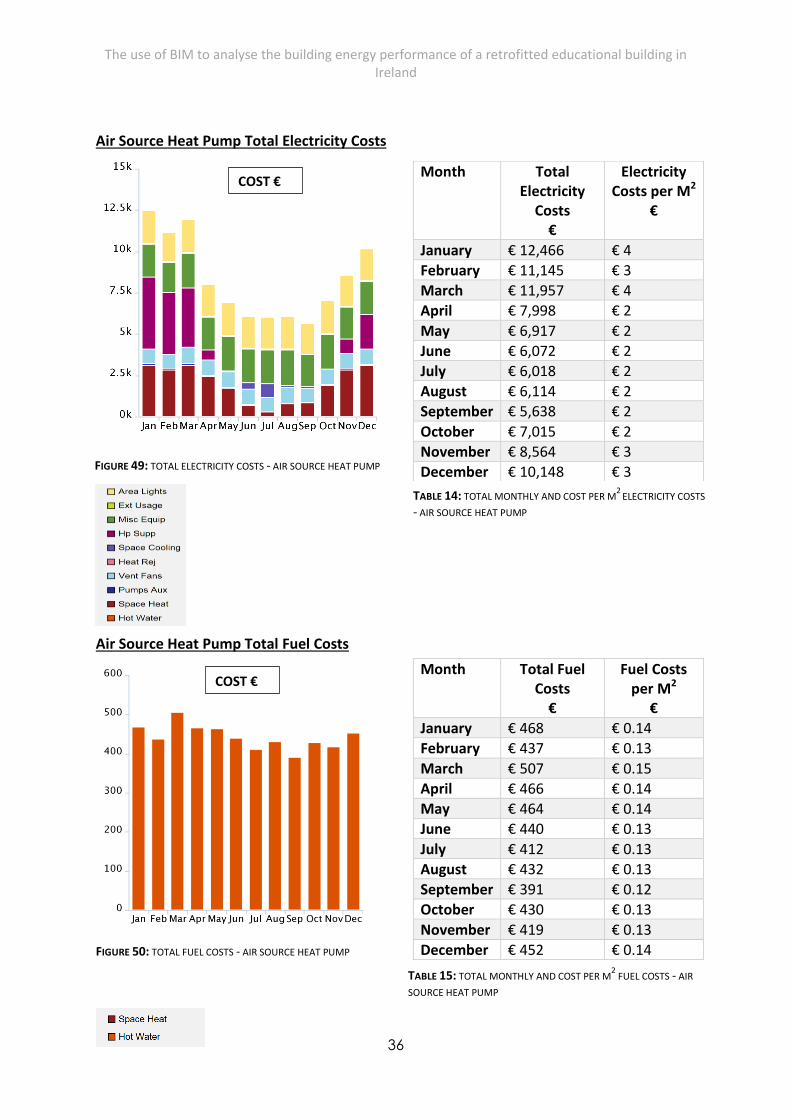
The use of BIM to analyse the building energy performance of a retrofitted educational building in Ireland
36
Air Source Heat Pump Total Electricity Costs
Air Source Heat Pump Total Fuel Costs
Month Total Electricity
Costs €
Electricity Costs per M2
€
January € 12,466 € 4
February € 11,145 € 3
March € 11,957 € 4
April € 7,998 € 2
May € 6,917 € 2
June € 6,072 € 2
July € 6,018 € 2
August € 6,114 € 2
September € 5,638 € 2
October € 7,015 € 2
November € 8,564 € 3
December € 10,148 € 3
TABLE 14: TOTAL MONTHLY AND COST PER M2
ELECTRICITY COSTS
- AIR SOURCE HEAT PUMP
Month Total Fuel Costs
€
Fuel Costs per M2
€
January € 468 € 0.14
February € 437 € 0.13
March € 507 € 0.15
April € 466 € 0.14
May € 464 € 0.14
June € 440 € 0.13
July € 412 € 0.13
August € 432 € 0.13
September € 391 € 0.12
October € 430 € 0.13
November € 419 € 0.13
December € 452 € 0.14
TABLE 15: TOTAL MONTHLY AND COST PER M2 FUEL COSTS - AIR
SOURCE HEAT PUMP
COST €
COST €
FIGURE 49: TOTAL ELECTRICITY COSTS - AIR SOURCE HEAT PUMP
FIGURE 50: TOTAL FUEL COSTS - AIR SOURCE HEAT PUMP
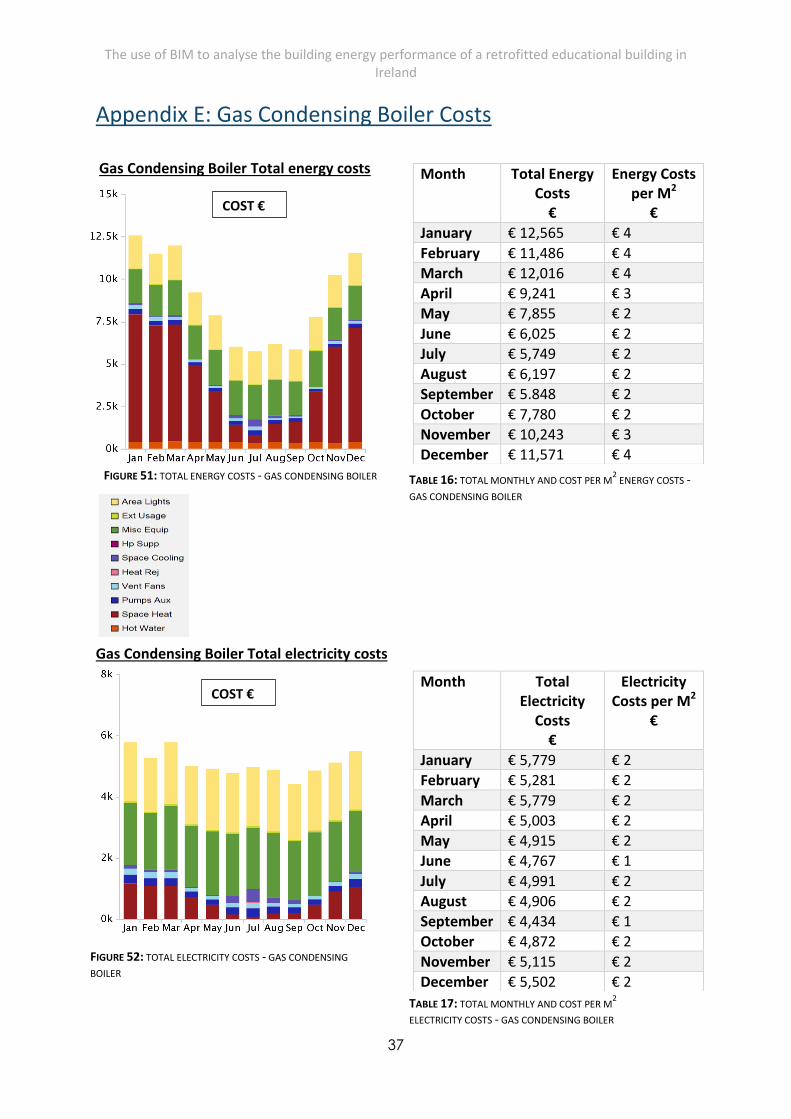
The use of BIM to analyse the building energy performance of a retrofitted educational building in Ireland
37
Appendix E: Gas Condensing Boiler Costs
Gas Condensing Boiler Total energy costs
Gas Condensing Boiler Total electricity costs
Month Total Energy Costs
€
Energy Costs per M2
€
January € 12,565 € 4
February € 11,486 € 4
March € 12,016 € 4
April € 9,241 € 3
May € 7,855 € 2
June € 6,025 € 2
July € 5,749 € 2
August € 6,197 € 2
September € 5.848 € 2
October € 7,780 € 2
November € 10,243 € 3
December € 11,571 € 4
TABLE 16: TOTAL MONTHLY AND COST PER M2 ENERGY COSTS -
GAS CONDENSING BOILER
Month Total Electricity
Costs €
Electricity Costs per M2
€
January € 5,779 € 2
February € 5,281 € 2
March € 5,779 € 2
April € 5,003 € 2
May € 4,915 € 2
June € 4,767 € 1
July € 4,991 € 2
August € 4,906 € 2
September € 4,434 € 1
October € 4,872 € 2
November € 5,115 € 2
December € 5,502 € 2
TABLE 17: TOTAL MONTHLY AND COST PER M2
ELECTRICITY COSTS - GAS CONDENSING BOILER
COST €
COST €
FIGURE 51: TOTAL ENERGY COSTS - GAS CONDENSING BOILER
FIGURE 52: TOTAL ELECTRICITY COSTS - GAS CONDENSING
BOILER
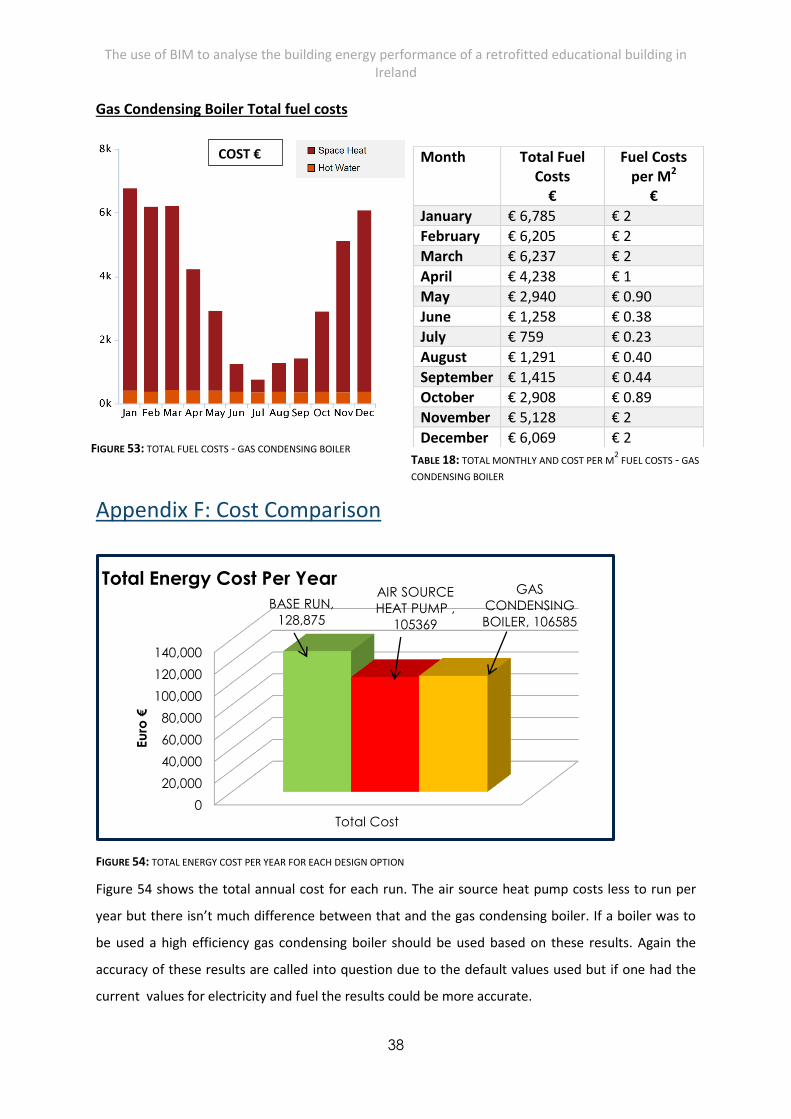
The use of BIM to analyse the building energy performance of a retrofitted educational building in Ireland
38
Gas Condensing Boiler Total fuel costs
Appendix F: Cost Comparison
FIGURE 54: TOTAL ENERGY COST PER YEAR FOR EACH DESIGN OPTION
Figure 54 shows the total annual cost for each run. The air source heat pump costs less to run per
year but there isn’t much difference between that and the gas condensing boiler. If a boiler was to
be used a high efficiency gas condensing boiler should be used based on these results. Again the
accuracy of these results are called into question due to the default values used but if one had the
current values for electricity and fuel the results could be more accurate.
0
20,000
40,000
60,000
80,000
100,000
120,000
140,000
Total Cost
BASE RUN,
128,875
AIR SOURCE
HEAT PUMP ,
105369
GAS
CONDENSING
BOILER, 106585
Eu
ro €
Total Energy Cost Per Year
Month Total Fuel Costs
€
Fuel Costs per M2
€
January € 6,785 € 2
February € 6,205 € 2
March € 6,237 € 2
April € 4,238 € 1
May € 2,940 € 0.90
June € 1,258 € 0.38
July € 759 € 0.23
August € 1,291 € 0.40
September € 1,415 € 0.44
October € 2,908 € 0.89
November € 5,128 € 2
December € 6,069 € 2
TABLE 18: TOTAL MONTHLY AND COST PER M2 FUEL COSTS - GAS
CONDENSING BOILER
COST €
FIGURE 53: TOTAL FUEL COSTS - GAS CONDENSING BOILER
The use of BIM to analyse the building energy performance of a retrofitted educational building in Ireland
39
REFERENCES
COSTA, A., KEANE, M.M., TORRENS, J.I. and CORRY, E., 2013. Building operation and energy
performance: Monitoring, analysis and optimisation toolkit. Applied Energy, 101, pp. 310-316.
DEPT OF ENVIRONMENT, 2012. TOWARDS NEARLY ZERO ENERGY BUILDINGS IN IRELAND.
GOVERNMENT OF IRELAND, 2012. STATUTORY INSTRUMENTS S.I. No 243 of 2012.
KNIGHT, I., STRAVORAVDIS, S. and LASVAUX, S., 2007. Assessing the Operational Energy Profiles of
UK educational buildings: findings from detailed surveys and modelling compared to consumption.
Cardiff University, UK:
MURPHY, D., 2014. Achieving Compliance with Part L.
MUSTAFARAJ, G., MARINI, D., COSTA, A. and KEANE, M., 2014. Model calibration for building energy
efficiency simulation. Applied Energy, 130, pp. 72-85.
REEVES, T., OLBINA, S. and ISSA, R., 2012. Validation of building energy modelling tools: Ecotect,
Green Building Studio and IES VE.
RUNDELL and RICK, 2007. BIM and Analysis for sustainable design:
Linking BIM and building analysis software offers greater opportunities for green design. Catalyst,
SMYTH, E., 2014. IBCI Conference 2014: Building Regulations Update.
TGD PART L, 2011. Conservation of Fuel and Energy - Dwellings.
THORNTON, M., 2014. Insulation continuity and airtightness in construction Report. Galway:
The use of BIM to analyse the building energy performance of a retrofitted educational building in Ireland
40
BIBLIOGRAPHY
A COMPARATIVE ANALYSIS OF BIM INTEGRATED AND TRADITIONAL ENERGY MODELLING METHODS
FOR BUILDING ENERGY RETROFIT.
1112, FROM THE ARCHITECTURAL MODEL TO THE ENERGYMODEL: THE USE OF BIM FOR THE
EVALUATION OF THE ENERGY PERFORMANCE OF BUILDINGS.
ATTIA, S., DE HERDE, A., GRATIA, E. and HENSEN, J.M., 2013. Achieving informed decision-making for
net zero energy buildings design using building performance simulation tools. Building Simulation,
6(1), pp. 3-21.
BRYDE, D., BROQUETAS, M. and VOLM, J.M., 2013a. The project benefits of Building Information
Modelling (BIM). International Journal of Project Management, 31(7), pp. 971-980.
BRYDE, D., BROQUETAS, M. and VOLM, J.M., 2013b. The project benefits of Building Information
Modelling (BIM). International Journal of Project Management, 31(7), pp. 971-980.
BUILDING REGULATIONS and THE FUTURE OF ENERGY EFFICIENT BUILDINGS, Building Regulations
and the Future of Energy Efficient Buildings.
CIBSE CLYDE ROAD 20 MARCH 2013, Building Regulations Part L and Part J.
COAKLEY, D., RAFTERY, P. and KEANE, M., 2014. A review of methods to match building energy
simulation models to measured data. Renewable and Sustainable Energy Reviews, 37, pp. 123-141.
COSTA, A., KEANE, M.M., TORRENS, J.I. and CORRY, E., 2013. Building operation and energy
performance: Monitoring, analysis and optimisation toolkit. Applied Energy, 101, pp. 310-316.
DEPT OF ENVIRONMENT, 2012. TOWARDS NEARLY ZERO ENERGY BUILDINGS IN IRELAND.
GOVERNMENT OF IRELAND, 2012. STATUTORY INSTRUMENTS S.I. No 243 of 2012.
GUPTA, A., 2013. Developing a BIM-based methodology to support renewable energy assessment of
buildings, Ph.D., Cardiff University (United Kingdom), ProQuest, UMI Dissertations Publishing.
HEO, Y., CHOUDHARY, R. and AUGENBROE, G.A., 2012. Calibration of building energy models for
retrofit analysis under uncertainty. Energy and Buildings, 47, pp. 550-560.
The use of BIM to analyse the building energy performance of a retrofitted educational building in Ireland
41
HERNANDEZ, P., BURKE, K. and LEWIS, J.O., 2008. Development of energy performance benchmarks
and building energy ratings for non-domestic buildings: An example for Irish primary schools. Energy
and Buildings, 40(3), pp. 249-254.
KNIGHT, I., STRAVORAVDIS, S. and LASVAUX, S., 2007. Assessing the Operational Energy Profiles of
UK educational buildings: findings from detailed surveys and modelling compared to consumption.
Cardiff University, UK:
MARTIN VAUGHAN, Low Energy, Low Carbon Buildings: Policy & Regulatory Challenges for Ireland's
Built Environment.
MOTAWA, I. and CARTER, K., 2013. Sustainable BIM-based Evaluation of Buildings. Procedia - Social
and Behavioural Sciences, 74, pp. 419-428.
MURPHY, D., 2014. Achieving Compliance with Part L.
MUSTAFARAJ, G., MARINI, D., COSTA, A. and KEANE, M., 2014. Model calibration for building energy
efficiency simulation. Applied Energy, 130, pp. 72-85.
O' MAHONY, T., ZHOU, P. and SWEENEY, J., 2013a. Integrated scenarios of energy-related CO2
emissions in Ireland: A multi-sectoral analysis to 2020. Ecological Economics, 93, pp. 385-397.
O' MAHONY, T., ZHOU, P. and SWEENEY, J., 2013b. Integrated scenarios of energy-related CO2
emissions in Ireland: A multi-sectoral analysis to 2020. Ecological Economics, 93, pp. 385-397.
POEL, B., VAN CRUCHTEN, G. and BALARAS, C.A., 2007. Energy performance assessment of existing
dwellings. Energy and Buildings, 39(4), pp. 393-403.
REEVES, T., OLBINA, S. and ISSA, R., 2012. Validation of building energy modelling tools: Ecotect,
Green Building Studio and IES VE.
REVITCLINIC.COM, 2013-last update, Revit vs. ArchiCAD - Revit Clinic - Revit Tutorials. Available:
http://www.revitclinic.com/blogs/41-revit-vs-archicad.html2014. Accessed November 2014
RUNDELL and RICK, 2007. BIM and Analysis for sustainable design:
Linking BIM and building analysis software offers greater opportunities for green design. Catalyst,
The use of BIM to analyse the building energy performance of a retrofitted educational building in Ireland
42
SALMAN AZHAR and JUSTIN BROWN RIZWAN FAROOQUI AUBURN UNIVERSITY FLORIDA
INTERNATIONAL UNIVERSITY AUBURN, 2009. BIM-based Sustainability Analysis: An Evaluation of
Building Performance Analysis Software.
SMYTH, E., 2014. IBCI Conference 2014: Building Regulations Update.
TGD PART L, 2011. Conservation of Fuel and Energy - Dwellings.
THE EUROPEAN PARLIAMENT and THE COUNCIL OF THE EUROPEAN UNION, 2010. DIRECTIVE
2010/31/EU OF THE EUROPEAN PARLIAMENT AND OF THE COUNCIL of 19 May 2010 on the energy
performance of buildings (recast).
THORNTON, M., 2014. Insulation continuity and airtightness in construction Report. Galway:
VOLK, R., STENGEL, J. and SCHULTMANN, F., 2014. Building Information Modelling (BIM) for existing
buildings — Literature review and future needs. Automation in Construction, 38, pp. 109-127.