the use of best scientific and commercial information by
TRANSCRIPT


2
The project site consists of 34.17 acres, of which 14.58 acres are uplands and 16.50 acres are wetlands. The uplands consist primarily of disturbed open lands that were historically cleared, paved roads and a small area comprised of slash pine (Pinus elliottii), melaleuca (Melaleuca quinquenervia), Brazilian pepper (Schinus terebinthifolius), cabbage palm (Sabal palmetto), saw palmetto (Serenoa repens), wiregrass (Aristida stricta) and Caeser weed (Urena lobata). Numerous firebreaks and trails bisect the forested areas on-site. The 16.5 acres of wetlands are dominated by mature stands of melaleuca or Brazilian pepper, with two small pockets of Carolina willow (Salix caroliniana), buttonbush (Cephalanthus occidentalis), red maple (Acer rubrum), swamp fern (Blechnum serrulatum), dog fennel (Eupatorium capillifolium), false nettle (Boehmeria cylindrica), smartweed (Polygonum spp.), and fireflag (Thalia geniculata). The site is bordered to the north by Immokalee Road, to the east by Tarpon Bay Boulevard, to the south by a multi-family residential development, to the west by I-75, and to the east by single-family residential and an activity center (Figure 2). In the Public Notice dated September 24, 2004, the Corps determined the Super Target-Tarpon Bay Plaza project “may affect, but is not likely to adversely affect” the endangered Florida panther. By email response to the Corps dated February 27, 2005, the Service did not concur with this determination and requested that the determination be revised to “may affect”, as the project is within the Florida Panther Consultation Area and the project will encompass approximately 20 acres of impact to potential panther habitat. By email dated March 1, 2005, the Corps stated that the determination had been revised to “may affect” (as requested by the Service) and pursuant to Section 7 of the Endangered Species Act of 1973, as amended, the Jacksonville District requested initiation of formal consultation (for the project referenced above) for the Florida panther. The Service received this request on March 1, 2005, via email. The project will result in the loss of 16.5 acres of wetlands and 17.7 acres of uplands marginally suitable for the Florida panther. The total development footprint for the project, including both wetlands and uplands, will be 34.17 acres. The project is located outside the Florida panther Primary and Secondary Zones (Kautz et al. In Review) (Figure 3), but is inside the Service’s panther consultation area (Figure 4). The habitat loss provides approximately 81.575 panther habitat units (see definition in the Effects of the Action). As compensation for wetland impacts (16.5 acres) and impacts to the Florida panther (34.17 acres), the applicant proposes to purchase 6.8 wetland credits at the Panther Island Mitigation Bank (PIMB) in Lee County, Florida. The 6.8 credits provide 20.2 acres of land at the PIMB. This purchase provides compensation for the loss of 34.17 acres of lower quality habitat on the project site for foraging and dispersal by the Florida panther through the off-site protection and restoration of approximately 20.2 acres of higher quality panther habitat in an area surrounded by higher quality panther habitat. The habitat preserved provides approximately 174.08 panther habitat units (see definition in the Effects of the Action).

3
The Use of Best Scientific and Commercial Information by the Service The Service uses the most current and up-to-date scientific and commercial information available. The nature of the scientific process dictates that information is constantly changing and improving as new studies are completed. The scientific method is an iterative process that builds on previous information. As the Service becomes aware of new information, we will ensure it is fully considered in our decisions, evaluations, reviews, and analyses as it relates to the base of scientific knowledge and any publications cited in our documents. Specifically, there is one such document cited in this biological opinion the Service acknowledges has been affected in its cited form by new scientific information. The Service has taken these new sources of information into account when using this document to help guide our analysis and decisions. This document is the South Florida Multi-Species Recovery Plan (MSRP) of 1999 (Service 1999). In addition, the Service has examined Kautz et al. (In Review) for its scientific validity, specifically with regards to comments and recommendations by other reviewers as discussed below. South Florida Multi-Species Recovery Plan The MSRP was designed to be a living document and it was designed to be flexible to accommodate the change identified through ongoing and planned research and would be compatible with adaptive management strategies. These principals are set forth in both the transmittal letter from the Secretary of the Interior and in the document itself. As predicted, this is what indeed occurred in the intervening years since the MSRP was published. The Service uses the MSRP in the context it still presents useful information when taken in conjunction with all the new scientific information developed subsequent to its publication. Kautz et al. (In Review) The Florida Panther Subteam was charged with developing a landscape-level strategy for the conservation of the Florida panther population in south Florida. The Subteam produced the draft Landscape Conservation Strategy for the Florida Panther in South Florida in December 2002 and provided it to the Service. Upon receipt, the Service began to use the information in the draft Landscape Conservation Strategy in its decision making processes and documents since it was part of the best scientific information available to the Service at the time. Since then some portions of the science and findings in the draft Landscape Conservation Strategy have been challenged. Many, but not all, of the Subteam members have refined the methodology, further analyzed the data, and better defined the results of the Landscape Conservation Strategy into a draft article, referred to here as Kautz et al. (In Review), for submission to a professional peer-reviewed journal, Biological Conservation. To date, the authors have responded to a series of edits on their draft article and are awaiting response from the journal editor regarding acceptance of the manuscript for publication. In addition, the authors have considered the comments provided by Beier (2003) on the Landscape Conservation Strategy and the recommendations provided by the Scientific Review Team (SRT) (Beier et al. 2003) as discussed below. Dr. Jane Comiskey, one of the co-authors of Kautz et al. (In Review), has expressed some

4
concerns about the manuscript and we have addressed her concerns below as well. We have also addressed issues relating to the ESA and Information Quality Act.
Beier (2003) Comments on the Draft Landscape Conservation Strategy Beier provided 37 comments on the Subteam’s Landscape Conservation Strategy. Kautz et al. (In Review) addressed all of Beier’s comments except those discussed below. 1. Include a statement that when analyses using nighttime data are available, this picture probably will change. This statement is not in the manuscript, but in this and other biological opinions, the Service acknowledges that nighttime and 24-hour data are generally not readily available at this time. Data from GPS collars will be considered when found to be reliable and available. Availability of nighttime or 24-hour data may possibly change some conclusions about panther habitat in the future. In analyses of puma habitat in California, Beier (2003) found that puma show markedly broader habitat use and selection at night compared to daytime. We expect that when GPS-collar data becomes more available, there will likely be a better understanding of habitat use at night. However, the Service does not solely rely on daytime telemetry in making its decisions regarding panther habitat. The Service considers panther habitat to include all areas required for the panther to live out its full life-cycle, including areas providing food and shelter and supporting characteristic movement such as hunting, breeding, dispersal, and territorial behavior. 2. Explain the witch’s finger jutting eastward from the Primary Zone. No panther is going to have a home range 10 miles long and 400 meters wide. Buffer this so that it is at least 1 mile wide at its narrowest points, and 4 to 5 miles wide in most areas. I support the idea of making this primary habitat, but strongly feel that it does not make sense to make it so narrow. This was not addressed. This comment relates to the slender portion of the Primary Zone that protrudes eastward at the border of Palm Beach and Broward Counties and the recommendation by Beier that it be buffered to be more inclusive. While Kautz et al. (In Review) did not make this requested modification, the Service will address this omission in biological opinions, as appropriate. The Service is careful to consider Primary, Dispersal, and Secondary Zones and other panther habitat, along with additional high-quality scientific and commercial data, in our analyses and evaluations. 3. Secondary Zone: Overall, the approach is reasonable, but not rigorous. We will probably never have data to make this a rigorous analysis, so it would be unreasonable to demand it. However, if you ran a cursory sensitivity analysis, you can determine how the map varies under different assumptions about cutoff points and relative weights. According to Kautz et al. (In Review), the Secondary Zone is defined as natural and disturbed lands adjacent to the Primary Zone that may have potential to support an expanding panther population, especially if habitat restoration were possible. A preliminary boundary of a Secondary Zone was originally drawn on a hard copy map by the Multi-species Ecosystem Recovery Implementation Team (MERIT) Panther Subteam. The landscape context of the draft
5
Secondary Zone was evaluated by combining a set of 30-meter (m) pixel grids created to measure three habitat-related variables (i.e., proximity to Primary Zone, proximity to a forest plus buffer patch, forest plus buffer patch size) and three land-use variables (i.e., proximity to urban lands, intensity of land use, and road type and density). Pixels in the six data layers were assigned scores of 1 to 10, with 10 representing the best case for panthers. Equal interval or progressively increasing or decreasing increment functions were applied to each data layer as deemed appropriate. The Secondary Zone boundary was finalized by adjusting the preliminary boundary to conform to results of the landscape context analysis and to land use changes as indicated by recent satellite imagery. To our knowledge, a cursory sensitivity analysis varying the scores assigned to the different variables within each data layer was not run. Therefore, we do not know how a map of the Secondary Zone would vary under different assumptions about cutoff points and relative weights. However, as a group, the Subteam reviewed the draft Secondary Zone boundaries in relation to the results of the context analyses and recent satellite imagery, and achieved consensus on the adjusted boundaries that best met the definition of the Secondary Zone. Therefore, the Service does not believe the lack of this cursory sensitivity analysis affects the scientific validity of a Secondary Zone nor the Service’s ability to use it in biological opinions. 4. A density of 1 panther per 11,000 hectare (ha) is a strange inference from this simple descriptive statistic. The 11,000 ha is simply total area divided by the number of panther home ranges in the area - it is not the size of a panther home range, nor is it the amount of forest in a panther home range, nor is there any logical reason that 11,000 ha should be the ‘minimum size of a forest patch to have potential use by panthers. This is a complete non-sequitur. This is not a sound approach toward estimating minimum forest area for use by panthers. In the Landscape Conservation Strategy, the MERIT Panther Subteam attempted to identify lands north of the Caloosahatchee River for their capacity to support one or more groups of reproducing panthers. In that process, they assumed that large forest patches, at least 11,000 ha in size, would be needed. This assumption was based on an estimate of population density in optimal habitat given by Maehr et al. (1991a). In conducting a compositional analyses, Kautz et al. (In Review) determined that panther use of forest patches within fixed kernel home ranges south of the Caloosahatchee River differed significantly from random. The smallest forest patch size classes occurred within home ranges in higher proportions relative to their availability than larger forest patch sizes. With this new knowledge, Kautz et al. (In Review) did not repeat the erroneous assumption that forest patches at least 11,000 ha in size are required by panthers. Kautz et al. (In Review) did use 1 panther per 11,000 ha as a rough density estimate along with a density estimate derived from their own analysis (1 panther per 12,919 ha) to provide estimated ranges for the potential number of panthers that could be accommodated by the current configuration of the Primary, Dispersal, and Secondary Zones. 5. Habitat Capacity, “defined as areas with pixel values >3.” This definition, it seems, would result in a region with Swiss-cheese holes and outlier bubbles of habitat. Was there a step that

6
involved smoothing to create a “smooth” map? If so, describe that step. If not, acknowledge and describe the nature of the resulting map. For the purposes of their study, the Subteam developed an estimate of panther population density. Minimum convex polygons of panther home ranges were generated for all Florida panthers by year based on telemetry records through early in 2000 (n=49,889 telemetry locations, 1981 to 2000). Each polygon was converted to a 100 m pixel grid, and the resulting grids were summed. The region of most consistent panther occupancy for the period of record was defined as areas with pixel values ≥3. This step excluded areas used only once or twice by transient animals. To estimate population density, the total land area within the resulting region of panther occupancy was divided by 62, the estimated size of the panther population in 2000 (McBride 2000). Using this method, the region of most consistent panther occupancy from 1981 through early 2000 covered 800,951 ha. Based on the estimated panther population of 62 individuals, population density was one panther per 12,919 ha in 2000. Kautz et al. (In Review) did not address the shape or character of the resulting map, nor whether its creation involved “smoothing.” However, the resulting size of area of occupancy and population density they report are consistent with other published information and are considered the most current and up-to-date scientific information available to the Service. 6. “Region of panther occupancy was divided by 62, the estimated size of the panther population in 2000.” Need to be specific about whether this refers to resident adults, resident breeding adults, adults plus independent juveniles, or total panthers, including kittens. McBride’s estimate, I believe, was “adults plus independent juveniles” and is thus analogous to the estimated density provided by Maehr et al. (1991a). This was partially addressed. Kautz et al. (In Review) states that “…estimates place the population at 80-100 adults and subadults (Land and Lacy 2000; McBride 2001, 2002, 2003).” Later, where Kautz et al. (In Review) use the estimate of 62 panthers, McBride is cited. According to Kautz et al. (In Review), “To estimate population density, the total land area within the resulting region of panther occupancy was divided by 62, the estimated size of the panther population in 2000 (McBride 2000).” McBride (2000) clearly indicates that 62 panthers “…includes collared and uncollared, adult and subadult, part-Texas and pure Florida panthers. It does not include kittens at the den site, nor does it include extrapolations.” The Service understands that the panther population of 62 in 2000 included adults plus subadults and not kittens at the den. 7. “A population of this size would have Ne of ~ 50 breeding adults.” This statement needs explanation based on published data, otherwise delete it. Ne is a notoriously difficult parameter to estimate. No similar statement is in Kautz et al. (In Review) and Ne is not mentioned in the text. However, Ne is in Table 5 of Kautz et al. (In Review). The presence of Ne in Table 5 does not affect the scientific validity of the document nor the Service’s ability to use it. The effective population size (Ne) is the number of adults in a population contributing to offspring in the next generation. Although we understand that Ne is difficult to estimate, we believe use of it is helpful in the

7
population guidelines given in Kautz et al. (In Review). The Service realizes that the effective population size is generally smaller than the census size and is often much smaller than the census size. Although not specifically discussed in our biological opinions, we factor this into our analyses. 8. It is hard to believe that we cannot “rank agricultural lands as panther habitat” with data already in hand. Don’t we already know that unimproved pasture > improved pasture > citrus > row crops? This has been addressed to some degree. Table 1 of Kautz et al. (In Review) does rank some agriculture lands but not to the level of detail in the comments. The Service has factored the relative value of cover types/habitat types into our analyses and decision-making process during project evaluations and reviews. 9. Please change “long-term survival of the Florida panther” to “long-term survival of the existing population of the Florida panther.” This was not addressed in Kautz et al. (In Review). However, the Service realizes that a single Florida panther population exists in south Florida. Our decisions in this biological opinion and others are based upon ensuring the survival of the panther population in south Florida while working toward what is needed for recovery throughout the panther’s historic range. Scientific Review Team Report 1. Beier et al. (2003) states that “Telemetry data have been collected for Florida panthers over a long time period (since 1981), but in some analyses of habitat use, the vegetation maps may not have been updated and ground-truthed to stay current with analyses of telemetry data. The SRT has insufficient information to know to what degree this may be a problem, but recommends attention to this potential problem in future analyses.” Kautz et al. (In Review) states that “While researchers have continued to collect telemetry data for radio-collared panthers through the date of this writing, we are reporting the results of the only telemetry data that were available at the time of our collaborative work, and the telemetry data we used were closer in time to the date of the land cover data sets used for habitat analysis.” In relation to how this point was addressed in the Kautz et al. (In Review) manuscript, Randy Kautz (Florida Fish and Wildlife Conservation Commission [FWC], personal communication, 2004) stated that he “spent several hours at one point zooming in on panther telemetry against a backdrop of recent land cover data, and … found very few obvious examples of this being a problem. My own take was that the volume of telemetry data of over 55,000 records was so huge that any currency problems comprised a very small error factor.” The Service concurs with Randy Kautz’s conclusion and believes that currency errors in such a large sample size would not be significant.
8
2. Beier et al. (2003) strongly recommends the use of compositional analyses (Aebischer et al. 1993) or another statistically appropriate method to compare the distributions of forest patch sizes available to panthers to those used by panthers. Kautz et al. (In Review) used compositional analysis to assess the effect of forest patch size on panther habitat use within the study area south of the Caloosahatchee River. This was accomplished by reclassifying upland and wetland forest types into one forest class, determining patch size, and assigning individual forest patches to size classes according to an equal area increment function. Differences in proportions of forest patches within each home range relative to the entire study area were then tested. Kautz et al. (In Review) found that forest patches of all sizes are important to panthers and that the smallest classes of forest patches are especially important. 3. Beier et al. (2003) states “The estimate of 84 percent to 87 percent kitten survival (Maehr and Caddick 1995) is indefensible for several reasons.” Root’s (2004) population viability analysis (PVA) used the more recent and realistic survival rate of 0.62.” This rate was developed by the use of data collected by FWC researchers and is one parameter within PVA at this time. This issue is further addressed below under Questions 2 and 6 within in the section addressing comments from Dr. Jane Comiskey. 4. Beier et al. (2003) states “The SRT recommends that any future PVA models should be built from scratch and explicitly consider parameter uncertainty, variation (demographic, environmental) in parameters, and uncertainty in key functional relationships such as density dependence and the effects of inbreeding.” The Service believes that Root (2004) should be considered among the most current and up-to-date scientific and commercial information available and will use this analysis and other relevant information in our biological opinions until new, scientifically peer reviewed and verified data are present.
Dr. Jane Comiskey’s February 2005 Comments on Kautz et al. (In Review) Taken as a whole, Dr. Comiskey’s concerns dealt primarily with the addition of text and explanation to Kautz et al. (In Review) if it was to be used as a substitute for the Landscape Conservation Strategy. The Service agrees that Kautz et al. (In Review) is not a stand alone document and must be used in conjunction with the body of scientific literature regarding the panther, including the work of the Panther Subteam. 1. Kautz et al. (In Review) lacks the needed ecological and environmental context to replace the full Landscape Conservation Strategy. This may be correct in some instances. However, where the Service has cited this document in place of the Landscape Conservation Strategy we have ensured that the information is indeed included in Kautz et al. (In Review) and not part of the larger, more detailed Landscape

9
Conservation Strategy. We believe that Kautz et al. (In Review) captures the major findings of the Landscape Conservation Strategy. Additional ecological and environmental context that is specific to an individual proposed project and proposed project site is included in biological opinions. 2. “The best we know given the current science at hand” indicates that some model assumptions are violated in the existing population and that parameter value estimates for reproductive rates and kitten survival are likely too optimistic. We need to acknowledge that in using model results. Some parameter value estimates for reproductive rates and kitten survival may be too optimistic. Some estimates of kitten survival have been too high (e.g., 0.80) while others may be too low. It would have been our preference to see a range of kitten survival rates used in the models completed to date. Sensitivity analyses conducted by Karen Root of the Panther Subteam showed that kitten survival was the most important variable of those used within the PVA (K. Root, Bowling Green State University, personal communication, 2003). Therefore, we are aware that uncertainty within this parameter may have the greatest consequences on the projected population performance or trajectory. We acknowledge that uncertainties exist, that we are aware of them, and that Root’s (2004) PVA used a 0.62 kitten survival rate. Future PVAs could include a range of updated kitten survival rates as well as other updated parameters. The Service and the FWC along with our partners will continue to monitor the panther population and the south Florida landscape and incorporate any new information and changes into our decision-making process. We recognize that model parameters such as this can have effects on model outcomes. The Service is mindful of the limitations that exist, and when making decisions, we focus on the well being of the species. 3. Kautz et al. (In Review) does not include a definition of habitat. We agree that specifically stating what constitutes panther habitat would be beneficial, however, we do not agree that lack of a definition should prevent use of Kautz et al. (In Review). Most biologists have an understanding of what habitat means. We believe that the Service and our counterparts understand what constitutes panther habitat. However, the Service considers panther habitat to be all areas required for the panther to live out its full life-cycle, including areas providing food and shelter and supporting characteristic movement such as hunting, breeding, dispersal, and territorial behavior. 4. We agreed on the Florida Panther Subteam on the importance of ranking land use categories on a scale of adverse to beneficial effects on panthers and evaluating proposed land use changes in the context of this scale. Randy Kautz felt that it would be redundant to include an explicit statement about this approach toward evaluating the impact to panthers of intensification of disturbance within zones. The Service believes that ranking land use categories on a scale of adverse to beneficial effects on panthers and evaluating proposed land use changes in the context of this scale would be helpful, but is not necessarily needed to be part of Kautz et al. (In Review).

10
5. RAMAS PVA Assumptions: we need more discussion of the assumptions associated with the PVA and the degree to which we know these assumptions to be violated in the existing landscape and population. We are aware of the assumptions used in the PVA analyses and consider these in our decisions. We will acknowledge the degree to which we believe any assumptions are being violated in our documents. According to Root (2004), “All models assumed a 1:1 sex ratio, a stable age distribution, 50 percent of females breeding in any year, and an initial population of 41 females (82 individuals including males), the approximate population size in 2001-2002 (McBride 2001, 2002). The basic version of each model incorporated no catastrophes or epidemics, no change in habitat quality or amount, and a ceiling type of density dependence. The basic versions of the models incorporated a carrying capacity of 53 females (106 individuals). The Service acknowledges that some of these assumptions are violated and tries to factor the degrees to which assumptions may be violated into our decisions. For example, the Service is aware that the Panther Subteam had attempted to address the effects of habitat loss by assuming a 25 percent loss of panther habitat over the first 25 years (i.e., one percent per year) of the 100-year model simulation during their analyses. Although the probability of extinction only increases approximately one percent under this scenario, the mean final abundance of panthers was reduced by 26 percent to 38 and 31 females for optimistic and moderate model scenarios, respectively. The actual likelihood of population declines and extinction can be much higher than the guidelines suggest, depending upon the number of and severity of assumptions violated. The Service realizes that habitat loss is occurring at an estimated 0.8 percent loss of habitat per year (R. Kautz, personal communication, 2003). The Service has tried to account for habitat loss and changes in habitat quality within its regulatory program and specifically through its habitat assessment methodology. For example, we have increased the base ratio used within this methodology to account for unexpected increases in habitat loss. Similarly, we consider changes in habitat quality and encourage habitat restoration wherever appropriate. With regard to the assumption of no catastrophes, the Service has considered the recent outbreak of feline leukemia in the panther population at Okaloacoochee Slough as a potential catastrophe. However, the FWC is carefully monitoring the situation and it appears to be under control at this time due to a successful vaccination program. However, if the outbreak spreads into the population, the Service will consider this as a catastrophe and factor this into our decisions. 6. All three of the RAMAS PVA model scenarios (conservative, moderate, and optimistic) estimate the first year kitten survival rate at 62 percent, based on the Land/Linda kitten survival analysis from FWC annual panther reports (FWC 2001, repeated in 2002, 2003, 2004). However, the selective Land/Linda analysis omits without explanation many failed litters documented in denning tables in these same annual reports, resulting in estimates of survival rates that are too optimistic, especially for the purebred Florida component of the population where most failed litters occurred. Even when reliable rates are computed, PVA scenarios should incorporate a range of survival rates, since the high survival rate among introgressed litters in part reflects expansion into unoccupied areas of the range where there is less

11
competition for space and prey. As such, rates could decrease as the range becomes saturated and as inbreeding effects may reappear in the population. Per Tim O’Meara (FWC, personal communication, 2005), this does include litters that failed. The FWC annual report does include all litters for which FWC was able to get into the den and determine outcome of litters 6 months later; if litters were not included it was because they did not meet those criteria (T. O’Meara, personal communication, 2005). We agree that incorporating a range of kitten survivals into various PVA models would be beneficial in the future. 7. We should include a statement acknowledging that the SRT has found serious errors in panther science and has recommended reanalysis of baseline data for the population. We should acknowledge that, as a result of errors, PVA parameter values may have been overestimated, leading to PVA results that may be too optimistic. In the meantime, decisions should err on the side of the panther. The Service agrees that the SRT has found errors in the scientific literature related to the panther and that reanalysis of baseline demographic data for the population should be done. The SRT has made numerous recommendations and the FWC and the Service are in the process of prioritizing these based upon need and importance to panther recovery. We realize that PVAs, like any model or analyses, are only as good as the assumptions, parameters, and data used. We believe the best estimates for the parameters available at the time were used within the PVA. We realize that there is a possibility that the PVA results may be too optimistic. We agree that our decisions should err on the side of the panther.
Endangered Species Act/Information Quality Act 1. The ESA states that the Service “shall use the best scientific and commercial data available.” However, the vegetation data and land use/land cover maps, as well as the panther telemetry points are several years old. Most information must be analyzed before it is of use to us. Due to the time for analysis and the extensive and lengthy peer review and publication process, it is not possible for an article to be published in a professional journal before the data becomes several months to a few years old as is the case in this instance. We believe that Kautz et al. (In Review) is an appropriate and valid addition to the body of science and it adds to the “best scientific and commercial data available”, however, part of the base data and maps are not necessarily the most current. 2. The Information Quality Act Challenge states “The estimate of an 80 percent pre-introgression kitten survival rate in Maehr et al. (1999; 2002) was based on an indefensible estimate Maehr and Caddick (1995) that was unsupported by data (Beier et al. 2003: 47, 49, 143-144).”

12
Root (2004) used the more current and realistic survival rate of 0.62. This issue is also addressed above in Question 3 within the SRT section, and in Questions 2 and 6 within the Dr. Jane Comiskey section.
Summary After carefully reviewing Kautz et al. (In Review) and considering the above recommendations and standards, we believe that Kautz et al. (In Review) should be considered among the best scientific and commercial data available. Therefore, Kautz et al. (In Review) and the analyses contained therein, along with all other best scientific and commercial data available, is referred to in this document and will be used in our decision making process until or unless new information suggests revisions are necessary. Consultation History In a Public Notice (Corp number 2004-1122) dated September 24, 2004, and by letter dated September 28, 2004, the Corps indicated that Brentwood Land Partners LLC has applied for a permit to excavate 0.58-acre and fill 15.92 acres of jurisdictional wetlands in association with the construction of a commercial development. To compensate for impacts to wetlands, the applicant proposed to purchase 6.8 mitigation credits from a approved mitigation bank. The Corps determined the project “may affect, but is not likely to adversely affect” the Florida panther, and “may affect” the wood stork. On October 14, 2004, KHA met with the Service to discuss a Biological Assessment prepared for the Super Target-Tarpon Bay Plaza project. On November 16, 2004, the Service requested additional information on the project from KHA. On November 16, 2004, KHA submitted the following information per the Service’s request.
• Aerial photograph of the project vicinity • Aerial photograph of the project site • Listed Species Report (including representative site photographs) • FLUCFCS map (revised April, 27, 2004) • Biological Assessment for wood stork, eastern indigo snake and Florida panther • Wetland Rapid Assessment Procedure (WRAP) scores (including a WRAP polygon map) • PUD parcel map • Correspondence with Panther Island Mitigation Bank (PIMB) confirming the purchase of
6.8 acres of freshwater mitigation credits and a Credit Ledger Sheet from PIMB for the reservation of credits for impacts associated with the existing Malibu Lake PUD.

13
On January 7, 2005, the Service requested additional information from KHA via telephone regarding the PIMB and the proposed purchase of mitigation credits. On January 27, 2005, the Corps sent an email message to the Service changing its determination for the wood stork from “may affect” to “may affect, not likely to adversely affect” for the Super Target-Tarpon Bay Plaza project. By email dated January 28, 2005, the Corps determined the project “may affect, but is not likely to adversely affect the threatened eastern indigo snake. On February 9, 2005, the Service requested an aerial photograph showing the existing development within an approximate 0.5-mile radius around the site. On February 9, 2005, KHA submitted the requested aerial photograph to the Service via email. On February 27, 2005, the Service transmitted an email to the Corps noting the proposed Super Target-Tarpon Bay Plaza is located within the Florida Panther Consultation Area and will impact approximately 20 acres of panther habitat. The Service recommended the Corps change their determination for the Florida panther from “may affect, not likely to adversely affect” to “may affect.” On March 1, 2005, the Corps transmitted an email to the Service stating the determination for the Florida panther had been revised to “may affect” (as requested by the Service) for the Super Target-Tarpon Bay Plaza project. On March 1, 2005, the Service transmitted an email to the Corps acknowledging the receipt of the abovementioned email. In a letter to the Corps dated March 16, 2005, on the Super Target-Tarpon Bay Plaza project, the Service concurred with the Corps determination of “may affect, not likely to adversely affect” for the wood stork and the eastern indigo snake. The Service also concurred with the Corps’ “may affect” determination for the Florida panther and requested additional information on the Florida panther in order to complete our evaluation on the project. On March 28, 2005, the Service contacted KHA to discuss site specific methodology to be used in the assessment of the project. The Service has reviewed all information received pertinent to the Florida panther for the Super Target-Tarpon Bay Plaza project. As of May 5, 2005, we received all information necessary for initiation of formal consultation on the Florida panther for this project as required in the regulations governing interagency consultations (50 CFR § 402.14). The Service is providing this biological opinion in conclusion of formal consultation.

14
BIOLOGICAL OPINION DESCRIPTION OF PROPOSED ACTION Proposed Action The proposed project is to construct a retail development (Super Target – Tarpon Bay Plaza) that includes a Super Target as the anchor store, to meet the increasing needs of and provide better services to the neighboring residents in this growing area of northern Collier County. The proposed project consists of construction of a 184,600 square-foot Super Target, 80,325 square-feet of additional retail, stormwater management areas, and associated parking. The project site consists of 34.17 acres, of which 14.58 acres are uplands and 16.50 acres are wetlands. The uplands consist primarily of disturbed open lands that were cleared historically, paved roads and a small area comprised of slash pine, melaleuca, Brazilian pepper, cabbage palm, saw palmetto, wiregrass and Caeser weed. The 16.5 acres of wetlands are dominated by mature stands of melaleuca or Brazilian pepper, with two small pockets of Carolina willow, buttonbush, red maple, swamp fern, dog fennel, false nettle, smartweed, and fireflag. The quality of the exotic-dominated wetlands can be rated as poor due to such factors as past land clearing activities, the construction of I-75 and the Immokalee Road off-ramp, the construction of the Cocohatchee Canal, construction of the D-2 Canal east of Tarpon Bay Boulevard and surrounding development. The site is bordered to the north by Immokalee Road, to the east by Tarpon Bay Boulevard, to the south by a multi-family residential development, to the west by I-75, and to the east by single-family residential and an activity center. The site is located in Section 30, Township 48 South, Range 26 East, in Collier County, Florida. As compensation for wetland impacts (16.5 acres) and impacts to the Florida panther (34.17 acres), the applicant proposes to purchase 6.8 wetland credits at the 2,775-acre Panther Island Mitigation Bank (PIMB) located in Collier County, Florida. These credits equate to 20.2 acres of land at the PIMB, and the land provides 174.08 Panther Habitat Units (PHUs) . The total development footprint for the project, including both wetlands and uplands, will be 34.17 acres. Approximately 14.5 acres of the site has been historically cleared. The project is outside the boundaries of the panther primary zone and panther secondary zone (Kautz et al. In Review) (Figure 3). However, the project is within the Service’s consultation area for the Florida panther (Figure 4), and provides habitat marginally suitable for foraging and dispersal. The applicant has proposed to provide compensation for project effects to panther habitat through the enhancement and preservation of off-site preserves. The off-site compensation area is located in Phase V of PIMB. Phase V includes 163.72 acres composed of crop land (54.77 acres), cypress swamps (3.95 acres), pine flatwoods (88.61 acres), and exotics (16.39 acres). The enhanced Phase V will be composed of cypress swamps (3.95 acres), pine flatwoods (110.2 acres), and freshwater marsh (49.57 acres).

15
Action Area The consultation area for the Florida panther includes lands in Charlotte, Glades, Hendry, Lee, Collier, Palm Beach, Broward, Miami-Dade, and Monroe Counties, as well as the southern portion of Highlands County (Figure 4). Developed urban coastal areas in eastern Palm Beach, Broward, and Miami-Dade Counties, and in western Charlotte, Lee, and Collier Counties were excluded because they contain little or no panther habitat and it is unlikely that panthers would use such areas. Movements of Florida panthers are much larger than the project site and, therefore, the action area is larger than the proposed action area identified by the Corps’ public notice. The action area, which is a subset of the current panther range, includes those lands the Service believes may experience direct and indirect effects from the proposed development. Maehr et al. (1990a) monitored five solitary panthers continuously for 130-hour periods seasonally from 1986 to 1989, rarely observing measurable shifts in location during the day, but nocturnal shifts in location exceeding 20.0 kilometers (km) (12.4 miles) were not unusual. Maehr et al. (2002) in a later report documents a “mean maximum dispersal distance” of 68.1 km (42.3 miles) for subadult males and 20.3 km (12.6 miles) for subadult females. In the same report Maehr et al. (2002) documents a “mean dispersal distance” of 37.3 km (23.1 miles) for subadult males. Comiskey et al. (2002) documents a “mean dispersal distance” for subadult male panthers as an average distance of 40.1 km (24.9 miles) from their natal range, which is similar to the dispersal distance referenced by Maehr et al. (2002). Since the “mean dispersal distance” is similar in these two recent reports, the Service is accepting this information as the basis for defining our action area. Therefore, for both direct and indirect effects, the action area (Figure 5) is defined as all lands within a 25-mile radius of the Super Target-Tarpon Bay Plaza project. This action area does not include urban lands, lands west of Interstate 75 (I-75), and lands outside the Service’s panther consultation area. This action area includes areas anticipated to sustain direct and indirect effects, such as roadways experiencing increased traffic, areas with increased human disturbance (project area and periphery of project), and areas in which habitat fragmentation and intraspecific aggression may be felt. STATUS OF THE SPECIES AND CRITICAL HABITAT RANGEWIDE The State of Florida declared the panther a game species in 1950, gave it complete protection in 1958, although not an official designation, and closed the hunting season. The Federal government listed the panther as endangered in 1967 (32 FR 4001). Heavy hunting and trapping, an inability to adapt to changes in the environment, and land development were cited as reasons for the species decline. Critical habitat has not been designated for the Florida panther, therefore, none will be affected.

16
Status Of the 27 recognized subspecies of P. concolor described by Hall (1981), the Florida panther is the sole remaining subspecies in the eastern United States. Historically, the panther was distributed from eastern Texas or western Louisiana and the lower Mississippi River Valley, east through the southeastern States in general, intergrading to the north with P. c. cougar, and to the west and northwest with P. c. stanleyana and P. c. hippolestes (Young and Goldman 1946). The Florida panther had been eliminated from most of the historic range by 1950. Occasional sightings and signs were reported throughout the rural southeast between 1950 and 1980 (Anderson 1983). The only confirmed panther population was found in south Florida (Anderson 1983). Species Description The Florida panther was first described by Charles B. Cory in 1896 as Felis concolor floridana based on a specimen he collected in Sebastian, Florida (Hall and Kelson 1959). Bangs (1899), however, noted Felis floridana had previously been used for a bobcat and, believing the panther was restricted to peninsular Florida and could not breed with any other form, assigned it full specific status as Felis coryi. The taxonomic classification of the Felis concolor group was revised by Nelson and Goldman (1929), and the panther was assigned subspecific status as Felis concolor coryi. This designation also incorporated Felis arundivaga, which had been classified by Hollister (1911) from specimens collected in Louisiana. Detailed descriptions of each of the subspecies are provided in Young and Goldman (1946) (30 subspecies) and Hall (1981) (27 subspecies). The genus Felis was recently revised so all mountain lions, including the Florida panther, were placed in the genus Puma (Nowell and Jackson 1996). The Florida panther is a medium-sized mammal described as dark tawny in color, with short, stiff hair (Bangs 1899), and having longer legs and smaller feet (Cory 1896) than other puma subspecies. Adult males reach a length of 2.15 m (7 feet [ft]) from their nose to the tip of their tail and may reach or exceed 68 kilograms (kg) (150 pounds) in weight, but typically average around 54.5 kg (120 pounds). They stand approximately 60 to 70 centimeters (23 to 27 in) at the shoulder. Adult females are smaller, with an average weight of 34 kg (75 pounds) and length of 1.85 m (6 ft). The skull of the Florida panther has been described as having a broad, flat, frontal region, and broad, high-arched or upward-expanded nasals (Young and Goldman 1946). The coat of an adult Florida panther is unspotted and typically rusty reddish-brown on the back, tawny on the sides, and pale gray underneath. The long cylindrical tail is slender compared to some of the other subspecies of Puma concolor (Belden 1989). Florida panther kittens are gray with dark brown or blackish spots and five bands around the tail. The spots fade as the kittens grow older and are almost unnoticeable by the time they are 6 months old. At this age, their bright blue eyes turn to the light-brown straw color of the adult (Belden 1989). Three external characteristics are often observed in Florida panthers that are not found in combination with other subspecies of Puma concolor. These characteristics are a right angle crook at the terminal end of the tail, a whorl of hair or “cowlick” in the middle of the back, and irregular, light flecking on the head, nape, and shoulders (Belden 1986). The light flecking may

17
be a result of scarring from tick bites (Maehr 1992a; Wilkins 1994). The kinked tail and cowlicks are considered manifestations of inbreeding (Seal et al. 1994). Life History Panthers are essentially solitary. Interactions between adult females and their kittens are most frequent. Interactions between adult male and female panthers are second in frequency, last from 1 to 7 days, and usually result in pregnancy. Conflicts between males are common and often result in serious injury or death to some individuals. Between October 1984 and June 2004, there were 36 known deaths attributed to intraspecific aggression (FWC 2004). While most of those were between males, one-third occurred between male and female panthers resulting in 12 deaths of females (FWC 2004). Overall, the amount of mortality from intraspecific aggression appears to be increasing with a total of 13 mortalities during the first 10 years of study and nearly double that in the second 10 years (FWC 2004). In addition, the extant of mortality in female panthers from intraspecific aggression appears to be increasing. Since 1995, 10 of the 23 known deaths from intraspecific aggression were female panthers, whereas in previous years only 2 of 13 such deaths were females (FWC 2004). Maehr et al. (1991a) believes higher densities may lead to increases in panther interactions and aggressive conflicts between male panthers, and male and female panthers. However, aggressive encounters between females were not documented in the Maehr et al.’s (1991a) studies. Increases in published verified population numbers from 2000 to 2003 and changes in land use during the same period suggest the densities of panthers may have increased to some degree. Panther activity levels peak around sunrise and sunset. The lowest activity levels occur during the middle of the day. Females at natal dens follow a similar pattern with less difference between high and low activity periods. Although some travel occurs during the day, panthers are mostly crepuscular (Maehr et al. 2004). There are no known differences in seasonal movements, wet and dry season habitat use, seasonal variation in diet, or effects of season on road crossings. Responses to fluctuations in water levels are believed to be not significant (Maehr et al. 1989, 1990b, 1991a). Habitat Human persecution over a 100-year period, along with bounty hunting, land clearing, lumbering, and market hunting of deer, resulted in a range-wide decline of the panther, and as a result, panthers now occupy just 5 percent of their former range. The remaining breeding population is in south Florida, south of the Caloosahatchee River. Maehr (1990a) estimated the occupied range of the panther in 1990 to be 2.2 million acres (880,000 ha) in south Florida. Logan et al. (1993) estimated the range to be 3.1 million acres (1,254,500 ha). The area of most consistent panther occupancy from 1981 through early 2000 was estimated by Kautz et al. (In Review) to be 2 million acres (800,951 ha). Native landscapes within the Big Cypress Swamp region of south Florida, within occupied panther range, are dominated by slash pine, cypress, and freshwater marshes, interspersed with mixed-swamp forests, hammock forests, and prairies. Private lands represent about 25 percent of the Primary, Secondary, and Dispersal Zones in south Florida (Kautz et al. In Review). The largest contiguous tract of panther habitat is the Big

18
Cypress/Everglades ecosystem in Collier, Monroe, and Miami-Dade Counties. Suitable habitat also extends into Lee, Hendry, Charlotte, Glades, Broward, Palm Beach, Highlands, Sarasota, Polk, Osceola, Hardee, and Desoto Counties. Some researchers are of the belief the low nutrient, frequently saturated soils prevalent south of I-75 in south Florida do not produce the quality or quantity of forage required to support large herds of white-tailed deer (Odocoileus virginianus), a dominant prey species for panthers (see Food Habits), and believe it is unlikely habitat in Big Cypress National Park (BCNP) and Everglades National Park (ENP) is as productive as habitat on private lands in northern and western Collier County in terms of panther health, reproduction, and density (Maehr 1992a). However, more recent reports provide contradictory information (McBride 2002, 2003). In addition, according to Beier et al. (2003), the conclusion that ENP and BCNP are poor habitats for panthers is not scientifically supported. Forests provide important diurnal habitat for panthers. Belden et al. (1988) reported Florida panthers use hardwood forests and mixed swamps more than would be expected based on their occurrence in the landscape. While panthers may seek upland forests for daytime uses, as indicated by telemetry data, Kautz et al.’s (In Review) compositional analysis also confirmed that panther home ranges also included non-forest cover types interspersed in landscapes of forest patches, including freshwater marsh, prairie and shrub lands, agricultural lands, and pasture lands. Telemetry data are the best available information about daytime panther habitat use. However, there are limitations and assumptions that should be stated about any conclusions based on telemetry data. Beier et al. (2003) points out several biases in research by Maehr and Cox (1995) in relating the importance of forests as panther habitat. These biases are stated to result from the use of daytime telemetry locations to describe habitat use, the selective use of telemetry data, and using location of telemetry versus panthers as a sampling unit. First, the panther telemetry data is collected in the morning, which creates a disjuncture between the time of data collection (beginning shortly after 7:00 am) and the times of peak panther activity (dawn and dusk). Habitat selection by panthers may be considerably broader at dawn and dusk (Beyer and Haufler 1994; Rettie and McLoughlin 1999). Second, the majority of panthers that have been radio-collared were on public lands. Telemetry research began in the Fakahatchee Strand State Preserve in 1981 (Belden et al. 1988) and gradually expanded to include BCNP, ENP, Florida Panther National Wildlife Refuge (NWR), Picayune Strand State Forest, Okaloacoochee Slough State Forest, and CREW. It also expanded to include some telemetry data research on private lands in Collier, Hendry, Glades, and Lee Counties. Lastly, tests of the accuracy of some of the telemetry locations revealed the difference between the actual location of the transmitter and the recorded location averaged 77 m (Dees et al. 2001) and can be as large as 230 m (Belden et al. 1988). These results were obtained by placing test transmitters in known locations in the field, plotting transmitter locations from the air, and then determining the error of actual versus observed locations. A more recent analysis (Maehr et al. 2004) suggests some likelihood that daytime telemetry locations are not dissimilar to areas used by panthers at night. However, 24-hour telemetry has not returned enough data to fully address this question. Maehr et al. (1990b) found panthers were very active around sunrise, a time of day well represented by aerial telemetry data, but that

19
Comiskey et al. (2002) claims is missing from previous analyses of panther habitat use. Although it is not known exactly what behavior each animal was engaged in at the time these data were collected, it likely included a variety of activities, e.g., walking, hunting, feeding, grooming, and resting. Maehr et al. (2004) believes daytime telemetry data include periods during which panthers are quite active. However, Maehr et al. (2002) did not compare habitats recorded by observers during periods of activity (as indicated by mercury tip switches or radio-collars) to habitats available to the panther. The Service and the FWC commissioned a SRT to do an independent critical review of literature related to ecology and management of the panther. The team (referred to as the SRT) published their findings in Beier et al. (2003). Included in these findings, the SRT: (1) encourages the acquisition and analysis of nighttime telemetry data to provide a more complete picture of Florida panther habitat use; (2) urges researchers to fully disclose and explain reasoning for selective use of data; (3) believes panthers rather than individual panther locations should be the sampling unit for determining habitat use; (4) believes vegetation maps used in habitat analysis be current with the data being analyzed; and (5) recommends to cease using a 90-m distance from forest cover, minimum sizes of forest patches, and the Panther Habitat Evaluation Model in making decisions about habitat mitigation and acquisition. Following release of these critical review findings, revised analyses of panther telemetry data and habitat use data were undertaken by Kautz et al. (In Review) to address issues associated with the use of individual panther telemetry data, vegetation maps, and the use of the 90-m distance from forest cover. Furthermore, the Service does not use or rely on habitat assessments that incorporate the Panther Habitat Evaluation Model (Maehr and Cox 1995) in site evaluations. Maehr and Cox (1995) studied 10 female and 13 male panthers and found the home ranges included 6 percent freshwater marsh, 5 percent grass and agriculture, 3 percent dry prairie, 3 percent shrub swamp, and 1 percent barren land; and concluded panthers can remain part of the native fauna in areas where agricultural activities exist. The above cover types, which represent open habitat, totaled 18 percent of the panther’s home range. Maehr et al. (1991a) states panthers may travel through agricultural areas at night. Panthers currently in ENP have home ranges less than 10 percent forest cover (Comiskey et al. 2002). Maehr et al. (2002) found three panthers that crossed the Caloosahatchee River all went through areas with limited forest cover, and dispersing males wander widely through unforested and disturbed areas (Maehr 1992a). Beier et al. (2003) reported Comiskey et al. (2002) made a credible case that no significant relationship exists between home range size and forest cover. Reproduction and Demography Male panthers are polygynous and maintain large home ranges that may overlap home ranges of others males, although not to the extent overlapping that of several females. Breeding peaks in fall and winter (Maehr 1992b). Gestation lasts 90 to 96 days. Parturition is distributed throughout the year with the majority of births occurring between March and July. Prenatal litters range from three to four. Postnatal litters range from one to four kittens (FWC 2001).

20
Litters surviving to 6 months of age average 2.2 kittens. Female panthers losing their litters generally produce replacement litters within the same breeding season. Intervals between litters range from 19 to 22 months (FWC 2004). Den sites are usually located in dense, understory vegetation, typically saw palmetto (Maehr 1990a). Historical records of den sites and birth rates for the past 5 years for the Florida panther, based on data provided by the FWC (2004), were: 7 dens, 18 kittens in 2003/2004; 6 dens, 17 kittens in 2002/2003; 12 dens, 26 kittens in 2001/2002; 8 dens, 21 kittens in 2000/2001; and 6 dens, 17 kittens in 1999/2000. Based on 2.5 kittens per den and an understanding a female panther will generally produce kittens every other year, the female population is estimated to include an average of 14 to 16 producing females with 7 to 8 females per year producing 18 to 20 kittens per year. Early estimates of infant mortality varied and were in conflict. For example, Roelke et al. (1993) characterized infant mortality as relatively high with fewer than half of all births resulting in offspring that survive beyond 6 months of age. Land (1994) estimated the kitten survival rate between age 6 months and 1 year at 0.895, based on a sample of 15 radio-instrumented kittens. More recently, however, the FWC has been visiting den sites of female Florida panthers and Texas puma females since 1992 and has documented the number of kittens that survived to 6 months of age for 38 of these litters (FWC 2004). Florida panther and Texas puma kitten survival to 6 months-of-age were estimated to be 52 and 72, respectively, but were not significantly different (P=0.2776) (FWC 2004). Average kitten survival, therefore, was 62 from birth to 6 months of age (FWC 2004). The FWC (2004) determined the survival of kittens greater than 6 months of age by following the fates of 55 radio-collared dependent-aged kittens, including 17 Texas puma descendants from 1985 to 2004. They found only 1 of these 55 kittens died before reaching independence (a 98.2 percent survival rate) (FWC 2004). Twenty-three of 24 female panthers, first captured as kittens, became residents and 18 (78.3 percent) produced litters. One female was too young to determine residency status (FWC 2004). Female panthers were considered as adult residents if they were older than 18 months of age, established home ranges and bred or if they were older than 3 years of age and established a home range (Maehr et al. 1991b). Twenty-eight of the 31 male panthers became residents; three males were too young to determine residency status (FWC 2004). Male panthers were considered residents if they were older than 3 years of age and established a home range that overlapped with females (FWC 2004). Females are readily recruited into the population as soon as they are able to breed (Maehr et al. 1991a). Age at first reproduction has been documented as early as 18 months for females (Maehr et al. 1989). However, 50 percent of known panther dens were initiated by females aged 2 to 4 years. Females aged 5 to 11 years initiated the remaining 50 percent. The first sexual encounters for males have occurred at about 3 years of age (Maehr et al. 1991a). Dispersing females are quickly assimilated into the resident population, typically establishing home ranges less than 1 home range width from their natal ranges (Maehr et al. 2002), while males usually go through a period as transient (non-resident) subadults, moving through the fringes of the resident population and often occupying suboptimal habitat until an established

21
range becomes vacant (Maehr 1997). Turnover in the breeding population is low and documented mortality in radio-collared panthers is greatest in subadult and non-resident males (Maehr et al. 1991b). Maehr (1990a) believes there is a lack of unoccupied suitable habitat for dispersing subadult Florida panthers, which may increase fighting among males, and successful male recruitment appears to depend on the death or home range shift of a resident adult male (Maehr et al. 1991a). However, more recent population data (FWC 2004) show an increase in population numbers, home ranges, and subadults panthers, which is in conflict with Maehr’s (1990a) data. The increase in panthers is believed to be associated in part with the genetic restoration benefits from the introduction of Texas cougars into the Florida panther population (FWC 2004). Natural genetic exchange with other panther populations ceased when the Florida panther became geographically isolated over a century ago (Seal et al. 1994). Isolation, reduced population size, and inbreeding resulted in loss of genetic variability and diminished health. Data on polymorphism and heterozygosity, along with records of multiple physiological abnormalities, suggest the panther population has experienced inbreeding depression (Roelke et al. 1993; Barone et al. 1994). Inbreeding depression has been related to decreased semen quality, lowered fertility, reduced neonatal survival, and congenital heart defects in a variety of domesticated and wild species (Lasley 1978; Ralls and Ballou 1982; Wildt et al. 1982; O’Brien et al. 1985; Roelke 1991). Congenital heart defects have been shown to be related to diminished panther survival and reproduction (Roelke 1991; Dunbar 1993; Barone et al. 1994). The Florida panther exhibits diminished male reproductive characteristics compared to other populations of Puma concolor in North and Latin America (Barone et al. 1994). In a comparison of 16 male Florida panthers and 51 males from Puma concolor populations in Texas, Colorado, Latin America, and North American zoos, Wildt (1994) found a much higher rate of unilateral cryptorchidism (43.8 versus 3.9 percent), lower testicular and semen volumes, diminished sperm motility, and a greater percentage of morphologically abnormal sperm in the Florida panther samples. Measured heterozygosity levels indicate the Florida panther has lost 60 to 90 percent of its genetic diversity (Culver et al. 2000). Measured levels of mitochondrial DNA variation are the lowest reported for any similarly studied feline population, including leopards, cheetahs, and other Puma concolor subspecies. Electrophoretic analyses also indicated the Florida panther has less genetic variation than any other Puma concolor subspecies. Panther DNA fingerprint variation is nearly as low as in the small, isolated population of Asiatic lions of the Gir Forest Sanctuary in India (Roelke et al. 1993). A genetic restoration program was initiated for the Florida panther in 1995. FWC (2001, 2003, 2004) indicated representation of Texas cougar genes in the south Florida population is probably close to the goal of 20 percent (Seal et al. 1994), although two of the eight Texas females are over-represented. The occurrence of kinked tails and cowlicks has been reduced in intercross progeny. Information on other morphological traits associated with genetic isolation and inbreeding such as cryptorchidism sperm deformities, atrial septal heart defects, and skull morphology cannot be collected until the intercross progeny mature or pass away. However, the fecundity of the intercross progeny would seem to indicate sperm deformities have been reduced.

22
For example, one first-generation male captured and examined in the field by Smithsonian Theriogenologist, Dr. Jo Gayle Howard, had a sperm count 3 times that of a Florida panther, a sperm motility rate twice as high, a percentage of normal sperm 4 times greater, and a sperm concentration 10 times higher (McBride 2001). Since the genetic restoration program was initiated in 1995, the number of panthers monitored annually has increased, highway mortality has increased, and panthers have moved into formerly unoccupied niches on public land in south Florida (McBride 2002). This may indicate a more robust population that varies dramatically from population parameters prior to 1995. However, Maehr and Lacy (2002) recommended caution in claiming success through genetic management. They state it is likely local prey populations cannot support the increased number of panthers over the long term, and as long as the panthers are restricted to southwest Florida, the problems of inbreeding and genetic variation that led to the genetic restoration program will return. Still, McBride (2002) states panther recovery continues to benefit from genetic restoration and an existing State land acquisition program (for large tracts of land) north of BCNP will provide additional benefits. Mortality, Trauma, and Disturbance Records of mortality on uncollared panthers have been kept since February 13, 1972, and records of mortality on radio-collared panthers have been kept since February 10, 1981. A total of 143 panther mortalities have been documented through June 2004, with 59 (41 percent) known deaths occurring in the past 4 years (FWC 2001, 2002, 2003, 2004). Overall, documented mortality (n = 99) of radio-collared and uncollared panthers averaged 3.4 per year through June 2001. However, from July 2001 through June 2004, documented mortality (n = 48) increased with an average of 16.0 per-year during these years (FWC 2002, 2003, 2004). Eighty-four free roaming, radio-collared panthers have died since 1981, and intraspecific aggression was the leading cause accounting for 41 percent of these mortalities (74 percent males and 26 percent females) (FWC 2004). Unknown causes and collisions with vehicles accounted for 24 percent and 19 percent of mortalities, respectively. Other factors (7 percent), infections (5 percent), and diseases (4 percent) caused the remaining mortalities (FWC 2004). Except for intraspecific aggression, the causes of mortality were found to be independent of gender (FWC 2004). It is likely, some causes, such as road mortality, are more likely to be found and, therefore, are over represented in the above total. Between February 13, 1972, and June 30, 2004, Florida panther vehicular trauma (n = 73), averaged 2.3 panthers per year (FWC 2004). From July 1, 2004, through October 12, 2005, there were 13 additional instances of vehicular trauma (FWC unpublished data), for a total of 86 instances. Instances of vehicular trauma have increased in recent years. Although the relative significance of vehicular trauma to other sources of mortality is not entirely known, it has been the most often documented source of mortality (Maehr 1989; Maehr et al. 1991b) because the death of uncollared panthers from other causes (e.g., intraspecific aggression, old age, disease, etc.) often goes undetected.

23
There are presently 28 wildlife underpasses with associated fencing suitable for panther use along I-75 (Figure 6) and, to date, no panthers have been killed by vehicles in areas protected with wildlife underpasses (FWC 2003). There are four underpasses suitable for panther use currently existing, and two additional underpasses presently proposed by the Florida Department of Transportation (FDOT) along U.S. Highway 29 (US 29) (Department of the Army Public Notice SAJ-2004-778) (Figure 6). Several additional panther/wildlife crossings are proposed along roadways in rural Lee and Collier Counties in addition to the proposals along US 29 (FWC 2001). In addition, Collier County, in cooperation with the National Wildlife Federation and the Florida Wildlife Federation, is coordinating a study of the segment of CR 846 east of Immokalee and the section of Oil Well Road (Service 2005) where the road crosses Camp Kies Strand by Dr. Reed Noss and Dr. Daniel Smith to determine the optimum location for wildlife crossing construction (WilsonMiller 2005). However, vehicular trauma still occurs on outlying rural roads and the FWC is conducting a study to determine the impacts of vehicular collisions to panthers and studying ways to minimize panther vehicle collisions (FWC In Review). In an examination of the location of panther-suitable wildlife crossings and locations of vehicular collisions, we note that after installation, no collisions have been recorded in the immediate vicinity of those crossings. There have been no collisions on east-west I-75 in the vicinity of crossings since installation in 1991. Prior to 1991, there were five recorded deaths from collisions. The FDOT has also identified the location of, the proposed the construction of, and the construction of several wildlife crossing on SR 29. Proposed crossings A and B (Figure 6) will be in an area of 10 documented collisions from 1980 to 2004. Existing crossings C and D, north of I-75, were installed in 1995. There were two recorded collisions in the vicinity of crossing D from 1979 to 1990, but none at either C or D since crossing installation. Existing crossing E was installed in 1997. There has been one collision approximately 1 mile to the north in 2002. Existing crossing F was installed in 1999. There was one documented collision in the immediate vicinity in 1981, but none since installation. However, there have been two collisions approximately 1.5 miles to the north since crossing installation. Florida panthers were hunted for bounty during the 1800s and for sport up until the 1950s (Tinsley 1970). Seven panther shootings, six fatal and one non-fatal, were documented between 1978 and 1986. A female Texas puma introduced for genetic restoration was shot in 1998 (FWC 1999). Education, self-policing among hunters and regulation are the tools by which shootings are minimized. All free-ranging pumas in Florida are protected by a “similarity of appearance” provision in the ESA (56 FR 40265-40267; August 14, 1991). Food Habits Florida panther food habit studies indicate commonly consumed prey include feral hog (Sus scrofa), white-tailed deer, raccoon (Procyon lotor), nine-banded armadillo (Dasypus novemcinctus), and alligator (Alligator mississippiensis) (Maehr et al. 1990a; Dalrymple and Bass 1996). Adult panthers generally consume one deer or hog per-week, supplemented by opportunistic kills of smaller prey (Maehr 1997). A female with kittens may need the equivalent of two such kills per-week. The high caloric intake needed to sustain successful reproduction and rearing of kittens is best achieved when a dependable supply of large prey is available

24
(Roelke 1990). Deer and hogs accounted for 85.7 percent of consumed biomass north of I-75 and 66.1 percent south of I-75 (Maehr et al. 1990a). Differences in prey abundance and availability were indicated by an eight-fold greater deer abundance north of I-75 versus south of I-75, although the estimated number of deer consumed did not differ between the north and south portions of the study area. Hog numbers were lower south of I-75. Hogs dominated the diet of panthers in the north in terms of both estimated biomass and numbers. In the south, deer accounted for the greatest estimated biomass consumed, whereas raccoons were the highest estimated number of prey items consumed. Domestic livestock were found infrequently in scats or kills, although cattle were readily available north of I-75 (Maehr et al. 1990a). There appears to be a consensus among land managers and Federal biologists that white-tailed deer and wild hogs are the dominant prey for panther, while rabbits, raccoon, and armadillos are of secondary importance (Beier et al. 2003). Prey Density Panther prey density, especially deer, is an important factor in evaluating panther habitat. The type and number of prey available affects the health and distribution of panthers, as well as their ability to breed and support young. Environmental factors, specifically the availability of high quality forage, affect the prey density and influence the carrying capacity and population dynamics of the prey species, especially deer herds (Fleming et al. 1993). In the Everglades region, deer inhabit a variety of landscape types, including pinelands, high ridges, and adjacent periphery wetlands, which include the mosaic of sawgrass and wet prairie savannahs and sloughs that comprise the interior freshwater marshes and coastal mangrove forest. Deer are ruminants, with small stomach capacities, and are selective for high quality forage to meet their nutritional needs. To meet these high quality forage needs, deer selectively move through the mosaic of habitat types taking advantage of the seasonal forage that provide the most benefit to the deer. Water management practices have reduced habitat heterogeneity and the sequence of seasonal and successional patterns of plant growth and appear to have affected deer abundance (Fleming et al. 1993). Other adverse changes in habitat characteristics that affect deer density include the invasion of exotics into native uplands, over drainage of marshes, and the establishment of monotypic stands of unpalatable plant species, generally resulting from nutrient enrichment related to agricultural and urban runoff. The replacement of these native plant communities reduces important habitat heterogeneity and the ability of deer to meet their critical dietary needs. For example, deer densities on over-drained, exotic species-infested private lands being developed in northwest Lee County averaged one deer per 591 acres (Turrell 2001) to one deer per 534 acres (Passarella 2004). As a contrasting example, in historic communities in the Everglades Wildlife Management Areas, deer densities in the mid-to-late 1950s averaged one deer per 100 acres (40 ha) when the vegetative community was a mosaic of native species, whereas more recent surveys after succession of the native community to a monotypic stand of cattails (1993) showed a 67 to 76 percent decrease (one deer per 300 acres to one deer per 475 acres) of the 1959 population estimate (Fleming et a1. 1993).

25
In further comparison to higher quality habitat communities, deer densities in wildlife management areas in the BCNP’s Corn Dance Unit were predicted to be between one deer per 165 acres and one deer per 250 acres (Steelman et al. 1999). However, deer densities in these units may also have been affected by off road vehicle use. Predictions of deer density in Fakahatchee Strand were estimated to be higher than one deer per 18.2 acres (McCown 1991). Deer densities in the Mullet Slough area of BCNP yielded an estimated density range of one deer per-93 acres and one deer per-250 acres. The Stairsteps Unit of BCNP support densities of one deer per-190 acres to one deer per-218 acres from track count estimates. Aerial surveys for the same units used after 1982, estimated deer densities between one deer per-60 acres and one deer per-2,643 acres (Steelman et a1. 1999). Harlow (1959) predicted deer density in wet prairie habitat in Florida to be one deer per-115 acres. Movements and Dispersal Adult Florida panthers occupy available habitat in a pattern similar to western cougars (Land 1994). More than 7,000 telemetry locations on 26 radio-collared panthers between 1985 and 1990 indicated home range size varied from 21 to 461 square-miles (53 to 1,194 square-km), averaging 200 square-miles (519 square-km) for resident males and 75 square- miles (193 square-km) for resident females. Beier et al. (2003) found estimates of panther home ranges varying from 74 to 153 square-miles (193 to 396 square-km or 47,359 to 97,920 acres) for females and 168 to 251 square-miles (435 to 650 square-km or 107,520 to 160,639 acres) for males to be reliable. The most current estimate of home-range sizes (minimum convex polygon method) for established, non-dispersing adult panthers, based on radio-collared panthers monitored during the 2003-2004 genetic restoration and management annual monitoring report (n = 37), averaged 60.3 square-miles (156.1 square km or 38,572 acres) for females (n = 22) and 160.6 square miles (416 square-km or 102,794 acres) for males (n = 10) (FWC 2004). Home ranges of resident adults were stable unless influenced by the death of other residents and home range overlap was extensive among resident females and limited among resident males (Maehr et al. 1991a). Maehr et al. (1990b) monitored five solitary panthers continuously for 130-hour periods seasonally from 1986 to 1989, rarely observing measurable shifts in location during the day, but nocturnal shifts in location exceeding 20 km (12.4 miles) were not unusual. Maehr et al. (2002) in a later report documents a “mean maximum dispersal distance” of 42.3 miles (68.1 km) for subadult males and 12.6 miles (20.3 km) for subadult females. In the same report Maehr et al. (2002) documents a “mean dispersal distance” of 37.3 km for subadult males. Dispersal patterns tend to be circular and of insufficient length to ameliorate inbreeding. Comiskey et al. (2002) documents a “mean dispersal distance” for subadult male panthers as an average distance of 40.1 km (24.9 miles) from their natal range, which is similar to the dispersal distance reference by Maehr et al. (2002). Subadult dispersal typically occurs around 1.5 to 2 years of age, but may occur as early as 1 year of age. Dispersing males wander widely through unforested and disturbed areas (Maehr 1992a).

26
Janis and Clark (1999) compared the behavior of panthers before, during, and after the recreational deer and hog-hunting season (October through December) in areas opened (BCNP) and closed (Florida Panther NWR, Fakahatchee Strand State Preserve) to hunting. The variables examined were: (1) morning activity rates; (2) movement rates; (3) predation success; (4) home range size; (5) home range shifts; (6) habitat selection; (7) distance from panther locations to trails; and (8) frequency of panther use in the Bear Island Unit of BCNP. The authors failed to detect any relationship between hunting and the first 6 variables. Of the last 2 variables, they determined the distance of panther locations from trails increased an average of 0.31 mile (0.57 km) and the frequency of panther use in the Bear Island Unit decreased from 30 up to 40 percent during the hunting season. An analysis of movement rates, a measure of energy expenditure, predation success, and energy intake do not indicate any direct, negative energetic responses to increased human activity during the hunting season. However, the increase in average distance from trails and decrease in panther use of the Bear Island Unit are indicative of a behavioral change. Janis and Clark (1999) surmise the increase in the distance of panther locations from trails is “biologically minor” and probably related to prey behavior (i.e., white-tailed deer moving deeper into the forest to avoid hunters). The decrease in panther use of the Bear Island Unit is balanced by an increase in use of private lands north of BCNP as “refugia.” However, Beier et al. (2003) finds this and other studies of hunting impacts to panthers to be inconclusive. Disturbance Panthers, because of their wide-ranging movements and extensive spatial requirements, are also particularly sensitive to habitat fragmentation (Harris 1985). Mac et al. (1998) defines habitat fragmentation as “The breaking up of a habitat into unconnected patches interspersed with other habitat which may not be inhabitable by species occupying the habitat that was broken up. The breaking up is usually by human action, as, for example, the clearing of forest or grassland for agriculture, residential development, or overland electrical lines.” The reference to “unconnected patches” is a central underpinning of the definition. For panther conservation, this definition underscores the need to maintain corridors connecting habitat in key locations of south Florida. Habitat fragmentation can result from road construction, urban development, and agricultural land conversions within migratory patterns of panther prey species and affect the ability of panthers to move freely throughout their home ranges. Construction of highways in wildlife habitat typically results in loss and fragmentation of habitat, traffic related mortality, and avoidance of associated human development. Roads can also result in habitat fragmentation, especially for females who are less likely to cross them (Maehr 1990a). Kautz et al. (In Review) estimated approximately 25 percent of panther habitat within Primary, Secondary, and Dispersal Zones, is on private land. Maehr (1990a) indicated development of private lands may limit panther habitat to landscapes under public stewardship. From March 1984 through August 2005, the Service concluded consultation on 57 projects involving the panther and habitat preservation. The minimum expected result of these projects is impacts to 88,961 acres and the preservation of 28,984 acres of panther habitat (Table 1). Of the 88,961 acres of impacts, 39,918 are due to agricultural conversion and 49,043 acres to development and mining. Portions (10,370 acres) of the largest agricultural conversion project,

27
the 28,700 acres by U.S. Sugar Corporation, were re-acquired by the Federal Government as a component of the Talisman Land Acquisition (Section 390 of the Federal Agricultural Improvement and Reform Act of 1996 [Public Law 104-127] Farm Bill Cooperative Agreement, FB4) for use in the Comprehensive Everglades Restoration Project. The non-agriculture impacts are permanent land losses, whereas the agricultural conversions may continue to provide some habitat functional value to panthers, depending on the type of conversion. However, these land conversions provide less functional value than native habitats. The 49,043 acres of expected impacts from development and mining included a mixture of agricultural fields consisting of row crops and citrus groves and natural lands with varying degrees of exotic vegetation. Management actions on some of the lands preserved include exotic species removal, fire management, wetland hydrology improvement, improved forest management practices, and recreational benefit improvements. Habitat Management Prescribed burning is probably the single most important habitat management tool available to public land stewards. Dees et al. (1999, 2001) examined panther use of habitat in response to prescribed burning at Florida Panther NWR and BCNP between 1989 and 1998. The greatest temporal response by panthers to burning in pine was within 1 year followed by a decline in subsequent years and is likely due to the rapid re-growth of vegetation, which attracted prey (Dees et al. 2001). Panthers demonstrated notable selection for pine stands that had been burned within 1 year relative to older burns. Compositional analysis showed that panthers were more likely to position their home ranges in areas that contained pine. Dees et al. (2001) suggest that panthers were attracted to less than 1-year-old burns because of white-tailed deer and other prey responses to vegetation and structural changes caused by prescribed fire. According to Dees et al. (2001), it was the effect of burning in pine, rather than the pine per se, which most influenced habitat selection by panthers. However, they caution that the effects of shorter burning intervals on vegetation composition and landscape-level changes be determined before burning rotations are reduced. To counteract the threat of exotic species invasion and monotypic stands of unpalatable plant species, all public land and most private land managers pursue exotic and invasive species management and habitat improvement through fire management and eradication programs. However, these actions are restricted by available funds to implement these programs. Land Conservation Trends The 1.4-million-acre ENP was established in 1947, more than 2 decades before the Florida panther was listed as endangered. The 577,000-acre BCNP was established in 1974, just 1 year after passage of the ESA. Additional State and Federal acquisitions since the establishment of ENP and BCNP include Fakahatchee Strand Preserve State Park (58,373 acres), Florida Panther NWR (26,400 acres), Picayune Strand State Forest (55,200 acres), Collier-Seminole State Park (7,271 acres), Okaloacoochee Slough State Forest (34,962 acres), and CREW (24,028 acres). As of April 2001, non-profit organizations, local governments, State and Federal agencies, and Tribes have protected approximately 2.21 million acres of panther habitat south of the

28
Caloosahatchee River within the Primary, Secondary, and Dispersal Zones (Kautz et al. In Review). These protected lands are the cornerstones for the Service’s continuing effort to work in tandem with the private sector and State and county government, to preserve and manage panther habitat. These lands are protected by conservation easements or transferred by title to public entities to manage. Distribution A variety of human activities contributed to the decline of the Florida panther. The first bounty on Florida panthers was passed in 1831. An 1887 Florida law authorized a payment of 5 dollars for scalps (Tinsley 1970). Panthers were also shot on sight, hunted, poisoned, and trapped. Agricultural land clearing in the southeastern United States between 1850 and 1909 totaled 31.6 million acres (12.8 million ha). Lumbering reduced the original southern forest nearly 40 percent from 300 million acres (121.4 million ha) to 178 million acres (72.0 million ha) by 1919 (Williams 1990). Meanwhile the white-tailed deer, primary prey of the panther, was reduced from a range-wide population of about 13 million in 1850, to under 1 million by 1900 (Halls 1984). Over a 100-year period, bounty hunting, land clearing, lumbering, and market hunting of deer contributed to the range-wide decline of the panther. At the beginning of the 20th century, the Florida panther population may have numbered as many as 500 (Seal et al. 1989). The State of Florida declared the panther a game species in 1950 and in 1958 totally protected the animal. In the 1970s, the FWC established a Florida Panther Record Clearinghouse to ascertain the status of the panther. The first field searches were made in 1972. The Florida Panther Act, a State law enacted in 1978, made killing the panther a felony. Telemetry investigations began in 1981, primarily on public lands in southwest Florida. Maehr et al. (1991a) estimated the average density of panthers in southwest Florida between February and July 1990 to be one panther per 42.95 square miles (110 square km or 27,456 acres). When extrapolated over a 1,945.9-square-mile (5,040-square-km or 1,257,979-acre) area thought to be occupied by radio-collared panthers in southwest Florida, the estimated population of the area was 46 adults (9 resident males, 28 resident females, and 9 transient males) between December 1985 and October 1990. This estimate assumed homogeneous density and similar age and sex composition over time and space. Maehr et al. (1991a) considered the actual population to be higher because the estimation technique excluded panthers in ENP, eastern BCNP, and areas north of the Caloosahatchee River. The Florida Panther Interagency Committee, comprised of the Service, National Park Service, Florida Department of Environmental Protection, and the FWC, estimated the population in 1993 at 30 to 50 adults (Logan et al. 1993). More recent estimates show a panther population (adults and subadults) of 62 in 2000 (McBride 2000), 78 in 2001 (McBride 2001), 80 in 2002 (McBride 2002), and 87 in 2003 (69 adults and 18 yearlings) (FWC 2003). No documented population number has been provided by FWC for 2004 to date. However, D. Land (FWC, personal communication, November 2004) estimates the population to be between 70 and 100 panthers.

29
Human persecution over a 100-year period, along with bounty hunting, land clearing, lumbering, and market hunting of deer, resulted in a range-wide decline of the panther, and as a result panthers now occupy just 5 percent of their former range. The remaining breeding population is in south Florida, south of the Caloosahatchee River. Dispersing males occasionally cross the Caloosahatchee River and have been observed in rural habitats of south-central Florida. In the south Florida breeding population, habitat loss, habitat fragmentation, habitat degradation, and increased human disturbance resulting from agricultural and residential development are now considered among the primary threats to long-term panther persistence. Continued development associated with the expansion of Florida's urbanized east coast, urban development on the west coast, and the spread of agricultural development in the south Florida interior, have placed increasing pressure on panthers and panther habitat (Maehr 1990b, 1992b; Maehr et al. 1991a). Past land use activity, hydrologic alterations, road construction, and lack of fire management (Dees et al. 1999) have also affected the quality and quantity of panther habitat. In southwest Florida, agriculture development between 1986 and 1990 resulted in a row crop acreage increase of 8,990 acres (3,640 ha) or 21 percent; a sugarcane increase of 16,000 acres (6,475 ha) or 21 percent; and a citrus increase of 54,000 acres (21,850 ha) or 75 percent. Rangeland, much of it suitable for panther occupation, decreased by 160,000 acres (64,750 ha) or 10 percent. In a more current analysis, (B. Stys, FWC, unpublished data, 2002) performed a change detection analysis for Collier, Lee, Hendry, Charlotte, and Glades Counties, and found the area of disturbed lands in these five counties increased 31 percent between 1986 and 1996. Most (66 percent) of the land use change over the 10-year period was due to conversion to agricultural. Forest cover types accounted for 42 percent of land use conversions, dry prairies accounted for 37 percent, freshwater marsh accounted for 9 percent, and shrub/brush lands accounted for 8 percent. Residential, commercial, and industrial development projects may have an adverse direct effect on the Florida panther through: (1) the permanent loss and fragmentation of panther habitat; (2) the permanent loss and fragmentation of habitat that supports panther prey; (3) the loss of available habitat for foraging, breeding, and dispersing panthers; and (4) a reduction in the geographic distribution of habitat for the species. Indirect effects may include: (1) an increased risk of roadway mortality to panthers traversing the area due to the increase in vehicular traffic; (2) increased disturbance to panthers in the project vicinity due to human activities; (3) the reduction in panther prey; (4) the reduction in value of panther habitat adjacent to the project due to habitat fragmentation; and (5) a potential increase in intraspecific aggression between panthers (and an increase in mortality of subadult male panthers) due to reduction of the geographic distribution of habitat for the panther. Verified Panther Population In September 2003, the documented south Florida panther population was 87 adults and subadults, not including kittens at the den (FWC 2003). The south Florida panther population has shown an increase in the survivability of young and juveniles (McBride 2003) and an increase in the population estimates from 62 in 2000 (McBride 2000) to 78 in 2001 (McBride

30
2001) to 80 in 2002 (FWC 2002) to 87 in 2003 (FWC 2003). No documented population number has been provided by FWC for 2004; however, D. Land (FWC, personal communication, November 2004) estimates the population to be between 70 and 100 panthers. McBride (Livestock Protection Company, personal communication, November 2004) plans to provide a verified population count in 2005 and expects, due to the extent of mortalities this year, the population estimate may be lower than last year. Population Dynamics PVA has emerged as key components of endangered species conservation. This process is designed to incorporate demographic information into models that predict if a population is likely to persist in the future. PVAs incorporate deterministic and stochastic events including demographic and environmental variation, and natural catastrophes. PVAs have also been criticized as being overly optimistic about future population levels (Brook et al. 1997) and should be viewed with caution; however, they are and have been shown to be surprisingly accurate for managing endangered taxa and evaluating different management practices (Brook 2000). They are also useful in conducting sensitivity analyses to determine where more precise information is needed (Hamilton and Moller 1995; Beissinger and Westphal 1998; Reed et al. 1998; Fieberg and Ellner 2000). As originally defined by Shaffer (1981), “a minimum viable population for any given species in any given habitat is the smallest isolated population having a 99 percent chance of remaining extant for 1,000 years despite the foreseeable effects of demographic, environmental and genetic stochasticity, and natural catastrophes.” However, the goal of 95 percent probability of persistence for 100 years is the standard recommended by population biologists and is used in management strategies and conservation planning, particularly for situations where it is difficult to accurately predict long-term effects (Sarkar 2004; Shaffer 1978, 1981, 1987). A total of 108 Florida panthers since 1981 have been radio-collared and monitored on public and private lands throughout south Florida (Maehr et al. 2002; Shindle et al. 2001). These data were used by researchers to estimate survival rates and fecundity and were incorporated into PVA models previously developed for the Florida panther (Cox et al. 1994; Kautz and Cox 2001; Seal et al. 1989, Seal and Lacy 1992; Maehr et al. 2002). These models incorporated a range of different model parameters such as general sex ratios, juvenile survival rates, age distributions, and various levels of habitat losses, density dependence, and intermittent catastrophes or epidemics. The outputs of these models predicted a variety of survival scenarios for the Florida panther and predicted population levels needed to ensure the survival of the species. The Service, in February 2000, in order to develop an updated landscape-level strategy for the conservation of the Florida panther population in south Florida, appointed the Florida Panther Subteam. This Subteam is part of the overarching MERIT. MERIT includes more than 30 members representing Federal, State, and local governmental agencies, the Seminole Tribe of Florida, the Miccosukee Tribe of Indians of Florida, academia, industry, and the private sector, and was created with the purpose of overseeing the implementation of the recovery and restoration tasks identified in the MSRP. One of the actions the Subteam evaluated was the

31
current status of the Florida panther and the various PVA models developed. Based on this assessment, members of the Subteam requested the development of an updated set of PVA models for the Florida panther. These models, developed and presented by Root (2004), were based on RAMAS GIS software (Akçakaya 2002). These models were used to perform a set of spatially explicit PVAs. Three general single-sex (i.e., females only) models were constructed using demographic variables from Maehr et al. (2002) and other sources. A conservative model was based on Seal and Lacy (1989); a moderate model was based on Seal and Lacy (1992); and an optimistic model was based on the 1999 consensus model of Maehr et al. (2002). In each model, first-year juvenile survival was set at 62 percent based on recent information from routine panther population monitoring (Shindle et al. 2001). All models assumed a 1:1 sex ratio, a stable age distribution, 50 percent of females breeding in any year, and an initial population of 41 females (82 individuals including males), the approximate population size in 2001-2002 (McBride 2001, 2002). Basic Versions: The basic versions of each model incorporated no catastrophes or epidemics, no change in habitat quality or amount, and a ceiling type of density dependence. The basic versions of the models incorporated a carrying capacity of 53 females (106 panthers - 50/50 sex ratio). Variants of the models were run with differing values for density dependence, various levels of habitat loss, and intermittent catastrophes or epidemics. Each simulation was run with 10,000 replications for a 100-year period. The minimum number of panthers needed to ensure a 95 percent probability of persistence for 100 years was estimated in a series of simulations in which initial abundance was increased until probability of extinction at 100 years was no greater than 5 percent. More detailed information concerning the PVA model parameters appears in Root (2004). The results of these model runs predicted a probability of extinction for the conservative model of 78.5 percent in 100 years with a mean final total abundance of 3.5 females. Also, the probability of a large decline in abundance (50 percent) was 94.1 percent. The moderate model resulted in a 5 percent probability of extinction and mean final abundance of 42.3 females in 100 years. The probability of panther abundance declining by half the initial amount was 20 percent in 100 years under the moderate model. The optimistic model resulted in a 2 percent probability of extinction and mean final abundance of 51.2 females in 100 years. The probability of panther abundance declining by half the initial amount was only 9 percent in 100 years under the optimistic model. These models also provide a probability of persistence (100 percent minus probability of extinction) over a 100-year period of 95 percent for the moderate model and 98 percent for the optimistic model. One Percent Habitat Loss: Model results were also provided by Root (2004) for probability of extinctions for 1 percent loss of habitat, within the first 25 years of the model run. The 1 percent loss of habitat equates to essentially all remaining non-urban privately owned lands in the Primary Zone and corresponds to the estimated rate of habitat loss (Root 2004) from 1986 to 1996 for the five southwest counties based on land use changes. For the moderate model, the model runs predict a probability of extinction increase of approximately one percent, from a

32
probability of extinction of approximately 5 percent with no loss of habitat to 6 percent with 1.0 percent habitat loss per year, for the first 25 years. For the optimistic model, probability of extinction increased from approximately 2 percent with no loss of habitat to 3 percent with 1.0 percent habitat loss per year, for the first 25 years. These models also predicted that the mean final abundance of females would decrease from 41 to 31 females, a 24.3 percent reduction for the moderate model and from 41 to 38 females, a 7.3 percent reduction for the optimistic model. The model runs also predict a probability of persistence (100 percent minus the probability of extinction) over a 100-year period of approximately 94 percent for the moderate model and 97 percent for the optimistic model. The model runs, predict a mean final abundance of 62 individuals (31 females and 31 males) for the moderate model and 76 individuals (38 females and 38 males) for the optimistic model. Population Guidelines: Kautz et al. (In Review), following review of the output of Root’s PVA models and those of other previous PVAs for the Florida panther, suggested a set of population guidelines for use in management and recovery of the Florida panther. It is important to state that these broad guidelines represent a review of previous science, and not a new PVA. These guidelines are: (1) populations of less than 50 individuals are likely to become extinct in less than 100 years; (2) populations of 60 to 70 are barely viable and expected to decline by 25 percent over 100 years; (3) populations of 80 to 100 are likely stable but would still be subject to genetic problems (i.e., heterozygosity would slowly decline); and (4) populations greater than 240 have a high probability of persistence for 100 years and are demographically stable and large enough to retain 90 percent of original genetic diversity. Population guidelines for populations of panthers between 50 and 60 individuals and between 70 and 80 individuals were not specifically provided in Kautz et al. (In Review). However, the Service views the guidelines in Kautz et al. (In Review) as a continuum. Therefore, we consider populations of 50 to 60 individuals to be less than barely viable or not viable with declines in population and heterozygosity. Similarly, we consider populations of 70 to 80 to be more than barely viable or somewhat viable with some declines in population and heterozygosity. Like other population guidelines presented in Kautz et al. (In Review), these assume no habitat loss or catastrophes. PVA Summaries and Population Guidelines: Root’s (2004) moderate model runs, which have a carrying capacity 53 females (106 individuals), show final populations of 42.3 females (84 total) and 31.2 females (62 total) with extinction rates of 5 percent and 6 percent, respectively for the basic and 1 percent habitat loss scenarios. The predicted final populations in Root (2004) are 84 and 62 panthers for no loss of habitat and 1 percent loss of habitat, respectively, over a 100-year period. Kautz et al.’s population guidelines applied to the Root (2004) moderate models for a population of 62 to 84 panthers, with or with/out habitat loss, respectively, describe the “with habitat loss” population as barely viable and expected to decline by 25 percent over a 100-year period. The “without habitat loss” is likely stable but would still be subject to genetic problems.

33
In conclusion, the Service believes the model runs show that lands in the Primary Zone are important to the survival and recovery of the Florida panther and that sufficient lands need to be managed and protected in southwest Florida to provide for a population of 80 to 100 panthers, the range defined as likely stable over 100 years, but subject to genetic problems. As discussed in the following section, the Service has developed a southwest Florida panther conservation goal that, through regulatory reviews and coordinated conservation efforts with land owners and resource management partners, provides a mechanism to achieve this goal. Model Violations: The actual likelihood of population declines and extinctions may be different than the guidelines and models suggest, depending upon the number of and severity of assumptions violated. The Service realizes that habitat loss is occurring at an estimated 0.8 percent loss of habitat per year (R. Kautz, FWC, personal communication, 2003). The Service has accounted for some habitat loss and changes in habitat quality within its regulatory program, and specifically through its habitat assessment methodology (discussed in the Effects of the Action). For example, we have increased the base ratio used within this methodology to account for unexpected increases in habitat loss. Similarly, we consider changes in habitat quality and encourage habitat restoration wherever possible. With regard to the assumption of no catastrophes, the Service has considered the recent outbreak of feline leukemia in the panther population at Okaloacoochee Slough as a potential catastrophe. However, the FWC is carefully monitoring the situation and it appears to be under control at this time due to a successful vaccination program. However, if the outbreak spreads into the population, the Service will consider this as a catastrophe and factor this into our decisions. We acknowledge that uncertainties exist, assumptions can be violated, and catastrophes can occur. However, the Service and the FWC, along with our partners, will continue to monitor the panther population and the south Florida landscape and incorporate any new information and changes into our decision-making process. Panther Habitat Conservation Plans: In the early 1990s, two plans for the protection of Florida panther habitat in south Florida were developed (Logan et al. 1993; Cox et al. 1994). Both of these plans identified privately owned lands that contained habitats important to the long-term conservation of the Florida panther. Logan et al. (1993) identified specific parcels of land by section, township, and range as Priority 1 and 2 preservation areas. However, this plan has been criticized as being too general (i.e., targeted lands perceived as including too many areas not truly panther habitat [active rock and sand mines]) and for not having been available for public review and comment prior to publication. Cox et al.’s (1994) plan identified specific lands based on their habitat features and the likelihood they could support a minimally viable population of panthers for the next 200 years. The lands identified in each of these planning studies, although referred to in the studies as essential to the survival and recovery of the Florida panther, were intended to be guides for land acquisition planning purposes, because of their inclusion of lands containing urban developments and other lands not considered truly panther habitat (i.e., active rock and sand mines). These land preservation recommendations have been used by Federal, State, and county resource

34
agencies as guides for public land acquisition programs, local land-use planning, and, in a few cases, compensation for land-use conversion projects proposed for lands identified in the plans. An example of use of these planning studies is shown in Figure 7. This figure provides a representative view of the existing and proposed public land acquisition and preservation efforts within the southwest Florida landscape that not only benefits the Florida panther, but also provides benefits to the mosaic of other species important to the south Florida ecosystem. Table 2 provides a summary of the targeted and acquired acreages of conservation lands in southwest Florida. Based on the table, total lands targeted for acquisition to date are 3,588,749 acres. Panther Recovery Goal: The 1987, 1995, and 1999 recovery objectives (Service 1987, 1995, 1999) for the panther were to achieve three viable, self-sustaining populations within the historic range of the Florida panther. In 2001, a new Florida Panther Recovery Team was appointed to revise the recovery plan. Although preliminary, the revised recovery objectives established in 2004 continue to be to achieve at least three self-sustaining, viable breeding populations of panthers within the historic range. A high priority for recovery and conservation of the Florida panther is to ensure the survival of the existing breeding population south of the Caloosahatchee River. The Service’s southwest Florida panther recovery goal is to achieve this priority and to identify lands north of the Caloosahatchee River that can be the recipient area for the expansion of the South Florida panther breeding population from south of the Caloosahatchee River to other parts of its historic range. We believe sufficient lands may be found north of the Caloosahatchee River and possibly elsewhere throughout the southeast (Thacher et al. 2003), in conjunction with the lands conserved south of the river, to support a population of greater than 240 individuals. The PVA models discussed in the previous section, and in detail in Root (2004) predict a population of greater than 80 individuals is needed for stability over a 100-year period, although subject to genetic problems and a population greater than 240 is needed to retain 90 percent of original genetic diversity. The Service also believes a stable population in southwest Florida will serve as the founder population for the recovery of the Florida panther throughout its historic range. Land Preservation Needs: To further refine the land preservation needs of the Florida panther and to specifically develop a landscape-level program for the conservation of the Florida panther population in south Florida, the Service as previously discussed, in February 2000, appointed a Florida Panther Subteam. The Subteam in addition to the assignments discussed previously, was also charged with developing a landscape-level strategy for the conservation of the Florida panther population in south Florida. The results of this collaborative effort are partially presented in Kautz et al. (In Review). One of the primary goals of this effort was to identify a strategically located set of lands containing sufficient area and appropriate land cover types to ensure the long-term survival of the southwest population of the Florida panther (Figure 8). Kautz et al. (In Review) focused their efforts on the area south of the Caloosahatchee River, where the reproducing panther population currently exists.

35
Kautz et al. (In Review) created an updated Florida panther potential habitat model based on the following criteria: (1) forest patches greater than 4.95 acres (2 ha); (2) non-urban cover types within 656 ft (200 m) of forest patches; and (3) exclusion of lands within 984 ft (300 m) of urban areas. The potential habitat map was reviewed in relation to telemetry data, recent satellite imagery (where available), and panther home range polygons. Boundaries were drawn around lands defined as the Primary Zone (Figure 9), defined as the most important area needed to support a self-sustaining panther population. Kautz et al. (In Review) referred to these lands as essential, however, as observed in the two previous plans (Logan et al. 1993; Cox et al. 1994), lands within the boundaries of the Primary Zone included some urban areas and other lands not considered to be truly panther habitat (i.e., active rock and sand mines). The landscape context of areas surrounding the Primary Zone was modeled and results were used to draw boundaries of the Secondary Zone (Figure 9), defined as the area capable of supporting the panther population in the Primary Zone, but where habitat restoration may be needed (Kautz et al. In Review). Kautz et al. (In Review) also identified, through a least cost path model, the route most likely to be used by panthers dispersing out of south Florida, crossing the Caloosahatchee River, and dispersing into south-central Florida. Kautz et al. (In Review) used ArcView GIS© version 3.3 and ArcView Spatial Analyst© version 2 (Environmental Systems Research, Incorporated, Redlands, California) to construct the least-cost path models and identify optimum panther dispersal corridor(s). The least-cost path models operated on a cost surface that ranked suitability of the landscape for use by dispersing panthers with lower scores indicating higher likelihood of use by dispersing panthers. The lands within the boundaries of the least cost model prediction were defined as the Dispersal Zone (Figure 9). The preservation of lands within this zone is important for the survival and recovery of the Florida panther, as these lands are the dispersal pathways for expansion of the south Florida panther population. The Primary Zone covers 2,270,590 acres (918,895 ha); the Secondary Zone covers 812,104 acres (328,654 ha); and the Dispersal Zone covers 27,883 acres (11,284 ha); providing a total of 3,110,578 acres (1,258,833 ha) (Kautz et al. In Review). The combined acreage of lands within the Primary, Dispersal, and Secondary Zones is 3,110,577 acres (1,258,833 ha) (Kautz et al. In Review). As part of their evaluation of occupied panther habitat, in addition to the average density estimate of one panther per 27,181 acres (11,000 ha) developed by Maehr et al. (1991a), Kautz et al. (In Review) estimated the present average density during the timeframe of the study, based on telemetry and other occurrence data, to average 1 panther per 31,923 acres (12,919 ha). In the following discussions of the number of panthers that a particular zone may support, the lower number is based on the 31,923 acres (12,919 ha) value (Kautz et al. In Review) and the higher number is based on the 27,181 acres (11,000 ha) value (Maehr et al. 1991a). Based on these average densities, the Primary Zone could support 71 to 84 panthers; the Secondary Zone 8 to 10 panthers without habitat restoration and 25 to 30 panthers with habitat restoration (existing high quality panther habitat currently present in the Secondary Zone is estimated at 32 percent of the available Secondary Zone lands); and the Dispersal Zone,

36
0 panthers. Taken together, the three zones in their current condition apparently have the capacity to support approximately 79 to 94 Florida panthers. Kautz et al.’s (In Review) assessment of available habitat south of the Caloosahatchee River determined that non-urban lands in the Primary, Secondary, and Dispersal Zones were not sufficient to sustain a population of 240 individuals south of the Caloosahatchee River. However, Kautz et al. (In Review) determined sufficient lands were available south of the Caloosahatchee River to support a population of 79 to 94 individuals (although not all lands are managed and protected). Southwest Florida Panther Population Goal: As stated previously, the Service’s goal for Florida panther conservation in southwest Florida is to locate, preserve and restore sets of lands containing sufficient area and appropriate land cover types to ensure the long-term survival of a population of 80 to 100 individuals (adults and subadults) south of the Caloosahatchee River. The Service proposes to achieve this goal through land management partnerships with private landowners, through coordination with private landowners during review of development proposals, and through sensitive land management and acquisition programs with Federal, State, local, private, and Tribal partners. The acreages of lands necessary to achieve this goal, based on Kautz et al. (In Review) average density of 31,923 acres (12,919 ha) per panther is 2,551,851 acres (1,032,720 ha) for 80 panthers or 3,189,813 acres (1,290,900 ha) for 100 panthers. The principle regulatory mechanisms that allow the Service to work directly with private land owners during review of development and land alteration projects are through section 7 and section 10 consultations under ESA. Section 7 consultations, which are the more common consultations, are primarily with the Corps. In August 2000, the Service, to assist the Corps in assessing project effects to the Florida panther, developed the Florida panther final interim SLOPES (Service 2000). The Florida panther SLOPES provide guidance to the Corps for assessing project effects to the Florida panther and recommends actions to minimize these effects. The Florida panther SLOPES also includes a consultation area map (Figure 4) that identifies an action area where the Service believes land alteration projects may affect the Florida panther and is used by the Corps project managers in evaluating consultation needs with the Service. Compensation Recommendations: To achieve our goal to locate, preserve and restore sets of lands containing sufficient area and appropriate land cover types to ensure the long-term survival of a population of Florida panthers south of the Caloosahatchee River, the Service chose the mid point (90 panthers) in Kautz et al.’s (In Review) population guidelines that a population of 80 to 100 panthers is likely to be stable, although subject to genetic problems, through 100 years. More importantly, a population of 90 individuals is eight individuals greater than a population of 82 individuals, which according to the best available PVA (Root 2004) is 95 percent likely to persist over 100 years (assuming a 50:50 male to female ratio). These eight individuals provide a buffer for some of the assumptions in Root’s PVA. Our process to determine compensation recommendations for project affects that cannot be avoided in both our section 7 and section 10 consultations is based on the amount and quality of habitat that we believe is necessary to support a population of 90 panthers in southwest Florida.

37
The Service, based on Kautz et al.’s (In Review) average panther population density of 31,923 acres per panther determined 2,873,070 acres of Primary Zone “equivalent” lands need to be protected and managed. This equivalency factor is needed, since Secondary Zone lands are of less value than Primary Zone lands to the panther, to assure that additional acreage (special consideration) is required in the Secondary Zone to compensate for its lower quality panther habitat. In other words, more than 31,923 acres per panther would be needed, hypothetically, if this acreage were all in the Secondary Zone (see discussion of Primary Zone equivalent lands in the Effects of the Action). The combined acreage of lands within the Primary, Dispersal, and Secondary Zones is 3,110,577 acres (1,258,833 ha) (Kautz et al. In Review). Currently, 2,094,988 acres of Primary Zone equivalent lands are preserved, so 778,082 additional acres need to be preserved to support a population of 90 panthers in south Florida (2,873,070 minus 2,094,988 equals 778,082). The SLOPES consultation area map, as previously discussed included lands north of the Caloosahatchee River and “Other” Zone lands. Since the Service’s southwest Florida panther conservation goal is to focus on habitat conservation in the Primary, Secondary, and Dispersal Zones, which are south of the Caloosahatchee River, conservation recommendations for projects south of the Caloosahatchee River are restricted to south of and conservation recommendations for projects north of the Caloosahatchee River are restricted to north of the Caloosahatchee River, respectively. To evaluate project effects to the Florida panther, the Service considers the contributions the project lands provide to the Florida panther, recognizing not all habitats provide the same functional value. Kautz et al. (In Review) also recognized not all habitats provide the same habitat value to the Florida panther and developed cost surface values for various habitat types, based on use by and presence in home ranges of panthers. The FWC (In Review), using a similar concept, assigned likely use values of habitats to dispersing panthers. FWC’s habitat were assigned habitat suitability rank between 0 to 10, with higher values indicating higher likely use by dispersing panthers. The Service chose to evaluate project effects to the Florida panther through a similar process. We incorporated many of the same habitat types referenced in Kautz et al. (In Review) and FWC (In Review) with several adjustments to the assigned habitat use values reflecting consolidation of similar types of habitats and the inclusion of Everglades Restoration water treatment and retention areas. We used these values as the basis for habitat evaluations and the recommended compensation values to minimize project effects to the Florida panther (Table 3) (see the detailed discussion of the application of the habitat assessment methodology in the Environmental Baseline). ENVIRONMENTAL BASELINE The environmental baseline includes the past and present impacts of all Federal, State, or private actions and other human activities in the action area, the anticipated impacts of all proposed Federal projects in the action area that have already undergone formal or early section 7

38
consultation, and the impact of State or private actions, which occur simultaneously with the consultation in progress. Status of the Species within the Action Area As stated previously, for the purposes of this consultation, the action area includes the Corps’ project area and surrounding lands frequently visited by panthers (Figure 5). The action area is a subset of the current geographic range of the panther and includes those lands that the Service believes may experience direct and indirect effects from the proposed development. Therefore, for both direct and indirect effects, the action area is defined as all lands within a 25-mile radius of the project. This action area does not include urban lands, lands west of I-75, and lands that are outside of the Service’s panther consultation area. The proposed action may have direct and indirect effects on the ability of panthers to breed, feed, and find shelter, and to disperse within the population. The Service used current and historical radio-telemetry data, information on habitat quality, prey base, and evidence of uncollared panthers to evaluate panther use in the action area. Panther telemetry data are collected 3 days per-week from fixed-wing aircraft, usually in early to midmorning. However, researchers have shown that panthers are most active between dusk and dawn (Maehr et al. 1990a, Beier 1995) and are typically at rest in dense ground cover during daytime monitoring flights (Land 1994). Therefore, telemetry locations may present an incomplete picture of panther activity patterns and habitat use (Comiskey et al. 2002). In addition, telemetry data alone may be misleading since less than half of the panther population is currently monitored. Although telemetry data may not provide a complete picture of panther activity patterns, telemetry locations are a good indicator, due to the extensive data set, of the approximate boundaries of home ranges, panther travel corridors, and the range of Florida panthers south of the Caloosahatchee River. The FWC also uses observational data collected during telemetry flights to assess the yearly breeding activity of radio-collared panthers. Female panthers accompanied by kittens or male panthers within close proximity of an adult female were assumed to have engaged in breeding activity during that year. Documentation by McBride (FWC 2003) shows that between July 2002 and June 2003, 12-collared panthers, 4-uncollared females, and 3-uncollared males had home ranges in or home ranges that overlapped or were immediately adjacent to the same survey unit as the Super Target-Tarpon Bay Plaza project. In addition, 8 other panthers that used this same survey unit previously died during this time period (FWC 2003). This unit, designated as Unit 5, includes the Florida Panther NWR, Corkscrew Swamp Sanctuary, and CREW. As of June 2005, 13 radio-collared panthers have been documented in the action area (i.e., the area including all lands within 25 miles of the project site). These panthers are comprised of 6 females (numbers 57, 66, 75, 83, 107, and 113) and 7 males (numbers 59, 60, 62, 65, 104, 119, and 131). In addition, McBride (2003) notes previous use of the action area by other panthers prior to their mortality. According to telemetry data, no radio-collared panthers have been

39
recorded on the project site. The status and activities of uncollared Florida panthers within the action area are unknown. The project site is located within the western portion of the geographic range of the panther in Florida. There have been a total of three male panthers (numbers 28, 92, and 99) and one female Texas cougar (number TX101) recorded within five miles of the project site on 10 occasions from January 1989 through June, 2005 and each of these panthers and/or Texas cougars has died. Panther 28 died in September 1992 due to intraspecific aggression. Panther 92 died in September 2001 of unknown causes. Panther 99 died in a vehicle incident in November 2002, and Texas cougar TX101 died in March 2000 of unknown causes. This translates to an average of 0.6 occurrences per year, which translates to an average of one occurrence every 20 months. However, in actuality, each of these three panthers and one Texas cougar were specific to a separate year as follows: 1989 (1 location from FP 28), 1995 (4 locations from Texas cougar TX 101), 2001 (2 locations from FP 92), and 2002 (3 locations from FP 99). All four panthers are now deceased and there have been no documented telemetry locations within 5 miles from September 2002 through June 2005. The Service believes the project site may occasionally be used by non-collared panthers because it contains habitat types used by panthers and their prey and the project vicinity has been used historically by panthers as indicated by telemetry locations over a 20-year period (Figure 3). Past and ongoing Federal and State actions affecting panther habitat in the action area include the issuance of Corps permits and State of Florida Environmental Resource Permits authorizing the filling of wetlands for development projects and other purposes. Since 1982, the Corps and the State have had a joint wetland permit application process, where all permit applications submitted to the State are copied to the Corps and vice versa. Within the 25-mile action area, the Service, since January 14, 1992, has formally consulted on 47 projects regarding the panther that were a result of Federal actions (database entries for formal consultations prior to 1992 are incomplete for projects in the action area). These projects have impacted or are expected to impact approximately 44,707 acres of panther habitat. These projects have also incorporated a total of 28,276 acres of preservation and restoration of panther habitat. The impacted lands generally are: (1) on the western fringe of occupied panther habitat; (2) vegetated with dense stands of exotic species, which may adversely affect the density of the panther prey base; and/or (3) support agricultural enterprises, i.e., row crops, citrus, etc., which provide a lower quality habitat value to the Florida panther. The preserved lands, which are generally proximate to larger tracts of Federal, State, and other preserves, provide a higher quality habitat value for the Florida panther. The Service has determined in the biological opinions issued for these Federal actions, that individually and cumulatively these projects do not jeopardize the survival and recovery of the Florida panther. From July 2000 through April 11, 2005 the Service also engaged in informal consultation within the Florida panther consultation area with the Corps for approximately 467 projects affecting approximately 517.5 acres in Collier County (primarily Northern Golden Gate Estates) and 45.0 acres in Lee County (primarily Lehigh Acres) (database entries for informal consultations prior to 2000 are incomplete for projects in the consultation area). Almost all of these projects involved the construction of single-family residences in partially developed areas, each in most

40
cases involving less than an acre of direct impact. Although panthers have been known to cross these areas to other parts of their range, prey base and denning utilization of these areas have been affected by the level of development and the additions of these residences is not expected to significantly further impact these habitat functions. For these actions, the Service concurred with the Corps’ determination of “may affect, but is not likely to adversely affect” for these individual projects. These projects have been incorporated into the Service’s environmental baseline for the Florida panther and the Service has determined that individually and cumulatively these projects do not jeopardize the survival and recovery of the Florida panther. We have received information that within the action area, the Corps has, between April 23, 2004, and June 10, 2005, issued non-jurisdictional wetland determinations (isolated wetlands) for 16 projects totaling 4,290.17 acres (8 projects in Lee County consisting of 506.23 acres and 8 projects in Collier County consisting of 3,783.91 acres). These determinations were issued per jurisdictional guidance provided recently in the Supreme Court decision, Solid Waste Agency of Northern Cook County vs. U.S. Army Corps of Engineers, 531 U.S. 159 (2001) and, therefore, they will not require a Federal Clean Water Act 404 wetland permit. These projects have been incorporated in the Service’s environmental baseline for the Florida panther in this biological opinion and the Service has determined, based on the location of these projects (generally in the western fringe of the panther’s geographic range), the quality of the habitat present on these project sites, and the overall status of the Florida panther, that these projects individually and cumulatively do not jeopardize the survival and recovery of the Florida panther. However, since loss of panther foraging habitat may occur from construction of these projects and no Corps wetland permit is required, the Service is requesting the applicants pursue Habitat Conservation Plans in cooperation with the Service. There have been 37 documented panther vehicle collisions within the 25 mile action area from 1980 through October 2005 (See Table 4 and Figure 6). A recent road mortality was northeast of the project area on CR 846, the location of which is being evaluated for construction of a panther crossing (FWC 2003). Activities within the action area have also benefited panthers. The issuance of Corps and State of Florida Environmental Resource Permits has preserved 17,355 acres of panther habitat for permitted impacts to 41,671 acres of poor quality panther habitat (1992 to present). Installation of wildlife crossings under SR 29 and I-75 within the action area has also benefited the panther by protecting habitat connectivity and eliminating panther-vehicle collision mortalities. Additional benefits have resulted from the acquisition of high quality habitat through acquisition programs by the other Federal, State, and County resource agencies. Table 5 provides a summary of the State and County acquisitions within the last 5 years. Moreover, the management of public lands, including prescribed fire and eradication of exotic vegetation in the Picayune Strand State Forest, Fakahatchee Strand State Preserve, Florida Panther NWR, ENP, and other conservation areas, is intended to improve habitat for panther prey species, which benefits panthers within these areas.

41
In 2003, 2004, and 2005, the Service wrote biological opinions for several projects that impacted the action area specified in this biological opinion. One, Mirasol, directly affected 800 acres. The project also provided benefit to the panther through the preservation and restoration of 1,059 acres in the Primary Zone. Another project was Bonita Beach Road RPD, which directly affected 1,117 acres. This project also benefited the panther through the preservation and restoration of 785 acres in the Primary Zone. Another project known as Terafina, directly affected 436 acres. The project also provided benefit to the panther through the preservation and restoration of 471 acres in the Primary Zone. Factors Affecting Species Environment within the Action Area Factors that affect the species environment (positive and negative) within the action area include, but are not limited to, highway, urban, agriculture, resource extraction, public lands management (prescribed fire, public use, exotic eradication, etc.), hydrological restoration projects, public and private land protection efforts, effects of genetic inbreeding, and genetic restoration. Development activities may result in avoidance or limited use of remaining suitable habitat by panthers as well as habitat loss, habitat fragmentation, habitat degradation, and also an increase in risk of vehicular collision (e.g., injury or death). Public and private land management practices can have a positive, neutral, or negative effect, depending on the management goals. Land protection efforts will help to stabilize the extant population. Hunting of the panther is no longer sanctioned, although there still may be instances of intentional or unintentional shooting of individuals for various reasons. EFFECTS OF THE ACTION This section analyzes the direct and indirect effects of the project on the Florida panther and Florida panther habitat. Factors to be Considered Residential, commercial, and industrial development projects may have a number of direct and indirect effects on the Florida panther and panther habitat. Direct impacts, which are primarily habitat based, may include: (1) the permanent loss and fragmentation of panther habitat; (2) the permanent loss and fragmentation of habitat that supports panther prey; (3) the loss of available habitat for foraging, breeding, and dispersing panthers; and (4) a reduction in the geographic distribution of the species. Indirect effects may include: (1) an increased risk of roadway mortality to panthers traversing the area due to the increase in vehicular traffic; (2) increased disturbance to panthers in the project vicinity due to human activities; (3) the reduction in panther prey; (4) the reduction in value of panther habitat adjacent to the project due to habitat fragmentation; and (5) a potential increase in intraspecific aggression between panthers (and an increase in mortality of subadult male panthers) due to reduction of the geographic range of the panther. These indirect effects are habitat based, with the exception of vehicular mortality,

42
which could result in lethal “take.” Intraspecific aggression, though habitat based, could also result in lethal “take.” This project site contains low quality panther habitat and is located within the western portion of the geographic range of the Florida panther. The timing of construction for this project, relative to sensitive periods of the panther’s lifecycle, is unknown. Panthers have the potential to be found on and adjacent to the proposed construction footprint year-round. The project will be constructed in a single, disruptive event, and result in permanent loss and alteration of a portion of the existing ground cover on the project site. The time required to complete construction of the project is not known, but it is likely that all land clearing associated with the development will be completed in a few months. The disturbance associated with the project will be permanent and result in a loss of habitat currently available to the panther. Analyses for Effects of the Action The Super Target-Tarpon Bay Plaza project site currently provides approximately 34 acres of low quality habitat for the Florida panther. The project site is located outside the boundaries of the primary and secondary zones as designated by Kautz et al. (In Review), but is located inside the Panther consultation area as defined by the Service (2000). The project site is encompassed by development. The project will result in the conversion of 34 acres of low quality panther habitat into a retail development. Compensation for the loss of 34 acres of poor quality panther habitat will be through the purchase 6.8 wetland credits at the PIMB (which equates to the restoration of 20.2 acres; the equivalent of 174.08 PHUs) of high quality panther habitat in the core habitat area (Figure 8) and Primary Zone (Kautz et al. In Review) of the Florida panther. These “core area” lands include the majority of home ranges of the current population of the Florida panther (see definition of core panther area in Effects of the Action - Primary Equivalent Lands). Off-site compensation is located in areas with a relatively higher level of documented panther usage (telemetry data) in replacement for the loss of 81.575 PHUs in an area bordered by development and exhibiting limited documented panther usage (telemetry data). Habitat Assessment: In this section, we assess habitat compensation recommended to offset project impacts to Florida panther habitat. Through the methodology described below, we assess how to compensate when habitat loss or degradation resulting from a proposed project cannot be avoided and when adverse effects have been minimized, but loss will still occur. The purpose of this assessment is to ensure that adequate compensation will occur to prevent any significant reductions in the likelihood of survival and recovery of the species due to habitat loss. The Service, in coordination with the applicant, agreed to evaluate the project’s effects to the Florida panther through a habitat assessment methodology that incorporates many of the habitat importance values referenced in Kautz et al. (In Review) and FWC (In Review). Our analysis evaluates habitats from 0 to 10 with low scores reflecting low habitat value to the Florida panther (Table 3). The habitat suitability scores as developed by the Service incorporate a direct calculation per acre with a base ratio (2.5) multiplier to compensate for unavoidable project effects to the Florida panther.

43
Our process to determine compensation is based on the amount of habitat that we believe is necessary to support a population of 90 panthers in south Florida, which is the mid-point in Kautz et al.’s (In Review) management guidelines that a population of 80 to 100 panthers is likely to be stable, although subject to genetic problems and assumptions previously stated, through 100 years. The Service, based on Kautz et al.’s (In Review) average panther population density of 31,923 acres per panther, determined 2,873,070 acres of Primary Zone equivalent lands (see discussion of Primary Zone equivalent lands below) need to be protected and managed. Currently, 2,094,988 acres of Primary Zone equivalent lands are preserved, so 778,082 additional acres need to be preserved to support a population of 90 panthers in south Florida (2,873,070 minus 2,094,988 equals 778,082). Primary Zone Equivalent Lands: Kautz et al. (In Review), through their habitat evaluation of lands important to the Florida panther, identified three sets of lands, i.e., Primary Zone, Secondary Zone, and Dispersal Zone, and documented the relative importance of these lands to the Florida panther. These lands, generally referred to as the core area, include the majority of the home ranges of the current population of the Florida panther. The Service, in our evaluation of habitat needs for the Florida panther expanded the boundaries of the Kautz et al. (In Review) core area to include those lands south of the Calooshatchee River where additional telemetry points historically were recorded. These additional lands, referred to as the “Other” Zone, added to the lands in Kautz et al.’s (In Review) core lands are referred to by the Service as the Core Area (Figure 8). The “Other” Zone lands, as well as the lands within the Secondary Zone, provide less landscape benefit to the Florida panther than the Primary and Dispersal Zones, but are important as a component of our goal to preserve and restore sufficient lands to support a population of 90 panthers in South Florida. To account for the lower landscape importance of these lands in our preservation goals and in our habitat assessment methodology, we assigned lands in the Other Zone a value of 1/3 and lands in the Secondary Zone a value of 2/3 to convert these lands to Primary Zone value, i.e., Primary Zone equivalents (Table 6). Dispersal Zone lands are considered equivalent to Primary Zones lands with a 1/1 value. For example, non-urban at-risk lands in the Other Zone total 819,995 acres, multiply these by 1/3 to determine the acres of Primary Zone equivalent lands the Other Zone can provide (819,995 times 1/3 equals 273,332 acres of Primary Zone equivalent lands). Using this assessment, the 471,466 acres of Secondary Zone lands equate to 314,297 acres of Primary Zone equivalent lands. These equivalent values, 1/3 and 2/3, for Other and Secondary Zones, respectively, and 1/1 for Dispersal Zone, are important components in our assessment of compensation needs for a project in the panther consultation area and are components of our habitat assessment methodology as discussed below. Base Ratio: To develop a base ratio that will provide for the protection and restoration of sufficient acreage of Primary Zone equivalent lands for a population of 90 panthers from the acreage of Primary Zone equivalent non-urban lands at risk, we developed the following approach.
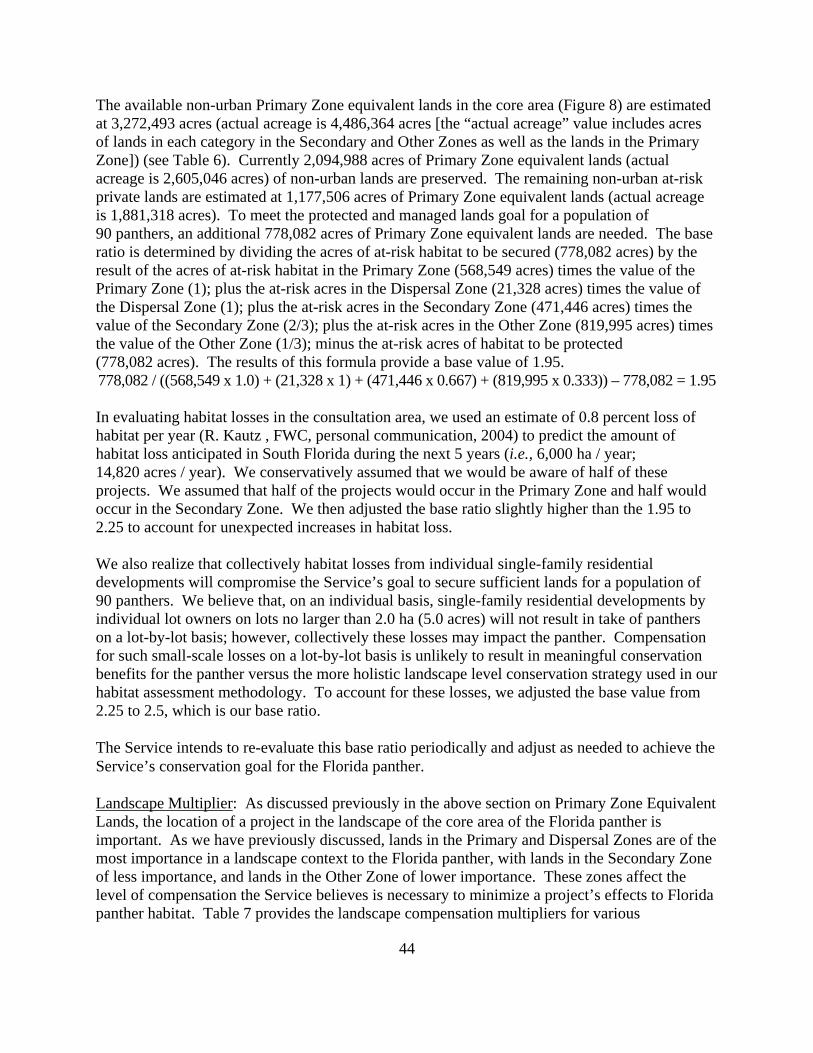
44
The available non-urban Primary Zone equivalent lands in the core area (Figure 8) are estimated at 3,272,493 acres (actual acreage is 4,486,364 acres [the “actual acreage” value includes acres of lands in each category in the Secondary and Other Zones as well as the lands in the Primary Zone]) (see Table 6). Currently 2,094,988 acres of Primary Zone equivalent lands (actual acreage is 2,605,046 acres) of non-urban lands are preserved. The remaining non-urban at-risk private lands are estimated at 1,177,506 acres of Primary Zone equivalent lands (actual acreage is 1,881,318 acres). To meet the protected and managed lands goal for a population of 90 panthers, an additional 778,082 acres of Primary Zone equivalent lands are needed. The base ratio is determined by dividing the acres of at-risk habitat to be secured (778,082 acres) by the result of the acres of at-risk habitat in the Primary Zone (568,549 acres) times the value of the Primary Zone (1); plus the at-risk acres in the Dispersal Zone (21,328 acres) times the value of the Dispersal Zone (1); plus the at-risk acres in the Secondary Zone (471,446 acres) times the value of the Secondary Zone (2/3); plus the at-risk acres in the Other Zone (819,995 acres) times the value of the Other Zone (1/3); minus the at-risk acres of habitat to be protected (778,082 acres). The results of this formula provide a base value of 1.95. 778,082 / ((568,549 x 1.0) + (21,328 x 1) + (471,446 x 0.667) + (819,995 x 0.333)) – 778,082 = 1.95 In evaluating habitat losses in the consultation area, we used an estimate of 0.8 percent loss of habitat per year (R. Kautz , FWC, personal communication, 2004) to predict the amount of habitat loss anticipated in South Florida during the next 5 years (i.e., 6,000 ha / year; 14,820 acres / year). We conservatively assumed that we would be aware of half of these projects. We assumed that half of the projects would occur in the Primary Zone and half would occur in the Secondary Zone. We then adjusted the base ratio slightly higher than the 1.95 to 2.25 to account for unexpected increases in habitat loss. We also realize that collectively habitat losses from individual single-family residential developments will compromise the Service’s goal to secure sufficient lands for a population of 90 panthers. We believe that, on an individual basis, single-family residential developments by individual lot owners on lots no larger than 2.0 ha (5.0 acres) will not result in take of panthers on a lot-by-lot basis; however, collectively these losses may impact the panther. Compensation for such small-scale losses on a lot-by-lot basis is unlikely to result in meaningful conservation benefits for the panther versus the more holistic landscape level conservation strategy used in our habitat assessment methodology. To account for these losses, we adjusted the base value from 2.25 to 2.5, which is our base ratio. The Service intends to re-evaluate this base ratio periodically and adjust as needed to achieve the Service’s conservation goal for the Florida panther. Landscape Multiplier: As discussed previously in the above section on Primary Zone Equivalent Lands, the location of a project in the landscape of the core area of the Florida panther is important. As we have previously discussed, lands in the Primary and Dispersal Zones are of the most importance in a landscape context to the Florida panther, with lands in the Secondary Zone of less importance, and lands in the Other Zone of lower importance. These zones affect the level of compensation the Service believes is necessary to minimize a project’s effects to Florida panther habitat. Table 7 provides the landscape compensation multipliers for various

45
compensation scenarios. As an example, if a project is in the Other Zone and compensation is proposed in the Primary Zone, a Primary Zone equivalent multiplier of 0.33 is applied to the panther habitat units (see discussion of panther habitat units below) developed for the project. If the project is in the Secondary Zone and compensation is in the Primary Zone, then a Primary Zone equivalent multiplier of 0.67 is applied to the panther habitat units developed for the project. Panther Habitat Units: Prior to applying the base ratio and landscape multipliers discussed above, we evaluate the project site and assign functional values to the habitats present. This is done by assigning each habitat type on-site a habitat suitability value from the habitats shown in Table 3. The habitat suitability value for each habitat type is then multiplied by the acreage of that habitat type resulting in a number representing PHUs. These PHUs are summed for a site total, which is used as a measurement of the functional value the habitat provides to the Florida panthers. This process is also followed for the compensation sites. Exotic Species Assessment: Since many habitat types in south Florida are infested with exotic plant species, which affects the functional value a habitat type provides to foraging wildlife species (i.e., primarily deer and hog), we believe the presence of these species and the value these species provide to foraging wildlife needs to be considered in the habitat assessment methodology. As shown in Table 3, we have a habitat type and functional value shown for exotic species. This category includes not only the total acres of pure exotic species habitats present but also the percent-value acreages of the exotic species present in other habitat types. For example, a site with 100 acres of pine flatwoods with 10 percent exotics would be treated in our habitat assessment methodology as 90 acres of pine flatwoods and 10 acres of exotics. Adding another 100 acres of cypress swamp with 10 percent exotics would change our site from 90 acres of pine flatwoods and 10 acres of exotics to 90 acres of pine flatwoods, 90 acres of cypress swamp, and 20 acres of exotics. Habitat Assessment Methodology Application: The application of the habitat assessment methodology including the base ratio, landscape multiplier, PHU determinations, and compensation recommendations, are presented below for the 34.17-acre Super Target-Tarpon Bay Plaza project site and the 6.8 wetland credits at the PIMB compensation site, (the 6.8 wetland credits equates to 20.2 acres of land in the PIMB compensation site). Table 8 illustrates the PHU calculations for the Super Target-Tarpon Bay Plaza project with impacts to 34.17 acres of land in the Other Zone with compensation provided by purchase 6.8 wetland credits (20.2 acres of land) at the PIMB in the Primary Zone. Table 8 shows the 34.17 acres of habitat types at the project site provide 97.89 PHUs. This value is multiplied by 2.5 to provide the base ratio compensation need, which is 244.73 PHUs. Since the project is located in the Other Zone and compensation will be in the Primary Zone, the base ratio PHUs are adjusted by the landscape compensation multiplier of 1/3 to provide a recommended compensation need of 81.575 PHUs.

46
The proposed panther habitat compensation of 6.8 credits at the PIMB should provide at least 81.575 PHUs. To minimize the project’s impacts to the panther, the applicant will purchase 6.8 credits at the PIMB. The Service has applied our panther habitat assessment to the habitat types at the PIMB, and we have determined that each credit at the PIMB provides 25.6 PHUs. Multiplying 6.8 credits by 25.6 PHUs per credit results in a total of 174.08 PHUs. Consequently, the Service believes the habitat values lost by the proposed development will be offset by the preservation and compensation actions proposed by the applicant. The lands proposed for development are in the western limits of the panther’s range and panther habitat value has been diminished by exotic infestation and adjacent development. Lands proposed for preservation will be in the Primary Zone, adjacent to other natural lands, and will be consistent with the Service’s panther goal to strategically locate, preserve, and restore sets of lands containing sufficient area and appropriate land cover types to ensure the long-term survival of the Florida panther population south of the Caloosahatchee River. Wildlife Assessment: As discussed previously in the status of the species and in the environmental baseline, the Service believes the existing habitat conditions present on a site and the foraging value that a site provides to the Florida panther and panther prey species are an important parameter in assessing the importance of the project site to the Florida panther and other wildlife species. In order to assess this importance, the Service requires wildlife surveys and plant species compositions as part of the applicant’s biological assessment prepared for the project. To provide the Service with this information, wildlife surveys were conducted on the project site by Kimley-Horn and Associates, Inc. in April 2004. Theses field surveys consisted of meandering pedestrian transects through on-site habitats. These transects resulted in a grid pattern of observations. Once the grid pattern of meandering transects covered the majority of the site, additional transects were performed targeting those areas of the site with greatest potential for listed species observations. No listed species were observed on-site. General wildlife utilization of the project site appears to be largely limited to species of small mammals associated with human disturbance (e.g., raccoons ). White-tailed deer and feral hogs, or the tracks of these species, were not observed on the site during the surveys. As discussed previously, white-tailed deer densities and other prey species are influenced by the quality of the foraging habitat present in an area. Monotypic stands of poor quality foraging plant species and the invasion of a site by exotic plants provide lower habitat foraging values and affect the utilization by and density of foraging species. The habitats in the project area have experienced similar vegetation changes. Approximately 39 percent of the site (13.3 acres) consists of vegetative communities that have been invaded by exotic vegetation, i.e., melaleuca and Brazilian pepper. In addition, approximately 42 percent (14.5 acres) of the site has been cleared due to historic construction activities. Deer are ruminants with small stomach capacities and are selective for high quality forage to meet their nutritional needs. To meet these high quality forage needs, deer selectively move through the mosaic of habitat types taking advantage of the seasonal forage that provide the most benefit to the deer. The invasion of habitats on the Super Target – Tarpon Bay Plaza site by exotic plants, primarily melaleuca and Brazilian pepper, have resulted in the growth of dense stands of monotypic, unpalatable plant species that provide poor quality foraging needs for

47
resident deer populations, hog, and other prey species. Although deer densities at the proposed PIMB compensation site were not determined, coverage of exotics after removal and native plantings will be minimal. The PIMB compensation site presently has minimal presence of exotics and will be maintained as such. The habitats in these compensation areas will contain a diverse mosaic of plant species that yield quality forage to panther prey species, especially resident deer populations. Conservation Measures: The beneficial effects of the project include the preservation of approximately 20.2 acres of Primary Zone panther habitat. Although the project will result in a net loss in the number of acres of habitat, the habitat quality provided to the Florida panther through preservation is superior to that of the areas to be impacted. The compensation site is a valuable area for breeding, foraging, and dispersal habitat that is important to panthers. In comparison, no radio-collared panthers have been recorded within the project site. Although, the amount of use of the compensation lands and the project site by uncollared panthers is unknown. Direct Effects Direct effects are those effects that are caused by the proposed action, at the time of construction, are primarily habitat based, are reasonably certain to occur and can include: (1) the permanent loss and fragmentation of panther habitat; (2) the permanent loss and fragmentation of habitat that supports panther prey; (3) the loss of available habitat for foraging, breeding, and dispersing panthers; and (4) a reduction in the geographic distribution of the species. Panthers may also be subject to harassment by construction activities. The direct effects this project will have on the Florida panther within the action area are discussed below. Permanent Loss of Habitat: The project will result in the loss of 34 acres of habitat available for occasional use by panthers. The project lands are located outside the Primary Zone and within the Other Zone. The land will be converted to support a retail development. Prey surveys conducted on the site have not documented site utilization by white-tailed deer, a primary panther prey species. Moreover, utilization of the site by panthers has not been documented by telemetry. The habitat quality of the site is generally poor, consisting primarily of disturbed lands and lands infested with exotic vegetation. Based on the above analysis, we believe the loss of the habitat associated with these lands is insignificant. Road Way Improvements: Improvements to Immokalee Road or the construction of new roadways in the project area are not proposed in association with the project Fragmentation of Habitat: Mac et al. (1998) define habitat fragmentation as “The breaking up of a habitat into unconnected patches interspersed with other habitat which may not be inhabitable by species occupying the habitat that was broken up. The breaking up is usually by human action, as, for example, the clearing of forest or grassland for agriculture, residential development, or overland electrical lines.” The reference to “unconnected patches” is a central underpinning of the definition. For panther conservation, this definition underscores the need to maintain corridors connecting habitat in key locations of south Florida. The project site is

48
located on the western fringe of occupied habitat, is adjacent to urban development, and is not located within known dispersal or connection corridors (FWC In Review) to larger publicly owned managed lands important to the panther; therefore, fragmentation of panther habitat is not expected to result from project implementation. The project site is bounded by Immokalee Road to the north, I-75 to the west, multi-family residential development to the south, and single-family residential and an activity center to the east.; therefore, fragmentation of panther prey species habitat is not also expected. Construction: The timing of construction for this project, relative to sensitive periods of the panther’s lifecycle, is unknown. However, it is likely all land clearing associated with the development will occur over a short period of time i.e., approximately one month. There are no known den sites within the project boundaries, no telemetry locations, and the quality and quantity of the habitat foraging base for prey species is low. Therefore, we believe panther usage of the property is limited and we do not believe project construction will result in direct panther mortality. Compensation: The Service believes the habitat values lost by the development will be offset by the compensation actions proposed by the applicant. The lands proposed for development are primarily disturbed and invaded by exotic plant species. The site is located outside of the Primary and Secondary Zones and is encompassed by development. The lands proposed for preservation are consistent with the Service’s panther conservation strategy to locate, preserve, and restore sets of lands containing sufficient area, access, and appropriate cover types to ensure the long-term survival of the Florida panther south of the Caloosahatchee River. Interrelated and Interdependent Actions An interrelated activity is an activity that is part of the proposed action and depends on the proposed action for its justification. An interdependent activity is an activity that has no independent utility apart from the action under consultation. No interrelated or interdependent actions are expected to result from the project. Indirect Effects Indirect effects are those effects that result from the proposed action and are reasonably certain to occur. We have identified five types of indirect effects that may result from the proposed action. The five types include: (1) an increased risk of roadway mortality to panthers traversing the area due to the increase in vehicular traffic; (2) increased disturbance to panthers in the project vicinity due to human activities (human/panther interactions); (3) the reduction in panther prey;(4) the reduction in value of panther habitat adjacent to the project due to habitat fragmentation; and (5) a potential increase of intraspecific aggression between panthers due to reduction of the geographic distribution of habitat for the panther. Increased Risk of Roadway Mortality: In evaluating a project’s potential to increase roadway mortality to the Florida panther, we consider the location of the project in relation to surrounding native habitats, preserved lands, and wildlife corridors that are frequently used by the Florida

49
panther. We also consider the current configuration and traffic patterns of surrounding roadways and the projected increase and traffic patterns expected to result from the proposed action. We evaluate the habitats present on-site, their importance in providing foraging needs for the Florida panther and panther prey species, and if the site development would further restrict access to surrounding lands important to the Florida panther and panther prey species. The project will result in increased vehicular traffic in the project vicinity during construction and operation. However, vehicular mortality data (see Table 4 and Figure 6) provided by the FWC indicate collisions with motor vehicles are not an important source of panther mortality in the project vicinity. There have been three recorded panther deaths resulting from a vehicle collision within 10 miles of the project site. On November 28, 2002, FP 99 was killed by a vehicle on CR 846 approximately 9.8 miles northeast of the project site. FP 63 was killed on February 26, 2004, by a vehicle on Interstate 75 approximately 9.6 miles southeast of the project site. Panther K-153 was killed on August 29, 2005, by a vehicle 9.4 miles southeast of the project site. Major traffic travel routes in the vicinity of the project site (Figure 2) include I-75 to the west, and Immokalee Road to the North. According to the Tarpon Bay Plaza Traffic Impact Analysis, and subsequent discussions with Collier County staff, as conducted by Kimley-Horn and Associates, Inc., the distribution of project traffic will be to Immokalee Road (CR 846), I-75, Oakes Boulevard and Northbrooke Drive adjacent to the project site. The access for the project site is provided along major roadways that are heavily traveled. The proposed project distribution is projected to be as follows: approximately 25 percent of the project traffic to/from the west of the project on Immokalee Road (CR 846), approximately 25 percent to/from the east on Immokalee Road (CR 846), approximately 25 percent to/from I-75, approximately 20 percent to/from the south on Oakes Boulevard, and approximately 5 percent to/from the north of Northbrooke Drive. From a project average annual daily traffic volume standpoint, approximately 2,427 vehicles per day are projected on Immokalee Road to/from the west of the project site, approximately 2,427 vehicles per day on Immokalee Road to/from the east of the project site, approximately 2,427 vehicles per day on I-75 north and south of the project site, approximately 1,941 vehicles per day on Oakes Boulevard to/from the south of the project site, and approximately 484 vehicles per day on Northbrooke Drive to/from the north of the project site. The projected project traffic estimated as a percentage of existing traffic results in an increase of approximately 8 percent of the existing Immokalee Road traffic west of the project site (including I-75), approximately 5 percent of the existing Immokalee Road traffic east of the project site, approximately 10 percent of the existing Oakes Boulevard traffic south of the project site, and approximately 7 percent of the existing Northbrooke Drive traffic north of the project site. The project traffic estimate as a percentage of the roadway service volume (capacity) results in an increase of approximately 9 percent of the Immokalee Road service volume west of the project site, approximately 4 percent of the Immokalee Road service volume east of the project site, approximately 13 percent of the Oakes Boulevard service volume, and approximately 3 percent of the Northbrooke Drive service volume.

50
Although there will be nominal traffic increases east of the project site, the majority of the traffic generated by the project site is expected to and from the west and south into urban areas and not east into the more rural lands of Collier County. Considering this information and the distances from the project site to documented collisions, it is unlikely the traffic generated by this project will significantly increase the risk of roadway mortality to panthers. Habitat Fragmentation: The project site is encompassed by development. The site is bound by Immokalee Road to the north, I-75 to the west, multi-family residential development to the south, and single-family residential and an activity center to the east. The on-site habitat is not contiguous to other panther habitat; therefore, fragmentation of panther habitat is not expected to result from project implementation. Panther and Prey Disturbance (Panther/Human Interactions) and Intraspecific Aggression: Potential increases in intraspecific aggression and disturbance to the Florida panther were evaluated. As discussed previously in our assessment of fragmentation, we considered habitat quality related factors and occurrence data for the Florida panther and panther prey species. This information is also the basis of our evaluation of disturbance and intraspecific aggression to the Florida panther and to panther prey species. The Service believes, as previously discussed, the habitats on the property provide low quality foraging for prey species, which directly affects the frequency and duration of use of the property by panthers. Therefore, since we do not believe that panther prey species and/or Florida panthers utilize the property on a frequent basis, the loss of the limited use of the site by panthers and panther prey species will not significantly increase the risk of disturbance to panthers in the project action area due to human activities, will not increase mortality from intraspecific aggression between panthers, and will not significantly increase disturbance to panthers and panther prey species in the project action area. CUMULATIVE EFFECTS Cumulative effects include the effects of future State, Tribal, local, or private actions reasonably certain to occur in the action area considered in this biological opinion. Future Federal actions unrelated to the proposed action but located in the action area, are not considered in this section because they require separate consultations pursuant to section 7 of the ESA. To identify future private actions that may reasonably be certain to occur in the action area, the Service first identified the types of land alteration actions that could occur in the action area, then developed a mechanism to distinguish between those that will require federal review and those that are not likely to be a future federal action, and thus meet the cumulative effects definition. Within the action area, the Service has identified those private actions reasonably certain to occur to include land alteration permits and/or development orders issued by either and/or both State and county agencies. These actions include State of Florida DRI Orders, South Florida Water Management Environmental Resource Permits; and Lee and Collier Counties Comprehensive Plan Amendments, Zoning Amendments, and Planned Unit Developments (PUD).

51
County and State records and databases were queried for the issuance of: (1) State of Florida DRI Orders (2001 to 2004); (2) Comprehensive Plan Amendments (2003 to 2004); (3) Lee and Collier Counties Zoning Amendments (2003 to 2004); (4) Collier County’s PUD Orders (2001 to 2004); (5) Lee County’s PUD Orders (2001 to April 2004); and (6) South Florida Water Management District’s Environmental Resource Permits (2003 to 2004). Queries included project name, date, acreage, and habitat cover types. To determine which of these projects would likely be exempt from Federal Clean Water Act section 404 wetland regulatory reviews by the Corps, we identified the percentage of the project site that was classified as wetland habitat, based on the Florida Land Use, Cover and Forms Classification System (FLUCCS) mapping units. The mapping units relied on by the Service included the 600 series (wetland classifications) and the 411 and 419 pine flatwood classifications (hydric pine systems). For listing purposes, properties with less than 5 percent wetlands were considered by the Service to be generally exempt from regulatory review as these quantities of wetlands could be avoided by project design. Within the action area, based on FLUCCS mapping, 29 projects affecting approximately 4,094.43 acres could be expected to be subject to development without Federal permit involvement through the Clean Water Act section 404 (Table 9, Figure 10). According to the most current home range estimates of the Florida panther (FWC 2004), this level of development represents 10.6 percent of a female panther home range (38,563 acres) and 4 percent of a male panther home range (119,968 acres). State and county land alteration permits in southwest Florida not part of those actions listed above, generally included single-family residential developments within Northern Golden Gate Estates and Lehigh Acres. Vacant lands within the area of Northern Golden Gate Estates (north of I-75) total approximately 34,028 acres as of September 2004 (Figure 11). To evaluate these effects, the Service overlaid the plat boundaries on 2004 aerials, queried the parcel data from Collier County’s Property Appraisers Office, noted lots with developments, compared those to 2003 aerials, and noted the changes. Vacant lands within the area of Northern Golden Gate Estates (north of I-75) total approximately 35,768 acres as of August 2003. The breakdown of acres for August 2003 is: (1) wetlands, approximately 17,572 acres; (2) uplands, approximately 17,990 acres; and (3) water, approximately 210 acres. These changes were overlain on the National Wetlands Inventory (NWI) maps for presence of wetlands. This evaluation was used to estimate the acreage of properties that may be exempt from Federal Clean Water Act section 404 wetland regulatory reviews by the Corps (Figure 11). A comparison of the 2003 and 2004 data for Northern Golden Gate Estates indicates approximately 1,740 acres of land were converted from vacant to developed with the breakdown as: (1) wetlands, approximately 696 acres and (2) uplands, approximately 1,044 acres. The evaluation process provided an estimate of 417 lots totaling 1,044 acres for Northern Golden Gate Estates. Therefore, using NWI mapping for the Northern Golden Gate Estates, a total of approximately 1,044 acres could be expected to be subject to development each year in these areas without Federal permit involvement. Based on historical records for wetland permits issued by the Corps for these areas, most of these projects will involve the construction of single-

52
family residences in partially developed areas and will involve less than an acre of impact. This level of development represents 2.7 percent of a female panther home range (38,563 acres) and 0.87 percent of a male panther home range (119,968 acres). Vacant lands within the area of Lehigh Acres, also within the action area, total approximately 34,852 acres as of April 2003 (Figure 12). The breakdown of acres is: (1) wetlands, approximately 1,057 acres; (2) uplands, approximately 33,592 acres; and (3) water, approximately 202 acres. A review of aerial photography and Lee County building permit data for Lehigh Acres from the 1-year period prior to April 2003 indicates approximately 441 acres of land was converted from vacant to occupied, during the 1-year period. The breakdown of converted acres is estimated as: (1) wetlands, 66 acres; (2) uplands, 375 acres; and (3) water, 0 acres. Therefore, using NWI mapping, approximately 375 acres could be expected to be subject to development each year in this area without Federal permit involvement. In conclusion, the Service’s cumulative effects analysis has identified approximately 5,513.43 acres within the action area that could be developed without Federal wetland permit involvement. This level of development, which the Service believes is representative of future non-Federal actions, is reasonably certain to occur and will not involve a Federal action and, therefore, meets the definition of cumulative effect. This level of projected future development represents 14.3 percent of a female panther’s average home range (38,563 acres), 4.6 percent of a male panther’s average home range (119,968 acres), and 0.29 percent of the private non-urban lands at risk in the core panther area (1,881,318 acres) (Table 6). As previously discussed, these lands are generally located on the fringes of occupied panther habitat, with disturbed vegetative communities; or are in row crops; or are in partially developed areas, and represent 0.3 percent of the non-urban private lands at risk in the core area. Based on the above analysis, we believe the loss of the habitat associated with these lands is insignificant. SUMMARY OF EFFECTS Panther Usage: The timing of construction for this project, relative to sensitive periods of the panther’s lifecycle, is unknown. However, it is likely that all land clearing associated with the development will be completed within a year. There are no known den sites within the project boundaries and the quality and quantity of the foraging prey base is low. According to telemetry data, no panther activity has been recorded on-site within the last 3 years. The status and activities of uncollared Florida panthers within the action area is unknown. Therefore, we believe panther usage of the property is limited and we do not believe project construction will result in direct panther mortality. Traffic: Although there will be some traffic increases with project development, we believe as discussed above and in previous sections, the lands on the project site provide limited value to the Florida panther and panther prey species; the site is adjacent to existing and proposed urban development; and the proposed action will further restrict suitability of the site for use by either resident or dispersing panthers. The traffic flow pattern to and from the proposed residential development will be generally to the west into urban areas and traffic is not directed into the more rural lands of Collier County. The Service believes, based on the current habitat conditions

53
on the site, the level of development in the adjacent areas, the lack of documented use of the site by the Florida panther, within the last 3 years, and the location relative to documented collisions, that the increase in traffic generated by the proposed development on the surrounding roads will not significantly increase the risk of roadway mortality or injury to panthers. Habitat Loss: The Service, based on the habitat evaluations discussed previously, believes the project will result in the direct and indirect loss of 34 acres of mostly low quality panther habitat outside the Primary Zone and within the Other Zone. Habitat types are primarily disturbed lands, and exotic infested wetlands and other natural communities. Wildlife utilization of the property shows limited foraging values to panther prey species. This loss of 34 acres of panther habitat represents 0.004 percent of the 1,881,318 acres of available non-urban private lands in the core area. The Service believes this small loss (0.004 percent) of panther habitat on the western edge of the panther’s range will not adversely affect the Service’s recovery and land conservation and preservation goals. Compensation: On the other hand, the project will also provide for the preservation and restoration of approximately 20 acres of Primary Zone habitat at the PIMB. The preservation of these lands in the panther core area represents 0.003 percent of the 778,082 acres of private lands still needed for the population of 90 individuals. Therefore, we believe the preservation and restoration of approximately 20 acres of panther habitat in the panther core area will have a beneficial effect on the panther and will offset the loss of this low quality habitat and further the Service’s goal in panther conservation. Fragmentation: The project site is also located on the western edge of occupied habitat, is adjacent to other existing and proposed development, and is not located within known dispersal corridors to larger publicly owned managed lands important to the panther. Therefore, fragmentation of panther habitat is not expected to result from project implementation. Intraspecific Aggression: Potential increase in intraspecific aggression and disturbance to the Florida panther was evaluated. However, the Service believes, as previously discussed, the habitat on the property provides low quality foraging for prey species, which directly affects the frequency and duration of use of the property by panthers. Therefore, the Service believes the loss of this limited use of the site by panthers will significantly increase the risk of mortality from intraspecific aggression between panthers and not increase disturbance to panthers in the project action area due to human activities. Cumulative Analysis: In the cumulative analysis, the Service identified the potential loss of approximately 5,513.43 acres within the action area within the immediate past that could be developed without Federal wetland permit involvement and we believe this level of development represents future non-Federal actions expected to occur in the action area. This level of development represents a small percentage (0.29 percent of the 1,881,318 acres) of available non-urban private lands in the core area. In general, these lands are primarily within previously impacted areas or are in the western more urbanized portion of the Florida panther’s consultation area. Although this small percentage of lands may be lost from the core area of private lands

54
available for panther conservation, the Service believes the loss of these lands will not adversely affect the Service’s land conservation and preservation goals for the Florida panther. Conservation Land Acquisitions: The State and County land acquisition programs have acquired 7,462 acres of lands within the action area from 1998 to 2003 (Table 5), which represents 1.6 percent of the 458,852 acres of private lands still needed for the population of 80 individuals and 0.68 percent of the 1,097,312 acres of private lands still needed for 100 individuals. These lands are generally located within the core area of the Florida panther and are intended to be actively managed for the benefit of many wildlife species including the Florida panther. The preservation of these lands in the panther core area will have a beneficial effect on the panther and further the Service’s goal in panther conservation. CONCLUSION In summary, the Service believes there will be no direct take in the form of mortality or injury of the Florida panther resulting from this project. The loss of habitat from implementing the project, taking into consideration the status of the species, remaining habitat, and other factors considered by this biological opinion, such as the overall recovery objectives and other cumulative effects from actions in the action area, will be offset by the conservation of other, more functionally valuable habitat. Therefore, the proposed construction of the Super Target-Tarpon Bay Plaza project is not likely to jeopardize the continued existence of the Florida panther. No critical habitat has been designated for this species; therefore, none will be affected.
INCIDENTAL TAKE STATEMENT Section 9 of the ESA and Federal regulation pursuant to section 4(d) of the ESA prohibit the take of endangered and threatened species, respectively, without special exemption. “Take” is defined as “harass, harm, pursue, hunt, shoot, wound, kill, trap, capture or collect, or to attempt to engage in any such conduct.” “Harm” is further defined by the Service to include significant habitat modification or degradation that results in death or injury to listed species by significantly impairing essential behavioral patterns, including breeding, feeding, or sheltering. Harass is defined by the Service as intentional or negligent actions that create the likelihood of injury to listed species to such an extent as to significantly disrupt normal behavior patterns which include, but are not limited to, breeding, feeding, or sheltering. Incidental take is defined as take that is incidental to, and not the purpose of, the carrying out of an otherwise lawful activity. Under the terms of section 7(b)(4) and section 7(o)(2), taking, that is incidental to and not intended as part of the agency action, is not considered to be prohibited taking under the ESA provided that such taking is in compliance with the terms and conditions of this Incidental Take Statement. AMOUNT OR EXTENT OF TAKE Although there will be traffic increases with the project, we believe as discussed in previous sections, the lands on the project site provide limited value to the Florida panther and panther prey species. Traffic flow to and from the project will be generally to the west into urban areas.

55
Furthermore, the site is adjacent to existing urban development and the proposed action will further restrict suitability of the site for use by either resident or dispersing panthers. The Service believes, based on the current habitat conditions on the site, the level of development in the adjacent areas, and the lack of documented historical use of the site by the Florida panther, the increase in traffic generated by the proposed development on the surrounding roads will not significantly increase the risk of roadway mortality to panthers. Therefore, the Service does not anticipate the increase in traffic generated by the proposed action will result in the direct mortality of any Florida panthers. Accordingly, the Service is not anticipating any direct take in the form of mortality or injury to the Florida panther. However, the Service anticipates incidental take of panthers in the form of harm and harassment associated with the loss of 34 acres of panther habitat within the Other Zone. Based on the analysis provided in the previous sections, the Service believes this level of anticipated take is not likely to result in jeopardy to the species. EFFECT OF THE TAKE In the accompanying biological opinion, the Service determined this level of anticipated take is not likely to result in jeopardy to the species. The amount of panther habitat affected by the proposed action is approximately 0.002 percent of an estimated 2 million acres of habitat occupied by the panther. The proposed action will result in the restoration and preservation of approximately 20.2 acres of panther habitat off-site in the Primary Zone. The proposed action will increase the preservation and enhancement acreage of panther habitat through permitted Federal actions by about 0.07 percent from 28,964 acres to approximately 28,984 acres (Table 1). The cumulative increase in the preservation and enhancement of panther habitat to permitted Federal actions will be from 700 acres in 1990 to 28,984 acres following issuance of a permit, if issued, by the Corps. The proposed action will result in the loss of 34 acres of mostly low quality panther habitat. The proposed action will increase the impacts from direct and indirect effects to panther habitat from residential and commercial developments, mining, and agriculture by about 0.04 percent from 88,927 acres to 88,961 acres. Of the 88,961 acres of impacts, 39,918 acres are due to agricultural conversion and 49,043 acres to development and mining. Portions (10,370 acres) of the largest agricultural conversion project, the 28,700 acres by U.S. Sugar Corporation, were re-acquired by the Federal Government as a component of the Talisman Land Acquisition (Section 390 of the Federal Agricultural Improvement and Reform Act of 1996 [P.L. 104-127] Farm Bill Cooperative Agreement, FB4) for use in the Comprehensive Everglades Restoration Project. The 48,508 acres impacted by development and mining included a mixture of agricultural fields consisting of row crops and citrus groves, and natural lands with varying degrees of exotic vegetation. The non-agricultural impacts are permanent land losses, whereas the agricultural conversions may continue to provide some habitat functional value to panthers, although of less value than native habitats.

56
The lands proposed for compensation/preservation from the proposed take of panther habitat are lands adjacent to other larger tracts of natural and preserved lands and are consistent with the Service’s panther goal to locate, preserve, and restore sets of lands containing sufficient area and appropriate land cover types to ensure the long-term survival of the Florida panther south of the Caloosahatchee River. Therefore, based on the evaluations provided above for project’s direct, indirect and cumulative effects, the status of the species, and the compensation proposed by the applicant, the Service believes that the proposed construction and operation of the Super Target-Tarpon Bay Plaza project will not jeopardize the survival and recovery of the Florida panther. REASONABLE AND PRUDENT MEASURES The Service believes the Corps and the applicant have incorporated all reasonable and prudent measures necessary and appropriate to minimize impacts of incidental take of Florida panthers into the design of the proposed action. In summary, the Corps and the applicant will ensure that no more than 34 acres of panther habitat will be lost as a result of implementation of the proposed action and that approximately 20 acres in the panther Primary Zone will be preserved to benefit the Florida panther and its prey. TERMS AND CONDITIONS In order to be exempt from the prohibitions of section 9 of the ESA, the Corps must comply with the following terms and conditions, which implement the reasonable and prudent measures, described above and outline reporting/monitoring requirements. The terms and conditions described below are non-discretionary, and must be undertaken by the Corps so that they become binding conditions of any grant or permit issued to Brentwood Land Partners, LLC as appropriate, for the exemption in section 7(o)(2) to apply. The Corps has a continuing duty to regulate the activity covered by this Incidental Take Statement. If the Corps (1) fails to assume and implement the terms and conditions or (2) fails to require Brentwood Land Partners, LLC to adhere to the terms and conditions of the Incidental Take Statement through enforceable terms that are added to the permit or grant document, the protection coverage of section 7(o)(2) may lapse. In order to monitor the impact of incidental take, the Corps or Brentwood Land Partners, LLC must report the progress of the action and its impact on the species to the Service as specified in the Incidental Take Statement [50 CFR § 402.14(i)(3)]. (1) The Corps will include, as special conditions to the permit instrument, the conservation
measures listed below and in the description of the proposed action that commits the applicant to purchase, preserve, and manage high quality panther habitat, which is necessary and appropriate to minimize incidental take of panthers by the proposed action. Specifically, to compensate for impacts to 34 acres of Florida panther habitat, the applicant proposes to purchase 6.8 credits at the PIMB in Lee County which equates to approximately 20 acres of land. All habitats to be purchased and preserved will be located in the panther Primary Zone;

57
(2) The preservation site will be managed in perpetuity for the control of invasive exotic vegetation as defined by the Florida Exotic Pest Plant Council’s Pest Plant List Committee’s 2001 List of Invasive Species (Category 1) (2005);
(3) The Corps will provide a copy of the purchase agreement to the Service within 60 days of
start of project construction; (4) The Corps will provide a copy of the final permit to the Service upon issuance. The Corps
will monitor the permit conditions regarding conservation measures to minimize incidental take of panthers by providing the Service a report on implementation and compliance with the conservation measure within 1 year of the issuance date of the permit;
(5) The Corps will provide documentation to the Service for completion of any proposed on-site
restoration and verification of the execution and terms of the conservation easement, if applicable;
(6) Upon locating a dead, injured, or sick panther specimen, initial notification must be made to
the nearest Service Law Enforcement Office; Fish and Wildlife Service; 9549 Koger Boulevard, Suite 111; St. Petersburg, Florida 33702; 727-570-5398. Secondary notification should be made to the FWC; South Region; 3900 Drane Field Road; Lakeland, Florida; 33811-1299; 1-800-282-8002; and
(7) Care should be taken in handling sick or injured specimens to ensure effective treatment
and care or in the handling of dead specimens to preserve biological material in the best possible state for later analysis as to the cause of death. In conjunction with the care of sick or injured panthers or preservation of biological materials from a dead animal, the finder has the responsibility to carry out instructions provided by Law Enforcement to ensure that evidence intrinsic to the specimen is not unnecessarily disturbed.
CONSERVATION RECOMMENDATIONS
Section 7(a)(1) of the ESA directs Federal agencies to utilize their authorities to further the purposes of the ESA by carrying out conservation programs for the benefit of endangered and threatened species. Conservation recommendations are discretionary agency activities to minimize or avoid adverse effects of a proposed action on listed species or critical habitat, to help implement recovery plans, or to develop information. The Service is not proposing any conservation recommendations at this time.
REINITIATION NOTICE This concludes formal consultation on the Super Target-Tarpon Bay Plaza development project. As provided in 50 CFR § 402.16, reinitiation of formal consultation is required where discretionary Federal agency involvement or control over the action has been retained (or is authorized by law) and if: (1) the amount or extent of incidental take is exceeded; (2) the agency action is subsequently modified in a manner that causes an effect to the listed species or critical


59
LITERATURE CITED Aebischer, N.J., P.A. Robertson, and R.E. Kenward. 1993. Compositional analysis of habitat
use from animal radio-tracking data. Ecology 74:1313-1325. Akçakaya, H.R. 2002. RAMAS GIS: Linking spatial data with population viability analysis
(version 4.0). Applied Biomathetics, Setauket, New York. Anderson, A.E. 1983. A critical review of literature on puma (Felis concolor). Special report
Number 54. Colorado Division of Wildlife, Wildlife Research Section; Denver, Colorado.
Bangs, O. 1899. The Florida Puma. Proceedings of the Biological Society of Washington
13:15-17. Barone, M.A., M.E. Roelke, J. Howard, J.L. Brown, A.E. Anderson, and D.E. Wildt. 1994.
Reproductive characteristics of male Florida panthers: Comparative studies from Florida, Texas, Colorado, Latin America, and North American zoos. Journal of Mammalogy 75(1):150-162.
Beier, P. 1995. Dispersal of juvenile cougars in fragmented habitat. Journal of Wildlife
Management 59(2): 228-237. Beier, P. 2003. Comments on landscape conservation strategy for the Florida panther in south
Florida. Unpublished report to the U.S. Fish and Wildlife Service, South Florida Ecological Services Office; Vero Beach, Florida.
Beier, P., M.R. Vaughan, M.J. Conroy, and H. Quigley. 2003. An analysis of scientific
literature related to the Florida panther. Final Report. Florida Fish and Wildlife Conservation Commission; Tallahassee, Florida. 203 pages.
Beissinger, S.R. and M.I. Westphal. 1998. On the use of demographic models of population
viability in endangered species management. Journal Wildlife Management 62:821-841. Belden, R.C. 1986. Florida panther recovery plan implementation - A 1983 progress report.
Pages 159-172 in S.D. Miller and D.D. Everett (eds.), Cats of the world: Biology, Conservation and Management. Proceedings of the Second International Cat Symposium. Caesare Kleberg Wildlife Research Institute; Kingsville, Texas.
Belden, R.C. 1989. The Florida Panther. Pages 515-532 in Audubon Wildlife Report
1988-1989. National Audubon Society; New York, New York. Belden, R.C., W.B. Frankenberger, R.T. McBride, and S.T. Schwikert. 1988. Panther habitat
use in southern Florida. Journal Wildlife Management 52(4):660-663.

60
Beyer Jr., D.E. and J.B. Haufler. 1994. Diurnal versus 24-hour sampling of habitat use. Journal of Wildlife Management 58:178-180.
Brook, B. 2000. Pessimistic and optimistic bias in population viability analysis. Biology
Conservation 14:564-566. Brook, B.W., L. Lim, R. Harden, and R. Frankham. 1997. Does population viability analysis
software predict the behaviour of real populations? A restrospecitve study of the Lord Howe Island Woodhen Tricholimnas sylvestris (Sclater). Biology Conservation 82:119-128.
Comiskey, E.J., O.L. Bass, Jr., L.J. Gross, R.T. McBride, and R. Salinas. 2002. Panthers and
forests in south Florida: An ecological perspective. Conservation Ecology 6(1):18. [online] URL: http://www.consecol.org/vol6/iss1/art18.
Cory, C.B. 1896. Hunting and fishing in Florida. Estes and Lauriat; Boston, Massachusetts. Cox, J., R. Kautz, M. MacLaughlin, and T. Gilbert. 1994. Closing the gaps in Florida’s wildlife
habitat conservation system. Florida Game and Fresh Water Fish Commission; Tallahassee, Florida. 239 pages.
Culver, M., W.E. Johnson, J. Pecon-Slattery, and S.J. O’Brien. 2000. Genomic ancestry of the
American puma (Puma concolor). Journal of Heredity 91(3):186-197. Dalrymple, G.H. and O.L. Bass, Jr. 1996. The diet of the Florida panther in Everglades
National Park. Bulletin of the Florida Museum of Natural History 39(5):173-194. Dees, C.S., J.D. Clark, and F.T. Van Manen. 1999. Florida panther habitat use in response to
prescribed fire at Florida Panther National Wildlife Refuge and Big Cypress National Preserve. Final Report. University of Tennessee; Knoxville, Tennessee.
Dees, C.S., J.D. Clark, and F.T. Van Manen. 2001. Florida panther habitat use in response to
prescribed fire. Journal of Wildlife Management 65(1):141-147. Dunbar, M.R. 1993. Florida panther biomedical investigation. Annual performance report,
July 1, 1992 to June 30, 1993. Study Number 7506, Florida Game and Fresh Water Fish Commission; Tallahassee, Florida.
Fieberg, J. and S.P. Ellner. 2000. When it is meaningful to estimate and extinction probability?
Ecology 81:2040-2047. Fleming, D.M., J. Schortemeyer, and J. Ault. 1993. Distribution, abundance, and demography
of white-tailed deer in the Everglades. National Park Service, Everglades National Park, Homestead, Florida.

61
Florida Exotic Pest Plant Council's Pest Plant List Committee. 2005. List of Invasive Species. Florida Exotic Pest Plant Council. April 2005. Gainesville, Florida. [online] URL: http://www.fleppc.org/Plantlist/list.htm.
Florida Fish and Wildlife Conservation Commission (FWC). 1999. Land, E.D., M. Lotz,
D. Shindle, and S.K. Taylor. Florida panther genetic restoration and management. Annual report, Study Number 7508; Tallahassee, Florida.
Florida Fish and Wildlife Conservation Commission (FWC). 2001. Land, E.D.,
M. Cunningham, M. Lotz, and D. Shindle. Florida panther genetic restoration and management. Annual report, Study Number 7500; Tallahassee, Florida.
Florida Fish and Wildlife Conservation Commission (FWC). 2002. Land, E.D.,
M. Cunningham, M. Lotz, and D. Shindle. Florida panther genetic restoration and management. Annual report, Florida Panther Research Number 93112503002; Tallahassee, Florida.
Florida Fish and Wildlife Conservation Commission (FWC). 2003. Land, E.D.,
M. Cunningham, M. Lotz, and D. Shindle. Florida panther genetic restoration and management. Annual report, Florida Panther Research Number 93112503002; Tallahassee, Florida.
Florida Fish and Wildlife Conservation Commission (FWC). 2004. Land, E.D.,
M. Cunningham, M. Lotz, and D. Shindle. Florida panther genetic restoration and management. Annual report, Florida Panther Research Number 93112503002; Tallahassee, Florida.
Florida Fish and Wildlife Conservation Commission (FWC). In Review. Use of least cost
pathways to identify key highway segments for panther conservation. Tallahassee, Florida.
Hall, E.R. 1981. The mammals of North America Volume II. The Ronald Press Company;
New York, New York. Hall, E.R. and K.R. Kelson. 1959. The mammals of North America. Volume II. The Ronald
Press Company; New York, New York. Halls, L.K., ed. 1984. White-tailed deer, ecology and management. The Wildlife Management
Institute; Washington, D.C. Hamilton, S. and H. Moller. 1995. Can Population Viability Analysis models using computer
packages offer useful conservation advice? Sooty shearwaters Puffinus griseus in New Zealand as a case study. Biology Conservation 73:107-117.

62
Harlow, R.F. 1959. An evaluation of white-tailed deer habitat in Florida. Florida Game and Fresh Water Fish Commission Technical Bulletin 5:1-64; Tallahassee, Florida.
Harris, L.D. 1985. The fragmented forest. University of Chicago Press; Chicago, Illinois. Hollister, N. 1911. The Louisiana puma. Proceedings of the Biological Society of Washington
24:175-178. Janis, M.W. and J.D. Clark. 1999. The effects of public use on the behavior of Florida panthers
at Big Cypress National Preserve. University of Tennessee; Knoxville, Tennessee. Kautz, R.S. and J.A. Cox. 2001. Strategic habitats for biodiversity conservation in Florida.
Conservation Biology 15:55-77. Kautz, R., R. Kawula, T. Hoctor, J. Comiskey, D. Jansen, D. Jennings, J. Kasbohm, F. Mazzotti,
R. McBride, L. Richardson, and K. Root. In Review. How Much Is Enough? Landscape-scale Conservation for the Florida Panther. Biological Conservation.
Land, E.D. 1994. Response of the wild Florida panther population to removals for captive
breeding. Final Report, Study Number 7571. Florida Game and Fresh Water Fish Commission; Tallahassee, Florida.
Land, E.D. and R.C. Lacy. 2000. Introgression level achieved through Florida panther genetic
restoration. Endangered Species UPDATE 17(5):99-103. Lasley, M.F.W. 1978. Genetics of livestock improvement. Third Edition, Prentice-Hall;
Englewood Cliffs, New Jersey. Logan, T.J., A.C. Eller, Jr., R. Morrell, D. Ruffner, and J. Sewell. 1993. Florida panther habitat
preservation plan - south Florida population. Prepared for the Florida Panther Interagency Committee.
Mac, M.J., P.A. Opler, C.E. Puckett Haecker, and P.D. Doran. 1998. Status and trends of the
nation's biological resources. 2 vols. U.S. Department of the Interior, U.S. Geological Survey, Reston, Va.
Maehr, D.S. 1989. Florida panther road mortality prevention. Final Performance Report, Study
Number 7502. Florida Game and Fresh Water Fish Commission; Tallahassee, Florida. Maehr, D.S. 1990a. Florida panther movements, social organization, and habitat utilization.
Final Performance Report, Study Number 7502. Florida Game and Fresh Water Fish Commission; Tallahassee, Florida.
Maehr, D.S. 1990b. The Florida panther and private lands. Conservation Biology 4(2):167-170.

63
Maehr, D.S. 1992a. Florida panther. In Rare and Endangered Biota of Florida. Volume I: Mammals. S.R. Humphrey, (ed.). University Press of Florida; Gainesville, Florida.
Maehr, D.S. 1992b. Florida panther distribution and conservation strategy. Final Report, Study
Number 7572. Florida Game and Fresh Water Fish Commission; Tallahassee, Florida. Maehr, D.S. 1997. The Florida panther: life and death of a vanishing carnivore. Island Press,
Washington D.C. 259 pages. Maehr, D.S. and G.B. Caddick. 1995. Demographics and Genetic Introgression in the Florida
Panther. Conservation Biology 9:1295-1298. Maehr, D.S. and J.A. Cox. 1995. Landscape features and panthers in Florida. Conservation
Biology: 9(5):1008-1019. Maehr, D.S. and R.C. Lacy. 2002. Avoiding the lurking pitfalls in Florida panther recovery.
Wildlife Society Bulletin 30:971-978. Maehr, D.S., E.D. Land, J.C. Roof, and J.W. McCown. 1989. Early maternal behavior in the
Florida panther (Felis concolor coryi). America Midlands Naturalist 122:34-43. Maehr, D.S., R.C. Belden, E.D. Land, and L. Wilkins. 1990a. Food habits of panthers in
southwest Florida. Journal of Wildlife Management 54:420-423. Maehr, D.S., E.D. Land, J.C. Roof, and J.W. McCown. 1990b. Day beds, natal dens, and
activity of Florida panthers. Proceedings of the Annual Conference of Southeast Fish and Wildlife Agencies 44:310-318.
Maehr, D.S., E.D. Land, and J.C. Roof. 1991a. Social ecology of Florida panthers. National
Geographic Research and Exploration 7(4):414-431. Maehr, D.S., E.D. Land, and M.E. Roelke. 1991b. Mortality patterns of panthers in southwest
Florida. Proceedings of the Annual Conference of Southeastern Association of Fish and Wildlife Agencies 45:201-207.
Maehr, D.S., R.C. Lacey, E.D. Land, O.L. Bass, and T.S. Hoctor. 1999. A reassessment of
Florida panther population viability analysis and recovery efforts from multiple perspectives. Paper presented at Population Viability Analysis: Assessing Models for Recovering Endangered Species. University of California, Berkeley and The Wildlife Society; San Diego, California. March 15-16, 1999.
Maehr, D.S., E.D. Land, D.B. Shindle, O.L. Bass, and T.S. Hoctor. 2002. Florida panther
dispersal and conservation. Biological Conservation 106:187-197.

64
Maehr, D.S., J.L. Larkin, and J.J. Cox. 2004. Shopping centers as panther habitat: inferring animal locations from models. Ecology and Society 9(2): 9. [online] URL: http://www.ecologyandsociety.org/vol9/iss2/art9.
McBride, R.T. 2000. Current panther distribution and habitat use. A review of field notes:
fall 1999 – winter 2000. Livestock Protection Company; Alpine, Texas. McBride, R.T. 2001. Current panther distribution, population trends, and habitat use. Report of
field work: fall 2000 – winter 2001. Livestock Protection Company; Alpine, Texas. McBride, R.T. 2002. Current verified population, distribution and highlights of field work.
Report of field work: fall 2001 – winter 2002. Livestock Protection Company; Alpine, Texas.
McBride, R.T. 2003. Documented panther population and its current distribution. Appendix
IV, Annual Report: Florida Panther Genetic Restoration and Management. Florida Fish and Wildlife Conservation Commission; Tallahassee, Florida.
McCown, J.W. 1991. Big Cypress Deer/Panther Relationships: Deer Herd Health and
Reproduction. Final Report. Study Number: 7508. Bureau of Wildlife Research, Florida Game and Fresh Water Fish Commission; Tallahassee, Florida.
Nelson, E.W. and E.A. Goldman. 1929. List of the pumas with three described as new. Journal
of Mammalogy 10:345-350. Nowell, K. and P. Jackson. 1996. Status survey and conservation action plan: Wild cats.
International Union for Conservation of Nature and Natural Resources. Burlington Press; Cambridge, United Kingdom.
O’Brien, S.J., M.E. Roelke, L. Marker, A. Newman, C.A. Winkler, D. Meltzer, L. Colly,
J.F. Evermann, M. Bush, and D.E. Wildt. 1985. Genetic basis for species vulnerability in the cheetah. Science 227:1428-1434.
Passarella and Associates, Incorporated (Passarella). 2004. White-Tailed Deer Census Report.
Terafina Development. Passarella and Associates, Incorporated; Fort Myers, Florida. Ralls, K. and J. Ballou. 1982. Effects of inbreeding on infant mortality in captive primates.
International Journal of Primatology 3:491-505. Reed, J.M., D.D. Murphy, and P.F. Brussard. 1998. Efficacy of population viability analysis.
Wildlife Social Bulletin 26:244-251. Rettie, J.W. and P.D. McLoughlin. 1999. Overcoming radiotelemetry bias in habitat-selection
studies. Canadian Journal of Zoology 77:1175-1184.

65
Roelke, M.E. 1990. Florida panther biomedical investigations. Final Performance Report, July 1, 1986 - June 30, 1990. Study Number 7506. Florida Game and Fresh Water Fish Commission; Tallahassee, Florida.
Roelke, M.E. 1991. Florida panther biomedical investigation. Annual performance report,
July 1, 1990 to June 30, 1991, Study Number 7506. Florida Game and Fresh Water Fish Commission; Tallahassee, Florida.
Roelke, M.E., J.S. Martenson, and S.J. O’Brien. 1993. The consequences of demographic
reduction and genetic depletion in the endangered Florida panther. Current Biology 3:340-350.
Root, K.V. 2004. Using models to guide recovery efforts for the Florida Panther. In H.R.
Akçakaya, M. Burgman, O. Kindvall, C. C. Wood, P. Sjogren-Gulve, J. Hatfield, and M. McCarthy (eds.), Species Conservation and Management: Case Studies, Oxford University Press; New York, NY.
Sarkar, S. 2004. Conservation Biology: The Stanford Encyclopedia of Philosophy
(Winter 2004 Edition), Edward N. Zalta (ed.). [online] URL: http://plato.stanford.edu/ archives/win2004/entries/conservation-biology.
Seal, U.S. and Workshop Participants. 1994. A plan for genetic restoration and management of
the Florida panther (Felis concolor coryi). Report to the Florida Game and Fresh Water Fish Commission, by the Conservation Breeding Specialist Group, Species Survival Commission, IUCN; Apple Valley, Minnesota.
Seal, U.S. and R.C. Lacy. 1992. Genetic management strategies and population viability of the
Florida panther (Felis concolor coryi). Report to the U.S. Fish and Wildlife Service. Captive Breeding Specialist Group, IUCN; Apple Valley, Minnesota.
Seal, U.S., R.C. Lacy, and Workshop Participants. 1989. Florida panther viability analysis and
species survival plan. Report to the U.S. Fish and Wildlife Service, by the Conservation Breeding Specialist Group, Species Survival Commission, IUCN; Apple Valley, Minnesota.
Shaffer, M. L. 1978. “Determining Minimum Viable Population Sizes: A Case Study of the
Grizzly Bear.” Ph. D. Dissertation, Duke University. Shaffer, M.L. 1981. Minimum population sizes for species conservation. BioScience
31:131-134. Shaffer, M.L. 1987. “Minimum viable populations: Coping with uncertainty.” Viable
populations for conservation, M.E, Soule, ed., Cambridge University Press, Cambridge, MA, 69-85.

66
Shindle, D., D. Land, M. Cunnignham, and M. Lotz. 2001. Florida panther genetic restoration. Annual Report 2000-01. Florida Fish and Wildlife Conservation Commission; Tallahassee, Florida. 102 pages.
Steelman, H.G., J.A. Bozzo, and J.L. Schortemeyer. 1999. Big Cypress National Preserve Deer
and Hog Annual Report. Thatcher, C., F.T. Van Manen, and J.D. Clark. 2003. Habitat assessment to identify potential
sites for Florida panther reintroduction in the southeast. Final Report to U.S. Fish and Wildlife Service. University of Tennessee; Knoxville, Tennessee.
Tinsley, J.B. 1970. The Florida panther. Great Outdoors Publishing Company; St. Petersburg,
Florida. Turrell and Associates, Incorporated (Turrell). 2001. White-Tailed Deer Census Report. Collier
Regional Medical Center Development. Turrell and Associates, Incorporated; Naples, Florida.
U.S. Fish and Wildlife Service (Service). 1987. Florida panther recovery plan. June 1987.
Prepared by the Technical Subcommittee of the Florida Panther Interagency Committee. Fish and Wildlife Service; Atlanta, Georgia.
U.S. Fish and Wildlife Service (Service). 1995. Florida panther recovery plan: second revision.
March 1995. Prepared by the Florida Panther Recovery Team. Fish and Wildlife Service; Atlanta, Georgia.
U.S. Fish and Wildlife Service (Service). 1999. Multi-species recovery plan (MSRP) for south
Florida. Fish and Wildlife Service; Vero Beach, Florida. U.S. Fish and Wildlife Service (Service). 2000. Florida panther final interim standard local
operating procedures (SLOPES) for endangered species. Fish and Wildlife Service; Vero Beach, Florida.
Wildt, D.E. 1994. Endangered species spermatozoa: Diversity, research and conservation.
Pages 1-24 in: A. Bartke, edition, Function of somatic cells in the testes. Springer-Verlag; New York.
Wildt, D.E., E.J. Baas, P.K. Chakraborty, T.L. Wolfle, and A.P. Stewart. 1982. Influence of
inbreeding on reproductive performance, ejaculate quality and testicular volume in the dog. Theriogenology 17:445-452.
Wilkins, L. 1994. Practical cats: Comparing coryi to other cougars: An analysis of variation in
the Florida panther, Felis concolor coryi. Pages 14-41 in: D.B Jordan, (ed.). Proceedings of the Florida panther conference. U.S. Fish and Wildlife Service; Atlanta, Georgia.

67
Williams, M. 1990. Americans and their forests, a historical geography. Cambridge University Press; New York, New York.
WilsonMiller. 2005. Email message to the Fish and Wildlife Service, South Florida Ecological
Services Office, dated February 11, 2005. Young, S.P. and E.A. Goldman. 1946. The Puma - Mysterious American Cat. Dover
Publications, Incorporated; New York, New York.

68
Table 1. Biological opinions prepared by the Service for projects affecting Florida panther habitat from March 1984 through October 2005.
Biological Opinion
Date
Corps Application No. Project Name County
Habitat Impacts (Acres)
Habitat Preserved
On-site (Acres)
Habitat Preserved
Off-site (Acres)
Total Habitat
Preserved (Acres)
03/29/84 83M-1317 Ford Test Track Collier 530 0 0 0
02/21/85 Unknown I-75 Collier/ Broward
1,517 0 0 0
10/17/86 Unknown Exxon Master Plan Collier 9 0 0 0
1/07/86 861PM-20130 Collier Enterprises (Citrus Grove) Collier 11,178 0 0 0
01/11/88 Unknown NERCO - Clements Energy Collier 3 0 0 0
02/23/88 Unknown Shell Western E&P Collier/ Monroe
0 0 0 0
02/10/89 FAP IR-75-4(88)81 SR 29/I-75 Interchange Collier 350 0 0 0
08/15/90 Unknown I-75 Recreational Access Collier 150 0 0 0
09/24/90 89IPD-20207 U.S. Sugar Corporation Hendry 28,740 700 0 700
03/12/91 90IPD-02507 Lourdes Cereceda Miami-Dade 97 0 0 0
01/14/92 199191279 Dooner Gulf Citrus Collier 40 40 0 40
09/25/92 Unknown BIA, STOF, BCSIR Hendry 1,995 0 0 0
06/18/93 199300393 Corkscrew Road Lee 107 0 0 0
02/25/94 199301131 Daniels Road Extension Lee 65 0 0 0
05/09/94 199202019 Corkscrew Enterprises Lee 563 437 0 437
10/27/94 199302371 199400807 199400808
Florida Gulf Coast University Treeline Boulevard Lee
1,088 526 0 526
05/24/95 199302130 Turner River Access Collier 1,936 0 0 0
08/07/95 199405501 Bonita Bay Properties Collier 509 491 0 491
08/15/95 199301495 SW Florida Airport Access Road Lee 14 0 0 0
09/19/96 199302052 199301404 I-75 Access Points Broward 116 0 0 0
03/10/98 L30(BICY) Calumet Florida Collier/ Broward/ Miami-Dade
0 0 0 0
03/27/98 199604158 Willow Run Quarry Collier 359 190 0 190
09/27/99 199130802 Daniels Parkway Lee 2,093 0 94 94
06/11/99 199800622 STOF Hendry 1,091 0 0 0

69
Table 1. (continued)
Biological Opinion
Date
Corps Application No. Project Name County
Habitat Impacts (Acres)
Habitat Preserved
On-site (Acres)
Habitat Preserved
Off-site (Acres)
Total Habitat
Preserved (Acres)
12/08/99 199607574 Cypress Creek Farms Collier 239 0 24 24
04/17/00 199507483 Miromar Lee 1,323 0 194 194
06/09/00 199900619 Naples Reserve Collier 833 0 320 320
02/21/01 199803037 Wortzel and Landl Lee 106 0 0 0
04/17/01 200001436 WCI Lee 1,183 0 408 408
07/30/01 199003460 Naples Golf Estates Collier 439 175 0 175
08/31/01 199900411 Colonial Golf Club Lee 1,083 0 640 640
12/14/01 199301156 Southwest Florida Airport Lee 8,058 0 6,986 6,986
01/30/02 199402492 Florida Rock Lee 5,269 802 0 802
03/07/02 199901251 Southern Marsh Golf Collier 121 75 80 155
04/24/02 199901378 Hawk’s Haven Lee 1,531 267 0 267
09/24/02 200001574 Verandah Lee 1,456 0 320 320
10/08/02 199602945 Winding Cypress Collier 1,088 840 1,030 1,870
01/27/03 200003795 Walnut Lakes Collier 157 21 145 166
02/21/03 03/10/05R
200001926 Mirasol Collier 800 914 145 1,059
05/19/03 200200970 Apex Center Lee 95 10 18 28
06/18/03 199701947 Twin Eagles - Phase II Collier 593 57 98 155
06/23/03 199905571 Airport Technology Lee 116 55 175 230
07/02/03 199507483 Miromar Lee 342 158 340 498
10/06/03 200102043 Bonita Beach Road Lee 1,117 145 640 785
09/01/03 200206725 SR 80 Lee 33 2 12 14
12/29/03 200202926 The Forum Lee 650 0 310 310
06/14/04 03/21/05R
199603501 Terafina Collier 437 210 261 471
01/18/05 199702288 Bonita Springs Utilities Lee 79 0 108 108
02/22/04 03/16/05R 06/29/05R
20030946 Ava Maria DRI Collier 5,027 0 7,285 7,285
03/31/05 200306759 Gateway Shoppes II Collier 82 0 122 122

70
Table 1. (continued)
Biological Opinion
Date
Corps Application No.
Project Name County Habitat Impacts (Acres)
Habitat Preserved
On-site (Acres)
Habitat Preserved
Off-site (Acres)
Total Habitat
Preserved (Acres)
04/6/05 2004-5312
Seminole Mine Broward 110 0 220 220
05/09/05 2003-5331 2003-6965
Arborwood and Treeline Avenue
Lee 2,329 0 1,700 1,700
06/06/05 2003-11156 Collier Regional Medical Collier 44 0 64 64
06/29/05 199806220 Wentworth Estates Collier 917 0 458 458
07/15/05 199405829 Land’s End Preserve Collier 231 0 61 61
09/06/05 200106580 Parklands Collier Collier 489 157 434 591
10/26/05 200101122 Super Target-Tarpon Bay Plaza
Collier 34 0 20 20
Totals 88,961 6,272 22,712 28,984

71
Table 2. *Targeted and acquired acreage totals of Conservation Lands in south Florida directly affecting the panther.
Name Targeted1
Acreage Acquired Acreage
Indian Reservation
Federal Conservation Lands Everglades National Park 1,508,537 1,508,537 -- Big Cypress National Preserve 720,000 720,000 -- Florida Panther National Wildlife Refuge 26,400 26,400 --
Subtotal 2,254,937 2,254,937 --
State of Florida: Florida Forever Program Belle Meade 28,505 19,107 -- Corkscrew Regional Ecosystem Watershed 69,500 24,028 -- Twelvemile Slough 15,653 7,530 -- Panther glades 57,604 22,536 -- Devil’s Garden 82,508 0 -- Caloosahatchee Ecoscape 18,497 2,994 -- Babcock Ranch 91,361 0 -- Fisheating Creek 176,760 59,910 --
Subtotal 540,388 136,105 -- State of Florida: Other State Acquisitions Water Conservation Area Number 3 491,506 491,506 -- Holey Land Wildlife management Area 33,350 33,350 -- Rotenberger Wildlife Management Area 25,019 20,659 -- Fakahatchee Strand State Preserve 74,374 58,373 -- Picayune Strand State Forest 55,200 55,200 -- Okaloacoochee Slough State Forest and WMA 34,962 34,962 -- Babcock-Webb Wildlife Management Area 79,013 79,013 --
Subtotal 793,424 773,063 -- Indian Reservations2
Miccosukee Indian Reservation -- -- 81,874Big Cypress Seminole Indian Reservation -- -- 68,205Brighton Seminole Indian Reservation -- -- 37,447
Subtotal -- -- 187,526GRAND TOTALS 3,588,749 3,164,105 187,526
1 Targeted acres not available for all lands. In Such cases, targeted equals acquired acreage. 2 Indian lands are included due to their mention in the MSRP. Acreages taken from GIS data. * Table 2 was excerpted from the Brief of Amicus (2003). However, the lands shown as acquired in this table
may include some private in-holdings and may include lands currently under sales negotiations or condemnation actions.

72
Table 3. Habitat suitability values for use in assessing habitat value to the Florida panther.
Land Cover Type Value Land Cover Type Value Land Cover Type Value Water 0 STA 4.5 Cypress swamp 9 Urban 0 Shrub swamp 5 Sand pine scrub 9 Coastal strand 1 Shrub and brush 5 Sandhill 9 Reservoir 1.5 Dry prairie 6 Hardwood-Pine forest 9 Mangrove swamp 2 Grassland/pasture 7 Pine forest 9 Salt marsh 2 Freshwater marsh 9 Xeric oak scrub 10 Exotic plants 3 Bottomland hardwood 9 Hardwood forest 10 Cropland 4 Bay swamp 9 Orchards/groves 4 Hardwood swamp 9

73
Table 4. Panther-Vehicle Collisions
Within Super Target-Tarpon Bay Plaza Panther Consultation Area through October 12, 2005 Panther Number and Distance from Project Roadway Date Result
UCFP05-(G80-15), 24.71 mi. SR 29 NEAR SUNNILAND 1980 DEATH FP01, 23.2 mi. SR 84 18 MM 1983 DEATH UCFP12-(G84-26), 21.42 mi. SR 84 16 MM 1984 DEATH UCFP13-(G85-BNZ), 21.6 mi. SR 84 MM16 1985 DEATH FP04, 22.6 mi. SR 84 17 MM 1985 DEATH NONE, 12.73 mi. CR 951 2 M N US 41 1985 INJURY UCFP15, 21.76 mi. SR 84 16.5 MM 1986 DEATH FP13, 24.74 mi. SR 29 SUNNILAND 1987 DEATH FP28, 19.34 mi. NEAR DANIELS RD. RSW 1988 INJURY UCFP18-(RK-850), 19.89 mi. CR 850 1.5 M S SR 80 1989 DEATH UCFP20-(FP11'S), 24.76 mi. SR 29 PISTOL POND BRIDGE 1991 DEATH NONE, 15.58 mi. ALICO RD. 1 1992 INJURY UCFP21-(FP19'S), 24.76 mi. SR 29 SUNNILAND 1992 DEATH UCFP22, 19.19 mi. DANIELS RD 1 M E I-75 1993 DEATH FP31, 24.74 mi. SR 29 SUNNILAND 1994 DEATH FP51, 24.83 mi. SR 29 @ BEAR ISLAND GRADE 1998 DEATH K76-(FP66), 23.35 mi. 1 MI W SR 29, ON CR 858 2000 DEATH UCFP35, 24.41 mi. CR846 2 MILES E IMMOKALEE 2000 DEATH UCFP41, 24.71 mi. SR 29 SUNNILAND, NEAR MINE RD 2001 DEATH FP98, 24.74 mi. 1 KM N PISTOL POND, SR 29 2002 DEATH FP99, 9.93 mi. CR846 1/4 MI N COLLIER FAIRGRN 2002 DEATH UCFP50 (K33), 16.73 mi. CR846 3.4 MI E EVERGLADES BLVD 2003 DEATH FP106, 24.74 mi. SR29 AT SUNNILAND MINE ENTRANCE 2003 DEATH UCFP53, 24.89 mi. SR29, 1.4 MI N CR858, COLLIER 2003 DEATH UCFP54, 24.97 mi. SR29, 1.7 MI N CR858, COLLIER 2003 DEATH UCFP58, 17.32 mi. CR846 3/4 MILES E OF EVERGLADS B. 2003 DEATH UCFP59, 16.37 mi. CR 858, 1.2 miles west of SR 29 2003 DEATH UCFP60, 22 mi. US41, ~ 1 MI EAST OF CR92 2003 DEATH UCFP63, 9.8 mi. I-75, MM99 EASTBOUND LANE 2004 DEATH
UCFP65, 24.87 mi. SR29, 200 YD N BEAR ISLAND GRADE NORTHBOUND 2004 DEATH
UCFP66, 14.16 mi. I-75, MM93 0.5 MI W EVERGLADES BLVD. 2004 DEATH K156, 10.72 mi. US41 @ TURNER RIVER 2004 DEATH K94, 10.64 mi. I-75, NEAR MM98 EASTBOUND LANE 2004 DEATH UCFP69, 25.04 mi. SR 29 2.5 miles N of CR 858 2004 DEATH UCFP 73 C.R. 951 South of Rattlesnake Hammock Road 2005 DEATH K153 C. R. 951, 1.2 miles south of Davis Boulevard 2005 DEATH UCFP-76 U.S. 41, 1.4 miles east of C.R. 951 2005 DEATH

Table 5. County and State Acquisitions within the Action Area (Acres)
Total Conserved At-Risk
Total Urban Non-urban Total Urban
Non-urban Total Urban
Non-urban
Primary 2,270,617 20,732 2,249,885 1,688,033 6,697 1,681,336 582,584 14,035 568,549 Dispersal 25,410 675 24,735 3,447 40 3,407 21,963 635 21,328 Secondary 807,428 25,551 781,877 311,208 777 310,431 496,220 24,774 471,446 Other 1,545,655 115,788 1,429,867 613,499 3,627 609,872 932,156 112,161 819,995 Total 4,649,110 162,746 4,486,364 2,616,187 11,141 2,605,046 2,032,923 151,605 1,881,318Primary equivalents 3,349,530 77,037 3,272,493 2,103,452 8,464 2,094,988 1,246,079 68,573 1,177,506
Table 6. Lands within the Core Area (Acres)
Year County State 1998 1,723 *
1999 315 *
2000 1,237 *
2001 700 *
2002 369 767
2003 2,291 60
Totals 6,635 827
* data not available
Table 7. Landscape Compensation Multipliers
Zone of Impacted Lands Zone of Compensation Lands Multiplier Primary Secondary 1.5 Secondary Primary 0.667 Other Secondary 0.5 Other Primary 0.33
74

75
Table 8. Florida Panther Habitat Matrix Panther Habitat Units Score Project Development Off-site Habitat Preserved at the
PIMB 34.17 acres 12.3 acres (6 credits)
Functional Units Needed Functional Units Provided 81.575 174.08*
Pre Post Pre Post
Acres PHU Acres PHU Acres PHU Acres PHU Pine Flatwoods 9 5.37 48.33 Exotics Land
Cover Types
13.25 39.75
Willow Marsh 9 1.09 9.81 Urban 0 14.46 0 34.17 0 Cypress Swamp 9 Freshwater Marsh 9 Crop land 4 Subtotal 34.17 97.89 34.17 0 12.29 (6
credits) 174.08*
* The Service has applied our panther habitat assessment to the habitat types at the PIMB, and we have determined that each credit at the PIMB provides 25.6 PHUs. PHUs needed – 97.89 times base multiplier of 2.5 equals 244.725 PHUs. Project is in Other with compensation in Primary, therefore 244.725 PHUs multiplied by 1/3 equals 81.575 PHUs. Applicant is providing 174.08 PHUs.

76
Table 9. Super Target-Tarpon Bay Plaza – Florida Panther Action Area Projects*
Project Name Total Acres
Wetland Acres
Percent Wetland
Acres Year
Applied WEBB/NELSON COLONIAL PARCEL 136.09 1.05 0.77 2004PARKWAY CORNERS 0.81 0 0 ProposedPAVER MODULE 0.22 0 0 ProposedTRIAD 10.80 0 0 ProposedORANGE TREE 2161.17 56.50 2.61 2004MAGNOLIA SQUARE PHASE 3 42.83 2.04 4.76 2004LAKE TRAFFORD MARINA 5.01 0.14 2.83 2004ALICO LAKES VILLAGE 31.71 0.00 0.00 2005ASTRON PLAZA 10.12 0.00 0.00 2004CITY MATTRESS 4.69 0.00 0.00 2004HAMPTON PARK 25.02 0.00 0.00 2004IMMOKOLEE SENIOR HOUSING 7.61 0.00 0.00 2004LIVINGSTON VILLAGE 0.41 0.00 0.00 2003MANATEE PARK 10.90 0.00 0.00 2003MILLER SQUARE 1.90 0.00 0.00 2003MIROMAR LAKES - BASIN 5 AND 6 LAKE INTERCONNECTION 1.27 0.00 0.00 2003MIROMAR LAKES BELLINI AND VOLTERRA 67.84 0.00 0.00 2004MIRROR LAKES HIGH SCHOOL GGG 45.52 0.00 0.00 2005ORANGE BLOSSOM RANCH 641.84 0.00 0.00 2004QUARRY LAKE ESTATES 41.23 0.00 0.00 2004RADIO SQUARE 9.98 0.00 0.00 2003SALVATION ARMY 5.63 0.00 0.00 2001COLLIER COUNTY GOVT. CENTER 56.15 0.06 0.10 2004TOARMINA 87.24 0.10 0.12 ProposedWALNUT LAKES 180.86 0.71 0.40 2001ULTIMATE SKI LAKE 166.68 5.58 3.35 ProposedBRETONNE PARK 340.90 13.67 4.01 2001Totals: 4,094.43 79.85 *Projects listed are those that include less than 5 percent wetland acreage. Projects are listed with their total acreage, wetland acreage, percentage of wetland acres present, and the year the project application was submitted.

77
Figure 1
Super Target-Tarpon Bay Plaza Project Location Map

Figure 2
Proposed Super Target-Tarpon Bay Plaza Aerial Photograph
78

Figure 3
Super Target-Tarpon Bay Plaza in relation to panther primary and secondary zones and telemetry
79

Figure 4
Florida panther consultation area
80
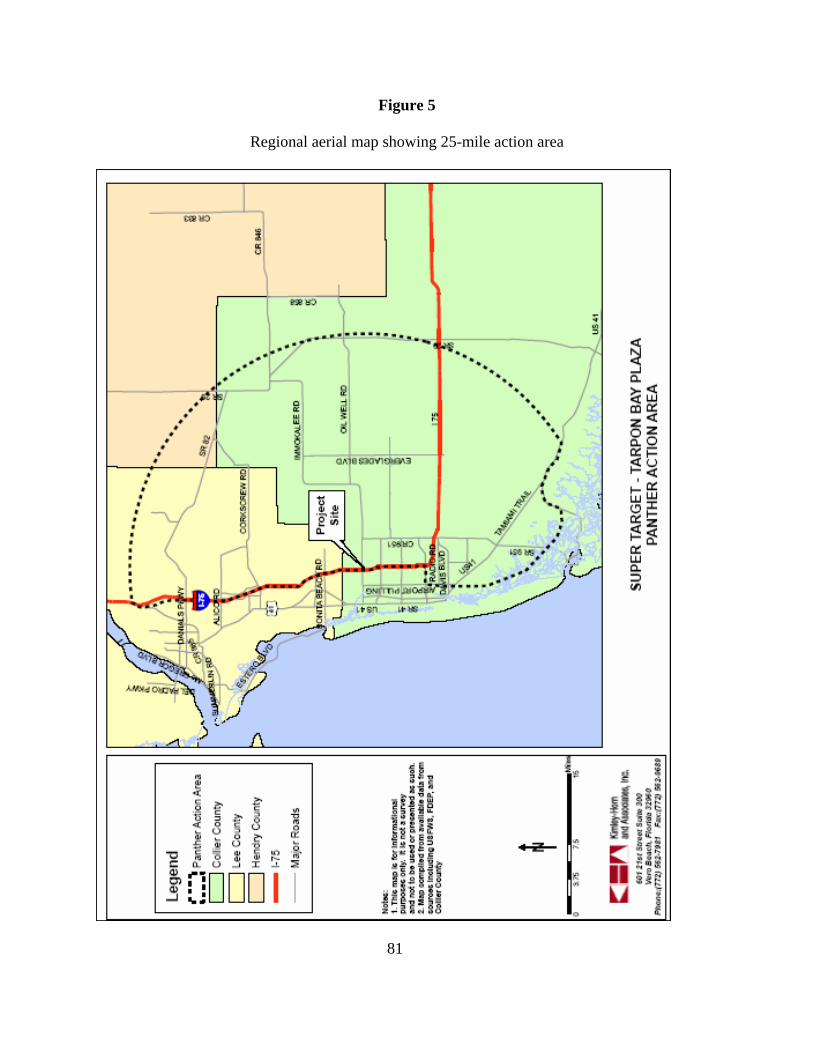
Figure 5
Regional aerial map showing 25-mile action area
81

Figure 6
Panther - Vehicle Collisions and Wildlife Crossings within Action Area
82

Figure 7
Southwest Florida conservation lands
83

Figure 8 Panther Core
Area
84
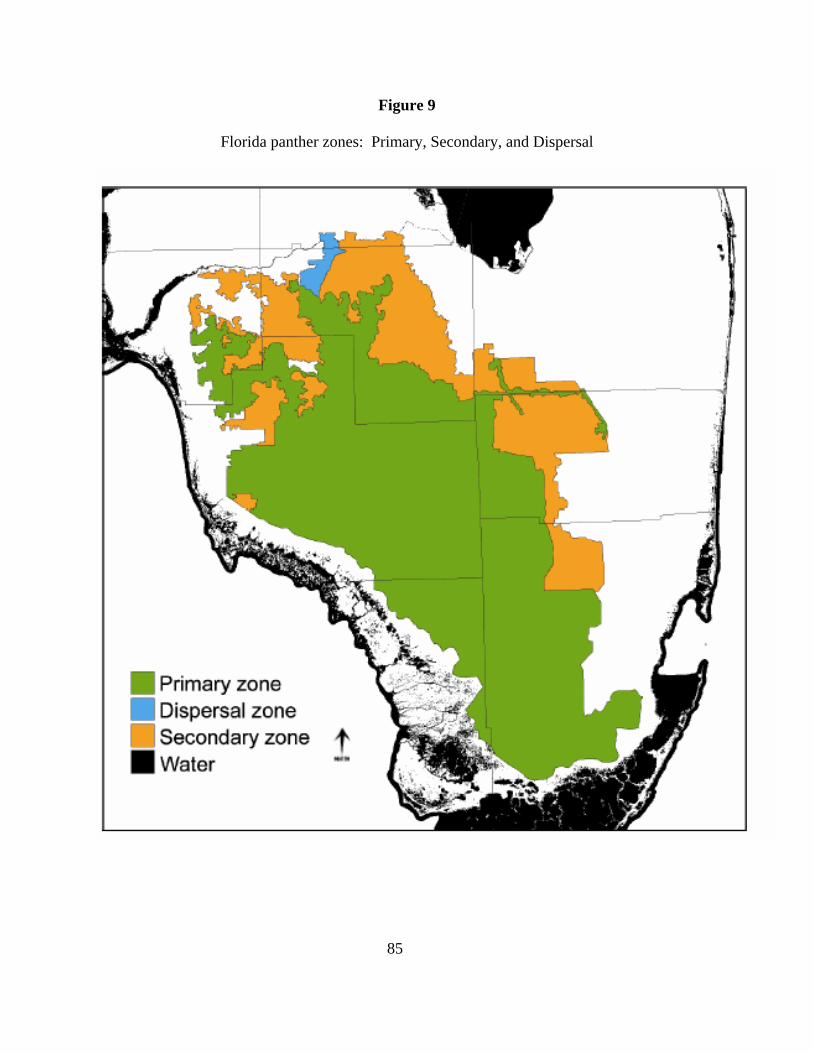
Figure 9
Florida panther zones: Primary, Secondary, and Dispersal
85

Figure 10
Combined project overlay with NWI map
86

Figure 11
Vacant lands in Northern Golden Gate Estates
87

Figure 12 Vacant lands in Lehigh Acres
88