the usability of mobile twitter apps - university of the
TRANSCRIPT

The usability of mobile Twitter apps Determining the usability of mobile Twitter apps on Smart phones
Research report
Master of Arts, Digital Art: Interactive Media
Tshepo Lehutjo
696276
A research report submitted to the Faculty of Arts, University of the Witwatersrand: Johannesburg, in partial fulfilment of the requirements for the degree of Master of Arts in Digital Arts, Interactive Media.
Johannesburg, March 2013.

T. Lehutjo 2
Declaration I declare that this research report is my own unaided work; submitted for the degree of Master of Digital Arts at the University of the Witwatersrand, Johannesburg. It has not been submitted before for any other degree or examination in any other university. Tshepo Lehutjo Date _____________________________________ _____________________________________

T. Lehutjo 3
TABLE OF CONTENTS
Chapter 1: Introduction ................................................................................................... 9
1.1 Introduction ........................................................................................................................... 9
1.2 What is Twitter? ................................................................................................................. 10
1.3 What is usability?............................................................................................................... 13
1.4 What are mobile applications? ..................................................................................... 18
1.5 Research background ...................................................................................................... 20
1.6 Hypothesis, problem, and research questions ........................................................ 22
Chapter 2: Reviewed literature ................................................................................... 24
2.1 Introduction ........................................................................................................................ 24
2.2 How Twitter Inc. understands the user-experience ............................................. 24
2.3 Twitter Inc.’s display requirements ........................................................................... 25
2.4 How Twitter works: the interface ................................................................................ 27
2.5 The importance of usability ........................................................................................... 30
2.6 Evaluating usability .......................................................................................................... 31
Chapter 3: Methodology ................................................................................................. 33
3.1 Introduction ........................................................................................................................ 33
3.2 Lab evaluation .................................................................................................................... 33
3.3 Procedures followed ........................................................................................................ 34
3.5 Criteria for participant inclusion ................................................................................. 36
3.6 Research participants’ characteristics ...................................................................... 36
3.7 Data collection .................................................................................................................... 39
3.8 Data analysis ....................................................................................................................... 39
3.9 Tasks conducted on the Twitter applications ......................................................... 42
3.10 Research design ............................................................................................................... 42
3.11 Participant distribution ................................................................................................ 44
3.12 Physical technology used ............................................................................................. 44
3.13 Mobile Twitter applications used ............................................................................. 44

T. Lehutjo 4
3.14 Human research ethics (clearance attached) ........................................................ 45
Chapter 4: Results ............................................................................................................ 46
4.1 Introduction ........................................................................................................................ 46
4.2 Presentation and discussion of data ........................................................................... 46
Chapter 5: Research conclusions ................................................................................ 60
5.1 The null hypothesis (H0 = true) ..................................................................................... 60
5.2 Proposals for future research ....................................................................................... 61
5.3 Concerning factors ............................................................................................................ 61
5.4 Conclusion ............................................................................................................................ 62
Chapter 6: Appendix ........................................................................................................ 63
Appendix 1: Informed consent form .................................................................................. 63
Appendix 2: Participant demographic questionnaire ................................................. 65
Appendix 3: SUS questionnaire............................................................................................ 67
Appendix 4: Clearance to use Room 2 at Convent Building ....................................... 68
Appendix 5: Human research ethics clearance (Non medical) ................................ 69
Appendix 6: Statistic usability measures ......................................................................... 70
Overall Android OS usability measures ..................................................................................................... 70
Raw usability measures: official Twitter for Android.......................................................................... 71
Raw usability measures: TweetCaster for Android .............................................................................. 72
Overall Blackberry OS usability measures ............................................................................................... 73
Raw usability measures: official Twitter for Blackberry .................................................................... 74
Raw usability measures: TweetCaster for Blackberry ........................................................................ 75
Works cited ........................................................................................................................ 78

T. Lehutjo 5
List of tables Table 1: List of usability criterion………………………………………………..…………………...…........17
Table 2: List of usability criterion…………………………………………………………………….…........18
Table 3: Group statistics for Blackberry SUS scores…………………....……………………..……....46
Table 4: Independent samples T-test SUS score for Blackberry Twitter applications......47
Table 5: Group statistics for Blackberry efficiency scores……....………………..……..…….........48
Table 6: Independent samples T-test efficiency score for Blackberry Twitter
applications…………………………………………………………....………………..……..………...48
Table 7: Fisher’s exact test for Blackberry effectiveness...……....………………..……..……........50
Table 8: Group statistics for Android SUS score……………..……....………………..……..….………53
Table 9: Independent samples t-test SUS score for Android Twitter
applications…………………………………………………………....………………..……………….54
Table 10: Group statistics for Android efficiency scores...……....………………..……..………….55
Table 11: Independent samples T-test efficiency score for Android Twitter
applications..……....………………..………………………………………………………..………….56
Table 12: Fisher’s exact test for Android effectiveness...……......………………..……..……...…...50
Table 13: Showing a breakdown of the results for official Twitter applications......……...50
Table 14: Showing a breakdown of the results for third-party Twitter applications........50
List of figures Figure 1: Typical Twitter.com account feed…………………………………………..….………...……..11
Figure 2: AlertZA website…………………………………………………………………….…………........…..12
Figure 3: TweetCaster for Android screenshot..………………………….……….………....……..…...20
Figure 4: Twitter for Android screenshot..…………………………………….…….………....……...….20
Figure 5: Twitter usage data from Sysomos.com………………………….….….………………..........21
Figure 8: Example of an individual tweet………………….….…………………………...…….…..….....25
Figure 9: Tweets in a timeline……….…………………………………………….…………………..…..…...26
Figure 10: Official Twitter application for Android……………………………….…..……………….27
Figure 11: TweetCaster for Android…………………………………………………….…………….……..29
Figure 12: Research participants’ age distribution.…………………………….……………….……..37
Figure 13: Participants’ twitter activity on cellular phones.........................................................38
Figure 14: Social networks participants were using at the time of this study………….......38
Figure 15: Years of participants’ membership on Twitter.com...................................................39
Figure 16: Calculating a SUS score and the final result...................................................................41
Figure 17: Research design…………………………………………………………………………………...….43
Figure 18: Participant distribution…………………………………………………………………………...44
Figure 19: Task-by-task analysis of mean time spent on tasks: Blackberry.…….……..…....49
Figure 20: Sample task-by-task accomplishment rates: Blackberry.………………..................52
Figure 21: Sample raw SUS score distribution for participants testing the official
Twitter application for Android…………..........................................................................54

T. Lehutjo 6
Figure 22: Sample raw SUS score distribution for participants testing TweetCaster
for Android………………………………………............................................................................55
Figure 23: Task-by-task analysis of mean time spent on tasks: Android..........….…..…........56
Figure 24: Sample task-by-task accomplishment rates: Android.….….……...…………...…….58

T. Lehutjo 7
Acknowledgements
Utmost gratitude goes to Ramokone Lehutjo, what you have given can never be
described nor thanked for enough. I thank Mr. Edward White for his faith, depth of
knowledge in usability and his guidance, which brought me to this point. Also
appreciation to my supervisor, Professor Christo Doherty for seeing this body of work
through to the end. Not forgetting my family, who have had to put up with my absence
many times over in the past year. A special thank you to Sekwala Sathekge for keeping
me sane during the high and low moments; to my roommate, Tebogo Leshabane, thank
you for all the fun we’ve had when I needed a distraction. And to all the participants
who took part in this study, ultimately you are the ones who made the completion of
this study possible - ke a leboga!

T. Lehutjo 8
Abstract This study looks at the usability of mobile Twitter applications running on Android and
Blackberry operating systems. Usability is important for mobile Twitter applications, as
55% of active Twitter users access the social network service through their mobile
devices.
This study gathers empirical data that determines which mobile Twitter application is
superior in terms of usability. The mobile Twitter applications evaluated and compared
in this study are the official Twitter applications for Android and Blackberry and the
third-party Twitter application: TweetCaster for Android and Blackberry.
Data is gathered using the System Usability Scale and notes regarding time spent on
tasks and the accuracy of task completion are kept, in order to measure satisfaction,
efficiency, and effectiveness respectively. The findings of this study show that there is
need for further studies and highlights further areas for improvement on mobile
Twitter applications.
Keywords: Android, applications, Blackberry, mobile, Twitter, TweetCaster, usability
T. Lehutjo 9
Chapter 1: Introduction
1.1 Introduction
This study compares the usability of two sets of mobile Twitter applications: the official
Twitter applications for Android, and Blackberry OS; and TweetCaster, a third-party
mobile Twitter application designed and developed by 1LouderApps.
Mobile Twitter applications facilitate the usage of Twitter.com on mobile cellular
phones for 55% of Twitter’s 100 million active users (Stock Market), a considerably
large number that necessitates that mobile Twitter applications be usable. Dumas and
Redish state that usability is achieved when “people who use the product can do so
quickly and easily to accomplish their own tasks” (4). Usability is important in this
regard because it aims to “make things easier and more efficient for the user”
(Faulkner3). This is done by focusing the designers’ attention on the user. According to
Dumas and Redish, in order to develop usable products, the designer needs to know and
understand the people who will be using the product that is being designed (4-6).
In this study, empirical data obtained from usability evaluations conducted on mobile
Twitter applications are presented and discussed. Chapter 1 begins by setting the
context that necessitates the study by introducing a critical discussion of the different
concepts involved in this study, which are: usability, the Twitter social network service,
mobile applications, and the research background shaping the Twitter mobile
application landscape. The research problem, hypothesis and research questions are
also raised in this chapter.
In Chapter 2, the research background presented in Chapter 1 informs the choice of two
case studies that are discussed and paralleled with the research background The
chapter then goes on to review Twitter Inc.’s expectations of usability and user
experience on mobile Twitter applications, and concludes by analysing methods of
usability evaluation which are important for the research design of this study.
The aforementioned research design is presented in Chapter 3 as part of the
methodology used in this study. The methodology chapter includes details of the
criteria used for participant inclusion, methods of data collection and analysis, the
rationale for conducting laboratory usability evaluations over field evaluations, the
procedures followed, and information on the physical and mobile application
technology used.
The fourth chapter presents a critical discussion of the results obtained using the
methods described in Chapter 3. In this chapter the researcher conducts a null
hypothesis test, then goes on to give a critical analysis of the empirical results obtained
for each usability criterion and discusses what the results mean for the research
question.
T. Lehutjo 10
Given the results obtained in Chapter 4, the null hypothesis is examined in Chapter 5,
where a decision is made on whether to reject or retain the null hypothesis and what
the decision means for the study, for users, and for mobile Twitter application
development. The fifth chapter also brings this study to a conclusion by accounting for
the limitations of the research, proposals for future research, and the factors of concern
uncovered during the usability tests conducted in this study.
1.2 What is Twitter?
Twitter is a social network website with 100 million active users across the world
(Stock Market). Using Twitter.com, users can send and read text messages of up to 140
characters in length called “tweets”. According to the “about” webpage on Twitter.com,
these short 140 character posts allow for rapid information sharing and informal
collaborations among users. Twitter is further described as a real-time information
network hub that enables its users to connect to content (which may be stories, ideas,
and opinions) that they find compelling.
Twitter was founded in 2006 in San Francisco, USA as the idea of Jack Dorsey, an
engineer at podcasting company Odeo Inc. (Picard). He is now co-founder and executive
chairman at Twitter Inc. However, the origins of Twitter started much earlier when, at
the age of 8, Dorsey developed a fascination for cities and the activities that go on in
them, collecting digital maps of different cities and colour coding locations on them in
order to visualise certain activities This fascination would later lead him to build a
Twitter prototype in the year 2000, a piece of software he ran on his Blackberry cellular
phone that enabled him to send messages to his friends in the form of SMS texts,
updating them about what he was doing at any particular time (Truong).
According to Truong, while testing the software, Dorsey found that not only did people
not care about what he was doing at that time; they also had no easy way of responding
to him. As a result he shelved the idea until 2006, when Odeo Inc. faced the possibility of
going out of business as Apple Inc. announced that it was going to launch free
podcasting through iTunes.
Truong observes that at the time, Odeo Inc. could not compete with Apple Inc. with
regard to podcasting, so they needed new ideas and to take the company in a new
direction. As a result, Dorsey having learnt his lessons, revisited the idea of short text
message updates and convinced Evan Williams, the co-founder of Odeo Inc. to let him
build a prototype. In the space of two weeks Dorsey built the new prototype of what
was to become the Twitter.com of today.

T. Lehutjo 11
Fig. 1: Example of a typical Twitter.com account feed.
Having started with only a few users who were friends, family and colleagues of the
Twitter.com founders, the first major growth of the Twitter service came in 2007 when
it was exhibited at the South By South West conference, amassing a large following and
“twittering” at the conference (Beale).
Since then, Twitter has become a robust social communication tool, always current,
always short and concise. News agencies such as News24 use Twitter.com to gather
public opinion. For example, on the 15th May 2012, the Democratic Alliance political
party staged a protest march in Braamfontein which turned violent when the group met
with pro-government supporters. News24 collected public opinion simply by using the
Twitter search function to search for #DAmarch (News24). This search query returned
current and up-to-the-minute results about what was happening on the streets and
what people thought of the protest.
In order to connect with others on Twitter, a user needs to register for an account, and
to search or browse for people and/or organisations that he/she finds interesting in
order to receive tweets from them. The registered user is also able to post tweets that
can be seen by all the Twitter connections that choose to subscribe to the user’s
account.
This study found that the majority of people who use the social network, are trying to
“keep in touch” using Twitter, whether it be with friends and family or their favourite

T. Lehutjo 12
celebrity. The whole point of being a member of Twitter.com is to stay in touch and
connected. Below are the five growing uses of Twitter, as reported by Emma Gannon:
- Twitter for good: A good example of this is the www.alertza.co.za web service
that uses the Twitter handle: @AlertZA. The AlertZA service uses “Twitter for
good” in the sense that it sends out criminal reports collected from its members
to its Twitter page. Users who are connected with AlertZA on Twitter are then
able to “retweet” to their own web of Twitter connections, thus making more and
more people aware of a crime that has been committed. This information is also
presented as mappable data on the AlertZA website, as per the example shown in
figure 2.
Fig. 2: AlertZA website showing a report for the Dobsonville area, where the gang rape of a
minor had been filmed via a cellular phone.
- Twitter for breaking news: this use sees Twitter not just delivering the news
but often being at the centre of it - creating the news. For example, in 2011
during the 18 month Egyptian uprising against President Hosni Mubarak, social
media played a key role in organising people through Facebook events and
amplifying the message to the broader world using Twitter. When the Egyptian
government cut off the Internet, Google Inc. created Speak2Tweet, which allowed
activists to leave voice messages that were then posted on Twitter (Crovitz).
- Twitter and journalism: “…it is interesting to think that all Twitter users are
essentially contributing to the daily round-up of news” (Gannon). Twitter is a
public domain web service, and users contribute to it with personal and political
opinion- Twitter users’ tweets are paraphrased and quoted as sources of news,
in times when public opinion matters, while live television shows such as the
Supersport channel that airs on South Africa’s Digital Satellite Television (DSTV)
T. Lehutjo 13
have Twitter accounts where users can post tweets that are then shown on the
television in real-time.
- Twitter for job search and recruitment: this is about connecting with people
in a user’s line of profession or sphere of interest. It allows users to get
acquainted with a Twitter-registered company’s philosophy. The immediacy of
information coming through Twitter is also of great advantage to users as they
are able to stay current and updated.
- Twitter for customer service: this entails users engaging with a brand
(company) online to receive customer service without the hassles of lengthy call-
centre telephone conversations.
Looking back, Twitter has come a long way from the simple idea of updating friends
about one’s daily activities to becoming a website that hosts more than 140 million
tweets every day (Picard). According to an article in The Guardian by Rushe, as of 2011,
the company was estimated to be worth $10 billion, a figure based on Twitter Inc.’s
potential to derive benefit from its large user base. Twiter.com continues to grow
steadily, but there are reservations about whether Twitter Inc. can make money and be
profitable through the Twitter social network (Rushe).This brings up the question of
usability and its connections with the commercial viability of a software product (Seffah
and Metzker 10). A usable software product is more likely to be accepted by users and
would therefore have greater potential to increase market share and revenue, than a
product that is not usable.
1.3 What is usability? “Usability breaks down the wall between the designer and the user, and allows us to see how real users do
real tasks in the real world” – (Spotless Interactive)
The term usability originated in 1959 when Brian Shackel first raised the concept of
ergonomics for the computer (Faulkner 6). However according to Faulkner, today’s idea
of usability (which is based on R B Miller’s 1971 definition of usability, which was cited
and put forward in more detail by Shackel and Richardson in 1981) emerged later on
from Shackel’s tentative origins of 1959 (6).
When reviewing the literature on usability, it was found that there exists an evolution of
usability, where over the years the conceptualisation of usability has taken on varying
definitions. This is because usability has been evaluated by practitioners and scholars to
measure and analyse the usability of different kinds of products besides computers and
in various contexts (Faulkner 9). As a result, varying definitions of usability have
emerged. Coursaris and Kim believe that many of the prominent usability definitions
suggest the idea of the ease with which people can use a “technology artefact” to achieve
a certain goal (1).

T. Lehutjo 14
The existence of a number of definitions of usability necessitates that efforts be made
towards a consolidated definition, as has already been attempted in the International
Organisation for Standardisation’s (ISO) ISO 9241-11 standard protocol. The use of a
standard definition of usability is necessary because it will allow for consistency in the
measurement of usability (Coursaris and Kim 4).
Additionally, it is important to note that mobile and desktop computer systems are
different and present different challenges for designers in designing for usability.
According to the Opera Software developer website (dev.opera.com) the characteristics
that differentiate mobile devices from desktop computers are:
- Input devices: the devices used in this usability study had QWERTY keyboards as
those used on desktop computers but are much smaller, making typing slightly
difficult when compared to desktop computer keyboards.
- Touch screen: there is no concept of hover states (mouse-over states).
- Different menu controls and special keys.
- Smaller screen sizes.
As a result of this difference in desktop and mobile devices and its influence on
designing for usability, the questionnaire used in this research was the System Usability
Scale (SUS).
In an article on the characteristics of the SUS questionnaire, Sauro states that the SUS
questionnaire is a “technology agnostic” questionnaire, which enables it to be used by
researchers on any type of system a user interacts with.
Quantifying/defining usability:
According to Faulkner, the first attempt at defining usability was by R. B. Miller, whose
idea of usability was based on the idea of “ease of use” (6). This idea of ease-of-use is
encapsulated in the ISO-9241-11standard’s definition of usability, which suggests that
usability is “the extent to which a product can be used by specified users to achieve
specified goals with effectiveness, efficiency, and satisfaction in a specified context of
use” (sec. 3). Similarly, Preece et al. believe that usability “refers to ensuring that
interactive products are easy to learn, effective to use, and enjoyable from the user’s
perspective”(19). Both definitions point towards the idea of ease in using a product,
although Preece et al.’s definition is focused narrowly on interactive products.
An examination of the above definition from the ISO 9241-11 protocol suggests that
usability can be measured using three criteria, namely:
- Effectiveness: according to the ISO 9241-11 protocol, effectiveness as a criterion
for usability is understood as the accuracy and wholeness with which users can
accomplish specific tasks (sec. 3). There is no sense of time-to-complete-tasks

T. Lehutjo 15
implied here, there is also no concept of ease of use; the assigned task simply has
to be accomplished in its entirety by the user.
For example, if users can accomplish a specific task on system A but cannot
accomplish that same task using system B, system A is thought to be more
effective than system B.
Preece et al. view effectiveness as referring to how successful an interactive
product is at fulfilling its purpose (19). For example, assuming that a software
application is intended to allow people to upload pictures onto the Web, users
need to be able to accomplish the task of uploading a picture to the Web for the
software application to be considered effective.
Shackel and Richardson’s definition of usability states that an application’s
usability is “the capability in human functional terms to be used easily and
effectively by the specified range of users, given specified training and user
support, to fulfil the specified range of tasks, within the specified range of
environmental scenarios” (24). In Shackel and Richardson’s definition,
effectiveness implies a concept of speed and performance where the idea of an
effective system is one that allows a task to be accomplished within a specified
time limit (25). This means that assuming that a reasonable time-frame to
complete a specific task is 5 minutes, the system will need to provide the user
with the necessary tools to ensure that the user is able to accomplish the task in
within 5 minutes. The task will also need to be conducted accurately and
accomplished as a whole for the system to be considered effective.
All three definitions of effectiveness as a criterion for usability, from the ISO
9241-11 protocol, to Preece et al., and Shackel and Richardson, imply that a
specific task has to be completed accurately and wholly for a system to be
considered effective. Additionally, as per Shackel and Richardson’s definition, the
task should also be accomplished within a reasonable time frame.
As a result, in this study, the definition of effectiveness will be the user’s ability to
accomplish a task accurately and as a whole, within a reasonable time frame.
- Efficiency: the ISO 9241-11 protocol refers to efficiency as the extent to which
resources can be expanded to support users in carrying out accurate and
complete tasks (sec. 3). According to this definition, efficiency as an attribute of
usability implies a sense of time-to-complete-tasks. This means that if users
accomplish a specific task on system A in 2 minutes, and then it takes them 3
minutes to accomplish the same task on system B, system A is thought of as more
efficient than system B.

T. Lehutjo 16
According to Preece et al., efficiency as a usability attribute refers to the manner
in which users are supported when carrying out their tasks (19). Just as in the
ISO 9241-11 protocol, efficiency as defined by Preece et al. implies a sense of
time-to-complete-tasks. Additionally, the tasks carried out by users are meant to
be accomplished “through a minimal number of steps”.
Instead of efficiency, Shackel and Richardson list learnability as one of their
usability criterions. Shackel and Richardson’s concept of learnability has a
specified time frame within which users of the system should acquire familiarity
and a certain level of proficiency in using the system (25). Therefore, Shackel and
Richardson’s definition of learnability, which considers the time it takes users to
learn how to use the system and conduct tasks, is similar in concept to Preece et
al. and the ISO 9241-11 protocol’s definitions of efficiency in terms of focusing on
the time it takes users to accomplish tasks. It can also be argued that efficient
systems do not have prolonged learning time frames.
Therefore Shackel and Richardson’s use of learnability as a criterion for usability
is hereby collapsed into and considered as efficiency for this study.
Upon examination of Preece et al., Shackel and Richardson, and the ISO 9241-11
protocol definitions of efficiency as an attribute of usability, in this study
efficiency will be measured by the time it takes users to accomplish tasks.
- Satisfaction: in the ISO 9241-11 protocol satisfaction is associated with
“freedom from discomfort” and “positive attitudes” (sec. 3). In general,
satisfaction is about how acceptable users find the system. It is expected that
satisfaction should be sustained throughout further encounters with an
application.
The idea of satisfaction as a usability criterion is understood as the user’s
subjective view or “attitude” towards the system in terms of likability (Booth
111).
Shackel and Richardson also define satisfaction or user attitude as “within
acceptable levels of human cost in terms of tiredness, discomfort, frustration,
and personal effort” (25).
The above three definitions of satisfaction as a usability criterion all point
towards a subjective point of view from the users’ perspective, meaning that in
order to determine the level of user satisfaction with a given system, the users of
the system need to be involved in determining how satisfactory the system is, by
providing their individual feedback.

T. Lehutjo 17
For this study, satisfaction holds the same idea and meaning as that contained in
the definitions of Booth, Shackel and Richardson, and the ISO 9241-11 protocol,
in that it focuses on a user’s subjective perspective of how satisfactory a system
is to use.
The above attributes of usability are specific objectives that can be assessed using
quantitative measures in order to probe the usability of a system in order to improve
the user’s performance and satisfaction.
List of usability criteria
Below is a table summarising the criteria listed in each scholar’s definition:
Criterion: ISO 9241-11 Preece et al. Booth Shackel and Richardson
Usefulness x
Utility x
Safety x
Effectiveness x x x x
Satisfaction x x x x
Efficiency x x
Memorability x
Flexibility x
Learnability x x x
Table 1: List of usability criterion (satisfaction and effectiveness).
At this stage, effectiveness and satisfaction appear to be the only attributes of usability
common to each of the scholars definitions. As previously mentioned in the introduction
to section 1.3, these apparent differences may be accredited to the scholars’ different
perspectives and contexts in which they apply usability. In order to conduct this study
with a manageable set of usability criteria, only the criteria that are common to the
definitions of all of the above listed scholars will be measured, namely effectiveness and
satisfaction.
By using only the common usability criteria in this study, a degree of consistency with
other usability studies can be ensured, regardless of the usability definition other
researchers have chosen to adopt.

T. Lehutjo 18
However, using the ISO 9241-11 protocol’s definition of usability to standardise the
above listed criteria, it can be argued that the ISO 9241-11 protocol makes no mention
of learnability on the grounds that an efficient system would not have a prolonged
learning time frame.
Also, Preece et al. and the ISO 9241-11 definitions of efficiency are based on the concept
of time-to-complete-tasks by users. Additionally, Shackel and Richardson’s definition of
learnability implies ideas of speed when conducting tasks. This encompasses Booth’s
definition of learnability which was based on Shackel’s 1986 definitions of usability
criteria, which were later refined by Shackel and Richardson in 1991. As a result, in this
study, learnability as a usability criterion will be collapsed into and considered as one
criterion, namely efficiency.
Therefore, the summary table listing the usability criteria can thus be redrawn as
follows:
Criterion: ISO 9241-11 Preece et al. Booth Shackel and Richardson
Usefulness x
Utility x
Safety x
Effectiveness x x x x
Satisfaction x x x x
Efficiency x x x x
Memorability x
Flexibility x
Table 2: List of usability criterion (satisfaction, efficiency and effectiveness).
From this new table, there is a consistent pattern of three usability attributes, namely:
efficiency, satisfaction, and effectiveness. These three attributes are therefore adopted
as this study report’s point of approach to measuring usability. This means that the
usability tests conducted in this study will answer how TweetCaster and the official
Twitter applications measure up to each other on the basis of efficiency, satisfaction,
and effectiveness.
1.4 What are mobile applications? A Smartphone’s ability to complete our lives is directly related to the richness and quality of its mobile
applications. – (Butler)

T. Lehutjo 19
According to PC Magazine Encyclopaedia, a mobile application is a piece of software that
runs on mobile devices such as tablets, mobile cellular phones or other portable devices.
The first mobile applications on the market go as far back as the end of the 20th century,
and took the form of ringtone editors, small arcade games, and calculators (Jukov). The
advent of modern mobile applications was first experienced in July of 2008, when Apple
Inc. launched the “App Store”- a website for downloading free and paid-for applications
(Price).
Apple Inc.’s launch created a battle among mobile operating system manufacturers to
become the biggest mobile application provider, in part to appease customers who
demanded increased functionality on their mobile devices (Jukov). The increased
functionality can be achieved by installing a mobile application on the mobile device. It
should also be noted that companies are financially incentivised to facilitate a mobile
application store, due in part to the success of iTunes, which spawned many others.
Apple Inc. had a total of 10 billion mobile applications downloaded, from the launch of
the App Store in 2008 up to January 2011 (Price).
A month after the launch of Apple Inc.’s App Store, Research In Motion (RIM)
announced that it would also open an application store - named App World - for its
Blackberry devices. As of March 2011, RIM had 3 million downloads per day from its
range of 37 176 mobile applications. By comparison, Android, which launched its
application store called Google Play on 21 October 2008 with a mere 50 mobile
applications, had 6 billion mobile applications downloaded from its 250 000
applications between October 2008 and July 2011(Price).
In an article on the history of mobile applications, Jukov points out that mobile
applications have become popular, as they provide users with additional functionality
on their mobile devices, enabling them to “learn, earn, and have fun”. TweetCaster and
the official Twitter applications are mobile applications that allow users to perform
Twitter.com website functions, such as reading and posting tweets, finding current
Twitter trends, and sending direct messages, thus in essence enabling the user to take
the Twitter experience away from the desktop setting to wherever they may go, through
their mobile devices.

T. Lehutjo 20
Fig. 3: screenshot: TweetCaster for Android. Fig. 4: screenshot: Twitter for Android.
1.5 Research background “Flipboard CEO Mike McCue expresses concern over Twitter’s myopia, shortly after quitting its board” –
(Wauters)
Twitter Inc. and its third-party application developer community have been at odds
over the past couple of months, mainly due to actions and rules imposed on developers
by the company in a bid to gain more control over Twitter’s overall user experience.
Terdiman of CNet news views this as Twitter Inc.’s attempts to control its service’s user
experience as a way to monetise its audience through advertising. However, according
to Parr, “this requires controlling the user experience” and for Twitter Inc. this is
particularly difficult as the company does not control the user experience on third-party
Twitter applications. As a result, according to Parr, of not being in full control of the user
experience, Twitter Inc. is unable to determine the look and feel of third-party mobile
Twitter applications and the advertisements that are delivered to users. Additionally,
the revenues generated from those advertisements do not go to Twitter Inc. but rather
to the third-party developers of the applications.
In its “Rules of the road” post in May 2012, Twitter Inc. discouraged third-party Twitter
application developers from replicating the core Twitter experience (Brian), an issue
critics believed would stifle the development of innovative applications (BBC News
Technology), thus depriving users of the variety of choice in Twitter applications.
In response to the kind of criticism raised by BBC News Technology, Twitter Inc. has
recently made new developments on its official mobile Twitter applications by
integrating image uploads onto its mobile website, a feature that was first implemented
only on mobile cellular devices running Android’s Ice Cream Sandwich and then later on
T. Lehutjo 21
Jelly Bean operating systems. It was thereafter extended to work on Apple’s iOS mobile
cellular phones and is now available for Blackberry OS.
According to Brian, the implemented image upload button on the official Twitter
applications for Android and iOS devices, is less fast and more bulky to navigate when
examined against other third-party offerings. Other experts such as Panzarino, a
technology blogger at The New Web, share the view that Twitter Inc.’s official mobile
applications are somewhat inferior when compared with third-party mobile Twitter
applications. Panzarino believes that even the most updated of Twitter’s official mobile
applications lag behind in “feature set and polish” compared to other third-party
applications like Twitterific, Tweetbot, Echofon, Tweetings, and others (Panzarino).
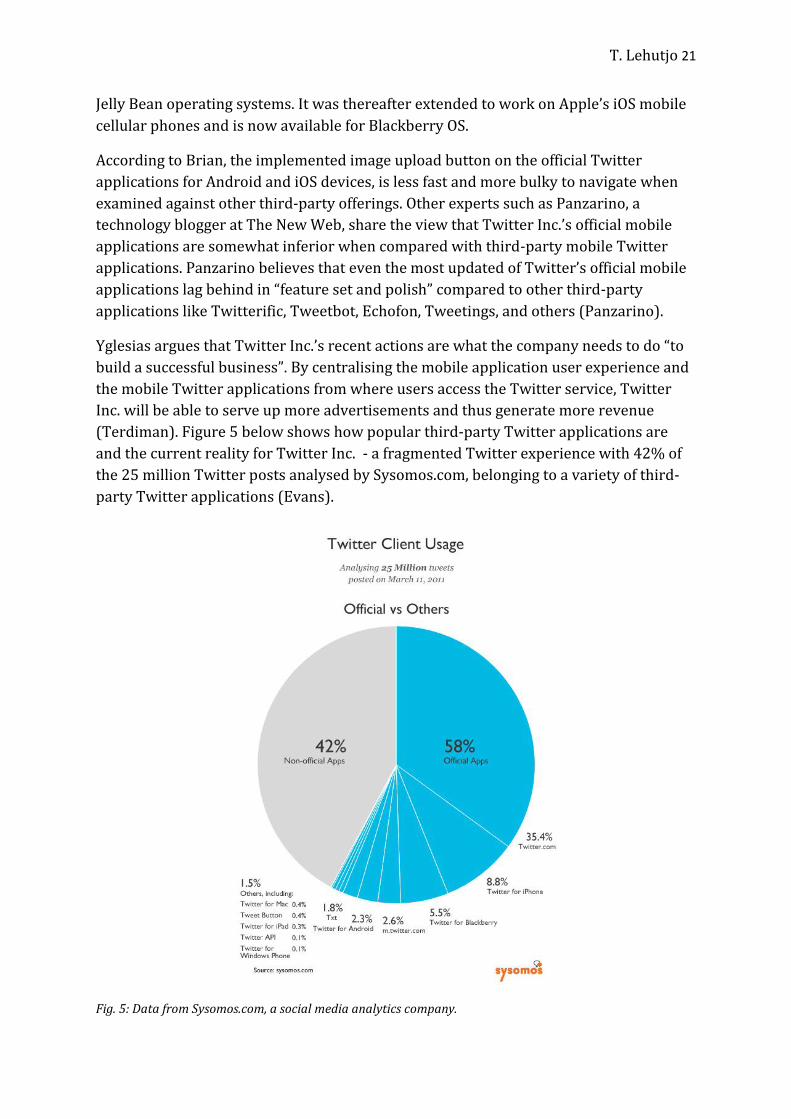
Yglesias argues that Twitter Inc.’s recent actions are what the company needs to do “to
build a successful business”. By centralising the mobile application user experience and
the mobile Twitter applications from where users access the Twitter service, Twitter
Inc. will be able to serve up more advertisements and thus generate more revenue
(Terdiman). Figure 5 below shows how popular third-party Twitter applications are
and the current reality for Twitter Inc. - a fragmented Twitter experience with 42% of
the 25 million Twitter posts analysed by Sysomos.com, belonging to a variety of third-
party Twitter applications (Evans).
Fig. 5: Data from Sysomos.com, a social media analytics company.

T. Lehutjo 22
Unfortunately, in its bid to gain full control of its service’s user experience rather than
leave it to the discretion of third-party application developers, Twitter Inc. has imposed
strict rules on developers. These are in turn limiting the developers’ freedom to create
new Twitter applications that let users do what official Twitter applications are already
doing, which is to facilitate tasks like posting, reading, and responding to tweets
(Twitter Developers).
In response to the restrictions placed on them by Twitter Inc., developers have taken
the matter to the United States of America’s Federal Trade Commission (Panzarino) in a
move that seeks to counter Twitter Inc.’s rhetoric that third-party applications are no
longer welcome to compete on equal footing with its own in-house applications. David
Barnard of AppCubby, a third-party Twitter application developer, reiterates these
sentiments in an interview with Panzarino, stating that the recent changes made by
Twitter Inc. will lead to “inferior service” and “fewer choices” for users.
The arguments presented here show that Twitter Inc. has adopted a pro-active role in
ensuring that both Twitter on the web and mobile Twitter applications provide a
consistent user experience. As Myers writes on changes reported in Twitter’s “Come
and see what we are building” press conference, “the biggest changes of all have been a
redesign and brand new apps (referring to official Twitter applications for Android and
iPhone) that focus on simplicity, discovery, and usability”.
Therefore, it is pertinent to determine how usable the third-party Twitter application
TweetCaster is, when compared to official Twitter applications for Android and
Blackberry operating systems.
TweetCaster for Android and Blackberry was chosen for this study because of its
availability in both the Android and Blackberry mobile application stores. Using one set
of mobile Twitter applications in this way is important for this study so that any
recurring usability problems can be identified when the applications are tested on the
two mobile operating systems.
Additionally, TweetCaster is available for download at no cost and is rated by customers
in the application stores for both Blackberry and Android, to be above average. It has a
customer rating of 3.5 and 4.4 respectively, and it is for this reason that TweetCaster
was chosen over other third-party applications such as HootSuite, Echofon, Tweetings,
and Plume.
1.6 Hypothesis, problem, and research questions
Hypothesis
The hypothesis (H1) for this study, as informed by the research background and the
popularity of third-party Twitter applications as noted by Evans, is that:

T. Lehutjo 23
- There is a significant statistical difference in the quantitative usability measures
of third-party mobile Twitter applications when compared with official mobile
Twitter applications.
The hypothesis is also based on the fact that users are attracted to systems that offer
usability and ease of understanding (Norman 13). The difference in usability measures
might be a factor in explaining the popular use of third-party mobile Twitter
applications instead of official mobile Twitter applications.
The null hypothesis (H0) then is that there is no significant statistical difference in the
quantitative usability measures of third-party mobile Twitter applications when
compared with official mobile Twitter applications.
Research question
The research question for this study, as informed by the research background is:
- How do Android and Blackberry cellular phone users experience the usability of
official Twitter applications compared to popular third-party Twitter
applications such as TweetCaster?
Problem statement
The problem undertaken by this study is to measure and compare pre-determined
usability criteria on official mobile Twitter applications for Android and Blackberry
operating systems against those of TweetCaster running on the same operating system
platforms.

T. Lehutjo 24
Chapter 2: Reviewed literature
2.1 Introduction
The reviewed literature discussed in this chapter looks at the user interface of mobile
Twitter applications and how they work; addresses Twitter Inc.’s expectations of
usability and consistency in their in-house mobile applications and those of third-party
application developers; and in section 2.6, finally looks at ways of testing and measuring
usability. This will set the tone for Chapter 3 in outlining the methodology used in
conducting this study.
Informed by the research background in Chapter 1, section 2.3 and 2.4 will examine
ways in which Twitter Inc. is employing display requirements and design guidelines to
ensure that Twitter.com mobile users enjoy a consistent user experience when using
mobile Twitter applications for both third-party and official Twitter applications.
Section 2.2 below, reflects on Twitter Inc.’s efforts to be mindful of usability and the
user experience that is served through mobile Twitter applications to users.
2.2 How Twitter Inc. understands the user-experience “Neglecting the tablet experience could harm the company’s overall mobile strategy”- (Bilton) commenting
on Twitter’s idea of taking charge of the user experience on their mobile applications.
According to the Twitter Developer Site, in the interest of consistency there are four
main principles according to which all Twitter Inc. and third-party application
developers should abide when designing applications.
The four principles, as posted on the Twitter Developer Site are:
- Don’t surprise users: Display guidelines (which are shown below, in the next
section) are offered so that application developers will design fairly consistent
interfaces that will not surprise, confuse, or frustrate users. Developers are
further asked by Twitter Inc. to maintain the integrity of Tweets, which means
that their applications are not allowed to edit or revise any user-generated
content.
- Don’t create or distribute spam: This principle addresses any malicious
intentions that may affect the reputation of Twitter Inc., either intentionally
encouraged or facilitated by a third-party application, which will result in that
particular Twitter application being suspended or having its application-access
status terminated.
- Respect user privacy: According to this principle, Twitter application developers
are required to fully disclose to the user what they plan to do with the

T. Lehutjo 25
information they collect from users. Any encouraging of user disclosure or
publishing of confidential user information will result in the application’s
developer being punished.
- Be a good partner to Twitter: Being a good partner to Twitter Inc. means that the
relationship between the company and the application developer is in good faith.
Any Twitter application that induces users to violate Twitter Rules will
immediately be terminated. This principle also champions respect for
intellectual property.
Twitter maintains that the four principles listed above are not meant to be dictatorial
about how developers design their mobile Twitter applications but are rather for the
“benefit of the users” (Twitter Developers).
2.3 Twitter Inc.’s display requirements “We’re committed to bringing the power and interactivity of the Twitter network to all platforms, and we
will continue to evolve the user experience within Tweets and timelines.” – (Twitter Developer display
requirements).
In addition to their design principles, Twitter Inc. also provides guidelines for the visual
design of Twitter applications for both mobile and desktop computers. The display
requirements are seen as Twitter Inc. trying to create visual consistency on the Twitter
service so that users know what to expect of a Twitter interface regardless of the
operating system platform or mobile device they use. Any deviation from the visual
structure provided by Twitter Inc. could result in confusion for users. This is important
for the researcher to be aware of when analysing the usability data.
Below are visuals posted on the Twitter Developer’s Webpage, showing examples of the
way in which Twitter Inc. wishes to see tweets displayed in mobile Twitter applications
and the Twitter.com website.
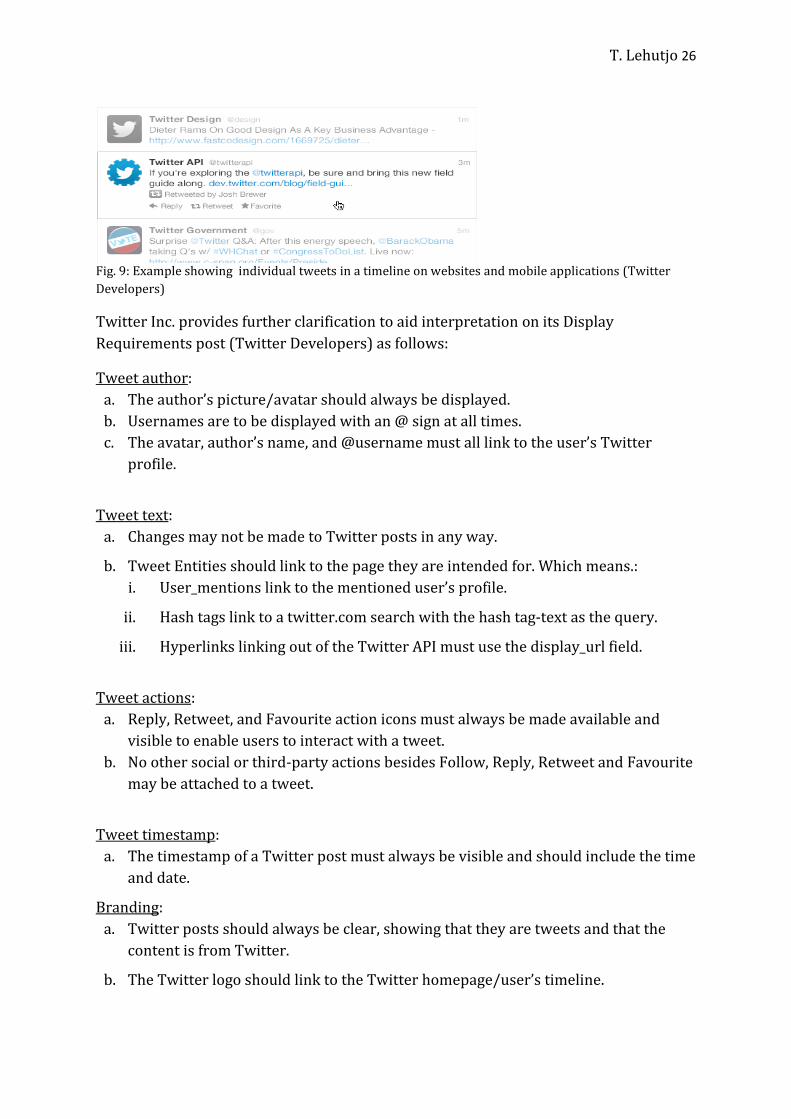
Fig. 8: Example showing a rendering of an individual tweet (Twitter Developers).
T. Lehutjo 26
Fig. 9: Example showing individual tweets in a timeline on websites and mobile applications (Twitter
Developers)
Twitter Inc. provides further clarification to aid interpretation on its Display
Requirements post (Twitter Developers) as follows:
Tweet author: a. The author’s picture/avatar should always be displayed.
b. Usernames are to be displayed with an @ sign at all times.
c. The avatar, author’s name, and @username must all link to the user’s Twitter
profile.
Tweet text:
a. Changes may not be made to Twitter posts in any way.
b. Tweet Entities should link to the page they are intended for. Which means.:
i. User_mentions link to the mentioned user’s profile.
ii. Hash tags link to a twitter.com search with the hash tag-text as the query.
iii. Hyperlinks linking out of the Twitter API must use the display_url field.
Tweet actions:
a. Reply, Retweet, and Favourite action icons must always be made available and
visible to enable users to interact with a tweet.
b. No other social or third-party actions besides Follow, Reply, Retweet and Favourite
may be attached to a tweet.
Tweet timestamp: a. The timestamp of a Twitter post must always be visible and should include the time
and date.
Branding: a. Twitter posts should always be clear, showing that they are tweets and that the
content is from Twitter.
b. The Twitter logo should link to the Twitter homepage/user’s timeline.

T. Lehutjo 27
2.4 How Twitter works: the interface
As analysed in Chapter 1, the usability criteria were set according to the ISO 9241-11
protocol’s usability definition to measure users’ satisfaction with, and the effectiveness,
and efficiency of a mobile application. In addition, the ISO 9241-11 definition mentions
the significance of specific users conducting specific tasks. As a result, this section
utilises menu items that are listed below, as indicators of the tasks that users are
expected to commonly engage in on mobile Twitter applications. The selection of the
tasks is based on the fact that Twitter Inc. offers these menu items as the core functions
on mobile Twitter applications, as seen in the official mobile Twitter applications for
Android powered cellular phones and Blackberry cellular phones.
Mobile Twitter applications have six key menu items that are present on all mobile
Twitter applications for Android and Blackberry. These menu items are presented in
varying degrees of similarity in terms of screen placement and levels of interaction on
mobile third-party Twitter applications, as is the case with TweetCaster for both
Android and Blackberry cellular phones (see figures 10 and 11 below).
Fig. 10: Official Twitter application for Android. Circled numbers used as reference in the paragraphs that
follow.
1. Home:
- The Home menu item is where the user can find all the Twitter posts (known on
Twitter as tweets) from the people they have chosen to have as connections.
- Whenever a user makes a tweet, the post is tagged with a timestamp that is then
used to arrange the tweets on the Home screen from new to old.
- Users are also able to expand a tweet in order to view more information about it
such as the number of replies, time posted, and whether it has embedded
pictures.
- When a tweet is expanded, users can re-post it, reply, favourite, and share it with
other social network sites such as Facebook.

T. Lehutjo 28
2. Connect:
- The Connect menu item lists all the actions that have been taken on a user’s
Twitter posts by other Twitter users.
- The actions can be anything from a reply by another user, the user’s tweet being
re-posted or being added to another user’s favourite Twitter posts list.
3. Discover:
- The Discover menu item lists the most popular topics on Twitter at any given
time.
- The topics are listed according to region, for example, in the event that the most
posted about topic on Twitter by South African users is “user experience”; that
phrase will be listed at the top of the trends list for the South Africa region.
- Additionally, this menu also lists a variety of news headlines that the Twitter
service considers popular and relevant to the user.
4. Me:
- The Me or Profile menu item is where users are able to add information about
themselves that other users can view.
- Under this menu item, users can add a profile photo, share their location, and put
up a link to their website or blog.
- The Profile menu also lists the user’s Twitter connections, including their lists,
favourite Twitter posts, and a complete list of Twitter posts the user has ever
made.
- Suggestions of users to make connections with are also listed at the bottom of
this menu item.
4.1 Lists:
The List function is found under the Me or Profile menu, and it is important because
some users have a large number of Twitter connections, and constantly have a lot of
Twitter posts appearing on their Home screen, which appear briefly and are soon
refreshed by new posts. As a result, these users are faced with the challenge of
managing the Twitter posts they see, which is the purpose of the List function.
- Using the List function, users create a list and add Twitter users whose posts
they want to see. For example, a user creates a Twitter list named “friend’s
tweets” and thereafter adds their Twitter friends to the list in order to have only
their friend’s Twitter posts appear on the Home screen when the list is selected
as default.
- In case users have created multiple lists, they are able to go to the List menu to
change between the Twitter posts they want to see based on the list selected.
4.2 Messages:
The user’s Message box is also found under the Me or Profile menu.

T. Lehutjo 29
- The Messages menu contains all the messages sent or received privately by a
user.
- Here the user is able to reply, compose, and delete messages.
- As with all Twitter posts, direct messages are limited to 140 characters.
5. Search:
- Using the Search function, users are able to search for topics or other Twitter
users.
- The search function returns the search term from either topics (including news
and Twitter posts containing the search string), nearby users’ Twitter posts
containing the search string, or Twitter users’ profiles whose names match the
search string.
6. Compose tweet:
- Using the Compose tweet function, the user is able to create and post a tweet that
will be displayed publicly to all the people who have subscribed to receiving the
user’s Twitter posts.
Fig. 11: TweetCaster for Android – circled numbers used as reference in the paragraphs that follow.
Figure 11 shows a variation of another Twitter application user interface, which is
TweetCaster. In the picture above, TweetCaster’s user interface allows the user to
perform the same functions as Twitter Inc.’s official Twitter application for Android,
albeit with more features than the official Twitter applications. These extra features
include functions such as “Zip It” which enables the user to block a Twitter user’s
Twitter posts from appearing on the user’s home timeline, “Jump to top” which enables
the user to go to the beginning of a tweet stream, and to send a direct message directly
from the home timeline without going to the messages menu.
In TweetCaster’s user interface:
- Number 1 represents the Home screen.

T. Lehutjo 30
- Number 2 is equivalent to the official Twitter application’s Connect menu item.
- Number 3 shows the user’s Message box.
- Number 4 lists all the posts that the user has chosen as their favourite Twitter
posts.
- Number 5 is the List menu that functions in the same way as the one found under
the Profile menu on the official Twitter application.
- Number 6 is the Search function, which is more or less in the same position as in
the official Twitter application for Android.
- Number 7 is the Compose tweet function that allows users to post Twitter
messages.
- Number 8 is a menu item for the user’s profile, where users can see the people
they have subscribed to and those that have subscribed to their Twitter posts.
The common tasks derived from the above menu items are listed in Chapter 3 of this
study. The following section will discuss some of the theory involved with testing for
usability.
2.5 The importance of usability
Kim and Coursaris believe that mobile technology usability studies are important
because they offer practitioners the necessary insight into creating usable mobile
products and services that will be adopted by users at ever increasing rates (1). Mobile
technology usability studies are also beneficial to scholars because they add to their
understanding of mobile technologies as researchers identify new questions that need
to be addressed (Kim and Coursaris 1).
According to Lynch and Gillmore, the launch of a product that is designed without
consideration for the “usability factor” poses a threat to the reputation of the company
that provides it. It may also be costly in that it provides a gap for competitors to gain the
advantage (1). Users find poorly designed systems difficult to understand and to
operate and so they fall into disuse by users who are frustrated with the system
(Maguire 1).
There are benefits to ensuring that mobile applications meet a certain level of usability,
and this requires usability evaluations, which are discussed later in section 2.7. Below
are a set of benefits that, according to Maguire, a usable system enjoys (1 - 2):
- Increased user productivity when conducting tasks.
- Reduced errors - Maguire (2) believes that a significant proportion of “human
error” is due in part to poorly designed user interfaces.
- Reduced user training and maintenance support on the system, therefore saving
money and time for the company that provides this.
- Improved user acceptance.

T. Lehutjo 31
- Enhanced company reputation in the market place, due to positive user
responses.
In this section, one can see the contrasting fortunes of both usable and unusable
systems. A sensible mobile application design strategy will need to consider usability if
the mobile application being designed is to succeed. Although it might be easier to build
mobile applications today than it was a few years ago, it is now harder to get users to
pay attention to any single mobile application because of the sheer volume of
alternatives (Rowinski).
2.6 Evaluating usability
The concept of usability was borne out of the desire to improve the usability of user
interfaces (Faulkner 3). In order to improve this factor, usability tests are employed by
researchers to measure the subjective user satisfaction, efficiency, and effectiveness of a
product to determine whether the user interface of the product meets pre-determined
usability criteria. By learning from the methods used by researchers, designers and
developers can now use usability testing methods to answer the question: which of the
tested mobile applications is superior in terms of usability?
According to Dumas and Salzman, usability tests are an empirical method used to
discover the strengths and weaknesses in the usability of a product, and also in rare
cases, measure and compare the usability of the product against that of other products
or an earlier version of itself (chap. 4). When these usability tests are used iteratively as
part of a user-centred design process, it can lead to improved mobile applications and a
better understanding of the application’s users (Fidgeon).
Han et al. point out that there are two variations of these tests: Firstly, a “subjective
assessment” which includes methods such as think-aloud protocol, questionnaires,
interviews, and focus groups; and secondly, based on an assessment of “objective
performance” with methods such as measuring the time-to-complete-tasks, number of
errors in accomplishing tasks, success rate, and the accuracy of completed tasks (478).
From the above explanation it seems logical and most desirable that the best way one
could improve the usability of a mobile application’s interface is through analysing and
acting upon “objective performance” data, but as usability practitioners have come to
realise, “subjective assessment” has a role to play because above average “objective
performance” scores do not necessarily mean that users are thoroughly satisfied with
the application (Han et al. 478).Taking this into account, this study combines methods
of subjective assessment (by using a System Usability Scale questionnaire) and objective
performance measures (measuring time spent on tasks by participants, and the
accuracy of task completion).
Apart from the different variations of usability tests (subjective and objective
performance measures), there are also different times during the development life cycle

T. Lehutjo 32
of an application when usability tests can be conducted. Recognising these two types of
evaluation methods is important; Dumas and Salzman describe them as follows (chap.
4):
- Formative tests: are performed regularly on prototypes throughout the
development life cycle to guide and inform the design process; this type of
evaluation method involves users giving opinions on prototypes designed by the
development team (Preece et al. 449).
- Summative tests: are conducted at or near the end of the development life cycle
to ensure that the application can be used as was designed/or intended. These
tests are also more likely to require quantitative data than formative tests
(Preece et al. 449).This study falls within this variation of usability tests,
specifically as a summative comparison usability test.
Benchmark and comparison testing:
Summative tests are conducted at the end of the application’s development. The focus
with benchmark and comparison tests is to measure usability with the aim to
benchmark or compare the usability measures of the application against those of other
competing applications or an earlier version of itself.
According to Dumas and Salzman there are two kinds of comparison tests (chap. 4):
- The first is very diagnostic in that its aim is to find as many usability problems
with an application as possible and to compare the findings with those of a
similar application.
- The second is summative and is intended to produce results about the usability
rating of an application or to find the most superior application among those
tested.
This study was conducted as a summative comparison usability test to measure and
compare the usability of two mobile Twitter applications against each other.

T. Lehutjo 33
Chapter 3: Methodology
3.1 Introduction
One key decision to take in usability evaluations is to decide whether to test in field or
laboratory settings. This chapter explains the usability testing methodologies used in
conducting this study. Informed by the reviewed literature on Twitter and usability
evaluation in chapter 2, this chapter will detail the procedures followed, criteria for
participant inclusion, tasks, and the research design of this study.
In order to address the research questions raised and presented in the Research
background section of chapter 1, this study sought to determine how TweetCaster and
the official Twitter applications for Blackberry and Android devices measure up against
the pre-determined usability attributes.
The motivation for this study was to find out whether there is a difference in the
usability of TweetCaster- a third-party Twitter application for Android and Blackberry
devices and official Twitter applications for Android and Blackberry.
Knowing whether a software product is usable requires testing; testing for usability
means evaluating whether people are able to find and use the functions a product
provides, in order to do their work (Dumas and Redish 4).
Usability evaluation methods (used in usability tests) measure how well users can use a
specific software application. When these methods are used effectively, researchers are
not only able to draw feedback from users about how easy (or difficult) a product is to
use; they are also in a position to evaluate users’ levels of task performance.
Key methodologies applied in the usability evaluation of mobile applications are field
and laboratory (lab) testing.
3.2 Lab evaluation
This study was conducted as a lab evaluation study. A key advantage of lab evaluation
studies over field studies is that the participants’ activities are controlled in order “to
test hypotheses and measure or observe certain behaviours” (Preece et al. 449).
According to Kallio et al., the testing of a mobile application in a laboratory setting is
sufficient for studying user interface and navigation issues (4). In their research, Kallio
et al. tested the usability of one mobile application in both field and laboratory settings.
The same usability problems identified in the field study were also found in the
laboratory tests (4).
Given that field evaluations are expensive and difficult to conduct in terms of being able
to control what participants do, when they do it, and how long it takes them (Rogers et

T. Lehutjo 34
al. 2), this study was conducted as a laboratory evaluation. This kind of evaluation is
good at uncovering usability problems with software applications (Preece et al. 436).
Furthermore, laboratory evaluations also offered the researcher flexibility in managing
time and economic constraints.
3.3 Procedures followed
Forty people participated in this study and were divided into groups of ten people for
each Twitter application; with each person participating only once.
Ten was chosen for this research because Faulkner’s study shows that with ten
participants, the lowest percentage of usability problems uncovered was 80% (379).
Additionally, it was with the intention to make it manageable for the researcher with
regards to time and sourcing the test participants.
Each participant was required to perform eleven mobile Twitter application tasks, such
as posting tweets, adding friends, and sending direct messages (the list of tasks is
shown in section 3.9), and then asked to fill in a Software Usability Scale questionnaire
(explained later in section 3.4) in order to capture the participant’s subjective views of
satisfaction with the Twitter application they had just tested.
Participants who own Blackberry devices were requested to test on the Android
operating system platform, while Android device users were asked to do the testing on
the Blackberry operating system platform. This was done in order that no group of
participants would have an advantage over another in terms of familiarity when using
the mobile applications. It was also important because the Software Usability Scale
questionnaire used in this study tests for learnability on item numbers 4 and 10,
therefore placing participants on a mobile Twitter application that runs on a different
operating system platform than the one they are accustomed to enables an accurate
measure of learnability in the tested application. Other participants, who own mobile
devices that are neither Blackberry nor Android platform devices, were required to test
either of the two operating system platforms used in this study.
While a Software Usability Scale questionnaire was used to capture the satisfaction
attribute data, the time spent on tasks by participants was used to measure efficiency.
Effectiveness was determined by the accuracy of the participants’ task completion.
Step-by-step procedure
- On arrival, participants were asked to sit on a couch and were briefed about the
purpose of the study, which is to determine the usability of TweetCaster (a third-
party Twitter application) against the official Twitter applications, running on
Blackberry and Android devices. After reading the informed consent form,
participants decided whether they would take part in the study (by confirming
participation with their signature on the informed consent form) or not.

T. Lehutjo 35
- Throughout the study, it was necessary to let participants know that timing the
tasks was in no way a reflection on how quickly they were able to use a mobile
application nor was it intended that they rush through the tasks (initially,
participants attempted to get through the task sheet as quickly as they could).
Participants were told that they should conduct the tasks comfortably and at
their own pace.
- After the initial briefing and instruction, the participants were required to read
out the individual task that they were doing, and to tell the researcher when they
had decided to start (so that the stopwatch timer could be started) and when
they had accomplished the task, so that the stopwatch timer could be stopped.
This procedure was followed through for each task on the task sheet.
- Immediately on completion of all the tasks, participants were required to fill in
the SUS questionnaire, which measures the usability of the Twitter application
from the participants’ point of view.
- Participants were then asked to fill in a two page form with demographic
information.
3.4 The Software Usability Scale questionnaire “It is the 25th anniversary of the creation of the most used questionnaire for measuring perceptions of
usability.” - Jeff Sauro of measuringusability.com writing on the SUS questionnaire
The Software Usability Scale (SUS) questionnaire was developed by John Brooke in
1986 as part of the usability engineering programme that was doing work on integrated
office systems at Digital Equipment Co. Ltd to capture user satisfaction data (Brooke
3).The questionnaire is a 10-item Likert-scale where participants indicate a degree of
agreement or disagreement with a question/statement based on a 5 point scale, with 3
as the neutral point.
As quick and simple as it is, with the author describing it as a “quick and dirty usability
scale”, research by Bangor, Kortum and Miller assessing the questionnaire confirms that
it is reliable with a Chronbach alpha of .91 (cited in Lewis and Sauro sec. 1.2). A
Chronbach alpha is a measure of internal consistency used to estimate a research
instrument’s reliability (Damon et al. 202).
The SUS questionnaire has been made freely available for use by anyone doing usability
assessments, on condition that any published work should acknowledge the source
(Brooke 7).
For this study, the questionnaire was slightly modified by replacing the word “system”
with “mobile application” throughout for the sake of clarity. For example, the first
question that states “I think I would like to use this system frequently” was changed to
“I think I would like to use this mobile application frequently”.

T. Lehutjo 36
According to Jarrett an advantage of reusing a questionnaire is that a knowledgeable
and skilled researcher has already done the question design.
For the purposes of this study, the SUS questionnaire fits in well as it provides the
necessary data (a quantifiable satisfaction score of participant responses that ranges
from 0 to 100) that allows inferences to be made about whether participants perceive a
mobile application to be usable or not.
Why the SUS questionnaire
The SUS questionnaire was selected for this study from among many other survey
instruments (such as the SUMI, QUIS, and CSUQ) because it is quick to administer (it
took an average of a minute and a half for participants to fill it out) and also for the ease
it provides in scoring the gathered data.
Bangor, Kortum, and Miller offer a list of characteristics that make the SUS
questionnaire attractive to use over other survey instruments (122):
1. The questionnaire is made up of 10 items.
2. It is also not restricted to any technology, researchers have used it to evaluate
websites, cellular phones, and television application interfaces among other user
interfaces.
3. The results obtained from the SUS questionnaire are a single score ranging from
0 to 100.
3.5 Criteria for participant inclusion
Participants sampled for this study were required to meet the following requirements:
- Be familiar with Twitter (determined by the existence of a user’s Twitter
account, active for 6 months and more).
- To have used a social media application on a mobile cellular phone (example of
social media mobile applications include MXit, Whatsapp, Twitter, Mig33, 2Go).
3.6 Research participants’ characteristics
The forty participants who took part in this study, consisted of 21 females (55%) and 19
males (45%), with an age range of 12 and a standard deviation of 2.42 around the mean
age of 21. The maximum age was 30 while the minimum age was 18. The low standard
deviation score suggests that the ages of the participants were similar. The cluster was
mostly around the ages of 19 to 21 where70% of the participants were situated.
Figure 12 below shows the age distribution of the participants. It is pertinent to note
that all of the participants in this study had utilised a cellular phone for three years or
more.

T. Lehutjo 37
Fig. 12: Research participants’ age distribution: the mean age of the participants who took part in this study
was 21 years old.
It was also found that most of the participants in this study were frequent users of other
social media applications (see Figure 13), with 42.5% of the 40 participants already
using three other social media applications - Facebook, Whatsapp, and Blackberry
Messenger - besides Twitter.com on their cellular phones.
The frequent use of other social media applications by participants led the researcher to
collect and analyse more data about how often the participants used Twitter
applications on their cellular phones. Figure 13 shows that many participants logged in
and used Twitter applications on their cellular phones on a daily basis. This can be
attributed to the mobile and personal nature of cellular phones as users rarely log out of
their Twitter applications. Only 3% of the participants in this study hardly used their
cellular phones to access Twitter.com and preferred to use desktop computers instead.
10
12
14
16
18
20
22
24
26
28
30
0 5 10 15 20 25 30 35 40
Age
Number of participants
Participants' age distribution

T. Lehutjo 38
Fig. 13: sampled participants’ twitter activity on cellular phones
Fig. 14: Number of social networks participants were using at the time of this study.
It was also found that half of the participants in this study had been using Twitter.com
for less than 12 months. This meant that 50% of the participants were fairly new to
Twitter, which evened out the participants’ overall familiarity with Twitter.
However, 77% of the 40 participants logged on to Twitter every day using their cellular
phones, meaning that even among the 50% who had used Twitter for less than 12
months, the participants were not entirely new to the Twitter social network site’s user
interface. The sampling process in this study was random, and the apparent balance
between the participants’ familiarity with Twitter was not initially designed into the
research.
Figure 15 below, shows how the levels of familiarity were distributed among the 40
participants.
77%
20%
3%
Participants' Twitter activity on mobile phone
Daily
Once in a while
Hardly
0
5
10
15
20
One Two Three Four Five
Nu
mb
er
of
par
tici
pan
ts
Number of social media applications
Number of social media applications participants were currently using

T. Lehutjo 39
Fig. 15: Shows the percentages in years of participants’ membership on Twitter.com
3.7 Data collection
Participants were selected at random on the University of the Witwatersrand,
Braamfontein campus and invited to participate in the usability tests, which took place
in the Convent Building, Room 2.
In the usability tests, data was gathered from a Software Usability Scale questionnaire
as well as from notes taken on how long it took participants to accomplish each
individual task, and whether the task had been accomplished accurately or not.
Furthermore, because mobile cell phones are usually held close to the body by the user
in order to have a clearer view of the screen; the researcher had to be seated next to the
participants so that notes of interesting cases where the participant did something
unusual or unexplained could be taken. These notes were taken for later review and
analysis.
It’s important to know that having to sit so close to the participants may bias the test
results, but the researcher tried to minimise this by setting up the evaluation
procedures such that the pre-evaluation briefing would ensure as little communication
between the participant and the researcher as possible. And that all other issues that
were not impeding the participant in accomplishing their tasks were discussed post-
evaluation.
3.8 Data analysis “This data shows that SUS is a reliable and valid measure of perceived usability. It performs as well or better
than commercial questionnaires and home-grown internal questionnaires.“ Jeff Sauro of
measuringusability.com writing about the SUS questionnaire
50%
27%
5%
13%
5%
How long participants' have been using Twitter.com
Less than 1 year
Between 1 - 2 years
Between 2 - 3 years
Between 3 - 4 years
More than 5 years

T. Lehutjo 40
The questions on the SUS questionnaire were designed so that a common response to
half of the items was a strong agreement, and to the other half a strong disagreement
(Brooke 3). This means that the SUS questionnaire items were reverse coded, so that
the questionnaire items alternate from a positive to a negative statement from item to
item. According to Brooke, this was done purposely in order to prevent response bias
that happens when respondents do not have to think about a statement (3).
Furthermore, Brooke offers some guidance on how to score data captured for a usability
test through the SUS questionnaire (5):
Scoring the SUS questionnaire data:
1. For odd-numbered items on the questionnaire, the score contribution equals: the
scale position minus 1.
2. For even-numbered items on the questionnaire, the score contribution equals: 5
minus the scale position.
3. The above calculations scale all the values in the questionnaire into a score from 0
to 4.
4. Thirdly, add up all the scores from each item.
5. Then multiply the sum by 2.5 to obtain the overall SUS value.
6. The multiplication step converts the range of values from 0 to 100 instead of 0 to
40.
7. Brooke asserts that individual SUS questionnaire items are not meaningful on
their own and should rather be considered as a whole (5).

T. Lehutjo 41
Fig. 16: Example showing how to calculate a SUS score and the final result
What is a good SUS score?
According to Bangor Kortum, and Miller, assigning a “letter-grade” to the percentile
rank of a SUS score is very effective for communicating the data to stakeholders,
designers and other people who are not familiar with the interpretation of the SUS
questionnaire (117). Bangor Kortum, and Miller suggest the following method of
interpreting the results:
- User interfaces that score 90 and more are regarded as exceptional.
- Scores ranging from 80 towards 90 are regarded as good.
- Scores ranging from 70 to 80 are acceptable.
- Scores below 70 are seen as a cause for concern with regards to usability issues.

T. Lehutjo 42
Further data analysis:
Other data gathered from the usability tests included the time spent on each task. This
data was put into a spreadsheet and mean and median values were calculated on how
long it took users to complete each task.
During the usability tests, the time was measured in seconds to an accuracy of two
decimal points. However, during data analysis, these times were rounded off to the
nearest tenth of a second.
3.9 Tasks conducted on the Twitter applications
Participants were asked to conduct the eleven tasks listed below, on either TweetCaster
or the official Twitter application for a given operating system platform. As mentioned
in section 2.4, the eleven listed tasks were chosen for this study because they represent
the core Twitter functions contained within each menu item of the Twitter service as
seen in chapter 2 on the official mobile Twitter applications for Android and Blackberry
Twitter applications (figure 10 and 11 respectively).
- Compose tweet and text “Hello world!”
- Search for and follow a friend (“Tshepo Lehutjo”).
- Reply to a friend’s tweet (“Now testing Twitter app x”).
- Retweet a friend’s tweet.
- Favourite a friend’s tweet.
- Go to @iamwill61 profile.
- Send a direct message to @iamwill61, text “Follow back”
- Reply to a direct message from @iamwill61, text “That’s cool”
- Create a Twitter list; name it “Friend’s tweets”.
- Add @iamwill61 to your “Friends’ tweets” Twitter list.
- Find trending topics.
3.10 Research design
As discussed in the literature review this study is a summative-comparison usability
test that combines subjective assessment methods with objective performance
measures to reach a conclusion about whether a mobile Twitter application meets the
pre-determined usability criterions of effectiveness, satisfaction, and efficiency.

T. Lehutjo 43
Fig. 17: Research design

T. Lehutjo 44
3.11 Participant distribution
Fig. 18: Participant distribution
3.12 Physical technology used
- Blackberry 9520 Smartphone 3G, Blackberry OS version 5.0 operating system.
- HTC Desire Smartphone, Android version 4.0.3 operating system.
- Both mobile cellular phones are touch-screen input based.
3.13 Mobile Twitter applications used
- TweetCaster version 1.6 on Blackberry OS 5.0.
- Twitter version 3.2 on Blackberry OS 5.0.
- TweetCaster version 6.9.5 on Android 4.0.3 operating system.
- Twitter version 3.6.0 on Android 4.0.3 operating system.
TweetCaster version 1.6 for Blackberry was the latest update of TweetCaster at the time
of this study, while Twitter 4.0 for Blackberry was only made available in January of
2013 (the researcher received a notification while logging in, to upgrade from Twitter
3.2 to 4.0 on his Blackberry device on the 5th of January 2013), at which point user
testing was already finished. Twitter 4.0 for Blackberry OS resembles Twitter 3.6.0 for

T. Lehutjo 45
Android with regard to its menu arrangement, as was discovered in the research
background section earlier. This is part of Twitter Inc.’s strategy to standardize the user
experience across all platforms on which Twitter.com is accessed.
3.14 Human research ethics (clearance attached)
An application for ethics clearance was considered and approved by the University of
the Witwatersrand’s Human Research Ethics Committee (HREC) on 18 September 2012.

T. Lehutjo 46
Chapter 4: Results
4.1 Introduction
In this chapter the results of the data gathered using the methods described in chapter 3
are presented, i.e. the SUS questionnaire and the notes on the time taken by participants
to complete the tasks successfully. Both methods provided quantitative data which was
processed using Microsoft Excel and IBM SPSS Statistics 21 software.
4.2 Presentation and discussion of data
In order to determine that a statistically significant difference exists in the mean
usability scores obtained from participants; an independent samples T-test was
performed to examine SUS and efficiency mean scores on official Twitter applications
against the third-party application TweetCaster. While differences in effectiveness
scores were tested for using Fisher’s exact test.
Comparison between the Blackberry Twitter applications:
SUS scores (measure of satisfaction)
Group Statistics
Application N Mean Std. Deviation Std. Error Mean
SUS score Official Twitter application for Blackberry 10 54.75 9.010 2.849
TweetCaster for Blackberry (3rd party) 10 56.25 16.925 5.352
Table 3: Group statistics for Blackberry SUS scores.
In the table above, it can be seen that when measuring the satisfaction attribute on mobile Twitter applications for Blackberry, the mean SUS scores obtained were not far apart from each other; with a mean difference of 1.5. Furthermore, in table 4 the Significance value of Levene’s Test for Equality of Variance = .26, which means that the variation in the obtained raw scores for each group of participants is not statistically different.
TweetCaster’s mean SUS score of 56.25, while higher than the official Twitter
application for Blackberry’s mean score of 54.75 is not enough evidence to conclude
that TweetCaster is more satisfying to users. This is because the significance value (the
Sig. 2-tailed value in table 4, also known as a probability or p-value) obtained from the
independent samples t-test = .807; which means that there is no statistically significant
difference between the two mean SUS scores.
These findings suggest that the difference is likely due to chance. And there is more
evidence in table 4 to support this conclusion, which shows that a 95% confidence
interval of the difference in the obtained mean SUS scores has 0 in its range (-14.239 to
11.239), which suggests that there is a chance that the difference might not even exist.

T. Lehutjo 47
Independent Samples Test
Levene's Test
for Equality of
Variances
t-test for Equality of Means
F Sig. t df Sig.
(2-
tailed)/
(p-
value)
Mean
Difference
Std.
Error
Differen
ce
95% Confidence
Interval of the
Difference
Lower Upper
SUS
score
Equal variances
assumed
5.888 .026 -.247 18 .807 -1.500 6.063 -14.239 11.239
Equal variances
not assumed
-.247 13.722 .808 -1.500 6.063 -14.529 11.529
Table 4: Independent samples T-test SUS score for Blackberry Twitter applications.
The findings presented above are significant to designers and developers of Twitter
applications in that it is very likely that users are choosing to download third-party
Twitter applications, TweetCaster in this case, not because it is more satisfying but as a
result of other factors such as its additional features, visual design, or other usability
attributes such as efficiency, and effectiveness.
Further research is required in this respect in order to draw conclusions about the
reasons users choose to download third-party Twitter applications even when their
Blackberry/Android cellular phones come pre-installed with official Twitter
applications.
Overall, the low mean sample SUS scores for both applications indicate that as per
Bangor, Kortum, and Miller’s guide to interpreting SUS scores, the two mobile Twitter
applications were not acceptable to participants in terms of satisfaction- this presents a
cause for concern with regards to usability issues which shall be reflected upon in the
next chapter of this research report.
Statistically, the SUS scores for the two Twitter applications are indistinguishable with
the given sample size. Therefore, in this study neither of the two Twitter applications
can be regarded as superior in terms of satisfaction.
Mean time spent on tasks (measure of efficiency):
The official Twitter application for Blackberry scored a mean task completion rate of
25.30 seconds in the usability tests. With a mean difference of 6 seconds, this proved to
be more efficient than TweetCaster for Blackberry which scored a mean task
completion rate of 31.30 seconds.
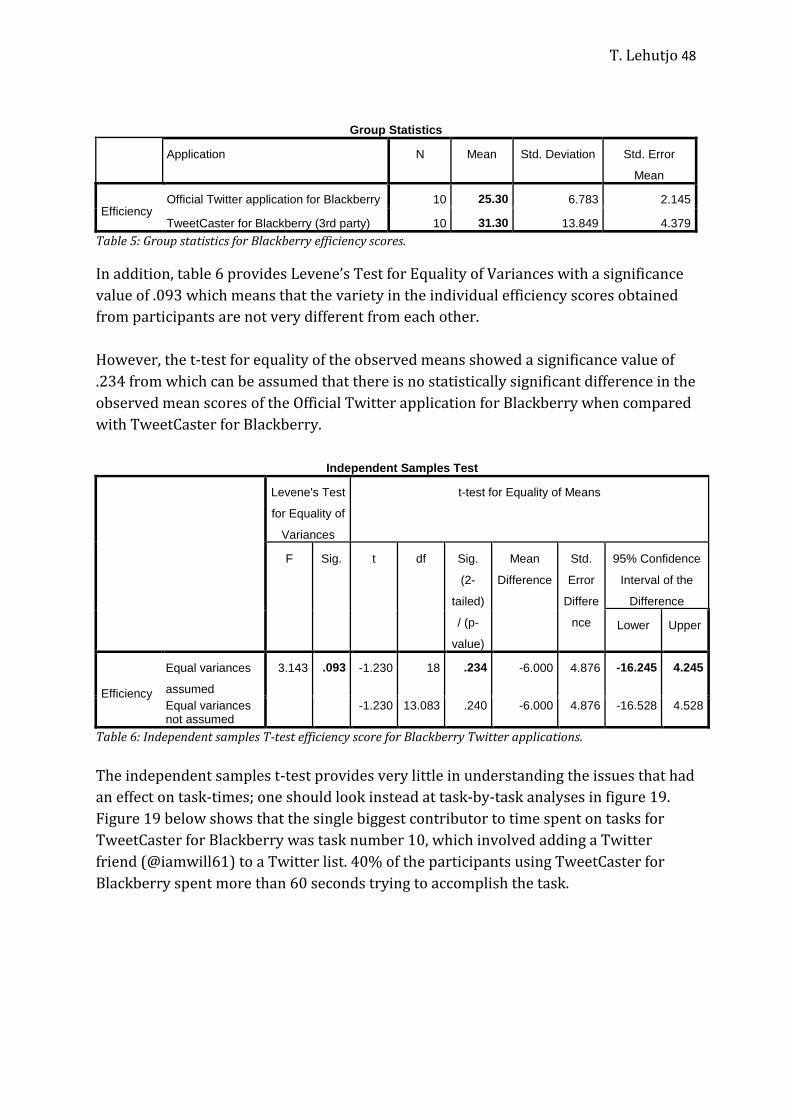
T. Lehutjo 48
Group Statistics
Application N Mean Std. Deviation Std. Error
Mean
Efficiency Official Twitter application for Blackberry 10 25.30 6.783 2.145
TweetCaster for Blackberry (3rd party) 10 31.30 13.849 4.379
Table 5: Group statistics for Blackberry efficiency scores.
In addition, table 6 provides Levene’s Test for Equality of Variances with a significance
value of .093 which means that the variety in the individual efficiency scores obtained
from participants are not very different from each other.
However, the t-test for equality of the observed means showed a significance value of
.234 from which can be assumed that there is no statistically significant difference in the
observed mean scores of the Official Twitter application for Blackberry when compared
with TweetCaster for Blackberry.
Independent Samples Test
Levene's Test
for Equality of
Variances
t-test for Equality of Means
F Sig. t df Sig.
(2-
tailed)
/ (p-
value)
Mean
Difference
Std.
Error
Differe
nce
95% Confidence
Interval of the
Difference
Lower Upper
Efficiency
Equal variances
assumed
3.143 .093 -1.230 18 .234 -6.000 4.876 -16.245 4.245
Equal variances not assumed
-1.230 13.083 .240 -6.000 4.876 -16.528 4.528
Table 6: Independent samples T-test efficiency score for Blackberry Twitter applications.
The independent samples t-test provides very little in understanding the issues that had
an effect on task-times; one should look instead at task-by-task analyses in figure 19.
Figure 19 below shows that the single biggest contributor to time spent on tasks for
TweetCaster for Blackberry was task number 10, which involved adding a Twitter
friend (@iamwill61) to a Twitter list. 40% of the participants using TweetCaster for
Blackberry spent more than 60 seconds trying to accomplish the task.

T. Lehutjo 49
Fig. 19: Task-by-task analysis of mean time spent on tasks: Blackberry.
The mean time spent on task number 10 for TweetCaster on Blackberry was 85 seconds
while the official Blackberry Twitter application scored a mean task completion time of
38 seconds for the same task. The large difference (47 seconds) between the two mean
times for task number 10 draws attention to the usability issues involved in carrying
out the task on TweetCaster for Blackberry, as notes taken during the usability
evaluations indicate that the long task times had a lot to do with the visibility of the
function, as users were not immediately able to find and use the function for adding a
Twitter friend to a Twitter list.
Overall, the data presented above for efficiency measures show that although the official
Twitter application for Blackberry at first appeared more efficient than TweetCaster for
Blackberry- and is indeed in some cases more efficient on some tasks. There was found
no statistical evidence to suggest that overall, the official Twitter application for
Blackberry is more efficient than TweetCaster for Blackberry. Therefore, in this study
neither of the two Twitter applications can be regarded as more efficient that the other.
Task completion rate (measure of effectiveness):
During the usability tests, the official Twitter application for Blackberry was found to be
more effective in aiding users to accomplish tasks. It scored an average task completion
rate of 96%, while TweetCaster for Blackberry scored a 95% mean task completion rate.
0
10
20
30
40
50
60
70
80
90
1 2 3 4 5 6 7 8 9 10 11
Tim
e in
se
con
ds
Task number
Task-by-task analysis of efficiency scores on Blackberry
Series2
Series1
TweetCaster for Blackberry
Official Twitter application for Blackberry

T. Lehutjo 50
However as seen in table 7 below, Fisher’s Exact Test with a significance value of 1.000
shows that the observed superior mean score for the official Twitter application for
Blackberry is not statistically different from TweetCaster for Blackberry.
Chi-Square Tests
Value df Asymp. Sig. (2-
sided) / (p-value)
Exact Sig. (2-
sided) / (p-value)
Exact Sig. (1-
sided) / (p-value)
Pearson Chi-Square .096a 1 .757
Continuity Correctionb .000 1 1.000
Likelihood Ratio .096 1 .757
Fisher's Exact Test 1.000 .500
Linear-by-Linear Association .095 1 .758
N of Valid Cases 220
a. 0 cells (.0%) have expected count less than 5. The minimum expected count is 5.50.
b. Computed only for a 2x2 table
Table 7: Fisher’s exact test for Blackberry effectiveness.
Although it has been established through Fisher’s Exact Test that a statistical difference
does not exist between the task completion rates of both Twitter applications, there is
no context of any usability issues that were discovered. Figure 20 below provides a
visual comparison of task completion rates out of 100%
One of the usability issues related to effectiveness that stood out during the usability
tests is task number 7, which involves sending a direct message to another Twitter user
(@iamwill61). The function to complete this task had some inconsistencies on
TweetCaster for Blackberry in that participants did not get the same menu options
every time. On four occasions during the usability tests, participants had to close the
TweetCaster application for Blackberry then reopen it to receive the correct menu
options.
An inconsistency such as this in the user interface not only had an impact on the rate of
task completion on TweetCaster for Blackberry but also caused participants to take
longer to conduct the task thus contributing to the poorer efficiency measure for the
application.
This inconsistency resulted in tasks 7 and 8, which involved sending a direct-message
and replying to a direct message from a Twitter friend (@iamwill61), not being
accomplished by 20% of the participants using TweetCaster for Blackberry.
Task number 11, where participants had to find trending topics, also presented some
problems for participants using TweetCaster for Blackberry. Participants performed
poorly because the menu item used for finding trending topics is not immediately

T. Lehutjo 51
visible but instead is placed within another set of sub-menu items, meaning that users
always need to remember where to find the function before they can use it.
The official Twitter application for Blackberry also had usability issues related to task
completion. Task number 10, which involved adding a Twitter friend to a Twitter list
posed as a challenge for participants to accomplish. The main problem participants
experienced with task 10 on the official Twitter application for Blackberry was that they
would open the Twitter list, expecting there to be a button that would enable them to
click and add Twitter friends to the list.
Only 40% of participants testing the official Twitter application for Blackberry
successfully took the time to navigate around the user interface looking for clues to aid
them in completing task 10, which is accomplished by navigating to the specific Twitter
friend’s profile and then clicking on the options menu that enables the Twitter friend to
be added to a Twitter list. One can already see how this will be problematic in cases
where users intend to add a large number of Twitter friends to a Twitter list.
In contrast, TweetCaster for Blackberry offers the user a simpler way to accomplish the
same task. When participants had finished creating the Twitter list (which was task 9),
the application provided a pop-up menu that enables the user to click and add the
Twitter friends they wish to add to the list (task 10). The Twitter friends are listed in
alphabetic order, and the user is able to click on any number of Twitter friends and
thereafter click on a button to indicate that they have finished.
However, 20% of participants unintentionally closed the pop-up notification and were
unable to accomplish the task of adding a Twitter friend to the list. Without the easy to
use pop-up menu, the procedure to add a Twitter friend to the list is unfortunately the
same on TweetCaster for Blackberry as it is for the official Twitter application for
Blackberry.

T. Lehutjo 52
Fig. 20: Sample task-by-task accomplishment rates: Blackberry.
Despite the apparently slight superiority of the official Twitter application for
Blackberry over TweetCaster for Blackberry, the researcher concludes by
acknowledging that overall there is no statistically distinguishable difference between
the two Twitter applications in terms of effectiveness.
The usability of mobile Twitter applications on Blackberry How are Blackberry cellular phone users experiencing the usability of official Twitter applications over
popular third-party Twitter applications such as TweetCaster?
The data obtained shows that there is no distinguishable difference between the official
Twitter application for Blackberry and TweetCaster for Blackberry in terms of the
tested usability criteria. This means that the two applications are indistinguishable
when compared on satisfaction, effectiveness and efficiency.
Therefore one can confidently conclude that the two Twitter applications tested in this
research are statistically indistinguishable, even though- as discussed in the above
sections, significant usability issues have been discovered.
The findings of this research are relevant for people who use mobile Twitter
applications on their phones, because the evidence is reassuring that, when people need
to make a download-decision based on usability, the usability trade-offs between
TweetCaster for Blackberry and the Official Twitter application for Blackberry is not
statistically significant and a download-decision should rather be based on other factors
such as additional features and aesthetics.
0 10 20 30 40 50 60 70 80 90 100
Compose tweet and text “Hello world!”Search for and follow a friend (“Tshepo …
Reply to a friend’s tweet (“Now testing Twitter …
Retweet a friend’s tweetFavourite a friend’s tweet
Go to Tshepo Lehutjo’s profileSend a direct message to @iamwill61, text …
Reply to a direct message from @iamwill61, …
Create a Twitter list; name it “Friend’s tweets”
Add @iamwill61 to your “Friends’s tweets” …
Find trending topics
Task-by-task analysis of sample task-completion rates (presented in %)
TweetCaster for Blackberry Official Twitter for Blackberry
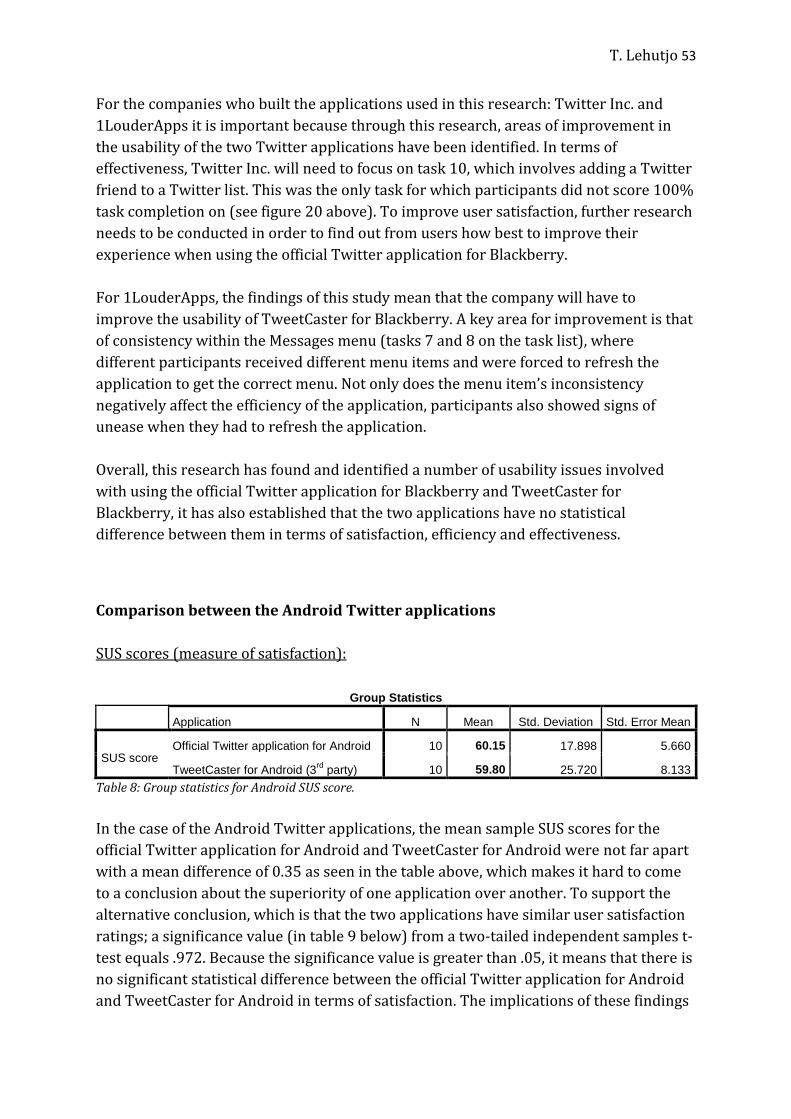
T. Lehutjo 53
For the companies who built the applications used in this research: Twitter Inc. and
1LouderApps it is important because through this research, areas of improvement in
the usability of the two Twitter applications have been identified. In terms of
effectiveness, Twitter Inc. will need to focus on task 10, which involves adding a Twitter
friend to a Twitter list. This was the only task for which participants did not score 100%
task completion on (see figure 20 above). To improve user satisfaction, further research
needs to be conducted in order to find out from users how best to improve their
experience when using the official Twitter application for Blackberry.
For 1LouderApps, the findings of this study mean that the company will have to
improve the usability of TweetCaster for Blackberry. A key area for improvement is that
of consistency within the Messages menu (tasks 7 and 8 on the task list), where
different participants received different menu items and were forced to refresh the
application to get the correct menu. Not only does the menu item’s inconsistency
negatively affect the efficiency of the application, participants also showed signs of
unease when they had to refresh the application.
Overall, this research has found and identified a number of usability issues involved
with using the official Twitter application for Blackberry and TweetCaster for
Blackberry, it has also established that the two applications have no statistical
difference between them in terms of satisfaction, efficiency and effectiveness.
Comparison between the Android Twitter applications
SUS scores (measure of satisfaction):
Group Statistics
Application N Mean Std. Deviation Std. Error Mean
SUS score Official Twitter application for Android 10 60.15 17.898 5.660
TweetCaster for Android (3rd
party) 10 59.80 25.720 8.133
Table 8: Group statistics for Android SUS score.
In the case of the Android Twitter applications, the mean sample SUS scores for the
official Twitter application for Android and TweetCaster for Android were not far apart
with a mean difference of 0.35 as seen in the table above, which makes it hard to come
to a conclusion about the superiority of one application over another. To support the
alternative conclusion, which is that the two applications have similar user satisfaction
ratings; a significance value (in table 9 below) from a two-tailed independent samples t-
test equals .972. Because the significance value is greater than .05, it means that there is
no significant statistical difference between the official Twitter application for Android
and TweetCaster for Android in terms of satisfaction. The implications of these findings

T. Lehutjo 54
are that users cannot, in terms of subjective satisfaction, meaningfully distinguish
between the two applications. Additionally, a t-test for the equality of means in table 9
provides 95% confidence interval of the difference that crosses 0, which supports the
conclusion that the difference in the mean SUS scores may not exist.
Independent Samples Test
Levene's Test
for Equality of
Variances
t-test for Equality of Means
F Sig. t df Sig.
(2-
tailed)
/ (p-
value)
Mean
Differen
ce
Std. Error
Difference
95% Confidence
Interval of the
Difference
Lower Upper
SUS
score
Equal variances
assumed
1.401 .252 .035 18 .972 .350 9.909 -20.468 21.168
Equal variances
not assumed
.035 16.061 .972 .350 9.909 -20.649 21.349
Table 9: Independent samples t-test SUS score for Android Twitter applications.
Furthermore, Levene’s Test for Equality of Variance in table 9 above equals .252 which
means that equal variance among the gathered individual sample SUS scores can be
assumed. Therefore one can take this as additional evidence that there is very little
difference if any between the mean SUS scores obtained from participants.
Fig. 21: Sample raw SUS score distribution for participants testing the official Twitter application for
Android.
0102030405060708090
100
0 1 2 3 4 5 6 7 8 9 10
SUS
sco
re
Participants
Sample SUS scores for participants testing Twitter for Android

T. Lehutjo 55
Fig. 22: Sample raw SUS score distribution for participants testing the TweetCaster for Android.
It follows that according to the data in table 21 above, with 70% of the SUS scores
obtained from participants for the official Twitter application for Android under 70. One
can assume that participants were not thoroughly satisfied with the official Twitter
application for Android. TweetCaster for Android however performed a little better in
this research with 50% of SUS scores over and below 70 (see figure 22).
Given the discussed data above, the researcher concludes by acknowledging that no
statistically distinguishable difference exists between the two Twitter applications in
terms of user’s satisfaction rating.
Average time spent on tasks (measure of efficiency):
When comparing the sample mean times spent on tasks in table 10 below, there was
found to be a 3.2 mean difference between the official Twitter application for Android
and TweetCaster for Android. The latter was found to be slightly superior in terms of
efficiency to complete tasks. Additionally, through Levene’s Test for Equality of Variance
which equals .119 as seen in table 11, one can assume that there is equal variance
between the individual efficiency scores obtained from participants.
Group Statistics
Application N Mean Std. Deviation Std. Error Mean
Efficiency Official Twitter application for Android 10 12.60 2.633 .833
TweetCaster for Android (3rd party) 10 15.80 15.032 4.753
Table 10: Group statistics for Android efficiency scores.
0102030405060708090
100
0 1 2 3 4 5 6 7 8 9 10
SUS
sco
re
Participants
Sample SUS scores for participants testing TweetCaster for Android

T. Lehutjo 56
Independent Samples Test
Levene's Test
for Equality of
Variances
t-test for Equality of Means
F Sig. t df Sig. (2-
tailed) /
(p-
value)
Mean
Differen
ce
Std.
Error
Differen
ce
95% Confidence
Interval of the
Difference
Lower Upper
Efficiency
Equal
variances
assumed
2.685 .119 -.663 18 .516 -3.200 4.826 -13.339 6.939
Equal
variances not
assumed
-.663 9.55
2
.523 -3.200 4.826 -14.021 7.621
Table 11: Independent samples T-test efficiency score for Android Twitter applications.
Despite the apparent superiority of TweetCaster for Android over the official Twitter
application for Android as observed above in table 10. A 2-tailed significance value
(shown in table 11) obtained from a t-test for the equality of the observed means equals
.516 which means that statistically, the observed mean scores for efficiency cannot be
differentiated.
Fig. 23: Task-by-task analysis of mean time spent on tasks: Android.
0
5
10
15
20
25
30
35
1 2 3 4 5 6 7 8 9 10 11
TIm
e in
se
con
ds
Task number
Task-by-task analysis of efficiency scores on Android
Series2
Series1
TweetCaster for Android
Official Twitter application for Android

T. Lehutjo 57
Figure 23 above shows the raw sample mean scores obtained for time spent on tasks for
the both Android OS Twitter applications used in this study. The unusually high task
times on task number 5, 7 and 9 spent on TweetCaster for Android can be attributed to
one of the participants (an iPhone user) who took longer than all the other participants
on all three tasks, partly due to the fact that he had “never used an Android device
before”, as he explained.
Overall, because a statistical difference between the two applications cannot be
established it means that whichever of the two mobile Twitter applications used in this
research that people use, there will be no noticeable difference in the speed at which
tasks are accomplished.
Task completion rate (measure of effectiveness):
When testing for effectiveness, it was found that the mean sample task completion rate
for TweetCaster for Android was 92%, while the official Twitter application for Android
had a superior sample task completion rate of 95%.
However even though the official Twitter application for Android had more
accomplished tasks than TweetCaster, a significance value obtained from Fisher’s Exact
Test in table 12 below equals .784, this means that there exists no distinguishable
difference in the task completion rates between the official Twitter application for
Android and TweetCaster for Android.
Chi-Square Tests
Value df Asymp. Sig. (2-
sided) / (p-value)
Exact Sig. (2-sided) /
(p-value)
Exact Sig. (1-
sided) / (p-value)
Pearson Chi-Square .305a 1 .581
Continuity Correctionb .076 1 .782
Likelihood Ratio .306 1 .580
Fisher's Exact Test .784 .392
Linear-by-Linear Association .304 1 .582
N of Valid Cases 220
a. 0 cells (.0%) have expected count less than 5. The minimum expected count is 7.00.
b. Computed only for a 2x2 table
Table 12: Fisher’s exact test for Android effectiveness.
The same usability issue experienced by participants testing the Blackberry Twitter
applications was experienced by participants using the Android OS platform:
participants experienced problems and frustrations in accomplishing task number ten

T. Lehutjo 58
on the official Twitter application for Android (see figure 24). This task involved adding
a Twitter friend (@iamwill61) to a Twitter list.
Fig. 24: Sample task-by-task accomplishment rates: Android.
Using the official Twitter application for Android, after creating a Twitter list, users
need to exit the list, search for and go to a Twitter friend’s (@iamwill61) profile, then
add them to a list. One can already see how the number of steps involved in performing
this function will have an effect on efficiency scores for this task: a mean of 22 seconds
spent to accomplish this task on the official Twitter application for Android to
TweetCaster’s mean of 8 seconds.
The confusion arose when participants testing official Twitter for Android had finished
creating the Twitter list, and were then instructed by the researcher to begin the next
task, which was to add a Twitter friend to the list. 80% of the participants testing official
Twitter for Android began by opening the Twitter list they had just created, expecting
there to be an instruction or a button that they could click on in order to select Twitter
friends to add. As a result of the lack of feedback, 60% of the participants did not
accomplish the task!
In comparison, participants using TweetCaster for Android found task number 10 easy
to accomplish as the application offers users a pop-up notification to add Twitter
friends to a Twitter list immediately after they had created the list.
0 10 20 30 40 50 60 70 80 90 100
Compose tweet and text “Hello world!”
Search for and follow a friend (“Tshepo Lehutjo”)
Reply to a friend’s tweet (“Now testing Twitter …
Retweet a friend’s tweet
Favourite a friend’s tweet
Go to Tshepo Lehutjo’s profile
Send a direct message to @iamwill61, text …
Reply to a direct message from @iamwill61, text …
Create a Twitter list; name it “Friend’s tweets”
Add @iamwill61 to your “Friends’s tweets” …
Find trending topics
Task-by-task analysis of sample task-completion rates (presented in %)
TweetCaster for Android Official Twitter for Android

T. Lehutjo 59
However, TweetCaster for Android was unable to achieve a higher task completion rate
on task number eleven, which involves finding the trends menu option. The trends
menu option is not visible and is placed within another menu. This lack of visibility
forces users to have to recall where to find the function every time they use the Twitter
application, which makes the function harder to find than on the official Twitter
application for Android, where the trends menu is found through one click of a main
menu item. Only 40% of the participants testing TweetCaster for Android successfully
navigated around the interface to find the trends menu function.
The usability issues highlighted in this section mean that mobile Twitter application
developers and designers need to ensure that users are able to fully conduct the range
of basic tasks offered on mobile Twitter applications by incorporating design principles
such as providing a lot more feedback on seldom used functions such as task number
ten.
The usability of mobile Twitter applications on Android How are Android cellular phone users experiencing the usability of official Twitter applications over popular
third-party Twitter applications such as TweetCaster?
Although significant usability issues were identified, no statistically distinguishable
differences were found in the mean scores of the measured usability criteria on the two
Twitter applications tested for Android. This means that no evidence was found that
sets apart the two applications on satisfaction, effectiveness or efficiency.
The findings of this study are significant to users when choosing a mobile Twitter
application for Android and when accomplishing basic tasks is an important criterion.
There is evidence in the observed participant data that the official Twitter application
for Android offers users a very high task completion rate across the entire set of basic
tasks, except for a rather poor performance when working with Twitter lists.
The differences between the official Twitter application for Android and TweetCaster
for Android are barely noticeable. Therefore it is possible that users may not be making
a decision to use either of the two Twitter applications based on usability but rather
other factors that a researcher may hypothesise on; this is an opportunity for further
research.

T. Lehutjo 60
Chapter 5: Research conclusions
5.1 The null hypothesis (H0 = true)
Overall, given the findings in chapter 4, the null hypothesis which states that there is no
significant statistical difference in the quantitative usability measures of third-party
mobile Twitter applications (TweetCaster) when compared with official mobile Twitter
applications on Android and Blackberry devices, is retained as the analysed data in
chapter 4 suggests that no statistically distinguishable difference exists between the
Twitter applications across all the criteria chosen in this study to measure usability.
In the previous chapter, the findings showed that there was hardly any statistically
noticeable difference in usability between the mobile Twitter applications tested in this
study. This means that the null hypothesis applies more to the findings than does the
alternative hypothesis which states that there exists a statistical difference in the
usability measures of third-party mobile Twitter applications (TweetCaster) when
compared with official mobile Twitter applications on Android and Blackberry devices.
Further analysis of the results presented in chapter 4 show that the mobile Twitter
applications tested on the Android platform had higher mean SUS scores, faster task
completion rates and were generally more supportive in aiding users accomplish their
tasks than Twitter applications tested on the Blackberry platform (see table 13 and 14):
Official Twitter applications
Twitter application
Official Twitter
application for Android
Official Twitter application
for Blackberry
Mean difference
Mean SUS score 60.15 54.75 5.4
Mean time spent on tasks 12.60 25.30 12.7 seconds
Task completion rate 96% 95% 1%
Table 13: showing a breakdown of the results for official Twitter applications.
Third party Twitter applications (TweetCaster)
Twitter application
TweetCaster for
Android
TweetCaster for
Blackberry (3rd party)
Mean difference
Mean SUS score 59.80 56.25 3.55
Mean time spent on tasks 15.80 31.30 15.5 seconds
Task completion rate 92% 95% 3%
Table 14: showing a breakdown of the results for third-party Twitter applications.

T. Lehutjo 61
For mobile Twitter application development, the decision to retain H0 means that more
work has to be done by Twitter Inc. and 1LouderApps to differentiate their mobile
Twitter applications in terms of usability, so that users may enjoy the experiences they
have while using either of the two sets of mobile Twitter applications. According to
Jordan et al., usability may be one of the few areas where technology companies have an
opportunity to set themselves apart and to gain a real commercial advantage over their
competitors (cited in Faulkner 2).
From another point of view, the findings mean that users are for now, having to deal
with inadequately satisfying interfaces for both sets of Twitter applications tested on
Android and Blackberry OS. This means that users will keep trying alternative
applications to the official mobile Twitter application until they find one that is
satisfying to use, provided they do not choose to settle after trying just a few of the
exhaustive range of mobile Twitter applications.
5.2 Proposals for future research
The potential exists for further research on a different mobile cellular phone to study
the usability of TweetCaster for iPhone and compare the usability measures with those
of the official Twitter application for iPhone. Additionally, the study could also report on
interface usability problems found in the research.
Examples of usability problems are poor menu item visibility, insufficient feedback,
consistency problems, lack of affordances, and the use of uninformed conceptual
models.
Another area of research that could be exploited is that of additional features that are
not offered on official Twitter applications but that are offered by third-party mobile
Twitter applications. The research could look into the frequency with which people use
these functions and whether the extra functionality informs their decision to download
a mobile Twitter application.
One could also research what other factors besides usability influence people’s
decisions to use one mobile Twitter application over another when there are no
noticeable differences in usability.
5.3 Concerning factors
According to the sample data, it was found that all four Twitter applications tested in
this research had low mean sample SUS scores (all scores are below 70), indicating that
there are considerable usability problems involved in using the Twitter applications. As
previously mentioned in chapter 3:

T. Lehutjo 62
- User interfaces that score 90 and more are regarded as exceptional.
- Scores ranging from 80 towards 90 are regarded as good.
- Scores ranging from 70 to 80 are acceptable.
- Scores below 70 are seen as a cause for concern with regard to usability issues.
Overall, as chapter 4 shows, there is plenty of room for improvement on all the mobile
Twitter applications tested in this research. The analysed data presented and discussed
in chapter 4 provides important information for mobile Twitter application
development, which will in turn benefit users of mobile Twitter applications for
Android and Blackberry operating systems.
5.4 Conclusion
To conclude, this research further indicates the importance of usability for users who
frequently use mobile applications. It provides insights into the usability of TweetCaster
and most importantly the official Twitter applications for Blackberry and Android.
The data obtained and presented in chapter 4 could be valuable to Twitter Inc., which
develops the official Twitter applications, and to 1LouderApps, which develops
TweetCaster, to gain further insights into the usability of their mobile Twitter
applications and to eventually improve their usability.
It also follows that this study is beneficial for users of mobile Twitter applications
because a usable mobile Twitter application will lead to less frustration for users, an
application that is easier to use and a satisfying overall user experience when using the
mobile Twitter applications.
The methods used in this research proved useful to understanding the usability of the
tested mobile Twitter applications. There is however a potential problem of
experimenter bias as the researcher was present with the test participants during the
usability tests, but as explained in chapter 3, section 3.7, actions were taken to reduce
any influence of experimenter bias on the test results.
Through the SUS questionnaire, the researcher was able to measure the level of
participant satisfaction for a given mobile Twitter application. Using the time spent to
accomplish tasks and noting the participants’ ability to successfully accomplish tasks,
one is able to come to an understanding of participants’ reasoning in rating their overall
experience when using a Twitter application; thereby completing a methodology whole.

T. Lehutjo 63
Chapter 6: Appendix
Appendix 1: Informed consent form
Informed consent form
Criteria for inclusion: 1. Participant should be familiar with Twitter (Which means that the user should.: have a Twitter
account)
2. Participant should have experience with a social media application on a Smartphone (for
example: MXit, Whatsapp, Twitter, Mig33, etc.)
Student statement I am Tshepo Lehutjo (Student number: 696276), MA student in Digital Arts: Interactive Media at the University of the Witwatersrand, supervised by Professor Christo Doherty and Mr. Edward White.
As part of the Masters course, we are required to conduct research on our field of interest and I am asking you to be a part of this study, to help me determine the usability of Twitter apps (TweetCaster and official Twitter applications) on smartphones.
Usability is a field of study and practice concerned with how people use products with ease, effectiveness, efficiency, and satisfaction. The goal of a usability researcher (myself in this case) is to find out from people’s points-of-view whether a software product meets those constructs or not.
The purpose of this consent form is to give you the information you will need to help you decide whether to participate or not. Feel free to ask any questions of me that you may have, either before or during the test.
Participating in the usability test should not exceed 15 minutes. In participating you will be asked to do a number of tasks on a Twitter app, and then to fill in a simple questionnaire regarding your opinions of the Twitter app you have just tested. The opinions gathered through the questionnaires will be statistically analysed to determine the usability of the Twitter apps.
To ensure your anonymity, no personally identifying information, such as name and ID
number, will be collected from you. Furthermore the responses you give on the
questionnaire will be treated as confidential, and will be viewed only by my supervisors
and me. This information will be considered only in relation to all the other
questionnaires and never in isolation.
Participation is voluntary, and you can discontinue participation at any time in which
case the information you provided will be destroyed.
If you would like to participate in this study, please read below thoroughly, ensuring that you have a clear understanding of this document before you sign it.
Participant Consent
My signature below indicates that I have read and understood the information provided

T. Lehutjo 64
above, that I willingly agree to participate, that I consent to the use of data gathered
during the course of this study, and that I may discontinue participation at any time.
Signature_____________________________ Date_____________________________
To set an appointment or for further queries, feel free to contact me on:
For emails: [email protected]
For calls: 0727677893

T. Lehutjo 65
Appendix 2: Participant demographic questionnaire
Participant demographic questionnaire
Please fill in this form to help me make better sense of the information you provided in
the SUS questionnaire you filled in.
Age: _____________________________________________________________
Year of study/or state your profession: _________________________________
Gender:
Female Male
Population group:
African Chinese Coloured Indian White
Other: Please specify
Home language:
Afrikaans English French Ndebele Portuguese
Pedi Sotho Tswana Swati Xhosa
Zulu Venda Tsonga Other: Please specify
How long have you had a Twitter account?
Less than 1 year 1 – 2 years 2 – 3 years 3 – 4 years 4+
Roughly, how often do you log on to Twitter using your phone?
Daily Once in a while Hardly Never
How long do you stay online on Twitter? (Per login session with your phone)
Less than 2 minutes 2 min. 2 – 3 min. 3 – 4 min.
4 – 5 min. More than 6 minutes
Roughly, how often do you log on to Twitter using the computer?
Daily Once in a while Hardly Never
How long do you stay online on Twitter? (Per login session with a computer)
Less than 2 minutes 2 min. 2 – 3 min. 3 – 4 min.
4 – 5 min. More than 6 minutes

T. Lehutjo 66
What other social network do you belong to?
Facebook Blackberry Messenger (BBM) Mig33
MXit Whatsapp LinkedIn
Other: Please specify
What other social network have you ever used?
Facebook. Blackberry Messenger (BBM): Mig33
MXit. Whatsapp LinkedIn
Other: Please specify
What kind of phone do you own/use? (Make & model of phone)
_________________________________________________________________________
How long have you had the phone you use currently?
Less than 1 year 1 – 2 years 2 – 3 years 3 – 4 years
More than 4 years
In general, how long have you been using phones?
Less than 1 year 1 – 2 years 2 – 3 years 3 – 4 years
More than 4 years
How long have you been using the Internet on mobile phones?
Less than 1 year 1 – 2 years 2 – 3 years 3 – 4 years
More than 4 years
What are your Internet costs per month? (Using a mobile phone)
Less than R12.00 R12 - 20.00 R20 - 35.00 R35 – 60.00
R60 - 100.00 More than R100.00
Have you used a Blackberry device before? (Please state how long) ____________________
Have you used an Android device before? (Please state how long)_______________________
Have you used TweetCaster before? (Please state on which phone)
_____________________________________________________________________________________________________
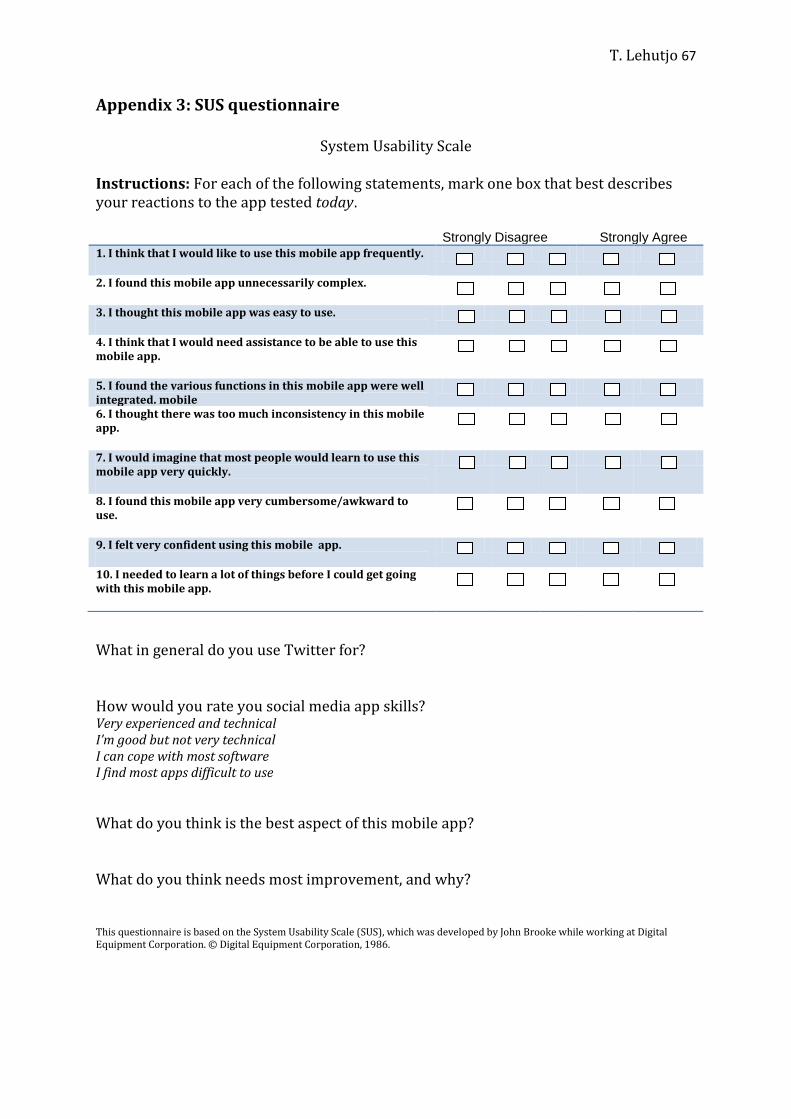
T. Lehutjo 67
Appendix 3: SUS questionnaire
System Usability Scale
Instructions: For each of the following statements, mark one box that best describes your reactions to the app tested today.
What in general do you use Twitter for? How would you rate you social media app skills? Very experienced and technical I’m good but not very technical I can cope with most software I find most apps difficult to use
What do you think is the best aspect of this mobile app? What do you think needs most improvement, and why? This questionnaire is based on the System Usability Scale (SUS), which was developed by John Brooke while working at Digital Equipment Corporation. © Digital Equipment Corporation, 1986.
Strongly Disagree Strongly Agree 1. I think that I would like to use this mobile app frequently.
2. I found this mobile app unnecessarily complex.
3. I thought this mobile app was easy to use.
4. I think that I would need assistance to be able to use this mobile app.
5. I found the various functions in this mobile app were well integrated. mobile
6. I thought there was too much inconsistency in this mobile app.
7. I would imagine that most people would learn to use this mobile app very quickly.
8. I found this mobile app very cumbersome/awkward to use.
9. I felt very confident using this mobile app.
10. I needed to learn a lot of things before I could get going with this mobile app.

T. Lehutjo 68
Appendix 4: Clearance to use Room 2 at Convent Building

T. Lehutjo 69
Appendix 5: Human research ethics clearance (Non medical)

T. Lehutjo 70
Appendix 6: Statistic usability measures
Overall Android OS usability measures
Tasks Task completion rate:
effectiveness (%)
Mean time spent on task:
efficiency (seconds)
Official
Twitter for
Android
TweetCaster
for Android
Official
Twitter for
Android
TweetCaster
for Android
1. Compose tweet and text
“Hello world!”
100 100 12 12
2. Search for and follow a
friend (“Tshepo Lehutjo”)
100 100 16 15
3. Reply to a friend’s tweet
(“Now testing Twitter app
x”)
100 100 24 17
4. Retweet a friend’s tweet 100 100 5 6
5. Favourite a friend’s
tweet
100 100 5 28
6. Go to @iamwill61
profile
100 100 4 9
7. Send a direct message to
@iamwill61, text “Follow
back”
100 90 16 33
8. Reply to a direct
message from
@iamwill61, text “That’s
cool”
100 90 8 13
9. Create a Twitter list;
name it “Friend’s tweets”
100 100 22 22
10. Add @iamwill61 to
your “Friends’ tweets”
Twitter list
40 100 22 8
11. Find trending topics 100 60 14 16

T. Lehutjo 71
Official Twitter for Android TweetCaster for Android
Mean SUS score:
satisfaction
60 60
Raw usability measures: official Twitter for Android
Efficiency presented in seconds to accomplish task. Zero means that the task was
unaccomplished. (P1 means participant 1 and so on).
Tasks P 1 P2 P3 P 4 P5 P 6 P 7 P8 P9 P10
1. Compose tweet and
text “Hello world!”
6 15 13 9 9 11 9 14 21 8
2. Search for and follow
a friend (“Tshepo
Lehutjo”)
14 19 14 18 14 21 15 14 21 12
3. Reply to a friend’s
tweet (“Now testing
Twitter app x”)
28 26 27 34 25 38 19 21 5 12
4. Retweet a friend’s
tweet
6 12 2 6 4 3 4 4 3 3
5. Favourite a friend’s
tweet
9 11 4 2 5 3 3 3 3 4
6. Go to @iamwill61
profile
3 5 2 2 2 6 2 6 4 7
7. Send a direct
message to
@iamwill61, text
“Follow back”
12 14 21 10 9 18 15 16 31 16
8. Reply to a direct
message from
@iamwill61, text
“That’s cool”
6 4 6 6 7 18 5 8 6 11
9. Create a Twitter list;
name it “Friend’s
23 19 13 39 14 50 12 15 16 17

T. Lehutjo 72
Raw usability measures: TweetCaster for Android
Efficiency presented in seconds to accomplish task. Zero means that the task was
unaccomplished. (P1 means participant 1 and so on).
Tasks P1 P2 P3 P4 P5 P6 P7 P8 P9 P1
0
1. Compose tweet and
text “Hello world!”
6 6 10 13 14 10 9 30 13 9
2. Search for and follow a
friend (“Tshepo Lehutjo”)
33 12 22 17 14 9 10 20 10 7
3. Reply to a friend’s
tweet (“Now testing
Twitter app x”)
27 9 23 19 22 16 17 3 12 18
4. Retweet a friend’s
tweet
13 5 4 5 5 3 5 11 7 6
5. Favourite a friend’s
tweet
5 2 6 6 3 2 3 24
0
5 4
6. Go to @iamwill61
profile
5 6 3 11 10 2 11 32 5 8
7. Send a direct message
to @iamwill61, text
“Follow back”
21 6 11 7 28 8 0 18
0
25 11
tweets”
10. Add @iamwill61 to
your “Friends’ tweets”
Twitter list
0 24 18 31 0 0 0 0 0 14
11. Find trending topics 17 13 21 17 25 6 6 10 11 11
Efficiency average 12 15 13 16 11 17 9 11 12 10
Effectiveness 90.
9
100.
0
100.
0
100.
0
90.
9
90.
9
90.
9
90.
9
90.
9
100.
0
SUS score:
satisfaction 48 70 58 95 33 75 65 65
42.
5 50

T. Lehutjo 73
8. Reply to a direct
message from
@iamwill61, text “That’s
cool”
15 7 22 9 16 6 0 15 12 14
9. Create a Twitter list;
name it “Friend’s tweets”
12 8 29 20 15 12 15 83 13 9
10. Add @iamwill61 to
your “Friends’ tweets”
Twitter list
0 12 8 5 3 0 6 16 8 7
11. Find trending topics 16 0 0 0 11 0 21 11 16 17
Efficiency average 15 7 14 11 13 8 11 63 11 10
Effectiveness 90.
9
90.
9 90.9
90.
9
10
0
81.
8
81.
8 100
10
0 100
SUS score: satisfaction 58 80 83 18 90 70 18 78 48 55
Overall Blackberry OS usability measures
Tasks Task completion rate:
effectiveness (%)
Mean time spent on task:
efficiency (seconds)
Official
Twitter for
Blackberry
TweetCaster
for
Blackberry
Official
Twitter for
Blackberry
TweetCaster
for
Blackberry
1. Compose tweet and text
“Hello world!”
100 100 39 30
2. Search for and follow a
friend (“Tshepo Lehutjo”)
100 100 42 31
3. Reply to a friend’s tweet
(“Now testing Twitter app
x”)
100 100 47 41
4. Retweet a friend’s tweet 100 100 10 8
5. Favourite a friend’s tweet 100 100 5 8

T. Lehutjo 74
6. Go to @iamwill61 profile 100 100 13 21
7. Send a direct message to
@iamwill61, text “Follow
back”
100 90 29 26
8. Reply to a direct message
from @iamwill61, text
“That’s cool”
100 90 20 23
9. Create a Twitter list;
name it “Friend’s tweets”
100 100 35 45
10. Add @iamwill61 to your
“Friends’ tweets” Twitter
list
40 80 38 85
11. Find trending topics 100 40 7 9
Official Twitter for
Blackberry
TweetCaster for
Blackberry
Mean SUS score:
satisfaction
55 56
Raw usability measures: official Twitter for Blackberry
Efficiency presented in seconds to accomplish task. Zero means that the task was
unaccomplished. (P1 means participant 1 and so on).
Tasks P1 P2 P3 P4 P5 P6 P7 P8 P9 P10
1. Compose tweet
and text “Hello
world!”
41 36 11 21 23 86 34 60 55 19
2. Search for and
follow a friend
(“Tshepo Lehutjo”)
36 67 25 35 28 53 54 43 22 56
3. Reply to a friend’s
tweet (“Now testing
Twitter app x”)
33 51 19 35 50 72 46 108 13 42
4. Retweet a friend’s 8 33 3 10 9 8 18 4 2 5

T. Lehutjo 75
tweet
5. Favourite a
friend’s tweet
3 18 5 7 3 5 3 2 2 4
6. Go to @iamwill61
profile
5 23 59 6 5 4 3 14 3 4
7. Send a direct
message to
@iamwill61, text
“Follow back”
45 64 19 21 13 17 15 59 12 24
8. Reply to a direct
message from
@iamwill61, text
“That’s cool”
45 32 16 13 10 14 15 30 10 17
9. Create a Twitter
list; name it
“Friend’s tweets”
65 33 34 30 31 20 30 55 20 31
10. Add @iamwill61
to your “Friends’
tweets” Twitter list
0 0 48 0 0 0 47 14 38 42
11. Find trending
topics
13 3 2 3 3 3 2 6 31 4
Efficiency average 29 36 22 18 18 28 24 36 19 23
Effectiveness 90.
9
90.
9
100.
0
90.
9
90.
9
90.
9
100.
0
100.
0
100.
0
100.
0
SUS score:
satisfaction 50
42.
5 60
67.
5
57.
5 45 50 52.5 52.5 70
Raw usability measures: TweetCaster for Blackberry
Efficiency presented in seconds to accomplish task. Zero means that the task was
unaccomplished. (P1 means participant 1 and so on).
Tasks P1 P2 P3 P4 P5 P6 P7 P8 P9 P1
0
1. Compose tweet and 33 16 22 41 19 34 17 27 75 11

T. Lehutjo 76
text “Hello world!”
2. Search for and follow
a friend (“Tshepo
Lehutjo”) 29 34 28 47 40 28 34 20 10 39
3. Reply to a friend’s
tweet (“Now testing
Twitter app x”) 4 5 98 53 56 60 76 7 14 41
4. Retweet a friend’s
tweet 5 4 6 34 2 6 11 2 8 3
5. Favourite a friend’s
tweet 4 3 4 3 3 3 8 4 6 38
6. Go to @iamwill61
profile 55 34 8 21 22 6 5 23 25 13
7. Send a direct
message to
@iamwill61, text
“Follow back” 29 75 10 19 20 14 24 0 43 29
8. Reply to a direct
message from
@iamwill61, text
“That’s cool” 24 9 24 54 20 20 4 0 70 0
9. Create a Twitter list;
name it “Friend’s
tweets” 58 60 42 44 93 34 54 23 41 4
10. Add @iamwill61 to
your “Friends’ tweets”
Twitter list 0 273 0 120 364 0 87 0 0 8
11. Find trending topics 4 7 6 3 7 3 19 6 32 3
Efficiency average 25 47 25 40 59 21 31 14 32 19
Effectiveness 90.
9
100.
0
90.
9
100.
0
100.
0
90.
9
100.
0
81.
8
90.
9
90.
9
SUS score: satisfaction
60 65 40 35 77.5 75 52.5 75
32.
5 50

T. Lehutjo 77
Glossary
Application: application software is a program or group of programs designed for end
users. (Cory)
API: An application programming interface (API) is a “set of commands, functions, and
protocols which programmers can use when building software for a specific operating
system” (TechTerms).
Mobile operating system: A mobile operating system is a piece of software that runs on
Smart phones, tablets, and other devices whose job is to enable them to run applications
(TechTarget).
Operating system: An operating system (OS) manages applications that run on it, and
also performs tasks such as recognising input, displaying output, and managing files and
directories (Webopedia).
Smartphone: A cellular phone that is able to run a variation of applications, and is
capable of e-mailing, Web browsing, still and video camera, music and video playback
(PC Mag Encyclopedia).
Tweet: A tweet is a Twitter message displayed on a user's profile page, which is publicly
visible by default, and shared with all his or her "followers." Tweets are limited to 140
characters, including spaces, and may include URLs and hash tags. (Cory)

T. Lehutjo 78
Works cited Bangor, A., Kortum, P., and Miller, J. "An Empirical Evaluation of the System Usability Scale." International journal of human-computer interaction Vol. 6.Issue 24 (2008): pp. 574-94. Print.
Beale. "Twitter Wins in Sxsw Web Award." Laughing Squid 2007. Web. 16 May 2012.
Bilton, N. "For Twitter-Owned Apps and Sites, a Cacophony of Confusion." New York Times Blog 2012. Web. 3 Dec 2012.
Booth, P. An Introduction to Human-Computer Interaction. Lawrence Erlbaum Associates, 1989. Print.
Brian, M. "Twitter Now Lets Ios 6 and Android 4.X Users Upload Images from Its Mobile Website." The New Web 2012. Web. 23 Oct 2012.
Brooke, J. Sus: A ‘Quick and Dirty’ Usability Scale. United Kingdom: Redhatch Consulting, 1996. Print.
Butler, M. "Smartphones- Android Changing the Mobile Landscape." Intel Labs 2011. Web. 9 Oct 2012.
Crovitz. "Egypt's Revolution by Social Media: Facebook and Twitter Let the People Keep Ahead of the Regime." Online Wall Street Journal 2011. Web. 3 Dec 2012.
Damon, P., Andrew S., Pedersen P., McEvoy, C. Research Methods in Sport Management. Illustrated ed: Human kinetics, 2011. Print.
Dumas, J., Redish, J. A Practical Guide to Usability Testing. Revised ed: Intellect, 1999. Print.
Dumas, J., Salzman, M. "Usability Assessment Methods." Sage publications, Reviews of human factors and ergonomic society. Issue 2 (2006): pp. 109-40. Print.
Emma, G. "Five Growing Uses for Twitter." Edelman Digital 2011. Web. 21 April 2012.
Encyclopedia, PC Magazine. "Mobile App Definition." PC Magazine Encyclopedia 2012. Web. 9 Oct 2012.
Evans, M. "Non-Official Twitter Clients Still Widely Used." Sysomos 2011. Web. 3 Dec 2012.
Faulkner, X. Usability Engineering. New York: Palgrave, 2000. Print.
Faulkner, L. “Beyond the five-user assumption: Benefits of increased sample sizes in usability testing.” Behavior research methods, Instruments and computers 35 (3). (2003): pp. 379-383. Print.

T. Lehutjo 79
Fidgeon, T. "Mobile Apps- Some Usability Guidelines." Spotless Interactive 2012. Web. 15 Oct 2012.
Han, S., Yun, M., Kim, K., Kwahk, J. "Evaluation of Product Usability: Development and Validation of Usability Dimensions and Design Elements Based on Empirical Models." Elsevier, International journal of industrial ergonomics. (2000): pp. 477-88. Print.
Interactive, Spotless. "Website Usability Testing." Spotless Interactive 2012. Web. 5 Dec 2012.
ISO-9241-11. "Ergonomic Requirements for Office Work with Visual Display Terminals (Vdts)." 1998. Web. 13 Nov 2011.
Jarrett, C. . "Sus: A Good Enough Usability Questionnaire." Rosenfield Media 2011. Web. 29 Oct 2012.
Juvok, M. "Mobile Applications- the History of the Issue." Article Dashboard 2012. Web. 9 October 2012.
Kallio, T., Kaikkonen, A., Kankainen, A., Kekalainen, A., Cankar, M. "Usability Testing of Mobile Applications: A Comparison between Laboratory and Field Testing." Journal of usability Vol. 1.Issue 1 (2005): pp. 4-6. Print.
Kim, D., Coursaris, C. "A Qualitative Review of Empirical Mobile Usability Studies." Proceedings of the twelfth Americas conference on information systems. (2006).
Krumm, J., Abowd, G., Seneviratne, A., Strang, T. "Proceedings of Ubiquitous Computing: 9th International Conference." LNCS 4717 (2007): 336-53. Print.
Lewis, J. Sauro, J. "The Factor Structure of the System Usability Scale." Vol. 5619 (2009): pp. 94-103. Print.
Lynch, K., Gillmore, S. "Usability: The Key to Product Success." Pragmatic Marketing n.d. Web. 2 Feb 2013.
Maguire, M. "Methods to Support Human-Centered Design." International journal of Human-Computer studies.55 (2001): pp. 587-634. Print.
Market, Stock. "Dick Costolo: Twitter Has 100 Million Active Users." Stock Market 2011. Web. 23 Apr 2012.
Myers, C. "The New Twitter Is All About Simplicity, Discovery and Usability." The New Web 2011. Web. 13 Sep 2012.
News24. "Da to Lay Charges after Protest Violence." 2012. Web. 16 May 2012.
Norman, D. The Design of Everyday Things. 2nd print ed: MIT Press, 1998. Print.

T. Lehutjo 80
Panzarino, M. "Twitter Developers Send Inquiries to the Federal Trade Comission over Possible Anti-Trust Issues." The New Web 2012. Web. 6 Oct 2012.
Parr, B. "Twitter Vs. Instagram: It’s All About Monetization." CNet News 2012. Web. 5 Dec 2012.
Picard. "The History of Twitter, 140 Characters at a Time." 2011. Web. 23 Dec 2012.
Preece, J., Sharp, H., Rogers, Y. Interaction Design: Beyond Human-Computer Interaction. 3rd ed: Wiley, 2011. Print.
Price, E. "The History of Mobile App Stores." Techno Buffalo 2012. Web. 9 Oct 2012.
Rowinski, D. "The Mobile Industry Matured in 2012- and Grew Like Crazy." ReadWrite mobile 2012. Web. 2 Feb 2013.
Rushe, D. "Twitter Valued at $10bn as Google and Facebook Reportedly Vie to Buy It." The Guardian 2011. Web. 3 Jan 2013.
Sauro, J. "System Usability Scale (SUS)." measuringusability.com 2011. Web. 4 Oct 2012.
---, "10 things to know about the System Usability Scale (SUS)." measuringusability.com 2013. Web. 18 July 2013.
Seffah, A., Metzker, E. Adoption-Centric Usability Engineering. London: Springer, 2009. Print.
Shackel, B., Richardson, S. Human Factors for Informatics Usability. New York: Cambridge University Press, 1991. Print.
Software, Opera. “Characteristics of widgets on mobile phones.” dev.opera.com 2010. Web. 15 Aug 2013.
StockMarket. "Dick Costolo: Twitter Has 100 Million Active Users." Stock Market 2011. Web. 23 April 2012.
Technology, BBC News. "Twitter Changes Provoke Anger from Developers." bbc.com 2012. Web. 2 Oct 2012.
Truong, S. "Jack Dorsey on the History of Twitter and Square." The unofficial Stanford blog 2011. Web. 26 Dec 2012.
Twitter.com. "About." 2012. Web. 12 Nov 2012.
Twitter-Developers. "Developer Display Requirements." Twitter Developers 2012. Web. 26 Oct 2012.
---. "Developer Rules of the Road." Twitter Developers 2012. Web. 26 Oct 2012.

T. Lehutjo 81
Wauters, R. "Flipboard Ceo Mike Mccue Expresses Concern over Twitter’s Myopia, Shortly after Quitting Its Board." The New Web 2012. Web. 2 Oct 2012.
Yglesias, M. “The Twitter tradgedy.” Slate. 2012. Web. 5 December 2012.