the u.s. railroads and covid-19: keeping supply chains moving
TRANSCRIPT

The U.S. Railroads and COVID-19: Keeping Supply Chains Moving
Northwestern University Transportation Center
Evanston, Illinois
May 2021

The U.S. Railroads and COVID-19: Keeping Supply Chains Moving
Joseph L. Schofer, Hani S. Mahmassani, Max T.M. Ng, and Breton L. Johnson
Northwestern University Transportation Center
Evanston, Illinois
May 2021
© Northwestern University

i
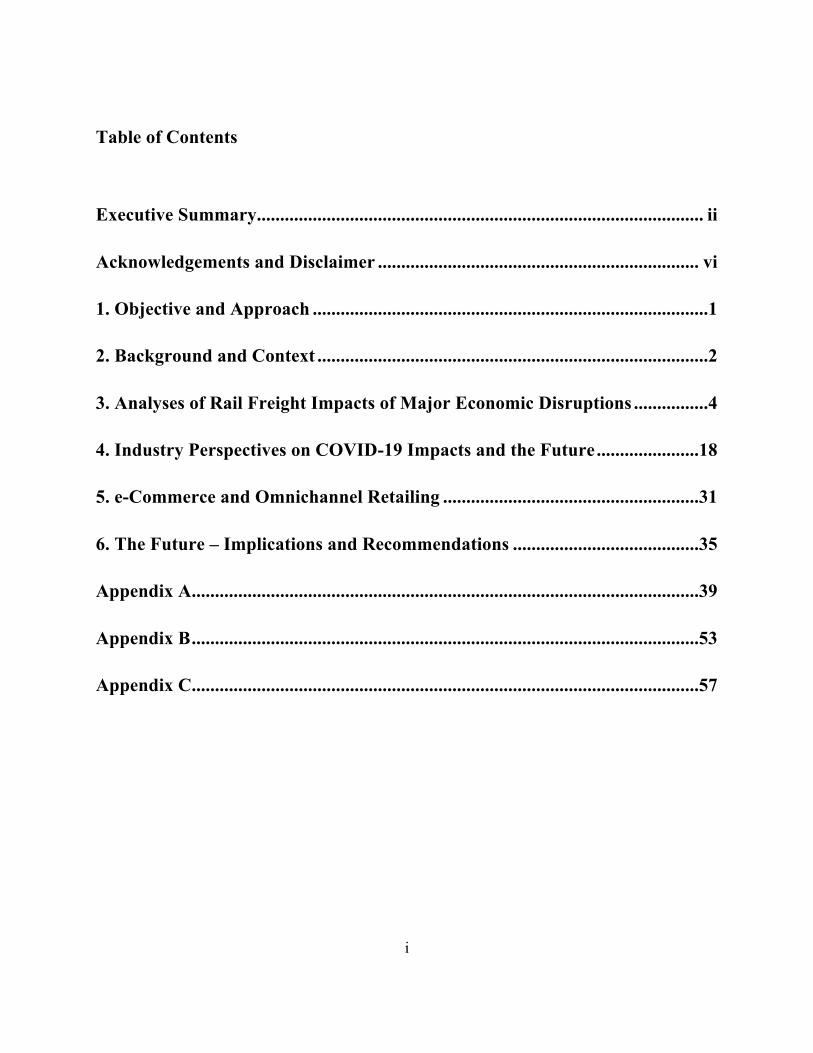
Table of Contents
Executive Summary ................................................................................................ ii
Acknowledgements and Disclaimer ..................................................................... vi
1. Objective and Approach .....................................................................................1
2. Background and Context ....................................................................................2
3. Analyses of Rail Freight Impacts of Major Economic Disruptions ................4
4. Industry Perspectives on COVID-19 Impacts and the Future ......................18
5. e-Commerce and Omnichannel Retailing .......................................................31
6. The Future – Implications and Recommendations ........................................35
Appendix A .............................................................................................................39
Appendix B .............................................................................................................53
Appendix C .............................................................................................................57

ii
Executive Summary
Background and Initial COVID-19 Impacts
The rapid onset of the COVID-19 pandemic in March 2020 marked a challenging time for the country and the U.S. freight industry. Manufacturing slowed, consumer purchasing patterns changed, and for many, shopping moved online. The freight industry suffered a sharp decline in shipments, followed by a surprisingly quick rise. The movement of goods by freight rail had to quickly adapt to meet dynamically changing demand and volatile supply patterns. Despite this disruption, freight rail showed a great deal of resilience and reliability. This report addresses how the rail industry met the challenge of this whiplash in demand, explores impediments to performance during this period and looks beyond the crisis towards the future for the rail sector. The assessment outlined in this report was completed by researchers at Northwestern University’s Transportation Center (NUTC). The results show how the U.S. freight rail industry was an essential component of pandemic resilience, demonstrating a high level of adaptability to meet consumer and business demands.
NUTC Study Approach
NUTC researchers conducted an analysis of shipment data, supplemented with qualitative insights from leading railroads, intermodal (IM) carriers, equipment manufacturers, car leasing companies, shippers and e-commerce players to inform this report. What emerges from this analysis is a rich picture of the impacts of COVID-19 on the freight industry, the performance of the logistics system in general and railroads in particular, along with views of causes, effects, and the future. The results illustrate the inherent value of the freight rail industry to logistics and transportation in the U.S. In-depth interviews with industry leaders and experts revealed that a handful of choke points, many of which did not belong to the freight rail industry, complicated supply chain responses to COVID-19. These choke points included congestion at West Coast ports and terminals nationwide, driven by both physical capacity and labor shortages, alongside inefficiencies in the chassis market. While these contributed to an already challenging logistical environment, ultimately, freight rail kept goods moving when other methods of transport were constrained.
Overall, commodities traditionally carried by freight rail suffered varying fates in 2020. Some products were negatively affected, including energy-related commodities (i.e., coal, petroleum and petroleum products, frac sand), while demand for others grew or rebounded during the pandemic, including grain products and intermodal, respectively.
Freight Rail’s Response
Rail freight experienced a rapid rebound following the precipitous drop in traffic in March and April 2020, achieving a near-full recovery in five months as the rail industry adapted to keep goods moving despite the challenges created by logistical choke points. As the recovery proceeded through the rest of 2020, the flow of intermodal (IM) traffic, containers moving by rail for the longest legs of their overland trips, rebounded strongly, some exceeding volumes in the same week of 2019 (and 2018 - a record year). This explosion in IM rail shipments was driven by shifts in consumer spending from experiences (theaters, restaurants) to in-home

iii
products, the accelerated growth in e-commerce through large retailers, and tightening capacity in trucking, which is more dependent on labor availability than rail.
The principal IM flows are from ports and manufacturing centers to inland distribution centers (DCs), but some moves go through intermediate and transload terminals, where goods are shifted from marine to domestic containers. IM logistics are complicated because of the multiplicity of entities that must collaborate to facilitate the flows: maritime carriers, ports and port operators, suppliers of chassis (trailers that carry containers by truck), truckers, warehouse operators, retailers, and the railroads. Bottlenecks anywhere in this complex system affect overall performance.
Those interviewed for this study—including rail industry leaders, intermodal carriers, and major shippers—expressed surprise at the rapidity of the rebound in demand, a marked difference from the years-long recovery coming out of the Great Recession. Throughout 2020, rail's advantage was rooted in the capacity and cost efficiency that it brings to e-commerce. Data shows that freight railroads responded well to rapid demand shifts, particularly in intermodal traffic. The sharp intermodal increase was driven in part by the rise of e-commerce, a tight trucking market, and shifts in consumer spending.
The Rise of Intermodal Traffic and E-Commerce
Rail has become a core partner in intermodal traffic, broadly supporting purchasing patterns as many shifted from consumption of experiences to consumption of goods following the onset of the pandemic. Intermodal traffic emerged as a major growth driver during the pandemic, exceeding 2019 and 2018 volume levels in Q3 and Q4 of 2020. The rapid rise has been driven in large measure by growth in e-commerce—particularly from large retailers—as consumers shop online.

iv
Findings to date suggest that a majority of customers who pivoted to e-commerce in 2020 will likely continue using it in the years to come, driven both by convenience and price. The rise of e-commerce will hold the freight rail industry’s performance to a high standard moving forward. The market commands both high prices and high performance, and large retail customers have the market power to obtain high service levels from the railroads. Some industry players view rail performance – speed and reliability – as more important for attracting and retaining customers than price competition. Moving forward, developments like shipment visibility, now expected by increasingly demanding customers, can increase rail's competitiveness and responsiveness to intermodal demands.
Implications for Post-Pandemic Development
The shock brought on by the pandemic showcased the need for the reliable movement of freight, an undertaking handled well by the rail industry. As outlined in this report, the choke points that stifled the supply chain industry in 2020—congestion at West Coast ports, chassis shortages, and truck freight load rejection, among others—caused service disruptions that were detrimental to consumers and could impede future demand growth. Nonetheless, the reliability of the freight rail network played an essential role in ensuring critical needs for all sorts of goods were met. In the years to come, additional operational changes and technology like Positive Train Control (PTC) can further streamline the freight rail network and build transparency with customers. Industry observers see opportunities for railroad performance improvements through continued operational innovations, the realization of full benefits from Precision Scheduled Railroading (PSR) and Positive Train Control (PTC), and the use of Internet of Things (IOT) technologies to track shipments and support management.
With the growth of e-commerce, online retail, and rapid delivery models, a reliable freight rail industry remains important for shippers. When the truck freight industry was unable to meet heightened demand in 2020, the freight rail industry provided companies, including large retailers, with the option and flexibility needed to continue moving their goods. When interviewed for this report, industry experts reinforced that on-time delivery reliability and performance ultimately dominate price when considering shipping options. Post-pandemic, freight rail can lead the logistics industry and its customers forward in what is certain to be a volatile future. The bulk markets are a secure core rail business, and the promise of continued growth in IM traffic seems strong.
Public Policy and The Path Ahead
The results of this study point to a strong future for the U.S. rail industry, which responded with resilience to the large disruptions and quick shifts in demand due to COVID-19, showing a level of adaptability that will be important in what is likely to be an increasingly volatile future. Ultimately, public policy will play a key role in the future of the logistics industry and the ability of freight rail to continue its reliable performance that is at the core of the nation’s supply chains. The public sector can facilitate the development of inland terminal capacity to better support regional commerce and economic development. There are opportunities for collaborations in port and terminal development to increase capacity – bringing together railroads, developers, local, and state governments. Governments at all levels need to understand the environmental, efficiency, and resilience advantages of rail freight and make

v
informed decisions about transportation investments and regulatory policies. New consumer demands, including the rise of e-commerce, are likely to persist. Regulatory and investment policies should keep these long-term shifts in mind and remain neutral in the competition among freight modes, focusing on safety, performance, and fairness, rather than specifying how service should be delivered.
vi
Acknowledgements and Disclaimer
The Transportation Center research team gratefully acknowledges the important contributions to this effort through the provision of data and timely guidance from the Association of American Railroads; from Rachel Cole, Librarian with the Transportation Collection of the Northwestern University Library; from the twenty industry leaders who gave their time to be interviewed for this project, listed in Appendix C; and from the staff of Northwestern’s Transportation Center.
The content of this report is the sole responsibility of the authors and does not necessarily reflect the positions or policies of the Association of American Railroads or any of the organizations represented by those interviewed for this work.

1
1. Objective and Approach
This report addresses the impacts of the COVID-19 pandemic on U.S. rail freight service and the prospects for rail as the pandemic recedes, considering likely changes in domestic and global supply chain patterns and emerging developments in e-commerce and the supply chains that support it. It provides data-supported insights into the critical role rail freight plays in the nation’s essential supply chains in the face of the pandemic-induced disruption and post-pandemic economic rebound, looking ahead to the next 2 to 5 years. A key aspect of this role is the contribution of rail to the success of e-commerce, supporting on-demand delivery in the context of competition from other modes, especially trucking and air freight. The findings of this study can help position the rail industry to support emerging trends in sourcing, manufacturing, and consumer purchasing. The main questions addressed in this report are these: • How did the rail industry fare during previous economic downturns and corresponding
recoveries? • How did the COVID-19 pandemic impact the rail industry, particularly in terms of trade and
shipping patterns, as well as changing markets for energy commodities? • How have key industry leaders viewed the impacts of COVID-19, the rebound, the functioning
of the logistics system, and particularly the role and performance of rail freight? • What are the main opportunities that appeal to the unique strengths of rail service in the
post-pandemic period? • How can public policy impact the rail freight sector and its competitive position, both
positively and negatively, in the post-pandemic period?
Our approach to this effort comprised four components: (1) monitoring contemporary trade and academic literature on the pandemic, freight and logistics, international trade, and consumptions patterns; (2) graphical and statistical analysis of flows, performance, and pricing of rail and truck shipments for both the 2008 Great Recession and COVID-19; (3) short-term time series forecasting of rail shipments and economic parameters; and (4) in-depth interviews with leaders in the railroad, trucking, and consumer sales sectors.
All of these information sources were brought together to prepare this report, which is organized as follows: Section 2 presents the background and context in commerce and freight transportation as the COVID-19 pandemic began to take effect. Section 3 presents and compares rail, truck, and trade data for both the 2008 recession and COVID-19, considering differences in the patterns of post-event recovery. It further extends the data analysis using time series models to explore near-term scenarios for rail freight and the U.S. economy. Section 4 summarizes the perspectives of key industry leaders on the pandemic experience, the rebound, and the future, with emphasis on the performance of and opportunities for the rail industry. Section 5 briefly reviews trends in e-commerce and discusses the role of the intermodal rail freight in this growing sector. Section 6 addresses near term future expectations and opportunities for the rail industry, public policy issues of importance to the future of rail freight, and brings the report to closure.

2
2. Background and Context
Railroads have been an essential part of the United States economy for 170 years, helping to grow the nation by supporting settlement and economic growth from coast to coast. The rail industry has always been in a state of change, ranging from adopting new power sources to changing product mixes to innovations in operating strategies to integration with other transportation modes. The industry has responded to and facilitated market trends, with focus shifting from passengers to freight, from products to bulk commodities, from mostly domestic flows to a central role in international trade, and from break bulk shipments to containerization and intermodal traffic.
U.S. railroads have supported the dispersion of manufacturing as components have been sourced more broadly from North America and beyond. They have played a key role in the expansion of U.S. agricultural exports. Recently, railroads have facilitated the shift in the U.S. energy economy as domestic oil production expanded rapidly, in both volume and spatial extent, through new extraction techniques. They have become a core partner in intermodal traffic, broadly supporting retail marketing patterns. And, in the face of necessity, railroads have adapted to short- and long-term downturns in some of these markets, for example, the domestic coal industry, imposed by a variety of external factors.
Nimbleness of the rail industry in the face of market volatility has advanced in part because of the regulatory relaxation that came with the Staggers Act of 1980, which freed the industry of rate regulations and other anticompetitive measures, giving the railroads the flexibility to adapt services and to price at levels that allowed them to earn their cost of capital.
The industry has continued to innovate, fulfilling the mandate for Positive Train Control (PTC) to assure system safety and support improvements in operating efficiencies. The Class I railroads have moved to a variety of forms of Precision Scheduled Railroading (PSR), blocking trains to facilitate origin to destination moves with fewer stops, and reducing needs to re-sort trains in intermediate yards. Across the Class I railroads this increased average train speeds and reduced dwell times in yards,1 boosting reliability and efficiency, releasing some resources in the process, and lowering operating ratios in response to investor priorities.
COVID-19 brought about rapid and complex changes in the demand for freight transportation – decreases, increases, and shifts in products to be moved. Railroads, like all of the transportation industry, are at the mercy of such large-scale economic patterns, as illustrated by past events, most recently the Great Recession of 2007-2009. Positioned in the middle of the economy, the industry has responded, adapted, and maintained its central role in the most efficient freight and logistics system in the world.
1 Supplychaindive, “6 charts show how PSR changed rail,” April 22, 2020, https://www.supplychaindive.com/news/6-charts-psr-rail-speed-dwell-OR/571792/ (accessed March 24, 2021).

3
The impacts of the pandemic came as a result of the shutdown of the U.S. economy, both by necessity and by rule, as people stayed home, certain businesses were forced to close while others ramped up production, unemployment exploded and thus income dropped, affecting both the scale and scope of consumer purchasing. Many people were buying less; others were buying different things and making purchases in different ways. At about the same time, U.S. exports and imports were affected by international trade conflicts and tariffs. The freight industry, and the railroads, were greatly affected by these economic forces.
COVID-19 changed the product mix in the logistics system, boosting consumer goods and changing the ways in which they were purchased. While continuing to move most bulk commodities, the railroads had the capacity and flexibility to respond to the rapid expansion of demand for intermodal freight in the middle of 2020.
In Section 3, we present and analyze the quantitative trends in rail and truck movements and the economic drivers that have occurred since the onset of the COVID-19 pandemic, comparing them to experiences during the Great Recession, and considering, in particular, the rebound patterns and what they may foretell about the short-term future.

4
3. Analyses of Rail Freight Impacts of Major Economic Disruptions
3.1 Approach
With a view to highlighting and contrasting similarities and differences in the previous economic recession, known as the Great Recession (December, 2007 – June, 2009),2 with the economic disruption brought by the COVID-19 pandemic, the economic indicators in Table 1 were selected with respect to various components of rail freight. Data sources include the Association of American Railroads (AAR), Freightwaves SONAR, The Federal Reserve Bank, The U.S. Department of Transportation Bureau of Transportation Statistics, the Bureau of Economic Analysis, the Energy Information Administration, and the Census Bureau.
To study the trends of the rail freight and economic indicators of different types and times, the following parameters were examined:
1. The lag or lead time of the rail freight drop compared with the corresponding economic indicator;
2. The extent of the drop in the Great Recession and under COVID-19; and 3. The duration taken for half and full recovery for the rail freight, in comparison to the
economic indicator. The weekly rail freight traffic data3 used were the 4-week moving average United States-originated traffic excluding the U.S. operations of Canadian and Mexican railroads unless otherwise specified. U.S. recessions are shaded in charts.
The analysis on total carload and intermodal rail freight is first presented, followed by intermodal freight. The detailed analysis on carload commodities can be found in Appendix A.
2 National Bureau of Economic Research, “US Business Cycle Expansions and Contractions,” NBER, 2020, http://www.nber.org/research/data/us-business-cycle-expansions-and-contractions. 3 Association of American Railroads, “Weekly Rail Traffic Data” (Association of American Railroads, 2021).

5
Table 1 - Rail Freight Components, Related Trucking Metrics, and Economic Indicators Rail Freight
Components Truck Freight Metrics Economic Indicators
Overall / • Industrial Production (Federal Reserve)4 Intermodal • Truck Tonnage Index (Bureau of
Transp. Statistics)5 • Longhaul Outbound Tender
Volume Index6 and Tender Reject Index7 (Freightwaves SONAR)
• Real Personal Consumption Expenditures (PCE) - Durable Goods (Bureau of Economic Analysis)8
• Retail Sales (U.S. Census Bureau)9
Coal / • Coal Production Estimate (Energy Information Administration)10
• Crude Oil Prices: West Texas Intermediate (WTI) (Energy Information Administration)11
• Industrial Production (Federal Reserve) Petroleum Products
/ • EIA Field Production of Crude Oil (Energy Information Administration)12
• Crude Oil Prices: West Texas Intermediate (WTI) (Energy Information Administration)
Motor Vehicles and Equipment
/ • Domestic Auto Production (Bureau of Economic Analysis)13
• Real Personal Consumption Expenditures (PCE) - Durable Goods (B. of Econ. Analysis)
Lumber and Wood Products
/ • Housing Starts: Total: New Privately Owned Housing Units Started (Census Bureau)14
4 Board of Governors of the Federal Reserve System (US), “Industrial Production: Total Index” (FRED, Federal Reserve Bank of St. Louis, 2021), https://fred.stlouisfed.org/series/IPB50001N. 5 Bureau of Transportation Statistics, “Truck Tonnage Index - Seasonally Adjusted” (Bureau of Transportation Statistics, 2021), https://data.bts.gov/Research-and-Statistics/Truck-Tonnage-Index-Seasonally-Adjusted/fdsx-2s48. 6 FreightWaves, “Longhaul Outbound Tender Volume Index” (FreightWaves, 2021). 7 Freightwaves, “Longhaul Outbound Tender Reject Index” (Freightwaves, 2021). 8 U.S. Bureau of Economic Analysis, “Real Personal Consumption Expenditures: Durable Goods (Chain-Type Quantity Index)” (U.S. Bureau of Economic Analysis, 2021), https://fred.stlouisfed.org/series/DDURRA3M086SBEA. 9 U.S. Census Bureau, “Retail Sales: Retail and Food Services, Total,” FRED, Federal Reserve Bank of St. Louis (FRED, Federal Reserve Bank of St. Louis, 2021), https://fred.stlouisfed.org/series/MRTSSM44X72USS; U.S. Census Bureau, “Retail Sales: Nonstore Retailers,” FRED, Federal Reserve Bank of St. Louis (FRED, Federal Reserve Bank of St. Louis, 2021), https://fred.stlouisfed.org/series/MRTSSM454USS. 10 U.S. Energy Information Administration, “Weekly Coal Production” (U.S. Energy Information Administration, 2021), https://www.eia.gov/coal/production/weekly/. 11 U.S. Energy Information Administration, “Crude Oil Prices: West Texas Intermediate (WTI) - Cushing, Oklahoma” (FRED, Federal Reserve Bank of St. Louis, 2021), https://fred.stlouisfed.org/series/DCOILWTICO. 12 U.S. Energy Information Administration, “Weekly U.S. Field Production of Crude Oil (Thousand Barrels per Day),” 2021, https://www.eia.gov/dnav/pet/hist/LeafHandler.ashx?n=PET&s=WCRFPUS2&f=W. 13 U.S. Bureau of Economic Analysis, “Domestic Auto Production” (FRED, Federal Reserve Bank of St. Louis, 2021), https://fred.stlouisfed.org/series/DAUPNSA. 14 U.S. Census Bureau and U.S. Department of Housing and Urban Development, “Housing Starts: Total: New Privately Owned Housing Units Started” (FRED, Federal Reserve Bank of St. Louis, 2021), https://fred.stlouisfed.org/series/HOUSTNSA.
6
3.2 Historical Context for Rail Service Resilience under the Great Recession
Total Carload and Intermodal Rail Freight
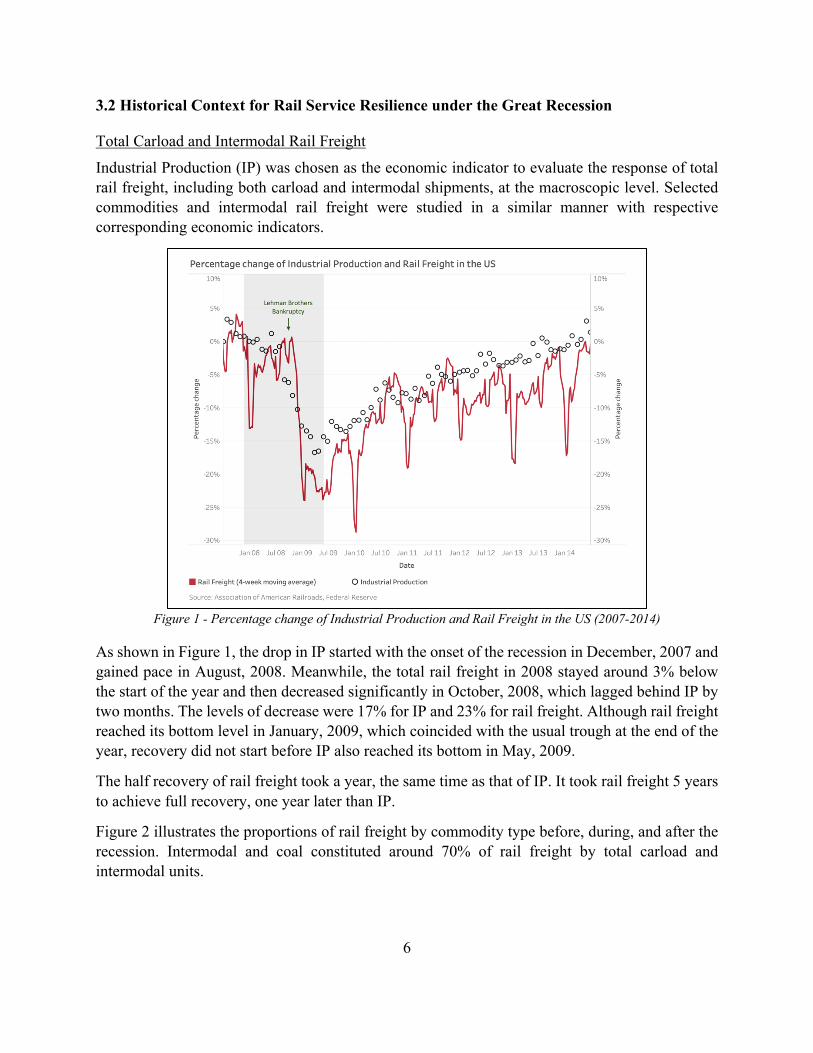
Industrial Production (IP) was chosen as the economic indicator to evaluate the response of total rail freight, including both carload and intermodal shipments, at the macroscopic level. Selected commodities and intermodal rail freight were studied in a similar manner with respective corresponding economic indicators.
Figure 1 - Percentage change of Industrial Production and Rail Freight in the US (2007-2014)
As shown in Figure 1, the drop in IP started with the onset of the recession in December, 2007 and gained pace in August, 2008. Meanwhile, the total rail freight in 2008 stayed around 3% below the start of the year and then decreased significantly in October, 2008, which lagged behind IP by two months. The levels of decrease were 17% for IP and 23% for rail freight. Although rail freight reached its bottom level in January, 2009, which coincided with the usual trough at the end of the year, recovery did not start before IP also reached its bottom in May, 2009.
The half recovery of rail freight took a year, the same time as that of IP. It took rail freight 5 years to achieve full recovery, one year later than IP.
Figure 2 illustrates the proportions of rail freight by commodity type before, during, and after the recession. Intermodal and coal constituted around 70% of rail freight by total carload and intermodal units.

7
Figure 2 - Proportion of Rail Freight by Commodity in the US (carloads/intermodal units 2008-2010)
Intermodal (IM) Rail Freight
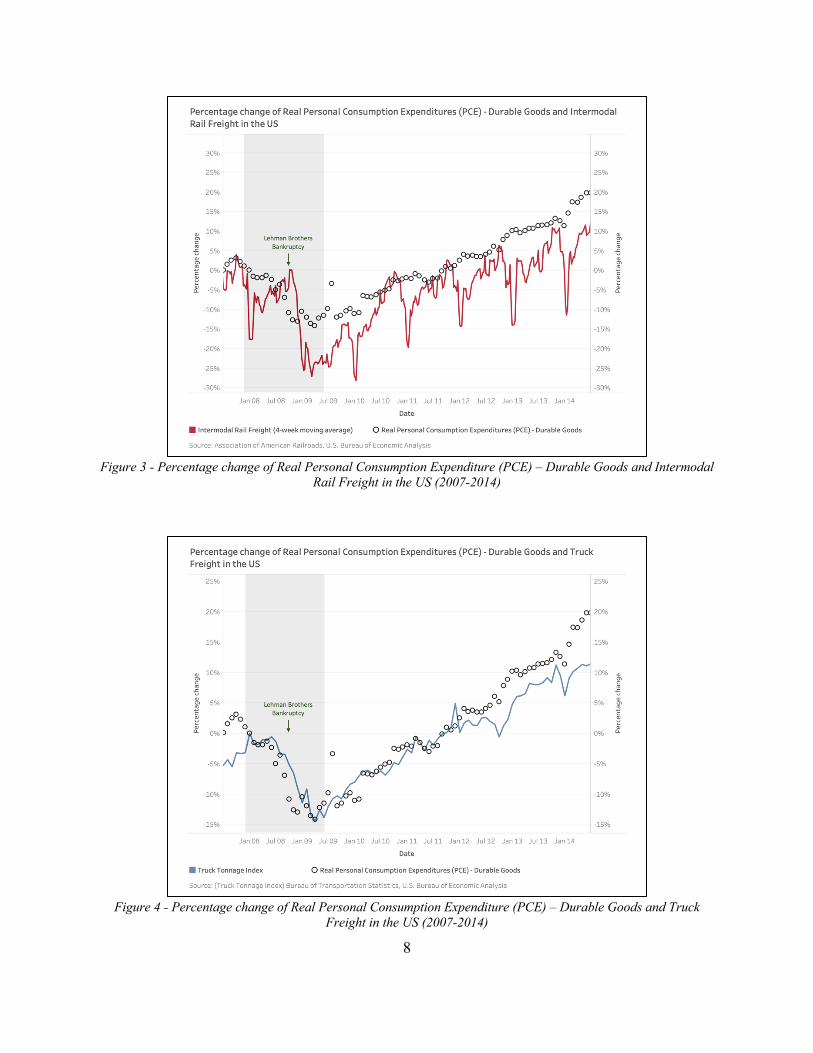
IM rail freight has grown rapidly by 70% over the past 20 years. Real Personal Consumption Expenditure (PCE) - Durable Goods was chosen to reflect the changes in the demand side for IM freight. This is because durable goods are more sensitive to economic changes than the non-durable proportion in PCE.
Figure 3 shows that as the financial crisis unfolded from August to October, 2008, Real PCE – Durable Goods gradually decreased by 13%. The IM freight volume fell by 26% within three months from October, 2008 to January, 2009, which lagged behind the PCE for four months and coincided with the usual year-end trough.
Recovery for IM freight began in March, 2009, after the durable goods expenditures hit bottom in the same month. This was similar to the trends in total rail freight and IP. Half of the losses were recovered in 10 months for Real PCE – Durable Goods and 12 months for IM. The full recovery of IM was completed in 2.5 years, which was faster than the 5 years of overall freight and at the same time when the durable good expenditure returned to the pre-recession level.
8
Figure 3 - Percentage change of Real Personal Consumption Expenditure (PCE) – Durable Goods and Intermodal
Rail Freight in the US (2007-2014)
Figure 4 - Percentage change of Real Personal Consumption Expenditure (PCE) – Durable Goods and Truck
Freight in the US (2007-2014)

9
Figure 4 compares the same economic indicator with truck freight volume as captured by the Truck Tonnage Index from the Bureau of Transportation Statistics. As a competing mode, truck freight tracked closely with IM, albeit with a smaller drop of 14%, similar to that in Real PCE - Durable Goods. In contrast to IM, which lagged behind the PCE indicator by four months, the truck response was rapid, showing no lag for the Truck Tonnage Index to fall and reach the bottom.
The truck recovery time was analogous to IM, with minimal lag or lead to Real PCE – Durable Goods, taking 10 months for half recovery and 2.5 years for a full recovery.
3.3 Current Downturn: Impact of COVID-19 Pandemic on Rail and Intermodal
In this phase of the analysis, the patterns of disruption due to COVID-19 were examined in search of similarities and differences with the Great Recession. As before, selected economic indicators were utilized to relate the response of rail freight to the disruption of specific economic factors, first as a whole for all carload and intermodal freight, followed by breakdowns into intermodal and commodity flows (in Appendix A).
Total Carload and Intermodal Rail Freight
Figure 5 - Percentage change of Industrial Production and Rail Freight in the US (2018-2021)
As shown in Figure 5, rail freight suffered a significant drop of 18% in the early phase of COVID-19 lockdown from February to April, 2020, closely following the drop in IP of 18% from February to March. This illustrated the short-term disruptive effect of the COVID-19 lockdowns in contrast to the two-month lag of rail freight at the onset of the economic recession in 2008.
10
As the lockdown was relaxed following the re-opening of various states, the respective rebounds of the rail freight and IP were rapid, recovering half of the losses within three months. Rail freight grew further to the pre-COVID level, achieving full recovery in five months. Nevertheless, IP was still 3% below the pre- pandemic at the end of 2020. The deviation of total rail freight from IP was supported mainly by the growth in intermodal traffic, which will be discussed later.
Before the coronavirus outbreak, there was a 10% decline in rail freight from the peak in 2018 during the China-United States trade war. As of January, 2021, while rail freight recovered all the losses since the pandemic, it had not yet reached the previous peak.
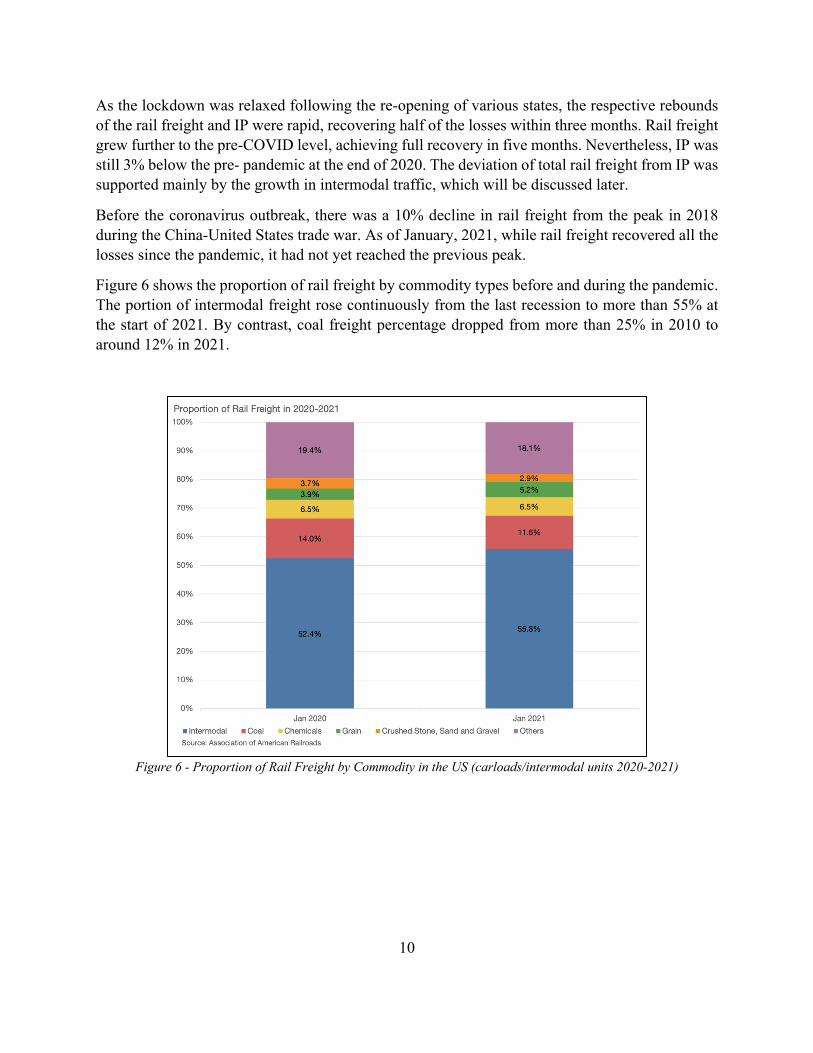
Figure 6 shows the proportion of rail freight by commodity types before and during the pandemic. The portion of intermodal freight rose continuously from the last recession to more than 55% at the start of 2021. By contrast, coal freight percentage dropped from more than 25% in 2010 to around 12% in 2021.
Figure 6 - Proportion of Rail Freight by Commodity in the US (carloads/intermodal units 2020-2021)

11
Intermodal (IM) Rail Freight
Figure 7 - Percentage change of Real Personal Consumption Expenditure (PCE) – Durable Goods and Intermodal
Rail Freight in the US (2018-2021)
Figure 7 shows the response of IM rail freight in the pandemic. During the early stage of the virus outbreak, from February to April, 2020, the freight volume suffered a significant 17% drop, while Real PCE - Durable Goods decreased by 22%.
IM freight showed a V-shaped recovery following full recovery of the durable goods consumption in May. The IM volume returned to the original level in three months in July, lagging by two months. In the third quarter of 2020, the freight volume and the PCE indicator increased further to more than 10% higher than the start of the year. This growth was supported by the new demand in e-commerce induced by the pandemic and lockdown measures.
Before the above events, IM rail freight showed a gradual decrease of 5% since 2018, which took place during the China-United States trade war.
Within IM, trailer rail freight experienced a strong increase of nearly 40% beyond the initial rebound in 2020, closely following retail sales, as further discussed in Appendix A.
12
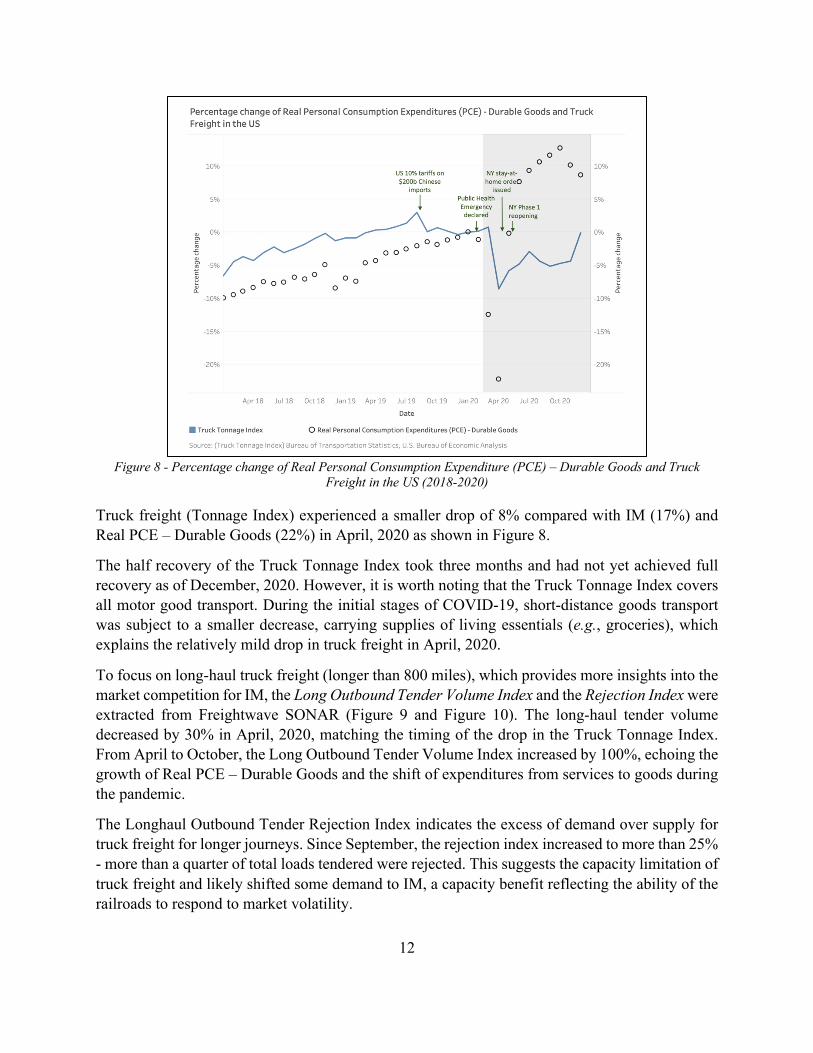
Figure 8 - Percentage change of Real Personal Consumption Expenditure (PCE) – Durable Goods and Truck
Freight in the US (2018-2020)
Truck freight (Tonnage Index) experienced a smaller drop of 8% compared with IM (17%) and Real PCE – Durable Goods (22%) in April, 2020 as shown in Figure 8.
The half recovery of the Truck Tonnage Index took three months and had not yet achieved full recovery as of December, 2020. However, it is worth noting that the Truck Tonnage Index covers all motor good transport. During the initial stages of COVID-19, short-distance goods transport was subject to a smaller decrease, carrying supplies of living essentials (e.g., groceries), which explains the relatively mild drop in truck freight in April, 2020.
To focus on long-haul truck freight (longer than 800 miles), which provides more insights into the market competition for IM, the Long Outbound Tender Volume Index and the Rejection Index were extracted from Freightwave SONAR (Figure 9 and Figure 10). The long-haul tender volume decreased by 30% in April, 2020, matching the timing of the drop in the Truck Tonnage Index. From April to October, the Long Outbound Tender Volume Index increased by 100%, echoing the growth of Real PCE – Durable Goods and the shift of expenditures from services to goods during the pandemic.
The Longhaul Outbound Tender Rejection Index indicates the excess of demand over supply for truck freight for longer journeys. Since September, the rejection index increased to more than 25% - more than a quarter of total loads tendered were rejected. This suggests the capacity limitation of truck freight and likely shifted some demand to IM, a capacity benefit reflecting the ability of the railroads to respond to market volatility.

13
Figure 9 – Long Outbound Tender Volume Index (USA) (2019-2021)
Figure 10 – Long Outbound Tender Rejection Index (USA) (2019-2021)
3.4 A Look Ahead – Time Series Analyses and Predictions
Building on the insights from the resilience of rail freight in the Great Recession in 2008 and correlation with the economic indicators in the pandemic of 2020, this section looks forward to explore how economic indicators and rail freight might develop in the first half of 2021.

14
Methodology Time series models were developed using three future scenarios defined in Table 2 to address the what-if questions. Scenario A assumed that the economic trends before 2020 would have continued through 2020, providing a vision of the future that ignored the impact of the pandemic. Scenario B also assumed continuation of pre-2020 trends but adjusted the economic indicators to match the actual values for December, 2020, assuming the pre-pandemic trend would resume only in 2021. Scenario C incorporated both the trend and impact of the pandemic and extended them to 2021. While forecasting of macro-economic indicators and rail freight is extremely uncertain, these three models serve as a basis for exploring possible futures.
Table 2 – Scenarios for Time Series Modeling for Economic Indicators and Rail Freight Scenario Economic Indicators Rail Freight
Input Output Input Output A. Omitting the pandemic impact
January, 2012 - December, 2019
January, 2020 - June, 2021
January, 2012 - December, 2019
January, 2020 - June, 2021
B. Omitting the pandemic impact and adjusting indicators to match actual levels
January, 2012 - December, 2019
January - June, 2021
(adjusted to match
December, 2020)
January, 2012- December, 2019
January - June, 2021
C. Modeling the pandemic impact
January, 2012 - December, 2020
January - June, 2021
January, 2012 - December, 2020
January - June, 2021
Both the economic indicators and rail freight vary seasonally. For example, PCE and intermodal freight tend to increase at the retail peak seasons and rail freight tends to drop at the year-end holidays. Data used for this analysis were adjusted to account for this seasonal variation to simplify comparisons. Separate time series models of the economic indicators were constructed for each scenario for use in predicting rail freight patterns.
This analysis focused only on intermodal, coal, and motor vehicles and equipment, using the variables listed in Table 3. Detailed methodology and further analysis for carload commodities are presented in Appendix B.
Table 3 – Components of Rail Freight and Economic Indicators in Time Series Modeling Rail Freight Economic Indicator
Intermodal Real Personal Consumption Expenditures (PCE) - Durable Goods Coal Industrial Production Motor Vehicles and Equipment Real Personal Consumption Expenditures (PCE) - Durable Goods

15
Intermodal (IM) Rail Freight
Figure 11 – Time Series Model for Real Personal Consumption Expenditure (PCE) – Durable Goods (2018-2021)
Because Real PCE – Durable Goods published by Federal Reserve shown in Figure 11 was seasonally adjusted (seasonal variation removed), the prediction from the models extended past trends as straight lines. After the initial lockdown ended in April, 2020, the PCE quickly rose and was nearly 10% higher than Scenario A, which illustrates the jump in personal consumption during the second half of 2020.
In 2021, predictions for Scenario A were the lowest among the scenarios because the actual surges in goods purchase were not represented. Scenario B, which assumed the resumption of the previous trend and a sustained growth onwards, is the most optimistic prediction.
Based on the PCE model, Figure 12 shows the IM freight predictions for the three scenarios. In 2020, the COVID-19 impact is illustrated by the difference of as much as 15% between the actual IM freight and Scenario A. However, since the third quarter of 2020, IM freight grew to an even higher level, as much as 7% higher than the Scenario A, which assumed continuation of pre-COVID trends, due largely to the surge in purchasing. This is another sign of how intermodal freight responded promptly and kept the goods moving.

16
Figure 12 – Time Series Model for Average Weekly Intermodal Rail Freight based on Real Personal Consumption
Expenditure – Durable Goods (2018-2021)
In 2021, Scenario A formed the lowest reference assuming the past trend and omitting the IM freight growth in the previous year. In contrast, Scenario B, which represents the case where the current increase in purchasing and its contribution to the IM market would be sustained in 2021, showed that IM freight might be maintained at a high level in early 2021 after the year-end peak in 2020. A similar result was obtained in Scenario C. In fact, IM freight volume actually performed better than all three scenarios as of January, 2021, which indicates unexpectedly strong growth, likely tied to continuing strength in the e-commerce market. Essentially, the actual recovery in IM is “off the charts”, exceeding both where it would have been had pre-pandemic trends continued, as well as the strong growth revealed in the initial recovery.
3.5 Summary
The recovery of rail freight in 2020 was remarkable but uneven across markets. Intermodal was a strong driver of the quick rebound and continued growth under the new norm brought by the surge in demand for products over services. Products and commodities, such as motor vehicles and lumber, returned to pre-COVID levels, since the respective demands were either less affected or recovered promptly after the major lockdown was lifted and manufacturers adapted to the quick shift in consumer demand. This was largely different from the previous major disruption to the rail freight industry during the Great Recession in 2007-2009, which was mainly driven by wide-ranging economic impacts and decline on both supply and demand sides.

17
The return of coal and petroleum freight remained sluggish due to weak demand and low energy prices. Even though production was expected to rise after the pandemic, fierce competition with natural gas and transition to renewable energy appeared to limit their opportunity to attain previous peaks.
Considering the shock brought by coronavirus in the second quarter of 2020, the rapid pace of recovery was a pleasant surprise for the economy, retailers that were able to adapt, and most consumers. A large part of sustained recovery and growth of rail freight is likely to be influenced by whether the long-term growth in e-commerce will continue when the pandemic is over, and the extent to which intermodal freight will benefit from omnichannel retailing.
KEY TAKEAWAYS: COVID-19 IMPACTS ON RAIL FREIGHT
• COVID hit the RRs quickly and hard. But recovery was swift and overall rail freight is exceeding 2019 volumes.
• RRs responded well through the recovery, although employment losses due to COVID-19 and PSR may have made recovery initially more difficult.
• Still, rail capacity was sufficiently nimble to pick up IM traffic growth that long haul trucks could not, rebounding above 2019 weekly shipment levels.
• Demand for bulk commodities outside the energy sector have held reasonably strong and the rail system has kept them moving. The flow of agricultural products, once depressed by trade conflicts and tariffs, also showed rebound.
• IM is an important rail market going forward because it commands high prices and is critical to the nation’s economic recovery.
• Actual recovery in IM has exceeded both where it would have been had pre-pandemic trends continued, as well as the strong growth revealed in the initial phase of the recovery.
• Bulk commodities (of course) are still primary markets for RRs, because rail is most efficient at moving these products.
• To the extent that RRs can sustain and continue to improve performance, IM will be important in the future.
18
4. Industry Perspectives on COVID-19 Impacts and the Future
4.1 Approach
In this component of the project, perspectives on the COVID-19 experience, the rebound, and the future were gathered from 20 leaders from the shipping and logistics industry – representatives of rail and truck carriers, rail car and intermodal chassis manufacturers and pool operators, and major national shippers (Appendix B). This was accomplished through a series of structured, virtual interviews, supported by tracking the trade literature to broaden industry views. The results provide detail beyond the data, including insights into causal factors, obstacles to recovery, and challenges and opportunities for the future.
4.2 Pre-COVID trends in the rail industry
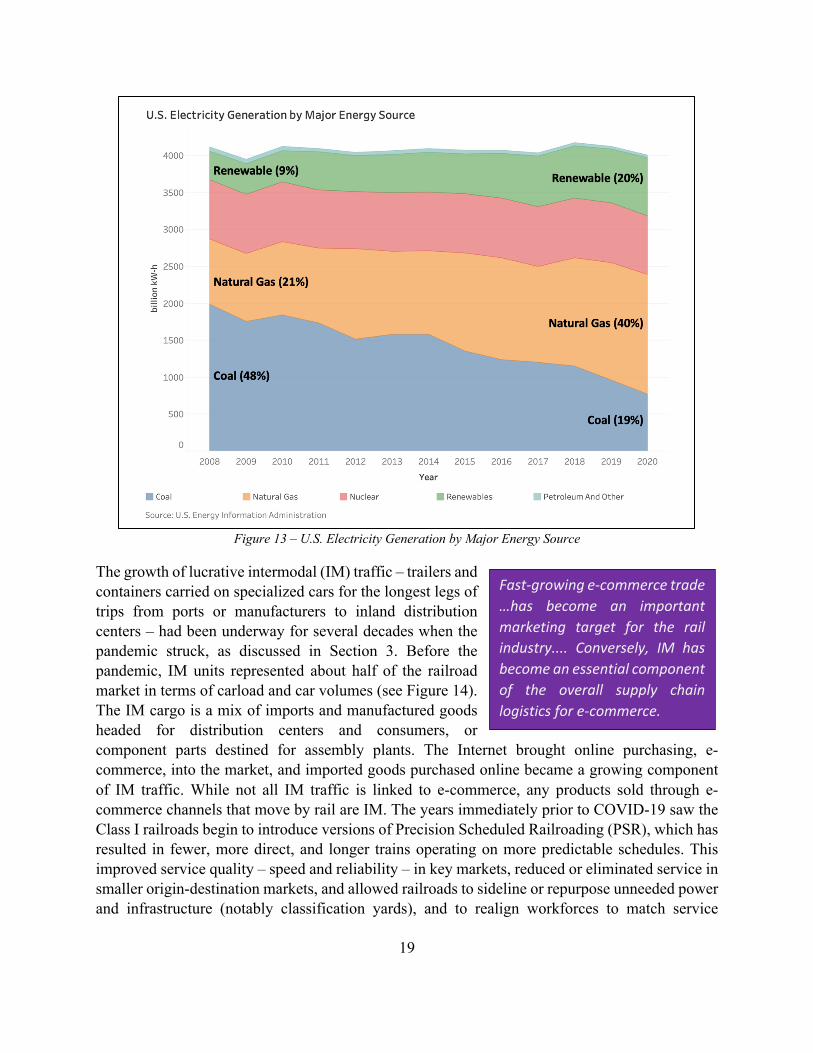
In the years shortly before COVID-19 hit, energy shipments by rail were declining; coal has been experiencing a long-term decline - coal’s share of electricity generation fell by half, from 48% to 19% between 2008 and 2020 (Figure 13). This was driven primarily by the ready availability of less costly (and cleaner) natural gas. Shipments of petroleum fuels were reduced by the global oversupply of petroleum which undercut the prices of domestically-produced shale oils and hit the economics of fracking.
Since the opening of Panama Canal Neopanamax locks in 2016, which incentivized east and Gulf coast port and harbor investments to accommodate larger container ships, there has been some shift in Asian imports headed for Midwest and eastern U.S. destinations from west to east and Gulf coast ports. This was supported by the economies of larger container ships, as well as by some shift in sourcing from China to Southeast Asia in search of lower production costs, which made the Suez Canal route to North America more competitive for east coast destinations. An additional factor has been ongoing congestion and labor uncertainties in southern California (SoCal) ports, which gave retailers and manufacturers the incentive to diversify the use of inbound ports to assure more resilient supply chains.
The shift to east coast (EC) ports favored truck-to-destination container movements, rather than IM, because haul lengths to markets are shorter in the east. Still, west coast (WC), and particularly SoCal ports continue to have a strong draw for containerized imports because of time and cost advantages to both the west coast and Midwestern U.S. markets.
The heavy-and-slow bulk product markets – energy, building, and waste materials, and agricultural products – are where rail has its greatest competitive advantage, except in the Mississippi Valley where barge is also important. Before and during the pandemic, agricultural exports experienced volatility because of trade conflicts with China, Canada, and Mexico.
19
Figure 13 – U.S. Electricity Generation by Major Energy Source
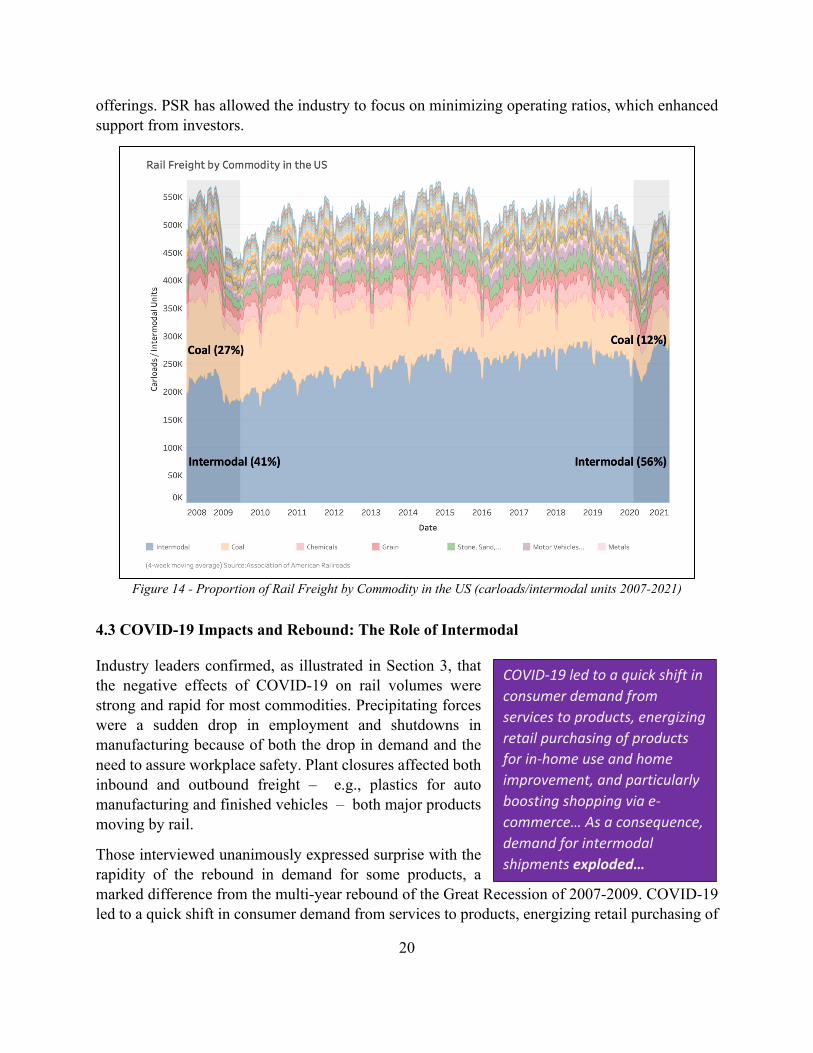
The growth of lucrative intermodal (IM) traffic – trailers and containers carried on specialized cars for the longest legs of trips from ports or manufacturers to inland distribution centers – had been underway for several decades when the pandemic struck, as discussed in Section 3. Before the pandemic, IM units represented about half of the railroad market in terms of carload and car volumes (see Figure 14). The IM cargo is a mix of imports and manufactured goods headed for distribution centers and consumers, or component parts destined for assembly plants. The Internet brought online purchasing, e-commerce, into the market, and imported goods purchased online became a growing component of IM traffic. While not all IM traffic is linked to e-commerce, any products sold through e-commerce channels that move by rail are IM. The years immediately prior to COVID-19 saw the Class I railroads begin to introduce versions of Precision Scheduled Railroading (PSR), which has resulted in fewer, more direct, and longer trains operating on more predictable schedules. This improved service quality – speed and reliability – in key markets, reduced or eliminated service in smaller origin-destination markets, and allowed railroads to sideline or repurpose unneeded power and infrastructure (notably classification yards), and to realign workforces to match service
Fast-growing e-commerce trade …has become an important marketing target for the rail industry.... Conversely, IM has become an essential component of the overall supply chain logistics for e-commerce.
20
offerings. PSR has allowed the industry to focus on minimizing operating ratios, which enhanced support from investors.
Figure 14 - Proportion of Rail Freight by Commodity in the US (carloads/intermodal units 2007-2021)
4.3 COVID-19 Impacts and Rebound: The Role of Intermodal
Industry leaders confirmed, as illustrated in Section 3, that the negative effects of COVID-19 on rail volumes were strong and rapid for most commodities. Precipitating forces were a sudden drop in employment and shutdowns in manufacturing because of both the drop in demand and the need to assure workplace safety. Plant closures affected both inbound and outbound freight – e.g., plastics for auto manufacturing and finished vehicles – both major products moving by rail.
Those interviewed unanimously expressed surprise with the rapidity of the rebound in demand for some products, a marked difference from the multi-year rebound of the Great Recession of 2007-2009. COVID-19 led to a quick shift in consumer demand from services to products, energizing retail purchasing of
COVID-19 led to a quick shift in consumer demand from services to products, energizing retail purchasing of products for in-home use and home improvement, and particularly boosting shopping via e-commerce… As a consequence, demand for intermodal shipments exploded…
21
products for in-home use and home improvement, and particularly boosting shopping via e-commerce as consumers found that many needs could be met without leaving home (see Section 6).
As a consequence, demand for intermodal shipments exploded – the description used by many of those interviewed. The push to IM was accelerated by capacity constraints in the trucking market, attributable to persistent driver shortages amplified by the spread of COVID-19. Manifestations in the trucking industry included both tender rejections (refusals of service) on contracted rates and surcharges for above-contract shipment volumes, as described in Section 3 and reported in the interviews. In this regard, IM rail service played a critical role in the nation’s supply chains during the period of the COVID-19 pandemic, providing much-needed capacity to keep essential goods flowing to consumers.
The IM market, particularly the growing share coming from e-commerce, is an important one for the railroads, not simply for the cargo volumes but also the high revenue potential. That potential comes with a challenge because of the customer demands for high levels of performance: short travel times and especially reliability of on-time delivery of consumer products and manufacturing inputs.
Discussions with industry participants suggested that on-time delivery reliability dominated price in the choice of shipment options, particularly in the e-commerce market.
How Intermodal works: A complex system with many moving parts
Delivering end-to-end IM freight services – moving boxes from ports or factories to assembly plants, distribution centers, and retail stores – while clearly a centerpiece of the U.S. logistics system, is a complex and challenging process. Efficient IM requires the collaboration and coordination of multiple entities: ocean carriers, ports and port operators, trucking companies (drayage and long-haul), manufacturers and assemblers, retailers, rail car manufacturing and leasing companies, chassis providers, inland terminal operators, warehouses, and distribution centers, and, in the middle of the process, the railroads themselves. This process is illustrated in Figure 15, which shows graphically the process flow among the key actors and signals the dependence.
The potential for disconnects and delays exists throughout the process, but particularly at the network nodes – terminals and interchange points. Integrated carriers, i.e., those controlling all of the end-to-end resources – equipment and drivers, holding long term contracts – may be better equipped to assure the success of IM logistics, but the market offers a variety of options for moving containerized freight by IM. And when the demand peaks unexpectedly, as was the case when the
IM rail service played a critical role in the nation’s supply chains during the period of the COVID-19 pandemic, providing much-needed capacity to keep essential goods flowing to consumers.
…industry participants suggested that on-time delivery reliability dominated price in the choice of shipment options, particularly in the e-commerce market.

22
COVID-19 rebound began, some capacity and performance issues can be expected; that they were relatively few is a credit to the nimbleness of this complex system.
of the efficiency of the overall process on the performance of every entity in the chain.
Figure 15 – Illustration of Intermodal Freight Components in Overall Container Movement Process
Delays at Ports. Ports, primarily the busiest container ports in the country, Los Angeles and Long Beach (the “SoCal” ports) are major points of congestion on the IM network.15 These ports have a long history of both market dominance and congestion, the latter due to sheer volume of container moves, but also because of a recent history of labor strife. A number of regulatory and pricing schemes have been applied to reduce port congestion, with varied success.
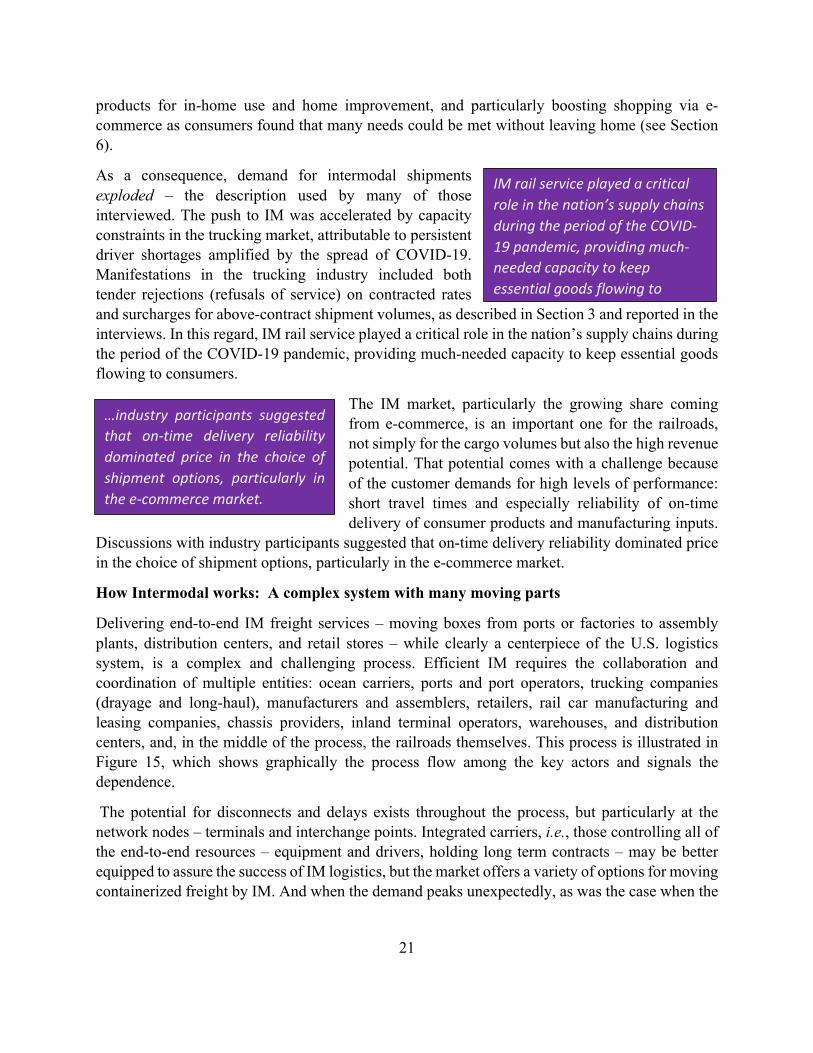
When COVID-19 hit, inbound, loaded container volumes dropped precipitously, first reflecting manufacturing shutdowns in China, and later the dip in U.S. economic activity (see Figure 1616). By July, 2020, adjustments in the U.S. economy began to pull more products through the Asian supply chain; October showed an almost 30% increase in containers coming through the Port of Los Angeles compared with 2019. Similar increases were reported in EC ports, as well,17 and demands for drayage were pressing capacity limits in mid-2020.18
15 United States. Department of Transportation. Bureau of Transportation Statistics, “Port Performance Freight Statistics Program: Annual Report to Congress 2018,” 2019, https://doi.org/10.21949/1502601. 16 Port of Los Angeles, City of Los Angeles, “Container Statistics | Port of Los Angeles,” 2021, https://www.portoflosangeles.org/business/statistics/container-statistics. 17 Mark Szakonyi, “Congestion Risks at North American Ports Rise as Winter Nears,” Journal of Commerce, December 11, 2020, sec. Maritime News, http://www.proquest.com/docview/2469462373/abstract/FCC985E60A0A42BDPQ/1. 18 Jeff Berman, “Capacity, Demand, and Equipment Outlooks Make for Challenging Ocean Container Market,” Logistics Management, January 19, 2021,
And when the demand peaks unexpectedly, as was the case when the COVID-19 rebound began, some capacity and performance issues can be expected; that they were relatively few is a credit to the nimbleness of this complex system.
23
Multiple factors contributed to this uptick – PPE purchases, shifts to buying material goods instead of experiences, store stocking and purchasing for the holiday season, and inventory restocking that was deferred from spring and summer because of the pandemic. On top of this peak in inbound container flows, COVID-19 hit port workers and truck drivers – over 600 cases were reported in the Port of Los Angeles between December, 2020 and February, 2021,19,20 and 800 tested positive or were in quarantine by the end of February.
Figure 16 - Port of Los Angeles Monthly Loaded Imported TEUs, 2019 and 2020
As of February, 2021, containers are still not moving off the WC docks fast enough. Early in the pandemic, retailers were refusing to take boxes – sales were off and unloading labor was short, and port storage was filling up.21 Retailer acceptance of cargo has remained slow, apparently a result of the entire supply chain backing up and the SoCal ports remain heavily congested as import containers stack up, filling available storage space to 95% of capacity and above. As on-dock
https://www.logisticsmgmt.com/article/capacity_demand_and_equipment_outlooks_make_for_challenging_ocean_container. 19 Bill Mongelluzzo, “LA-LB Congestion to Clear by Late Spring: Terminal Operators,” Journal of Commerce, February 5, 2021, sec. Port News, http://www.proquest.com/docview/2486641005/abstract/6E84C1CDC3714935PQ/1. 20 Costas Paris, “Shipping Companies Look at Sailing Away From Choked Southern California Gateways,” Wall Street Journal, February 8, 2021, sec. C Suite, https://www.wsj.com/articles/shipping-companies-look-at-sailing-away-from-choked-southern-california-gateways-11612802085. 21 Mark Szakonyi, “US Port Congestion Threat Demands United Industry Response,” Journal of Commerce, April 2, 2020, sec. Port News, http://www.proquest.com/docview/2385563743/abstract/1B7E37DC65344DF9PQ/1.

24
storage reaches capacity, container throughput slows, and inbound ships spend more time in berths and at anchor. Limited labor and limited lift capacity appear to be ongoing factors, but the primary cause seems to be the slow rate of recipients retrieving inbound boxes – using the WC ports as remote warehouses.
As many as 54 ships were anchored off the SoCal ports awaiting berths in February, 2021.22 There has been some movement to divert ships to other WC ports – Oakland, Seattle, and Tacoma. Some marine carriers have redirected or canceled sailings, and the State of California has asked the Federal Maritime Commission to investigate the problem.
Port congestion and COVID-19-related supply chain problems have led some shippers to pursue a four-corner strategy, dividing inbound shipments between SoCal, the Pacific Northwest, and two east coast ports, Savannah or Charleston and the Port of New York, to reduce risks of delays. Some container owners were reported to be reluctant to ship boxes to EC ports because of slow return cycles compared to WC ports, further congesting WC ports.
This four-corner trend continues to be reported but the impacts seem to be limited. The draw of SoCal ports remains strong for a variety of reasons, including the nearness to large WC markets and the high level of efficiency of rail for moving IM shipments to the U.S. interior. Arguably it is difficult for both carriers and shippers to move away from established logistics patterns supported by extensive private and public infrastructure, concentration of labor, and deep organizational experience.
Transload Facilities. Near-shore transload facilities could be additional choke points on the overall IM logistics network, while providing shippers additional flexibility in adjusting destinations in quasi real-time in response to changing market demands. About a third of inbound international containers, 20 and 40 foot boxes, are transloaded to 53 foot domestic containers at or near the ports for transport by IM rail. Only the smaller boxes are accommodated on most container ships, while the domestic containers can be swapped for the internationals at a ratio of 2 for 3, amplifying inland shipping capacity. Port-area holding and transloading also gives retailers some flexibility by allowing last minute choices of inland destinations for specific products. The remaining two-thirds of inbound marine containers are split about evenly between rail to smaller cities and truck to destinations in SoCal.
Equipment Shortages: Boxes, Chassis, but not Rail Cars. Beyond WC ports operating at capacity, some IM delays were attributed to lack of equipment availability – domestic containers (boxes) and chassis for moving boxes over the road. This was exacerbated by the surge in imports driven by consumer demand for certain types of goods during the pandemic. Some retailers reported that their boxes sometimes missed scheduled outbound trains. Some retailers and
22 Marine Exchange of Southern California, February 16, 2021.
The draw of SoCal ports remains strong for a variety of reasons, including the nearness to large WC markets and the high level of efficiency of rail for moving IM shipments to the U.S. interior.

25
manufacturers were reported to be slow to unload their inbound containers because of local labor shortages as well to hold them for short-term use for local plant or store inventories. As noted previously, boxes and chassis are typically not provided by the rail carrier, but arranged by the IM carrier, the shipper or their agent, through a complex web of shared pools and leased equipment.
Chassis shortages were reported at inbound ports and rail ramps as both carriers and customers held on to chassis to meet their own short term needs. Labor shortages for chassis maintenance were also reported, at least partly due to the pandemic. There are mixed reports as to whether the chassis maintenance issue has been resolved, with variation across regions and time periods. In the cases of both boxes and chassis, capacity problems seemed to be driven by resource allocation factors rather than by an insufficiency of equipment-- a process that is typically conducted by third parties outside the control of the rail carriers themselves.
None of the industry leaders reported shortages of rail cars in total or by type; shortages, or mis-allocations, were focused primarily on chassis and to a lesser extent containers.
No Line-haul Capacity Limits. There were no reports of line haul capacity limits on the railroads, but it is important to recognize that shippers generally do not have direct visibility over rail performance – except when there is a serious breakdown – because they work primarily with motor or marine carriers, or third party logistics companies, which establish longer term arrangements with rail carriers.
Meeting supply chain needs of retailers through Intermodal
Rail is price-competitive with long-haul truckload moves for IM freight especially in long haul markets, where the time and money costs of transloading and lifts on and off trains can be offset by the efficiency of long, double-stack trains. However, pressures coming from customer demand for quick delivery after online sales, in the face of shipment delays, were reported to have led to some diversion from IM rail to direct, long-haul trucking at higher prices. It is likely that the delays themselves occurred at the ports, rather than on the rail network itself, and trucks were substituted to make up time. It is not clear how common this diversion tactic has been during the rebound, but paying premium transport prices to meet spiking retail sales, or to prevent a production line from shutting down, is not uncommon in the global logistics system. One current manifestation is the rapid increase in international air cargo shipments to distribute critical resources to fight the pandemic, as well as to deliver high-value consumer products.
The diversion from IM to direct trucking is an indication of the value of timely fulfillment in some markets, as well as the purchasing power of some retailers. It is a factor that can impact volumes on the rail leg of IM but which may be out of the direct control of the railroads themselves if delays are concentrated in ports.
Rail is price-competitive with long-haul truckload moves for IM freight especially in long haul markets, where the time and money costs of transloading and lifts on and off trains can be offset by the efficiency of long, double-stack trains.

26
It was reported that the largest retailers are motivated to keep multiple carriers and paths in their supply chains. This helps to assure some level of competition for price control, as well as to provide greater resilience through redundant paths for inbound freight.
The delivery performance expectations coming from e-commerce have grown rapidly as COVID-19 has accelerated this retailing channel, as described in Section 6. Meeting these expectations presents both opportunities and challenges for the rail industry.
Based on interviews of industry leaders, it appears that the largest IM shippers are able to get the capacity and service that they demand from carriers because of their leverage in the marketplace. But even middle size shippers report reasonable satisfaction with IM performance, accepting and adapting to some uncertainties in arrival of inbound freight, and adjusting their supply chains in response. Smaller shippers can gain some market advantage by working through 3PLs and logistics support firms which have the capacity to work the freight markets to the advantage of their customers.
An interesting finding that emerged from retailer interviews is that medium and small sized retail customers were not necessarily aware whether a particular shipment was moving by IM rail or truck. Most worked through long haul truck or marine carriers through which they bought door-to-door services. These intermediary carriers assemble the IM moves, arranging all steps of pick up, long haul water and rail, and destination drayage, including procuring boxes and chassis as needed. Some retail and manufacturing customers reported becoming aware that their shipment was moving by rail only in the event of major delays. This suggests that from the standpoint of the beneficial cargo owner, IM delivers service levels comparable to, and competitive with, door-to-door long-haul trucking – making it essentially indistinguishable from an end user’s perspective, except for the reduced cost stemming from the efficiency of the rail move.
The situation is different for large retailers that rely on IM to maintain a diverse portfolio of services as a way of ensuring availability and resilience in the case of surges or disruptions. In this case they may work with both their rail partners and trucking partners to ensure seamless service.
Bouncing back and rail employment factors
Monthly Class I railroad employment as reported to the STB has been in modest decline in recent years, probably due to adjustments as a result of the implementation of Precision Scheduled Railroading (PSR), as well as secular market trends (Figure 1723). In March of 2020, the shrinkage
23 Surface Transportation Board, “Employment Data,” 2021, https://www.stb.gov/econdata.nsf/322683bcf67f4143852566210062ac90?OpenView.
…from the standpoint of the beneficial cargo owner, IM delivers service levels comparable to, and competitive with, door-to-door long-haul trucking – making it essentially indistinguishable from an end user’s perspective, except for the reduced cost stemming from the efficiency of the rail move.

27
accelerated sharply, with the loss concentrated in train and engine (T & E) personnel, which suggests service reductions connected with demand shrinkage attributable to COVID-19. The bottom of the employment swing occurred in June, 2020, a decline of 18% of total employment, and 28% of train and engine workers, year over year. T & E employment dropped 18% just between March and June of 2020.
Table 4 shows that the Train and Engine employment dropped faster than it rebounded. This may have been because demand did not come back so rapidly, but volume data shown in Section 3 does not support this. The slower rebound may have been because it can be easier to furlough employees than to bring them back online: furloughing requires only one or a few decisions by employers; returning to work requires decisions by both employers and employees. For some workers, unemployment compensation rates may have been too attractive for them to return quickly to work; some may have taken other jobs or have been constrained by family obligations created by the pandemic. Some industry observers (not railroaders) speculated that a nimbler rail service restoration might have been impeded initially because of PSR-driven cutbacks in personnel and power that were too close to the bone. In the manufacturing sector, it was reported that some firms that aggressively laid off workers when the pandemic hit found it difficult to restart production when the rebound became apparent.24
The significance of this view – that the rail industry might have been quicker to bring back capacity – and its underlying cause is uncertain, but it is clear that the railroads were able to bounce back strongly as shipment demand rebounded, and in particular were able to provide capacity for IM movements when trucking struggled to deliver required capacity. As discussed in Section 7, expectations are that at least some manufacturing and retail shippers will build extra resilience into their supply chains as a result of lessons learned from COVID-19. These experiences may be relevant for informing future railroad planning, as well.
24 Bob Tita and Austen Hufford, “Consumer Demand Snaps Back. Factories Can’t Keep Up,” Wall Street Journal, February 22, 2021.

28
Figure 17 - U.S. Class I Railroad Monthly Employment by Job Type 2019-2020
Table 4 - Class I Month/Month T & E Employment Changes Date T & E
Employment Month over Month %Δ
Mar '20 51,801
Apr '20 48,658 -6.07% May '20 43,660 -10.27% Jun '20 42,536 -2.57% Jul '20 44,772 5.26% Aug '20 46,253 3.31% Sep '20 47,037 1.70% Oct '20 46,749 -0.61% Nov '20 46,434 -0.67% Dec ‘20 49,069 5.67%
In addition to continuing congestion in SoCal ports, WC storage capacity and nearby transload facilities were also reported to have been under pressure from the quick growth in IM demand. Further, congestion in and competition for inland warehousing capacity was reported. Some of this may have been due to large restocking flows and the inability of retailers to move product quickly enough, but it seems likely that this is a longer term manifestation of both retailers and manufacturers carrying larger inventory cushions to reduce the chance of stockouts due to unexpected events. This is a likely longer term issue facing IM-based supply chains.

29
Assuring the right amount of warehouse and distribution center space in the right places is not a straightforward optimization problem, but it is one that needs to be addressed. The warehouse development cycle takes time, and there is often local opposition to the siting of new distribution centers because of concerns about truck traffic impacts, which conflicts with economic development agencies looking to grow jobs. Furthermore, the volatility of retail, and particularly the variety of fulfillment strategies, can make investment in a distribution center a short term decision.
The IM market will continue to be important for the national and regional economies, and for the railroads themselves. As manufacturing and retailing continue to evolve in method and location, IM can be expected to experience some volatility. Maintaining nimbleness in the face of this volatility is important for the success of the entire IM logistics industry. This means tracking trends, taking measured actions, maintain some level of slack capacity, and planning for the long term.
As manufacturing and retailing continue to evolve in method and location, IM can be expected to experience some volatility. Maintaining nimbleness in the face of this volatility is important for the success of the entire IM logistics industry.
30
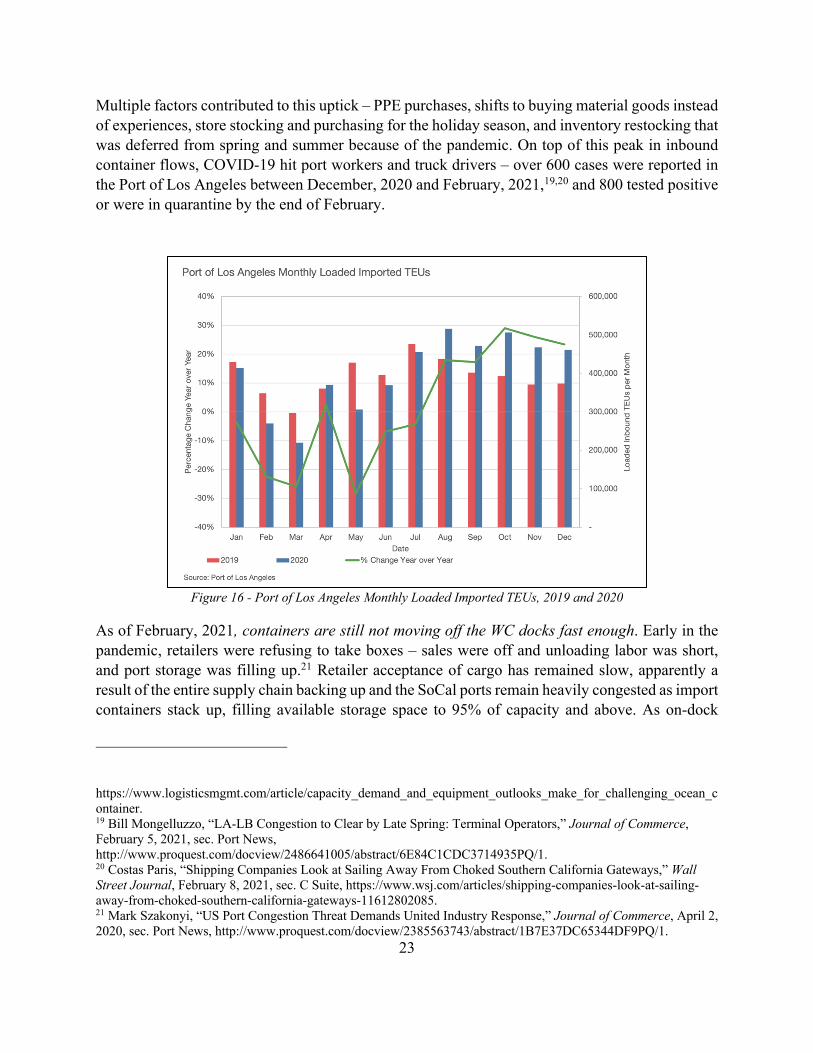
KEY TAKEAWAYS: INTERMODAL
• Jump in IM is mostly driven by large retailers, accelerating a pre-pandemic secular trend.
• Flows from ports and manufacturing centers to inland DCs are the primary connections. Some moves flow through intermediate and transload terminals.
• e-commerce will continue to grow- it’s a good market for RRs, but some RRs are more cautious than others about what markets they choose to pursue.
• Large customers appear to have the clout to obtain the service they demand.
• Large shippers do not want to depend on any single carrier – prefer to spread the business to protect their supply chains, to sustain multiple carriers.
• Industry players say performance is important for attracting and securing customers against the competition. Performance seems more important than cost saving for IM, e-commerce.
• Those industry players also see potential for RR performance improvements - more can be done.
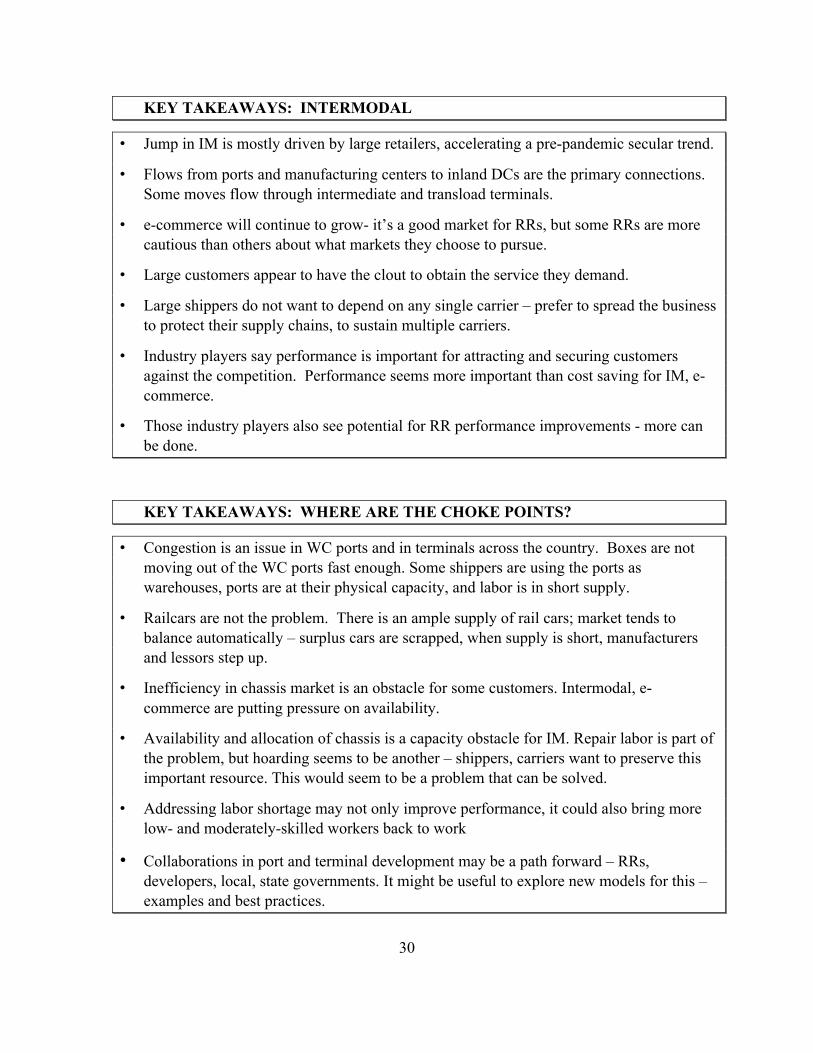
KEY TAKEAWAYS: WHERE ARE THE CHOKE POINTS?
• Congestion is an issue in WC ports and in terminals across the country. Boxes are not moving out of the WC ports fast enough. Some shippers are using the ports as warehouses, ports are at their physical capacity, and labor is in short supply.
• Railcars are not the problem. There is an ample supply of rail cars; market tends to balance automatically – surplus cars are scrapped, when supply is short, manufacturers and lessors step up.
• Inefficiency in chassis market is an obstacle for some customers. Intermodal, e-commerce are putting pressure on availability.
• Availability and allocation of chassis is a capacity obstacle for IM. Repair labor is part of the problem, but hoarding seems to be another – shippers, carriers want to preserve this important resource. This would seem to be a problem that can be solved.
• Addressing labor shortage may not only improve performance, it could also bring more low- and moderately-skilled workers back to work
• Collaborations in port and terminal development may be a path forward – RRs, developers, local, state governments. It might be useful to explore new models for this – examples and best practices.

31
5. e-Commerce and Omnichannel Retailing
Online shopping – e-commerce – has been a growing component of retail sales for more than a decade, as illustrated in Figure 18.25 Growth has been accelerating, and the lockdowns of COVID-19 forced both a change in purchasing patterns – from experiences to goods – and a rapid shift to online purchasing as many retail outlets were closed and consumers avoided in-store shopping where it was still available. Figure 19 shows the trend in e-commerce share from January, 2019 through the third quarter of 2020. This highlights the very rapid jump coming into the second quarter of 2020, the effect of the pandemic. At the COVID-driven peak in the second quarter of 2020, e-commerce was 16.1% of all retail. This has dropped to 14.0% in the fourth quarter of 2020, presumably as some purchasing moved back to retails stores.
Figure 18 - e-commerce as a share of Total Retail Sales (2000-2020)
Department of Commerce figures include expenditures related to gasoline and fuels at gas stations, car dealers, and restaurants and bars, which are not normally purchased online. If these items are excluded, the online share of total retail sales becomes 21.3% in 2020, up from 15.8% in 2019 and 14.3% in 2018.26
25 U.S. Census Bureau, “E-Commerce Retail Sales as a Percent of Total Sales,” FRED, Federal Reserve Bank of St. Louis (FRED, Federal Reserve Bank of St. Louis, 2021), https://fred.stlouisfed.org/series/ECOMPCTSA. 26 Ali, F. “Digital Commerce Grows 44% in 2020”, Digital Commerce 360, January 2021, https://www.digitalcommerce360.com/article/us-ecommerce-sales/ (accessed February 22, 2021).

32
e-commerce is clearly here to stay and is expected to grow. The forced experiment of COVID-19 has shown many shoppers that this form of purchasing and the delivery (and return) experience are convenient beyond the restrictions of the pandemic. It adds to the portfolio of buying options within omnichannel retailing, where merchants offer products through in-store purchases, on-line buying with direct delivery, and online shopping and store pickup, with the latter often being quicker and less costly. The commitment to omnichannel sales is exemplified by the fact that some national retail chains are modifying the physical arrangement of stores to provide warehouse space for both direct-to-customer deliveries and in-store pickup. In this way the retail stores of some national merchants are becoming omnichannel outlets.
Figure 19 - e-commerce as a Share of Total Retail Sales (2018-2020)
A useful taxonomy of omnichannel alternatives is presented by Chopra (2018),27 and depicted in Figure 20. The alternatives are defined along two dimensions, each with two levels: (1) where the customer obtains information about the product, and (2) where the product is delivered. The pandemic saw a significant weakening of the two channels that entail face to face information gathering (top two quadrants), whereas the two lower quadrants experienced significant gains. In particular, the lower left quadrant with home delivery grew significantly. These channels have very different supply chain and logistics implications in terms of inventory stock holdings,
27 Chopra, S. (2018). The evolution of omni-channel retailing and its impact on supply chains. Transportation research procedia, 30, 4-13.
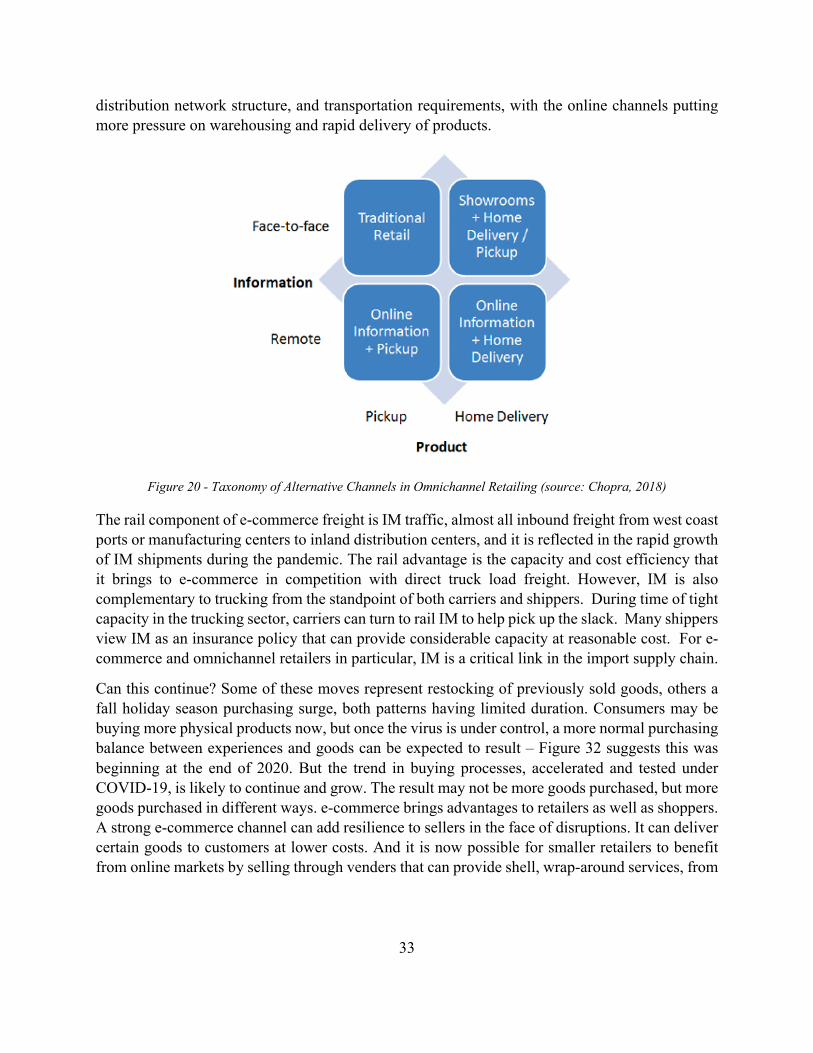
33
distribution network structure, and transportation requirements, with the online channels putting more pressure on warehousing and rapid delivery of products.
Figure 20 - Taxonomy of Alternative Channels in Omnichannel Retailing (source: Chopra, 2018)
The rail component of e-commerce freight is IM traffic, almost all inbound freight from west coast ports or manufacturing centers to inland distribution centers, and it is reflected in the rapid growth of IM shipments during the pandemic. The rail advantage is the capacity and cost efficiency that it brings to e-commerce in competition with direct truck load freight. However, IM is also complementary to trucking from the standpoint of both carriers and shippers. During time of tight capacity in the trucking sector, carriers can turn to rail IM to help pick up the slack. Many shippers view IM as an insurance policy that can provide considerable capacity at reasonable cost. For e-commerce and omnichannel retailers in particular, IM is a critical link in the import supply chain.
Can this continue? Some of these moves represent restocking of previously sold goods, others a fall holiday season purchasing surge, both patterns having limited duration. Consumers may be buying more physical products now, but once the virus is under control, a more normal purchasing balance between experiences and goods can be expected to result – Figure 32 suggests this was beginning at the end of 2020. But the trend in buying processes, accelerated and tested under COVID-19, is likely to continue and grow. The result may not be more goods purchased, but more goods purchased in different ways. e-commerce brings advantages to retailers as well as shoppers. A strong e-commerce channel can add resilience to sellers in the face of disruptions. It can deliver certain goods to customers at lower costs. And it is now possible for smaller retailers to benefit from online markets by selling through venders that can provide shell, wrap-around services, from

34
web portals to payment management to warehousing and inbound and outbound shipping (e.g., Shopify, Amazon, and UPS).28
This diversification makes the inbound freight side of e-commerce an important target for rail IM. Holding and growing IM market share will depend on rail meeting the performance expectations of competitive retailers and their customers – high velocity, reliability, visibility of shipments, sufficient capacity to meet peak demands, and the nimbleness to deal with volatile retail markets. This is likely to take a combination of tight operations management, advanced technologies for tracking and managing shipments, and management willing to trade volatility risk for significant reward.
KEY TAKEAWAYS: E-COMMERCE
• COVID-19 crisis introduced many new customers to e-commerce and its convenience.
• A majority of those are likely to continue using e-commerce at some level -- both convenience and price argue in that direction.
• This reinforces the structural trend already under way pre-pandemic, where physical retail was losing out to online and was actively reinventing itself.
• Nonetheless, experiential elements of shopping are important for some products and will help brick and mortar regain a significant role in overall retailing.
• The inbound freight side of e-commerce is an important target for rail IM. Holding and growing IM market share will depend on rail meeting the performance expectations of competitive retailers and their customers – high velocity, reliability, visibility of shipments, sufficient capacity to meet peak demands, and the nimbleness to deal with volatile retail markets.
28 Sunil Chopra, “Designing Resilient Supply Chains – the Role of Industry Commons in Building Resilience at Low Cost” (Online presentation for the Northwestern Alumni Association, February 17, 2021).
35
6. The Future – Implications and Recommendations
6.1 Visions, Opportunities, and Uncertainties
A post-pandemic economic recovery is well-underway, though not yet equally distributed across U.S. society, geographic regions, or economic sectors. That recovery will likely be accelerated with widespread delivery of vaccines and the deployment of federal stimulus funds. Consumer purchasing trends will return to a different normal, a state that includes more in-store shopping than at the peak of the pandemic, but with a growing proportion of online buying and associated expectations for quick delivery that is comparable to in-store buying. The range of channels available to combine digital and brick and mortar purchasing in varying degrees will continue to widen, along the omnichannel lines discussed in the preceding section. The retailing landscape was rapidly changing before the pandemic; this change dramatically accelerated the role of online and digital in the consumer experience. There is no reason to expect the dynamic to change-- with offerings that bring customers greater variety and greater convenience at reasonable cost. Based on the COVID-19 experience to date, these developments can bring advantages to shoppers, retailers, and well-positioned logistics firms, those prepared to deliver reliable capacity at a competitive price.
COVID-19 has demonstrated the value of nimbleness for the freight industry, manufacturers, and retailers – the ability to adjust quickly and efficiently to changing levels and patterns of supply and demand. This is likely to lead to more domestic and near-shore sourcing and manufacturing and larger inventory cushions. For the rail industry, the analog of larger inventory cushions is assuring that the personnel and equipment are in place or readily available to adjust to market needs and opportunities on short notice.
The IM market is likely to continue to grow in importance, putting pressure on all entities involved, including the railroads, to deliver high levels of service – reliability and timeliness. PTC and other technology deployments (e.g., RailPulse,29 which defines a telematics standard and builds on existing technology to track rail car location, condition and health) can provide tools for assuring and managing performance and meeting customer desires to know where their shipments are.
Terminal throughput rates and storage capacities are critical to IM performance, and thus are important to all involved in the industry. The need is for both a mixture of capacity growth and more efficient allocation and utilization to get the best use out of all IM assets through technologies and incentives. This suggests the opportunity and value for the rail industry of engaging in terminal and warehouse planning and development, through actions ranging from collaborative planning to advocacy to direct investment.
29 “Monitoring North America’s Rail Pulse,” Railway Age, October 23, 2020, https://www.railwayage.com/analytics/monitoring-pennsylvanias-rail-pulse/.

36
In defining and supporting the role of the railroad industry in the national and local economies, the most important messaging to the public and the policy processes should address at least three points of value:
• The value of efficient logistics, and the rail role in those logistics, to the daily operations and success of households and businesses, and the ways in which improvements in railroad operations, investments in infrastructure, and adoption of new technologies have contributed to this success;
• The economic development benefits of railroad investments in improved logistics; and • The central role of the railroads in assuring the safety, energy efficiency, and environmental
advantages that come from having the world’s best freight system. Key uncertainties going forward are the extent and rapidity of change in the freight marketplace, the scale, duration, and impact of government stimuli, international trade competition, and barriers, trends in regulations, how the pandemic itself behaves, the rate of development of technologies that support and compete with the rail industry, and ability of the freight industry and the railroads to adapt to these trends in a timely fashion. A nimble, future-oriented railroad management will be able to adjust each of these.
6.2 Policies to Assure a Vibrant Rail Industry
A vibrant and adaptable multimodal freight transportation system is a cornerstone of an effective and competitive economy. Rail, trucks, barges, and air carriers each have their own specialized roles in this system. In the United States, the rail network is at the core of that freight system, serving as the prime mover of bulk materials for construction, agriculture, manufacturing, and energy, and, in the intermodal market, functioning as the lynchpin for highly efficient, reliable long distance movement of products that support manufacturing and personal consumption.
To assure a safe, efficient, and environmentally beneficial logistics system, public regulatory and investment policies need to support the balanced advancement of all elements of the freight transportation system, maintaining modal neutrality to let the natural economic advantages of each mode determine its competitive position in the freight economy.
To achieve this balanced approach to the development of freight policies at the federal and state levels, it will be important to keep regulator policy focused on assuring a high level of performance rather than specifying the ways to achieve the public goals of a strong economic, a high level of safety, and environmental quality. This means, for example, defining requirements in terms of outcomes rather than inputs (e.g., safety based on failure probabilities rather than crew size mandates). In this way, policies and regulations can be crafted to encourage innovation and produce long term social and economic benefits.
Railroads and other players in the logistics industry need to be able to deliver and price services to earn their cost of capital to support investment and reinvestment in equipment and infrastructure.
37
The rail industry, the most capital intensive business in the logistics system, has invested over $740 billion in infrastructure and equipment since it was deregulated under the Staggers act of 1980.
The cost of delays because of terminal congestion is a drag on the national logistics system of which the railroads are a central component. While the terminal sector is largely in private hands, either as owners or contract operators, the public sector has a role to play in facilitating the development of port and inland terminal capacity that supports both national and regional commerce and economic development. That role may include planning mandates tied to capital investment grants, the development and/or authorization of innovative financing mechanisms, such as focused infrastructure banks, and fostering new collaborative mechanisms and authorities among regional governments, the railroads and other private carriers, and infrastructure investment funds.
One way to increase the awareness of the policy process on matters of terminal capacity, the importance of logistics in regional economic development, and particularly the role of the rail industry would be to strengthen the mandate for state freight plans codified in the Fixing America's Surface Transportation (FAST) Act of 2015, which currently have their primary focus on highways.30 This can help state leaders gain a better appreciation of the value that non-highway modes, especially the railroads, bring to both the industries and consumers in a state, as well as building a basis for more informed policies and collaboration.
As the rail industry increases its investment in and reliance on information technology for operations management and train tracking and control, federal policy and collaborative investment needs to address ways of assuring cybersecurity in the railroads because of its importance to national economic security and well-being, as demonstrated by the experience of COVID-19.
Finally, it is incumbent upon railroad leadership to support the development of informed public policy at all levels of government by continuing to update and tell the story of the role of the railroad industry in the American economy and society. The performance of the railroads in the rebound from COVID-19 is an important part of that story.
6.3 Closure
The disruptions of COVID-19 produced a significant impact on the U.S. freight system in 2020 and 2021, both as the effects of the pandemic came into play, cutting freight demand for consumer goods and manufacturing, as well as energy and some other bulk commodities, and especially in the rapid rebound in demand for certain products as stay-at-home purchasing patterns developed.
30 Lama BouMjahed and Joseph L. Schofer, “Freight Performance Measurement in FAST Act-Mandated State Freight Plans,” Transportation Research Record 2673, Journal of the Transportation Research Board, April 4, 2019.

38
This whipsaw effect forced the industry to play catch up with services offered and the resources needed to deliver them.
While the industry did that successfully, some of the lessons learned from COVID-19 can provide useful guidance for mapping the future of the rail industry and the entire U.S. logistics system. The pandemic demonstrated the resilience of that system and identified opportunities for improvements, including places where terminal capacity increases may be warranted, where better coordination among collaborators is needed, and where allocation and utilization policies for equipment and other resources might be adjusted to improve overall freight system performance. Such actions and investments will help deliver the freight system resilience needed for the next major disruption.
COVID-19 proved the essential role of railroads, not only in their historic mission of moving bulk commodities most efficiently, but in their centrality in the intermodal transportation of goods that sustained manufacturing and delivered products to retail stores and the homes of consumers.

39
Appendix A
Further Analysis of Impacts on Rail Freight in Section 3
A.1 Historical Context for Rail Service Resilience under the Great Recession
Coal Rail Freight
Figure 21 - Percentage change of Crude Oil Price, Coal Production Estimate and Coal Rail Freight in the US
(2007-2014)
Figure 21 shows that the coal rail freight remained steady in the first part of the recession until production peaked in late 2008. Subsequently, there was a fall of 10% in both production and rail freight from March to May, 2009 after the cyclical year-end drop. The movement of rail freight followed that of production closely, as rail is the major means for coal transportation.
Coal production was highly related to energy prices. The crude oil price (WTI) fell 70% in the second half of 2008, reaching its bottom in January, 2009, which led the indicators of coal production and rail freight by four months.
No full recovery for coal production and rail freight was observed after the peak in 2008. The freight volume began a long-term decrease of 45% between 2009 and 2020. Meanwhile, the coal production fell by 35% between 2009 and 2020. The long-term decrease in the previous decade, on average 4% yearly, can be explained by competition from natural gas followed by increasing
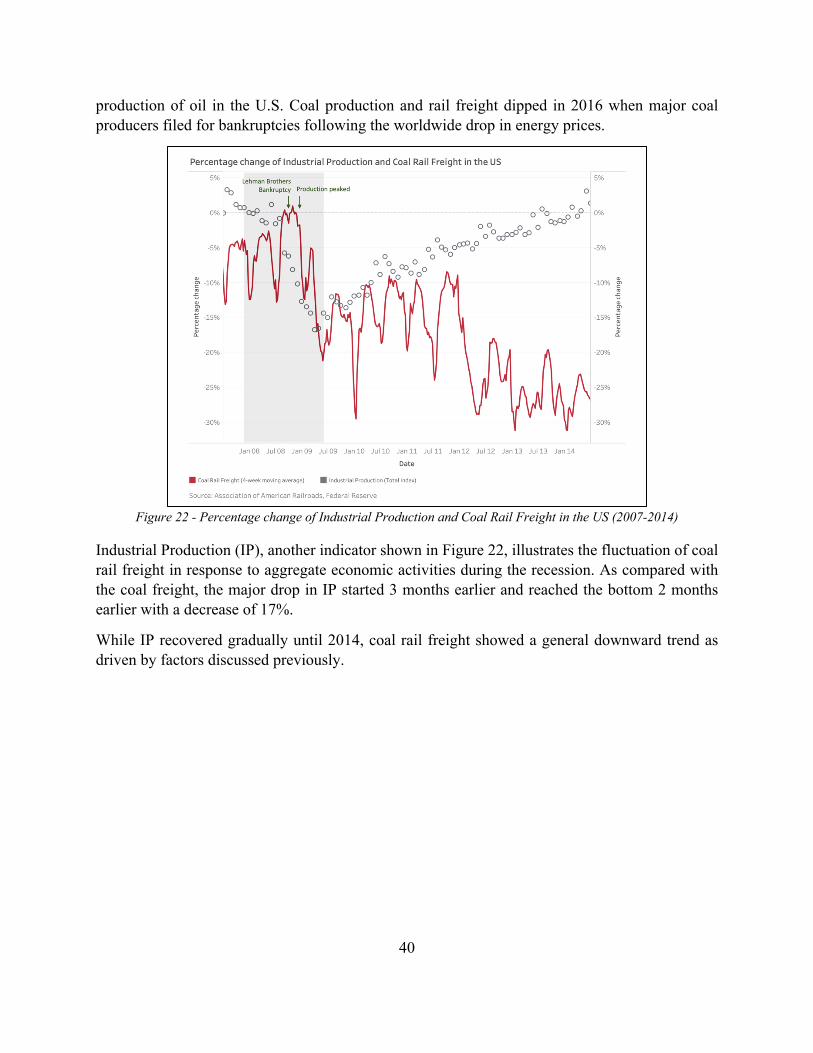
40
production of oil in the U.S. Coal production and rail freight dipped in 2016 when major coal producers filed for bankruptcies following the worldwide drop in energy prices.
Figure 22 - Percentage change of Industrial Production and Coal Rail Freight in the US (2007-2014)
Industrial Production (IP), another indicator shown in Figure 22, illustrates the fluctuation of coal rail freight in response to aggregate economic activities during the recession. As compared with the coal freight, the major drop in IP started 3 months earlier and reached the bottom 2 months earlier with a decrease of 17%.
While IP recovered gradually until 2014, coal rail freight showed a general downward trend as driven by factors discussed previously.

41
Petroleum Rail Freight
Figure 23 - Percentage change of Crude Oil Production, Price (WTI), and Rail Freight in the US (2007-2020)
The petroleum component of rail freight depended mainly on the domestic production of crude oil, with pipeline as the competitor. Therefore, its variation was influenced more directly by the fluctuation in the energy market and local production than the economic recession.
In Figure 23, with 2008 as the baseline, the volume of petroleum products moved by rail freight increased by 160% until 2014, while crude oil field production grew by 80% in the same timeframe. This increment followed the growth in shale oil production in the U.S. Afterward, rail freight dropped by nearly half until 2017, when oil production contracted by 10% and some traffic shifted to pipelines.
While the crude oil price (WTI) fell by a significant amount (more than 50%) in worldwide energy price crises in 2008 and 2014, the crude oil production only decreased temporarily and moderately (less than 20%) due to the less elastic nature of production in a short term.

42
Motor Vehicles and Equipment Rail Freight
Figure 24 - Percentage change of Domestic Auto Production and Motor Vehicles and Equipment Rail Freight in the
US (2007-2014)
The automotive industry was among the most impacted in the Great Recession. Soon after the financial crisis culminated with the bankruptcy of Lehman Brothers in 2008, domestic auto production dipped by 70% in three months, as shown in Figure 24. Rail freight followed with a decrease of 60% at the same time.
After the federal government bailout of the American auto industry in 2009, both automotive production and auto-related rail freight recovered by half in nine months. Full recovery took another 2.5 years until 2012.

43
Figure 25 - Percentage change of Real Personal Consumption Expenditure (PCE) – Durable Goods and Motor
Vehicles and Equipment Rail Freight in the US (2007-2014)
Figure 25 shows Real PCE – Durable Goods as a demand indicator to reference the trends in auto rail freight, both of which followed a similar timeline of fall and recovery. The PCE dropped by 13% from August to October, 2008, within the same timeframe of the decrease in rail freight by 60%. The half recovery of both took around 10 months, and the full recoveries were completed in 2.5 years.

44
Lumber and Wood Products
Figure 26 - Percentage change of Housing Starts and Lumber and Wood Products Rail Freight in the US (2007-
2014)
Wood is a major construction material for single family homes, making Housing Starts for new, privately owned units a good indicator to reference variation in lumber and wood products moved by rail. Following the subprime mortgage crisis starting from 2007, the Housing Starts fell by more than 35% from September to December, 2008. The drop of rail freight of lumber and wood products at the same time and amounted to more than 40%.
After reaching the bottom, the indicator of housing starts lingered at a low level for 2.5 years and then took two years further for full recovery. Rail freight showed a similar trend and fully recovered in 4.5 years.
This analysis shows that the rail freight response to the Great Recession logically followed the relevant driving variables in both the economic decline and recovery. Notable in the patterns was the multi-year period required for both the economic indicators and rail shipments to recover to pre-recession levels.

45
A.2 Current Downturn: Impact of COVID-19 Pandemic on Rail and Intermodal
Coal Rail Freight
Figure 27 - Percentage change of Crude Oil Price (WTI), Coal Production Estimate, and Coal Rail Freight in the
US (2018-2021)
Figure 27 shows that, following the 45% drop before the year 2020 mentioned earlier, rail shipments of coal, together with the Coal Production Estimate, dipped by more than 30% during the pandemic and the coincident worldwide fall in energy prices. The crude oil price (WTI) began falling in January, 2020 and turned negative briefly in April, which led the trough of coal production and freight by one month. Subsequently, coal production and rail freight showed a V-shape rebound, recovering half of the losses in three months but remaining 10% below the pre-pandemic level.
While the short-term disruption in coal production brought on by COVID-19, likely because of the temporary shutdown of mines and labor restrictions, was recovered, the long-term decline in coal production and coal freight by rail persisted. This was driven by the competition with other energy sources, especially natural gas, as discussed previously.

46
Figure 28 - Percentage change of Industrial Production and Coal Rail Freight in the US (2018-2021)
Industrial Production, shown in Figure 28, dropped rapidly from February to April, 2020 by nearly 20%, reaching the bottom one month earlier than the coal rail freight. This shorter lead time, attributed to the quick disruption of the initial lockdown in the pandemic, contrasted with the slower response during the Great Recession. IP recovered half of the losses two months later in June, 2020, leading rail freight also by two months.

47
Crude Oil Production
Figure 29 - Percentage change of Crude Oil Production, Price (WTI), and Rail Freight in the US (2018-2021)
As shown in Figure 29, the petroleum products moved by rail dropped by 25% from March to May, 2020, following the decrease of crude oil production by 15% in the same period. The WTI oil price started to drop in January and reached bottom, briefly going negative in April and leading rail freight by a month.
While rail freight recovered by a small amount to return to 10% below the pre-COVID level, oil production remained around 15% lower than the start of 2020. The reasons included reduced energy demand in the U.S., as industrial production had not yet fully recovered. Low energy prices also prompted the shutdown of some crude oil drill rigs.
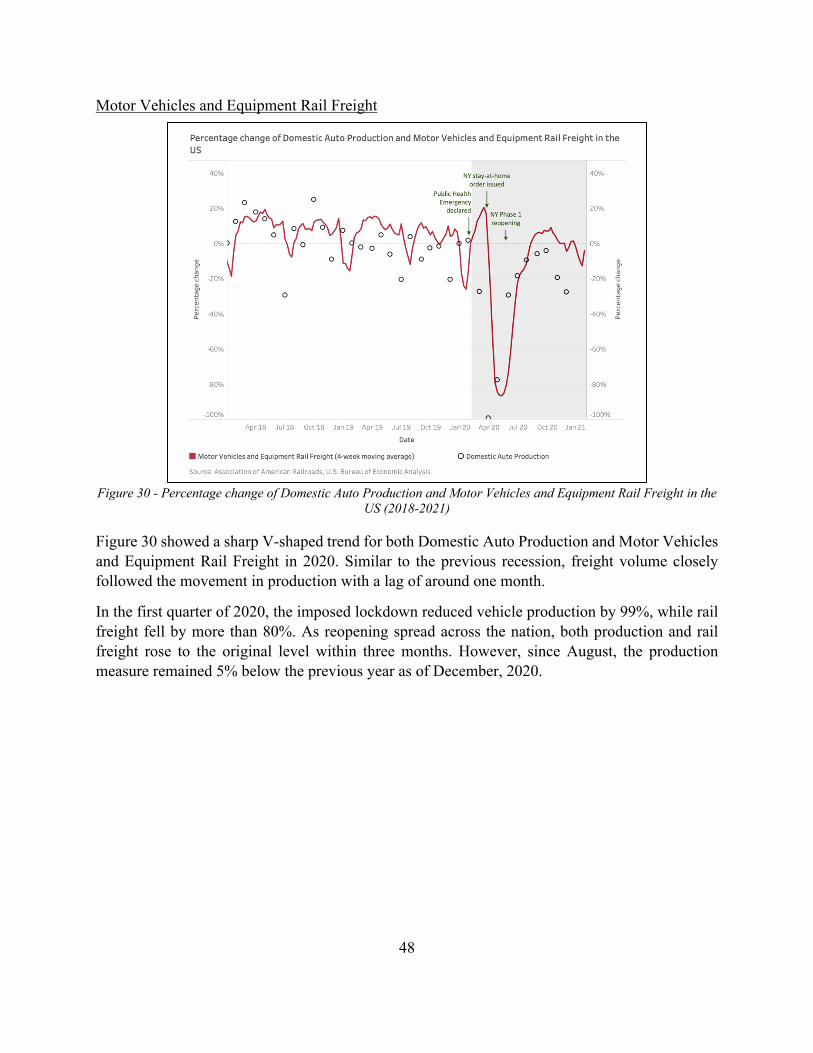
48
Motor Vehicles and Equipment Rail Freight
Figure 30 - Percentage change of Domestic Auto Production and Motor Vehicles and Equipment Rail Freight in the
US (2018-2021)
Figure 30 showed a sharp V-shaped trend for both Domestic Auto Production and Motor Vehicles and Equipment Rail Freight in 2020. Similar to the previous recession, freight volume closely followed the movement in production with a lag of around one month.
In the first quarter of 2020, the imposed lockdown reduced vehicle production by 99%, while rail freight fell by more than 80%. As reopening spread across the nation, both production and rail freight rose to the original level within three months. However, since August, the production measure remained 5% below the previous year as of December, 2020.

49
Figure 31 - Percentage change of Real Personal Consumption Expenditure (PCE) – Durable Goods and Motor
Vehicles and Equipment Rail Freight in the US (2018-2021)
Real PCE – Durable Goods led the drop of automobile rail freight by one month (Figure 31), with a bottom of 20% below the pre-pandemic level in April, 2020. The full recovery was rapid and took only one month, while the rail freight recovered three months later. This highlighted a difference compared with the Great Recession, in that the COVID-19 downturn was driven mainly by a temporary production shock, rather than by a drop in demand.
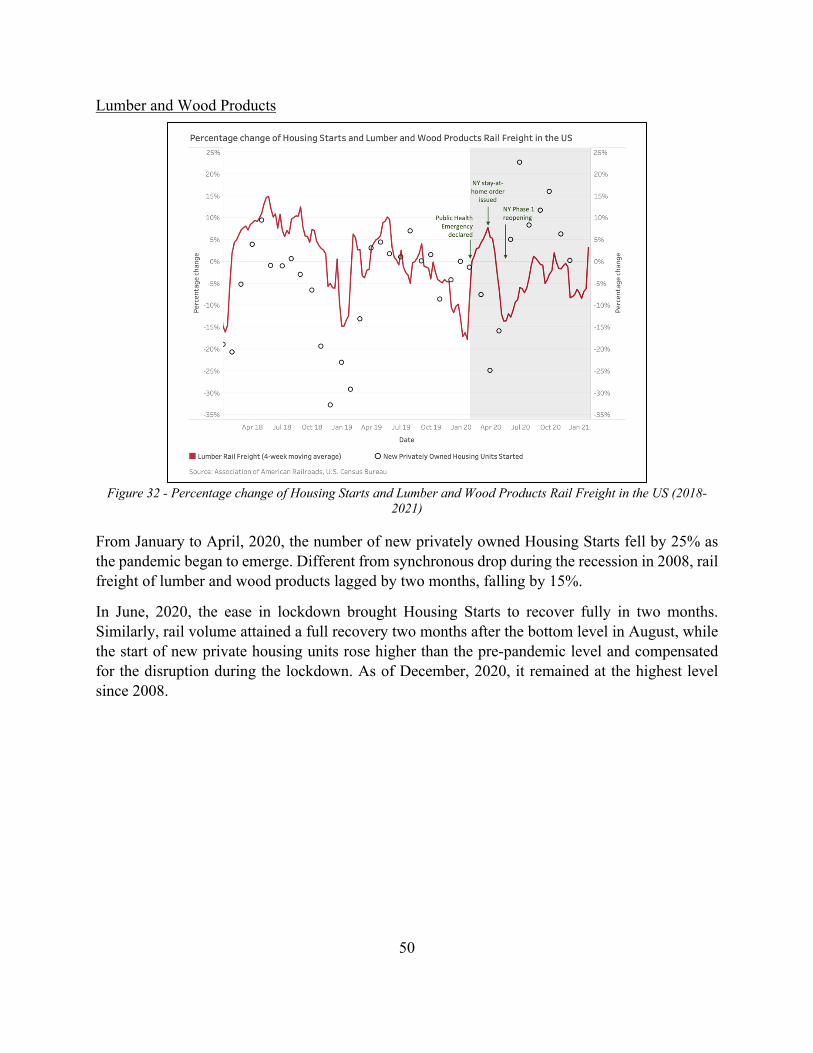
50
Lumber and Wood Products
Figure 32 - Percentage change of Housing Starts and Lumber and Wood Products Rail Freight in the US (2018-
2021)
From January to April, 2020, the number of new privately owned Housing Starts fell by 25% as the pandemic began to emerge. Different from synchronous drop during the recession in 2008, rail freight of lumber and wood products lagged by two months, falling by 15%.
In June, 2020, the ease in lockdown brought Housing Starts to recover fully in two months. Similarly, rail volume attained a full recovery two months after the bottom level in August, while the start of new private housing units rose higher than the pre-pandemic level and compensated for the disruption during the lockdown. As of December, 2020, it remained at the highest level since 2008.
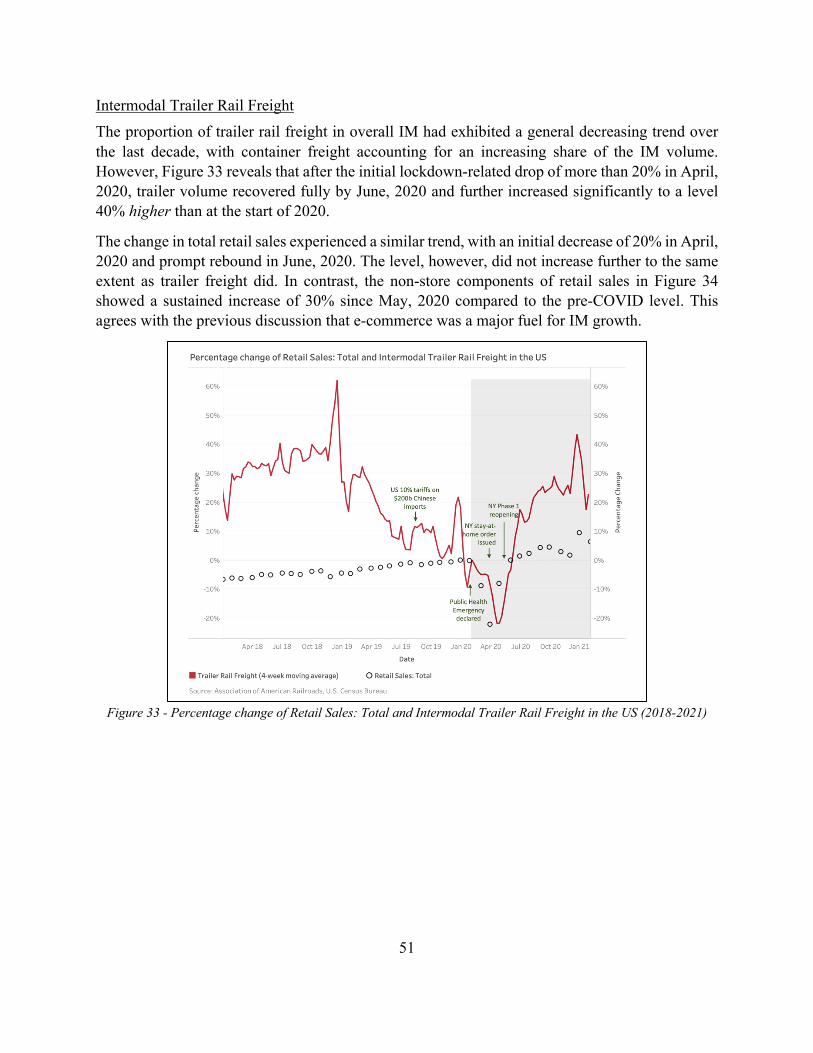
51
Intermodal Trailer Rail Freight The proportion of trailer rail freight in overall IM had exhibited a general decreasing trend over the last decade, with container freight accounting for an increasing share of the IM volume. However, Figure 33 reveals that after the initial lockdown-related drop of more than 20% in April, 2020, trailer volume recovered fully by June, 2020 and further increased significantly to a level 40% higher than at the start of 2020.
The change in total retail sales experienced a similar trend, with an initial decrease of 20% in April, 2020 and prompt rebound in June, 2020. The level, however, did not increase further to the same extent as trailer freight did. In contrast, the non-store components of retail sales in Figure 34 showed a sustained increase of 30% since May, 2020 compared to the pre-COVID level. This agrees with the previous discussion that e-commerce was a major fuel for IM growth.
Figure 33 - Percentage change of Retail Sales: Total and Intermodal Trailer Rail Freight in the US (2018-2021)

52
Figure 34 - Percentage change of Retail Sales: Nonstore Retailers and Intermodal Trailer Rail Freight in the US
(2018-2021)

53
Appendix B
Methods and Further Results of Time Series Model in Section 3
B.1 Methodology
The variations of economic indicators and rail freight are seasonal, more precisely yearly. To capture this seasonality, the technique of Seasonal Autoregressive Integrated Moving Average (SARIMA) was adopted. Time series models of economic indicators were constructed for covariates in the main time series analysis of rail freight.
The time series analysis in this study used the Seasonal AutoRegressive Integrated Moving Average with eXogenous regressors model (SARIMAX) class of the Time Series Analysis by State Space Methods (tsa.statespace) in the statsmodels Python module.31
The augmented Dicky-Fuller (ADF) test was first conducted to reject the non-stationary assumption, followed by autocorrelation function (ACF) and partial autocorrelation function (PACF) to determine employing autoregressive (AR), differencing (I), and/or moving average (MA) models in each case.
The economic indicators as covariates were entered in the models of rail freight as exogenous variables. Model parameters were judiciously selected among various combinations of AR, I, and/or MA models with respect to the characteristics of the time series and quality of fitting. Log transformation was carried out on data with similar considerations.
The weekly rail freight data were downsampled to monthly by taking averages to adjust to the availability of economic indicators and maintain consistency of occurrences of seasonal fluctuations across years. Therefore, the rail freight shown is the average weekly carloads or intermodal units in a month. Seasonal variations of data not seasonally adjusted were identified as annual values, so the number of time steps equals 12.
Among various tests to gauge the suitability of models carried out, the Ljung–Box test was used to reject the null hypothesis of uncorrelated residuals, while the Jarque–Bera test provided a reference to assess the normality of the residuals. The exogenous variables, AR, and MA coefficients were also examined with reference to the p-values for statistical significance.
Scenarios A and B shared the same time series model parameters, as their difference was adjusting the economic indicator prediction from January to June, 2021 to match the actual level as of December, 2020 for the latter (Table 2).
31 Skipper Seabold and Josef Perktold, “Statsmodels: Econometric and Statistical Modeling with Python,” in 9th Python in Science Conference, 2010.

54
The following shows further analysis of time series models on carload freight.
B.2 Coal Rail Freight
Figure 35 – Time Series Model for Industrial Production (IP): Total Index (2018-2021)
Figure 35 shows Total Index of Industrial Production, not seasonally adjusted (N.S.A.), using a seasonal time series model to account for the seasonality. In April, 2020, actual IP dropped by 15% below the would-be level of Scenario A, depicting the impact of the initial lockdown, and did not recover fully in the year.
Scenarios A and B predicted relatively constant levels of IP in 2021. Scenario A would serve as the highest baseline for gauging if IP would return to the previous normal trend. Scenario B shifted the previous trend to the level of December, 2020, continuing pre-pandemic development based on post-pandemic level. Scenario C, as a hypothetical model taking into account the influence of 2020, demonstrated the lowest level in 2021 among all scenarios, as it assumed the economy would suffer an external shock again.
Incorporating the output from the IP estimate, Figure 36 illustrated similar trends of coal rail freight. Actual rail freight was 25% below Scenario A in May, 2020 and remained 10% below at the end of the year.

55
Figure 36 – Time Series Model for Average Weekly Coal Rail Freight based on Industrial Production (IP) (2018-
2021)
Although Scenario A, extending the past trend before COVID-19 onwards, was a possible higher baseline for recovery of energy usage from industrial activities and hence coal consumption, Scenario B, which adjusted the production to the level of December 2020, marked a more likely movement, accounting for both prevailing decline of coal freight and the reduction in energy usage in 2020. As Scenarios A and B were based on the past trends of coal freight in 2012-2019, any factors which could contribute to a faster shift of energy usage and production mode, such as a swifter switch to renewable energy, would lead to levels below the scenarios. Lastly, Scenario C, which would suggest a further decrease in coal production due to possible lockdown, provided the lowest baseline.
B.3 Motor Vehicles and Equipment Rail Freight
Rail freight of motor vehicles and equipment was modeled with the demand-side economic indicator of Real PCE - Durable Goods as a covariate in Figure 37.
The initial lockdown in the early phase of the pandemic caused the rail freight to fall by more than 80% compared to Scenario A with no pandemic effect. However, it returned to the Scenario A level within three months and followed a similar trend until the end of the year.

56
Figure 37 – Time Series Model for Average Weekly Motor Vehicles and Equipment Rail Freight based on Domestic
Auto Production (2018-2021)
In 2021, both Scenario A and Scenario B showed a similar trend, which would also be close to the pre-COVID level. Scenario B predicts the highest level in 2021 among the three scenarios, as it assumes the previous growth in purchase pattern would meet with the high level at the end of 2020. Scenario C would follow the assumption of a recurring trend in the disruption and rebound in 2020.

57
Appendix C
Industry Leaders Interviewed
Jeffrey Amble, Senior Logistics Manager, Transportation Sourcing, Target Farrukh Bezar, Senior Vice President & Chief Strategy Officer, CSX Transportation Shaun Bunch, Senior Vice President Operations, Transportation & Inventory Planning, Northern Tool & Equipment Pat Casey, former Vice President Fleet Management, TTX Dick Craig, Vice President, Business Development, NACPAC Jim Filter, Senior Vice President & General Manager, Intermodal, Schneider David Horwitz, Vice President & Executive Director, Fleet Portfolio Management, GATX Ryan Houfek, Chief Marketing Officer, Direct ChassisLink, Inc. Eric Marchetto, Senior Vice President & Chief Financial Officer, Trinity Industries, Inc. Rob Martinez, Vice President, Business Development, Norfolk Southern Roger Nober, Executive Vice President, Chief Legal Officer, BNSF Railway Mike O’Malley, Senior Vice President, Government & Public Relations, Direct ChassisLink, Inc. Jon Panzer, Senior Vice President, Technology & Strategy Planning, Union Pacific Alex Ramos, Senior Director First Mile Transportation, Target Gene Seroka, Executive Director, Port of Los Angeles Benton Walker, Vice President, Rail Relations, J.B. Hunt Transport, Inc. Mike Wells, Senior Vice President Operations, Direct ChassisLink, Inc. Peter Wolff, Director, Market Development, TTX Phil Yeager, President & Chief Operating Officer, Hub Group Sr. Director, Transportation Sourcing & Procurement, large omni-channel retailer (anonymous)
