the us presidents’ example: an anthropomorphic explanation ... · in this paper we have developed...
TRANSCRIPT

Scientia Chromatographica 2014; 6(1):50-64Instituto Internacional de Cromatografiahttp://dx.doi.org/10.4322/sc.2014.020ISSN 1984-4433
GC×GC/MS
50 Scientia Chromatographica 2014; 6(1)
Jean-Marie D. Dimandja1,2* Samuel R. Redmond3 Chase A. Thompson4 Peter J. Hesketh2,4
1Department of Chemistry and Biochemistry, Spelman College Atlanta, GA (USA)2Institute for Bioengineering and Bioscience, Georgia Institute of Technology, Atlanta, GA (USA)3Menlo School, Atherton, CA (USA)4School of Mechanical Engineering, Georgia Institute of Technology, Atlanta, GA (USA)
*Author to whom correspondence should be addressed.
Received: October 23, 2013Accepted: December 21, 2013
The US Presidents’ Example: An Anthropomorphic Explanation of Comprehensive Two-Dimensional Gas Chromatography with Mass Spectrometric Detection (GCxGC/MS)
AbstractIn this paper we have developed an analogy to gas chromatography and mass spectrometry in order to explain the key concepts in the use of comprehensive two-dimensional chromatography with mass spectrometry detection (GCxGC/MS). The analogy makes use of the “separation” technique called namography and the “identification” technique called alphabetography to separate individual components from complex mixtures of human names. An example involving the use of the 44 US presidents is used. Software was also developed to provide an interactive platform where students and other interested users can create their own signals to and test their own complex name samples.
Keywords: Namography, Alphabetography, GCxGC/MS.
Manuscript submitted to Scientia Chromatographica for the special issue honoring Prof. Harold M. McNair.

Anthropomorphic Explanation of GCxGC/MS Dimandja JMD et al.
Scientia Chromatographica 2014; 6(1):50-64 51
1. IntroductionProfessor Harold M. McNair has been at the
forefront of the development of gas chromatography (GC) since its humble beginnings as a novel analytical instrument in the late 1950s, and has been an enthusiastic mentor to generations of practitioners around the world for the past 6 decades through countless workshop lectures that he has organized at conferences such as PittCon, ACS, and COLACRO. His many technical contributions have been reported in the peer-reviewed literature, and his overviews of the state-of-the-art in GC instrumentation and application development have recently been updated in his book entitled “Basic Gas Chromatography”[1]. As a conscientious educator, Prof. McNair has always put a lot of effort to incorporate the latest audio/visual technology to allow his course participants to access his lecture material after attending the workshop in person, and this technology has evolved over the years from the use of VCR tapes in the 1970s and 1980s to the use of electronic material that can be accessed or downloaded from websites since the advent of the internet in the early 1990s[2,3].
In this contribution to Prof. McNair’s 80th birthday, we report the development of educational materials that we have designed to accompany our introductory workshops on the emerging technology of comprehensive two-dimensional gas chromatography (GCxGC). GCxGC is an exciting high-resolution separation science technology that was patented in the laboratory of the late Prof. John B. Phillips in 1991[4], and whose scope has gradually increased in the past decade with the first generation of commercially available instruments. Advances in GCxGC instrumentation and applications have appeared in nearly 1000 peer-reviewed journal articles, and a few books have been published that present some exciting analyses for a variety of application areas that range from industrial QA/QC methods (petroleum, food and fragrance, metabolomics) to government regulatory protocols (environmental monitoring, biomonitoring)[4-13]. A clear understanding of GCxGC concepts is needed by a growing number
of scientists inside and outside of the field. It is within this context that we have worked on an analogy (with accompanying software) that surveys some key concepts of GCxGC within the scope of GC-based instruments. Mass spectrometry (MS) detection is also highlighted as a suitable technology to interface with GCxGC for the enhanced analysis of complex mixtures.
Analogical reasoning is ubiquitous to human cognition, and the use of analogies in teaching is a well established pedagogical tool[14]. The goal of analogical teaching is to establish bridges between concepts in a familiar domain (analog or source concepts) and the concepts in an unfamiliar domain (target concepts). The basic intuition behind analogical reasoning is that when there are substantial parallels between the analog and target concepts, there are likely to be further parallels. Well known scientific analogies include the electricity/water flow example in physics, the molecular motion/ billiards ball collision example in chemistry, the heart/car engine example in medicine, where the analog concepts serve as mental models to support the reasoning/connectivity of the concepts in the target domain. Research-based models for scientific analogies have been developed[14] that involve the following guidelines to foster understanding and minimize misconceptions: 1) Introduction of the target concept, 2) Review of the analog concept, 3) Identification of the relevant features between the analog and the target concepts, 4) Mapping of the similarities between analog and target concepts, 5) Identification of the limits beyond which the analogy breaks down, and 6) Conclusions and feedback.
The premise for the anthropomorphic analogy of GCxGC/MS that was chosen for this work is illustrated in Figure 1. Anthropomorphic analogies involve the transfer of human attributes to non-human phenomena. The use of anthropomorphism in scientific teaching strategies offers the advantage that analog concepts are typically well understood, making it easier to establish connections to the target concepts of interest[15]. Chemical compounds are similar to

Dimandja JMD et al. Anthropomorphic Explanation of GCxGC/MS
52 Scientia Chromatographica 2014; 6(1):50-64
Figure 1. Conceptual representation of the GC-MS/ namography-alphabetography analogy.
human beings in the sense that they possess a unique set of defining characteristics (properties) such as their names, identification numbers, heights, shapes, etc. We define two analytical techniques: namography, which is analogous to GC, and alphabetography, which is analogous to MS. In namography, a mixture of names is sent through a “name separator” that filters the names through the system on the basis of the number of letters in the name. In alphabetography, a mixture of letters in a name are sent through a “letter sorter” that generates an alphabet histogram. Namograms are signals that intend to produce one peak per compound, whereas alphabetograms produce a series of peaks in
the alphabet “spectrum” that are related to a given name (compound). The relative intensities of the ensemble of peaks in the alphabetogram can be used as a fingerprint that can be used for the unique identification of the name. Even though the process of differential migration (solute/stationary phase interaction) is not explicitly defined in namography, the result of the separation process is analogized. Likewise, in alphabetography the ionization process and the generation of molecular ions and fragments are not explained, but the idea of a single compound being broken down into a set of signals that provide information on the structural relationships in that compound are retained in the analogy.

Anthropomorphic Explanation of GCxGC/MS Dimandja JMD et al.
Scientia Chromatographica 2014; 6(1):50-64 53
In the alphabetography diagram (Figure 2B), the analyzer is represented as a letter sorter. The letters in a person’s name are broken up into their individual letters, and sorted according to their position in the alphabet. The resulting signal is a profile of the person’s name in the alphabet (x-axis) in terms of the relative abundance of the letters (y-axis) present in the name. The alphabetogram is a multi-channel detection device, in contrast to the single-channel FID that does not sort the letters but only detects the number of letter that pass through it at a given time determined by the name length.
The two-dimensional namography instrument with alphabetography detection is illustrated in Figure 2C. The two dimensional namogram assembles two separation mechanisms, and names are separated on the basis of their last name in the primary column, and then separated on the basis of their first name in the secondary column. The detection signal produced by this arrangement is a three-dimensional surface plot in which the last name length is displayed in the x-axis, the first name length is displayed in the y-axis, and the person’s height is displayed in the z-axis. The plot can also be viewed in the contour format, where the signal information from the surface plot is projected onto a 2D plane (as shown in Figure 2C) and the peak height is recorded by the color intensity. The alphabetography information is typically not visually displayed because plots that involve more than three dimensions are not as easily displayable. However, the alphabet profile information is available for further analysis.
2.3. Data Processing SoftwareThe basic flow chart of the software that was
developed for this project is shown in Figure 3A. The required input data for the program is the first and last name and the height. The data is then processed according to the following parameters: 1) name length of the first name, 2) name length of the last name, 3) a string concatenation of the first and last name, 4) the generation of the alphabet histogram on the basis of the concatenated name string, 5) the normalization of the
The goal of the namography/alphabetography combination is thus the full separation and identification of all the names in a given name mixture. In this paper we focus on the US presidents as a model sample to present several key concepts such as the impact of stationary phase on the elution order and the co-elution problem in GC, mass spectral deconvolution and mass spectral similarity matching in MS, as well as ordered structuring and resolution enhancement in GCxGC.
2. Experimental
2.1. SamplesA list 50 names (and their respective heights in
centimeters) was obtained from a number of internet sites and reference books[16-18]. The names include the 44 US presidents, which are shown in Table 1. In addition, the names and heights of the presidential contenders in each of the last four elections were also obtained from the same website. These additional names are: Albert Gore from the 2000 election (185 cm), John Kerry from the 2004 election (193 cm), John McCain from the 2008 election (175 cm), and Willard Romney from the 2012 election (188 cm). A couple of vice-presidential candidates from the 2000 election were also included in the project: Richard Cheney (173 cm) and Joseph Lieberman (175 cm).
2.2. Sample AnalysisConceptual diagrams of the namography and
alphabetography techniques are shown in Figure 2. In the namography diagram (Figure 2A), the analyzer is represented as a capillary column that sorts the components of a mixture of different peoples’s names on the basis of the length of the name. The resulting signal is a plot of name length (x-axis) versus person’s height (y-axis). It is implied that the length of the name is related to the time it takes for the compound to go through the system (its retention time). The detector is called a feature identification device (FID) that functions as a single-channel sensor is a manner similar to flame ionization detectors in GC.

Dimandja JMD et al. Anthropomorphic Explanation of GCxGC/MS
54 Scientia Chromatographica 2014; 6(1):50-64
Table 1. List of Names Used in this Project.
Last Name First Name Height (cm)
1 Washington George President, 1789-1797 1872 Adams John President, 1791-1801 1703 Jefferson Thomas President, 1801-1809 1894 Madison James President, 1809-1817 1635 Monroe James President, 1817-1825 1836 Adams John President, 1825-1829 1717 Jackson Andrew President, 1829-1837 1858 Van Buren Martin President, 1837-1841 1689 Harrison William President, 1841 17310 Tyler John President, 1841-1845 17011 Polk James President, 1845-1849 17312 Taylor Zachary President, 1849-1850 17313 Fillmore Millard President, 1850-1853 17514 Pierce Franklin President, 1853-1857 17815 Buchanan James President, 1857-1861 18316 Lincoln Abraham President, 1861-1865 19417 Johnson Andrew President, 1865-1869 17818 Grant Ulysses President, 1869-1877 17319 Hayes Rutherford President, 1877-1881 17420 Garfield James President, 1881 18321 Arthur Chester President, 1881-1885 18322 Cleveland Grover President, 1885-1889 18023 Harrison Benjamin President, 1889-1893 16824 Cleveland Grover President, 1893-1897 18025 McKinley William President, 1897-1901 17026 Roosevelt Theodore President, 1901-1909 17827 Taft William President, 1909-1913 18328 Wilson Woodrow President, 1913-1921 18029 Harding Warren President, 1921-1923 18330 Coolidge Calvin President, 1923-1929 17831 Hoover Herbert President, 1929-1933 18232 Roosevelt Franklin President, 1933-1945 18833 Truman Harry President, 1945-1953 17534 Eisenhower Dwight President, 1953-1961 17935 Kennedy John President, 1961-1963 18336 Johnson Lyndon President, 1963-1969 19337 Nixon Richard President, 1969-1974 18238 Ford Gerald President, 1974-1977 18339 Carter James President, 1977-1981 17740 Reagan Ronald President, 1981-1989 18541 Bush George President, 1989-1993 18842 Clinton William President, 1993-2001 18843 Bush George President, 2001-2009 18244 Obama Barack President, 2009- to date 18545 Romney Willard 2012 Presidential Candidate 18846 McCain John 2008 Presidential Candidate 17547 Kerry John 2004 Presidential Candidate 19348 Gore Albert 2000 Presidential Candidate 18549 Cheney Richard 2000 Vice-Presidential Candidate 17350 Lieberman Joseph 2000 Vice-Presidential Candidate 175

Anthropomorphic Explanation of GCxGC/MS Dimandja JMD et al.
Scientia Chromatographica 2014; 6(1):50-64 55
Figure 2. A. Namography system. B. Alphabetography system. C. 2D-Namography/Alphabetography system.

Dimandja JMD et al. Anthropomorphic Explanation of GCxGC/MS
56 Scientia Chromatographica 2014; 6(1):50-64
Figure 3. A. Overview of software program design. B. Matlab GUI of the program.

Anthropomorphic Explanation of GCxGC/MS Dimandja JMD et al.
Scientia Chromatographica 2014; 6(1):50-64 57
6.1. Single Compound AnalysisAn application of the namography and
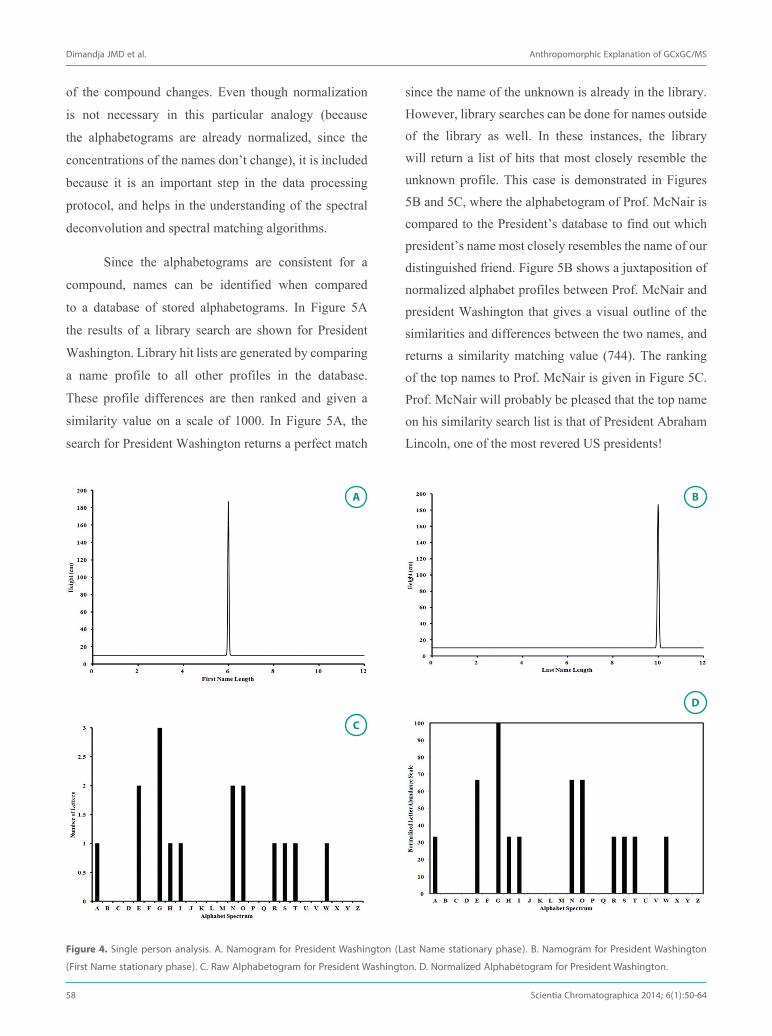
alphabetography techniques is demonstrated for a single person in Figure 4. A single person, representing a single compound, can be analyzed on several different namogram systems (or stationary phases) according to which “property” is selected for the analysis. In Figure 4A and 4B, President George Washington is analyzed on the basis of his first and last names, respectively, and the single peaks at position 6 (in Figure 4A) and position 10 (in Figure 4B) represent the specific interaction of those “properties” of his name with the “stationary phase” of the system. Even though all of the person’s properties are present, the stationary phase selectively interacts with the property of choice, which is a useful feature in chromatographic analysis.
Figure 4C shows the “raw” alphabetogram of President Washington. The alphabetogram is the result of the sorting of all letters in both the first and last names because (like mass spectra) the signal profile it generates is consistent regardless of which namogram system is being used. Even though the original name cannot be reconstituted just from looking at the peak profile, the relative abundances of these letters in the name form a unique fingerprint that is different from others. Storage of this fingerprint in a database will allow for its identification in an unknown sample via the use of a mathematical algorithm that computes the relative distance of the spectral profile in the unknown to the spectral profile of the stored standard. In this manner, the spectrum that most resembles the unknown spectrum is identified, and the algorithm returns a degree of certainty of this match that is called a similarity value.
Figure 4D shows the normalized alphabetogram of the profile shown in Figure 4C, in which the peak with the largest abundance of letters in the profile is given a nominal value of 100, and the abundance of all the other peaks in the peak profile are recalculated according to their relative abundance to the peak maximum. Profile normalization is an important procedure that helps in generating consistent profiles when the concentration
alphabet histogram on the basis of the tallest peak in the profile. All processed data is stored in a database, where the information is available to be further processed for the output selection of the user’s choice. Data outputs include namogram signals (for a single name, a group of names, or two-dimensional plots), and alphabetogram signals (for a single name or a group of names). For alphabetogram profiles, a library searching algorithm was also developed that computes the Euclidian distance measurement of a given alphabet profile (or group of alphabetograms) to each entry in the database, and returns a similarity hit list that is analogous to library search reports produced in mass spectrometry. A deconvolution algorithm was also included for the separation of alphabetogram signals that are the product of co-eluting namogram peaks.
All basic functionalities were initially developed and tested in Excel (version 12, Microsoft, Redmond, USA). These functionalities were then subsequently transferred to programs in Matlab 8 (Mathworks, Natick, USA) and Python 2.7.1 (Python Software Foundation, Delaware, USA). Graphic user interfaces (GUIs) were developed in both platforms (the GUI for Matlab is shown in Figure 3B) for easy user interaction. The Matlab version was designed to produce an executable file to be available for installation and use on individual PC machines, whereas the Python program was developed to be used on an internet website.
3. Results and DiscussionThe approach to explain the connections between the
analog concepts of namography/alphabetography and the target concepts of GC/MS involved three target scenarios:
4. The analysis of a single person’s name: President George Washington (the first US president).
5. The analysis of a simple mixture of 2 names: the presidential candidates in the most recent US elections (since the year 2000).
6. The analysis of a complex mixture: the 44 US presidents.
Dimandja JMD et al. Anthropomorphic Explanation of GCxGC/MS
58 Scientia Chromatographica 2014; 6(1):50-64
of the compound changes. Even though normalization
is not necessary in this particular analogy (because
the alphabetograms are already normalized, since the
concentrations of the names don’t change), it is included
because it is an important step in the data processing
protocol, and helps in the understanding of the spectral
deconvolution and spectral matching algorithms.
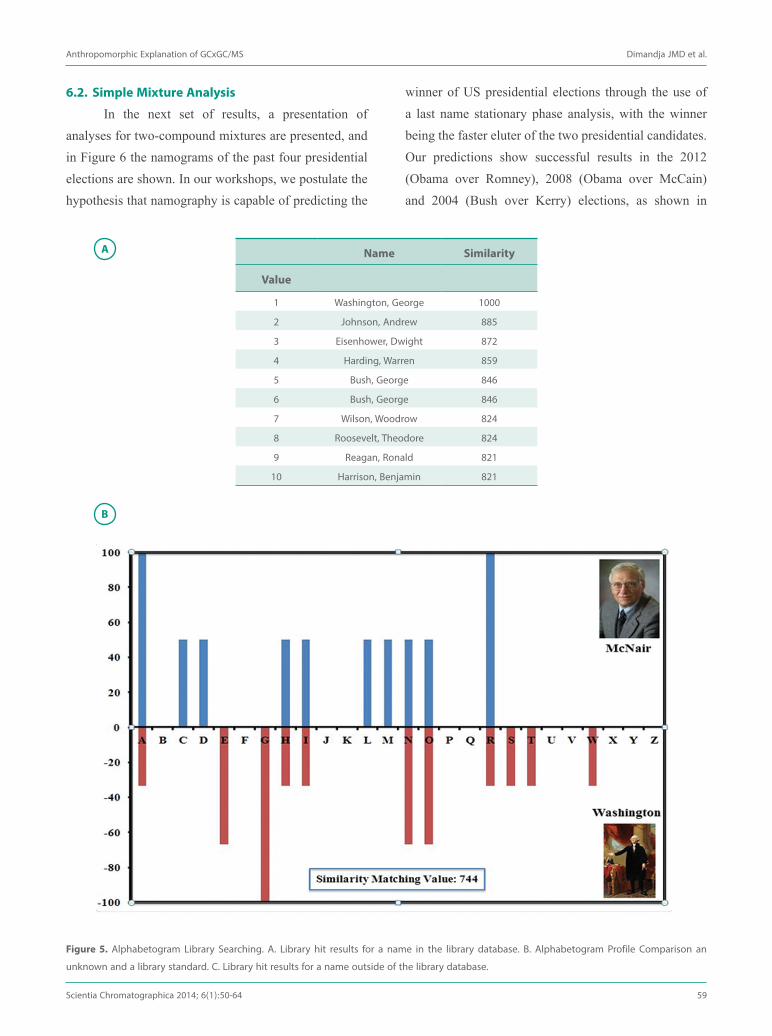
Since the alphabetograms are consistent for a
compound, names can be identified when compared
to a database of stored alphabetograms. In Figure 5A
the results of a library search are shown for President
Washington. Library hit lists are generated by comparing
a name profile to all other profiles in the database.
These profile differences are then ranked and given a
similarity value on a scale of 1000. In Figure 5A, the
search for President Washington returns a perfect match
since the name of the unknown is already in the library. However, library searches can be done for names outside of the library as well. In these instances, the library will return a list of hits that most closely resemble the unknown profile. This case is demonstrated in Figures 5B and 5C, where the alphabetogram of Prof. McNair is compared to the President’s database to find out which president’s name most closely resembles the name of our distinguished friend. Figure 5B shows a juxtaposition of normalized alphabet profiles between Prof. McNair and president Washington that gives a visual outline of the similarities and differences between the two names, and returns a similarity matching value (744). The ranking of the top names to Prof. McNair is given in Figure 5C. Prof. McNair will probably be pleased that the top name on his similarity search list is that of President Abraham Lincoln, one of the most revered US presidents!
Figure 4. Single person analysis. A. Namogram for President Washington (Last Name stationary phase). B. Namogram for President Washington (First Name stationary phase). C. Raw Alphabetogram for President Washington. D. Normalized Alphabetogram for President Washington.
Anthropomorphic Explanation of GCxGC/MS Dimandja JMD et al.
Scientia Chromatographica 2014; 6(1):50-64 59
Figure 5. Alphabetogram Library Searching. A. Library hit results for a name in the library database. B. Alphabetogram Profile Comparison an unknown and a library standard. C. Library hit results for a name outside of the library database.
Name Similarity
Value
1 Washington, George 1000
2 Johnson, Andrew 885
3 Eisenhower, Dwight 872
4 Harding, Warren 859
5 Bush, George 846
6 Bush, George 846
7 Wilson, Woodrow 824
8 Roosevelt, Theodore 824
9 Reagan, Ronald 821
10 Harrison, Benjamin 821
6.2. Simple Mixture AnalysisIn the next set of results, a presentation of
analyses for two-compound mixtures are presented, and in Figure 6 the namograms of the past four presidential elections are shown. In our workshops, we postulate the hypothesis that namography is capable of predicting the
winner of US presidential elections through the use of a last name stationary phase analysis, with the winner being the faster eluter of the two presidential candidates. Our predictions show successful results in the 2012 (Obama over Romney), 2008 (Obama over McCain) and 2004 (Bush over Kerry) elections, as shown in

Dimandja JMD et al. Anthropomorphic Explanation of GCxGC/MS
60 Scientia Chromatographica 2014; 6(1):50-64
Figure 6. Namograms for simple mixtures. A. 2012 presidential election. B. 2008 presidential election. C. 2004 presidential election. D. 2000 presidential election. E. 2000 vice-presidential candidates.
Figures 6A-C. The results for the 2000 election are more problematic (Figure 6D) due to the fact that the two names (Bush and Gore)cannot be separated due to the fact that the have the same name length. The 2000 election is an example of a co-elution problem, and the difficulty of this separation explains the challenge in the resolution of this particular election. One of the solutions to the separation of co-eluting compound pairs in GC is to change the stationary phase in order to change the
selectivity mechanism. However, in the case of these two candidates, a change to a first name stationary phase results in another co-elution since George (Bush) and Albert (Gore) both contain 6 letters. Even their middle names (Walker and Arnold) are not separable by name length. Since the presidential candidates co-elute in all the possible namogram systems, our solution to the election expanded to the vice-presidential candidates, as shown in Figure 6D. Since Cheney (Bush’s running mate) was

Anthropomorphic Explanation of GCxGC/MS Dimandja JMD et al.
Scientia Chromatographica 2014; 6(1):50-64 61
difficult it becomes for the deconvolution process to resolve all the co-eluted compounds, but the capability to distinguish compounds in this domain is a welcome advantage to the combination of the two techniques.
6.3. Complex Mixture AnalysisThe impact of co-elutions is further explored in
this section, and results are presented in Figure 8 for the separation of the sample of 44 US presidents. The 1D namograms by first and last name are overlayed to the surface plot in Figure 8A. These 1D namograms indicate a modest number of peaks resolved: 7 peaks for the first name separation (green) and 6 peaks for the last name separation (blue). A reasonable estimation of peak resolving power is the percentage of detected peaks relative to the number of sample components. This estimation can be done in this case because the total number of peak components is known, and provides a means for the comparison of different approaches to increase the resolving power of various separation strategies. The percentage of resolved peaks for the 1D namograms in Figure 8A are 15.9% and 13.6% for the first and last name respectively, and provides some insight into the resolution capabilities of one-dimensional separations that are consistent with results provided by chromatographic statistical overlap theory investigations[20,21].
One of the earlier methods to improve the resolution of a sample was the coupled-column (or tandem-column) technique[22], in which two-stationary phases are serially connected and sample components flow directly from the first stationary phase into the second stationary phase with no re-injection. Even though two stationary phases are utilized, this methodology is still a monodimensional separation technique because the two columns are not decoupled. The analogous setup in our example is a coupled namography system where the total name lengths (first and last name) are combined. The results of the coupled namogram system is able to increase the number of resolved names to 9 peaks (or 20.5% peak resolution). This separation represents an appreciable (albeit marginal) increase
a faster eluter than Lieberman (Gore’s running mate) an explanation if found as to how Bush eventually won the the 2000 election (It is important to note that while our presidential prediction hypothesis is valid in this limited sample of presidential elections, it cannot be generalized to all presidential elections).
This example underscores the point that sample complexity is not only related to the number of compounds in a mixture, but is also impacted by the dimensionality of the sample[19] which was defined by Giddings as the number of distinguishable functionalities in a molecule. If two compounds share a number of structural properties between (such as chemical enantiomers) they may be just as difficult to separate than a set of 30 compounds with very different properties. As a result, there are limits to which the separation technique can resolve certain types of samples even when a number of different stationary phases are considered, and solutions to differentiate between sample components may require the use of a more powerful detector than an FID.
The co-elution of the Bush/Gore namogram peak can be elucidated in the alphabetography domain through a process called deconvolution, as shown in Figure 7. The alphabetogram that is produced by the co-eluting compounds is the sum of the profiles of the individual names, as shown in Figure 7A. This combined profile is then searched through the library of alphabetograms, which finds the name most similar to the combined profile, as shown in Figure 7B. The fact that the similarity index is not 1000 is an indication that the name is not “pure” and is combined with an “interferent”. However, amongst the collection of names in the database, the profile of the co-eluents is still recognized as the closest to the combined profile. The top profile in the library is then subtracted from the combined alphabetogram, and the remaining profile is then re-analyzed in the library, the results of which produce a top hit for Gore with similarity index of 1000, signifying that all the compounds in the co-elution have been found. The more convoluted an alphabetogram profile is, the more

Dimandja JMD et al. Anthropomorphic Explanation of GCxGC/MS
62 Scientia Chromatographica 2014; 6(1):50-64
Name Similarity
Value
1 Bush, George 923
2 Bush, George 923
3 Hoover, Herbert 878
4 Roosevelt, Theodore 875
5 Washington, George 853
6 Hayes, Rutherford 846
7 Arthur, Chester 846
8 Cleveland, Grover 833
9 Cleveland, Grover 833
10 Grant, Ulysses 827
Figure 7. Deconvolution procedure outline. A. Convolution of alphabetograms for co-eluting names. B. Library hit search of the convolved alphabetogram.
in separation capacity of the system, and suggests that coupled-column techniques can be used to extend the separation capabilities of a 1D system. However, it must also be recognized that there are limits to the separation power of 1D techniques that call for an increase in the dimensionality of the analyzer.
The comprehensive two-dimensional approach is clearly shown in the contour plot in Figure 8B. Even though two-dimensional GC employs a coupled-column arrangement, it is different from tandem-column GC because the two columns are decoupled at the interface. Discrete injections (or modulations) of the primary column effluent are sequentially introduced into the secondary column to produce a series of discrete chromatograms. As a result, each compound in the mixture now has a pair of retention markers, and the combined effect of two separation mechanisms provides more separation space, as shown in the both surface plot (Figure 8A) and the expanded contour plot (Figure 8B). A substantial increase in the number of peaks (22 peaks, or 50% peak resolution) is observed from this combination. In addition, the separation character of the two individual

Anthropomorphic Explanation of GCxGC/MS Dimandja JMD et al.
Scientia Chromatographica 2014; 6(1):50-64 63
Figure 8. 2D Namogram of the 44 US presidents. A. Surface plot (with 1D projections and contour plot). B. Expanded contour plot.
Table 2. Overview of the Percentage of Resolved Peaks for 1D namography, coupled namography, and 2D namography.
Single-Channel Detector(FID)
Multi-Channel Detector (Alphabetography) with Deconvolution
Namography (First Name) 7/44 (16%) 18/44 (41%)
Namography (Last Name) 6/44 (14%) 13/44 (30%)
Coupled Namography 9/44 (20%) 21/44 (48%)
2D Namography 22/44 (50%) 41/44 (93%)
mechanisms is preserved. Seven columns and 6 rows of peaks can be counted in Figure 8B, which correspond to the respective numbers of peaks obtained in the 1D namograms that were combined. The structured nature of these separations is very important, because it means that the peaks are not randomly spread in the two-dimensional plane, and that a thorough understanding of the separation gradients at play may provide the analyst with some very useful clues in deciphering the identity of the peak on the basis of its location in the separation space.
Even though the 2D contour plot in Figure 8B shows a substantial increase in resolving power when compared to 1D separations, it also shows that there are still a number of co-elutions due to the complexity of the sample. In order to further increase the peak resolution the alphabetogram of the coeluted peaks were deconvolved using the reiterative procedure outlined in section 3.2. The results of the deconvolution for the 2D namogram are outlined in Table 2. These results show
a significant increase in the number of resolvable peaks when compared to single-channel (or FID) detection alone, and culminates in the resolution of over 90% of the names when using the 2D separation with multi-channel detection. The only 3 names that cannot be resolved in the 2D namogram/alphabetogram combination are names in the presidential list that appear in Table 1 more than once: John Adams (common name between the 2nd president and his son, the 6th president), George Bush (common name between the 41st president and his son, the 43rd president) and Grover Cleveland (the same person, but who appears twice on the list because he served non-consecutive 4-year terms as the 22nd and 24th president). Other samples have been used for this analogy besides the US presidents (names of the participants in our workshops, the names of the members of an academic department where a seminar is being presented, names of classroom students in a high-school or university setting, etc.), and the general trends reflected in Table 2 hold for sample sizes above 30 components.

Dimandja JMD et al. Anthropomorphic Explanation of GCxGC/MS
64 Scientia Chromatographica 2014; 6(1):50-64
and the question surrounding the minimum number of sample components beyond which a two-dimensional separation is a viable option could be worthy of further investigation. We intend to further refine/expand the analogy through interactions with interested users of the website software, which will hopefully help us to continue the fantastic teaching philosophies of Prof. Mc Nair.
AcknowledgementsThis work was supported by funding from
NIST (Grant 60NANB12D011), NSF and the NASA Astrobiology Program under the NSF Center for Chemical Evolution (Grant CHE-1004570).
7. ConclusionThis example provides a surprisingly good
number of opportunities to explain the concepts of gas chromatography, mass spectrometry and two-dimensional analysis. Like in many other analogies, some target concepts are not covered in the analog model. For instance, the chromatographic concepts of void time, peak band broadening, and analyte concentrations cannot be explained with this example. Likewise, the concept of molecular ions is not covered on the mass spectrometry side. However, some interesting questions regarding the potential need for additional chromatographic dimensions and their impact on the peak resolution can be addressed,
References1. H. M. McNair and J. M. Miller. Basic Gas Chromatography, 2nd edition, John Wiley & Sons, Inc., Hoboken (NJ, USA) (2009).
2. http://www.chromedia.org/, accessed October 2013.
3. http://www.youtube.com/watch?v=dffeiLgeKx8, accessed October 2013.
4. Z. Liu, J. B. Phillips, J.Chromatogr. Sci., 29 (6), 227-231 (1991).
5. J. V. Seeley, S. K. Seeley, Anal. Chem., 85 (2), 557-578 (2013).
6. J.-M. D. Dimandja, Anal. Chem., 76 (9), 167A-174A (2004).
7. A. Mostafa, M. Edwards, T. Górecki, J. Chromatogr. A, 1255 (1), 38-55.
8. R. C. Ong, P. J. Marriott, J. Chromatogr. Sci., 40 (5), 276-291.
9. J. B. Phillips, J. Beens, J. Chromatogr. A, 856 (1), 331-347.
10. J. B. Phillips, J. Xu, J. Chromatogr. A, 703 (1-2), 327-334.
11. Comprehensive Two-Dimensional Gas Chromatography, L. Ramos, ed. Elsevier, Amsterdam (The Netherlands) (2009).
12. Comprehensive Chromatography in Combination with Mass Spectrometry, L. Mondello, ed. John Wiley & Sons, Inc., Hoboken (NJ, USA) (2010).
13. F. Bertoncini, M. Courtiade-Tholance, D. Thiébaut. Gas Chromatography and 2D-Gas Chromatography for Petroleum Industry: The Race for Selectivity. Editions Technip, Paris (France) (2013).
14. S. M. Glynn, T. Takahashi, J. Res. Sci. Teach., 35, 1129-1149 (1998).
15. M. Kallery, D. Psillos, Res. Sci. Ed., 34, 291-311 (2004).
16. http://en.wikipedia.org/wiki/Heights_of_presidents_and_presidential_candidates_of_the_United_States, accessed October 2013.
17. P. M. Sommers, College Math. J., 33 (1), 14-16 (2002).
18. J. Kane, Facts about the Presidents: A Compilation of Biographical and Historical Information. H. W. Wilson, New York (NY, USA) (1993).
19. J. C. Giddings, J. Chromatogr. A., 703, 3-15 (1995).
20. J. M. Davis, J. C. Giddings, Anal. Chem., 55, 418-424 (1983).
21. J. M. Davis, D. R. Stoll, P. W. Carr, Anal. Chem., 80 (21), 8122-8134 (2008).
22. P. Sandra, F. David, M. Proot, G. Diricks, M. Verstappe, M. Verzele, J. High Resolut. Chromatogr., 8, 782-788 (1985).