the u.s. electricity industry after 20 years of restructuring · the u.s. electricity industry...
TRANSCRIPT
EI @ Haas WP 252R
The U.S. Electricity Industry after 20 Years of Restructuring
Severin Borenstein and James Bushnell
Revised May 2015
Energy Institute at Haas working papers are circulated for discussion and comment purposes. They have not been peer-reviewed or been subject to review by any editorial board. © 2014 by Severin Borenstein and James Bushnell. All rights reserved. Short sections of text, not to exceed two paragraphs, may be quoted without explicit permission provided that full credit is given to the source.
http://ei.haas.berkeley.edu
The U.S. Electricity Industry after 20 Years of Restructuring
By Severin Borenstein and James Bushnell∗
Prior to the 1990s, most electricity customers in the U.S. wereserved by regulated, vertically-integrated, monopoly utilities thathandled electricity generation, transmission, local distribution andbilling/collections. Regulators set retail electricity prices to allowthe utility to recover its prudently incurred costs, a process knownas cost-of-service regulation. During the 1990s, this model was dis-rupted in many states by “electricity restructuring,” a term usedto describe legal changes that allowed both non-utility generators tosell electricity to utilities – displacing the utility generation func-tion – and/or “retail service providers” to buy electricity from gen-erators and sell to end-use customers – displacing the utility pro-curement and billing functions. We review the original economicarguments for electricity restructuring, the potential winners andlosers from these changes, and what has actually happened in thesubsequent years. We argue that the greatest political motivationfor restructuring was rent shifting, not efficiency improvements,and that this explanation is supported by observed waxing and wan-ing of political enthusiasm for electricity reform. While electricityrestructuring has brought significant efficiency improvements ingeneration, it has generally been viewed as a disappointment be-cause the price-reduction promises made by some advocates werebased on politically-unsustainable rent transfers. In reality, theelectricity rate changes since restructuring have been driven moreby exogenous factors – such as generation technology advances andnatural gas price fluctuations – than by the effects of restructuring.We argue that a similar dynamic underpins the current politicalmomentum behind distributed generation (primarily rooftop solarPV) which remains costly from a societal viewpoint, but privatelyeconomic due to the rent transfers it enables.
∗ Email addresses: Borenstein: [email protected]; Bushnell: [email protected]. When citingthis paper, please use the following: Borenstein, S, Bushnell, JB. The U.S. Electricity Industry after 20 Years ofRestructuring. Annu. Rev. Econ. 7: Submitted. Doi: 10.1146/annureveconomics-080614-115630.
1
2
I. Introduction
In the mid-1990s, the great majority of electricity customers in the U.S. were served byan investor-owned, vertically-integrated monopoly utility (IOU) that provided generation,transmission, local distribution and billing/collections.1 IOUs were closely regulated bystate-level public service commissions under “cost-of-service” regulation, in which utilitieswere effectively guaranteed the recovery of prudently-incurred operating costs plus a reg-ulated return on capital expenditures. In the seven years between 1995 and 2002 a waveof major regulatory reform aimed at introducing competition in various utility functions –known broadly as “electricity restructuring” – transformed the industry.2 These changesfollowed closely on the heels of what was seen as the successful economic deregulation ofmany other industries, including airlines, railroads, telecommunications, gasoline retailing,and the production of oil and natural gas.
At the time, it was widely expected that this transformation would eventually lead theentire industry to a less-regulated and more market-based structure. Yet in the yearsfollowing 2002 – after the 2000-2001 electricity crisis in California’s restructured market –the movement for electricity deregulation encountered a significant backlash. While therewas some debate over “rolling back deregulation,” public policy after 2002 is more accuratelydescribed as a cessation of any further restructuring. For the last decade, the policy focusfor the electricity industry has turned elsewhere – mostly towards environmental concerns– and the loud debates from the early 2000s over the merits of restructuring have beenreduced to a background murmur.
The central premise of this paper is that views of restructuring in the electricity industryover the last two decades have been driven primarily by pursuit of quasi-rents that haveresulted from investments in generation capacity, power purchase agreements, and otherstrategies whose payoff is revealed over long time periods. These strategies create fluctu-ations in the relationship between the average cost and marginal cost of producing anddelivering electricity to consumers. Average cost is the basis for price setting under regu-lation, while marginal cost is the basis for pricing in a competitive market. During periodsin which these two costs have diverged, consumer and political sentiment has tilted towardwhichever regime (regulation or markets) offered the lowest prices at that time.
The relationship between average and marginal cost in the industry is in turn influencedby many factors. Some of these – such as productivity, level of investment, and the choiceof type of investment – are influenced by the transitional incentive problems attributed tocost-of-service regulation. Others are influenced by factors largely beyond the control ofstate utility commissioners. Two critical exogenous trends during this period have beentechnology innovations adapted from other sectors (such as aircraft engine technology thatchanged the design of gas turbines and semiconductor innovations that reduced the costof solar power) and trends in the prices of natural gas, which is generally the fuel setting
1More than 75% of end-use electricity was provided by IOUs. Most other customers received electricity frompublicly-owned municipal utilities or, in some rural areas, local cooperatives. See Energy Information Administration(1995).
2Throughout this paper we use the term “restructuring” to describe the suite of changes that impacted both theorganization of electricity firms and the methods by which those firms were regulated.

ELECTRICITY RESTRUCTURING 3
marginal costs in most electric systems.Thus, while the restructuring era dawned with great hope that regulatory innovations, and
the incentives provided by competition, would dramatically improve efficiency and greatlylower consumer costs, that hope was largely illusory. In fact, rates rose in both regulated andderegulated states, and more rapidly in the deregulated ones in the early years of reform.Subsequent studies of retail rates in both groups of states have generally overlooked thekey point that exogenous shocks to the industry often dominated the incremental benefitsthat regulatory reform can provide. There is clear evidence that competition has improvedefficiency at power plants and improved the coordination of operations across a formerlybalkanized power grid. But the impact of gas price movements and new technologies havehad a far larger impact.
We argue that many of the same incentive that created political momentum for restruc-turing 20 years ago are still present in the industry. One way they manifest today is in theincreasing focus on “distributed generation,” the term generally used for electricity gener-ation that takes place on the customer side of the meter and reduces the customer’s retailelectricity demand from the utility. While valid economic and technological arguments canbe made for and against an expanded role for distributed generation, transfers of quasi-rentsplay a major role in the policy positions.
In section 2 we review the expectations the drove the push for electricity restructuring inthe 1990s and how those beliefs shaped the market-based models for electricity markets ineach vertical component of the industry: generation, transmission, distribution and retail-ing. In section 3, we examine the evidence on what effect restructuring has actually had, aswell as the most common confusions that confound electricity restructuring with changes ininput costs and other factors. Section 4 looks ahead to the most pressing challenge the in-dustry will face in the coming years, the increasing role of renewable and intermittent energysources, both from utility-scale generation plants and from much smaller scale distributedgeneration at households and commercial customers. We conclude in section 5.
II. Theory and Implementation of Electricity Restructuring
One of the challenges for an analysis of electricity restructuring is that there are severalcompeting definitions of what restructuring or deregulation actually is. Outside the UnitedStates, a key step in electricity restructuring was the divestiture of the government-ownedassets that had comprised a nationalized power sector. In the United States, governmentownership was never the dominant form of organization and the exceptions in the U.S. –federally marketed hydro-electric power and municipally-owned generation and distributioncompanies – have remained largely unchanged during the restructuring era. Technically,wholesale electricity markets are still regulated by the Federal Energy Regulatory Commis-sion (FERC) under the authority granted by the 1938 Federal Power Act. The wave ofstate-level restructuring did not change this fact, although FERC has applied its authorityflexibly by allowing states and regions to set “market-based” rates. Such authority can berevoked, however, so it is inaccurate to label even wholesale markets in fully restructuredregions as “deregulated.”
In a market-based system for electricity provision, the industry is generally considered as
4
participating in four separate activities: generation of electricity, long-distance transmissionover high-voltage lines, voltage step-down (to the 110V common in the U.S. or 220V usedin Europe and elsewhere) and local distribution to end users, and retailing (marketing andresale of wholesale power) to end use customers. The last activity includes procurement ofpower under long-term contracts, rate setting, billing, and collection. The U.S. restructuringprocess was focused on generation, transmission and retailing. The local distribution linescontinued to be considered a natural monopoly that would be subject to either regulationor municipal ownership.
Changes to generation, transmission and retailing were pursued with varying levels ofcommitment in different parts of the country. Independent oversight and control of thetransmission networks was viewed by many as the backbone of restructuring, because trans-mission was critical to generators accessing a competitive wholesale market into which theycould sell and to retailers accessing competitive sellers from which they could buy. Re-structuring of generation resembled most closely the deregulation that had taken place inother industries, with free entry of unregulated electricity plants (known as “merchant”generators or independent power producers (IPPs)) that would live or die by their cost ofproduction and the price they could get for their output. Finally, retail restructuring, inthe limited areas it has taken hold in the U.S., has allowed non-utility companies to becomethe wholesale procurement entities for retail customers, offering customers alternative retailpricing structures, though across a rather limited spectrum as we discuss below.
In theory, at least, the three aspects of restructuring were closely intertwined. Withoutindependent oversight of transmission, a merchant electricity plant would be at the mercyof the local transmission owner, which could extract large shares of the quasi-rents availableonce the plant was built, thereby discouraging entry of competitive generation. Even withtransmission access, a merchant generator would be in a very weak position if there were onlyone retail electricity provider to which it could sell its output. A monopoly retail provider(a distribution utility) could still engage in competitive procurement, but that creates anarrower spectrum for competitive generation and it means that the monopoly retailer isthe single determinant of the range of products that might be procured for retail. Forinstance, the monopoly retailer might not pursue low-carbon sources even if there are manyretail customers who would be willing to pay a premium for greener energy. Thus, retailcompetition potentially makes competitive generation more viable. Likewise, competitivegeneration is central to the retailer being able to offer better procurement options, differentgeneration sources, or alternative billing mechanisms, which the retailer would likely wantto balance with the wholesale contracts it has with producers.
In practice, while pursuit of restructuring in the three activities has been regionally corre-lated, many areas have developed generation restructuring without retail competition. Andindependent transmission operators have taken over large swaths of the U.S. grid in whichboth generation and retail competition varies greatly.
A. Transmission Access Reforms
Transmission restructuring proceeded along two paths, a regulatory path that attemptedto impose rules upon vertically-integrated utilities that would promote third party access

ELECTRICITY RESTRUCTURING 5
to their networks, and an institutional path that encouraged the creation of IndependentSystem Operators (ISOs) and later Regional Transmission Organizations (RTOs).3 FERCattempted through a series of orders during the 1990s and 2000s to force the creation ofmore transparent online market places for available transmission capacity and to requirevertically integrated utilities to provide transmission service to third-party independentpower producers. These efforts have achieved at best mixed success.
The more successful path to nondiscriminatory grid access appears to have been the cre-ation of the RTO/ISO. These entities are organized as user-supported non-profit companiesand operate essentially as regulated entities overseen by FERC. In the U.S. these trans-mission companies do not own the transmission assets in their jurisdiction, but rather theycontrol access to those assets by virtue of approving, and in some cases setting, the pro-duction schedules of the power plants within their regions, as well as operating real-timebalancing markets that adjust supply as needed to maintain network reliability. In eachcase, the decisions made by the ISOs with regards to generation operations are dominatedby a mandate to respect the constraints of the transmission network and other reliabilityconsiderations. Unlike the vertically integrated network entities, ISOs have no generationassets or retail consumers, and are therefore credibly impartial as to specific market out-comes as long those outcomes do not threaten reliability.4
Initially the RTO/ISO model was largely restricted to markets undertaking the full suiteof restructuring steps described in this section. The full and unfettered access of disparatepower producers to the available population of electricity customers dictated an institutionalstructure that would eliminate concerns over vertical barriers. Conversely, jurisdictions thatwanted no part of retail competition were equally suspicious of the RTO/ISO structure asan initial step down the slippery slope to full restructuring. Thus, many municipal utilitiesand some of the largest and strongest integrated utilities, as well as the Federal MarketingAgencies, kept their transmission systems organized along traditional structures in whichthey directly controlled access and real-time use.
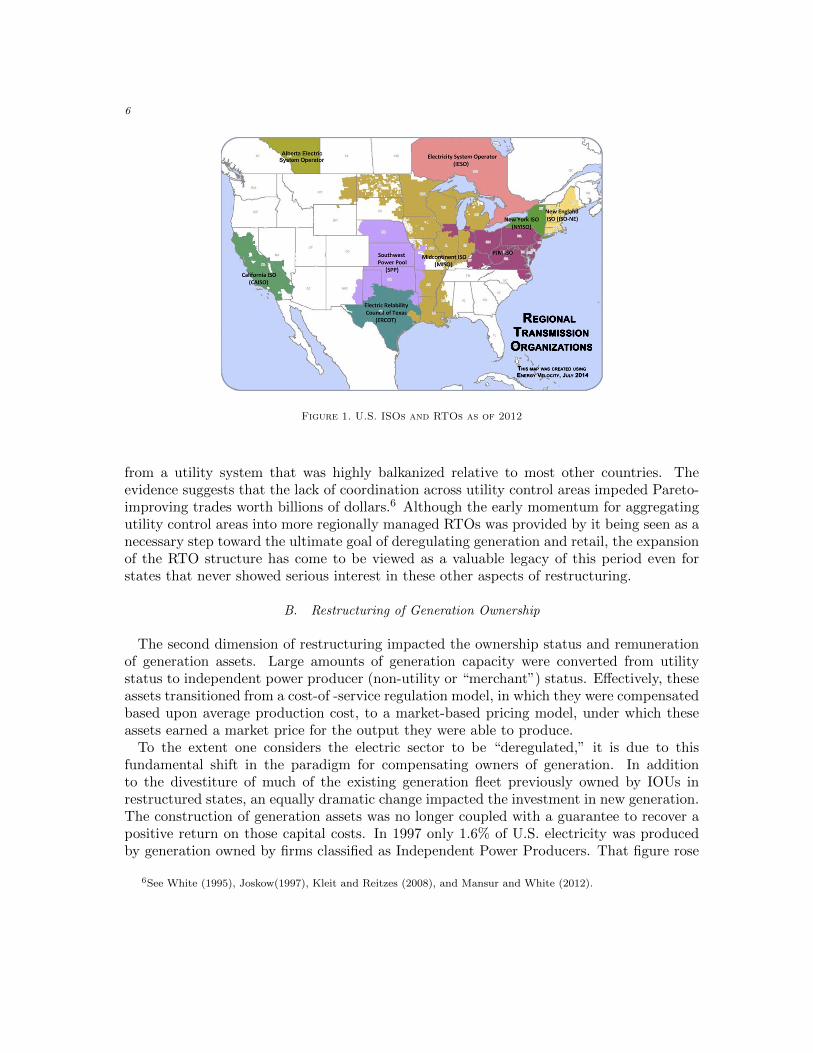
This changed in the latter half of the 2000s. As we discuss below, the pressures to restruc-ture other aspects of utility operations receded in many regions, so joining an RTO/ISOmarket no longer implied the inevitable dissolution of the traditional utility franchise. Atthe same time, the benefits of better coordination of operations and lowering of transactionscosts within ISOs appear to have been substantial.5 Figure 1 illustrates the geographic reachof North American ISOs and RTOs as of 2012. Currently, RTOs such as the MidcontinentIndependent System Operator, Southwest Power Pool, and PJM each contain several statesthat never seriously considered restructuring their generation or retail sectors.
The creation and expansion of the RTO/ISO model may be the single most unambiguoussuccess of the restructuring era in the United States. The U.S. has historically suffered
3Both types of organizations are tasked by FERC to coordinate investment and operations of regional power gridsin a non-discriminatory transparent manner.
4Indeed, RTO/ISOs have at times been criticized as being too exclusively focused on reliability and not sufficientlyconcerned with the costs their instructions and mandates place on the customers and generators operating withintheir systems. It is true that the performance of ISOs is generally measured in terms of the reliability of their systemsand the costs of the relatively narrow scope of operations directly housed within ISOs, rather than on the indirecteffects their decisions may have on productivity and prices.
5See Joskow (2006), Wolak (2011a), and Mansur and White (2012).
6
Figure 1. U.S. ISOs and RTOs as of 2012
from a utility system that was highly balkanized relative to most other countries. Theevidence suggests that the lack of coordination across utility control areas impeded Pareto-improving trades worth billions of dollars.6 Although the early momentum for aggregatingutility control areas into more regionally managed RTOs was provided by it being seen as anecessary step toward the ultimate goal of deregulating generation and retail, the expansionof the RTO structure has come to be viewed as a valuable legacy of this period even forstates that never showed serious interest in these other aspects of restructuring.
B. Restructuring of Generation Ownership
The second dimension of restructuring impacted the ownership status and remunerationof generation assets. Large amounts of generation capacity were converted from utilitystatus to independent power producer (non-utility or “merchant”) status. Effectively, theseassets transitioned from a cost-of -service regulation model, in which they were compensatedbased upon average production cost, to a market-based pricing model, under which theseassets earned a market price for the output they were able to produce.
To the extent one considers the electric sector to be “deregulated,” it is due to thisfundamental shift in the paradigm for compensating owners of generation. In additionto the divestiture of much of the existing generation fleet previously owned by IOUs inrestructured states, an equally dramatic change impacted the investment in new generation.The construction of generation assets was no longer coupled with a guarantee to recover apositive return on those capital costs. In 1997 only 1.6% of U.S. electricity was producedby generation owned by firms classified as Independent Power Producers. That figure rose
6See White (1995), Joskow(1997), Kleit and Reitzes (2008), and Mansur and White (2012).

ELECTRICITY RESTRUCTURING 7
to 25% by 2002 and was just under 35% in 2012. The share of nuclear generation owned byIPPs rose from zero in 1997 to almost 50% in 2012, as utilities sold off their nuclear assets.
Figure 2. Share of Output from Merchant Generators in 2012
Figure 2 displays the diversity of ownership patterns across the U.S. as of 2012 andillustrates the strong regional pattern of generation restructuring. The Southeast, with itslarge and regionally powerful IOUs, and much of the Pacific Northwest, with its dominanceof federally operated generation and municipal utilities, have largely resisted changes ingeneration ownership. Importantly these regions also enjoyed amongst the lowest averageretail rates in the country in 1997. The Northeast and Illinois have almost fully transitionedto a non-utility form of ownership, while Texas, California and Montana have also seen largeshares of IPPs.
As we will discuss below, we consider this dimension of restructuring to be the mosteconomically meaningful in its consequence. This is mainly because the majority of costsstill reside in the generation sector and the fact that the most potential variation in costsand prices resides in this sector.
Political attitudes toward the effects of restructuring during the last 20 years have alsobeen dominated by outcomes in the generation sector. These attitudes can largely becaptured by comparing average to marginal costs.
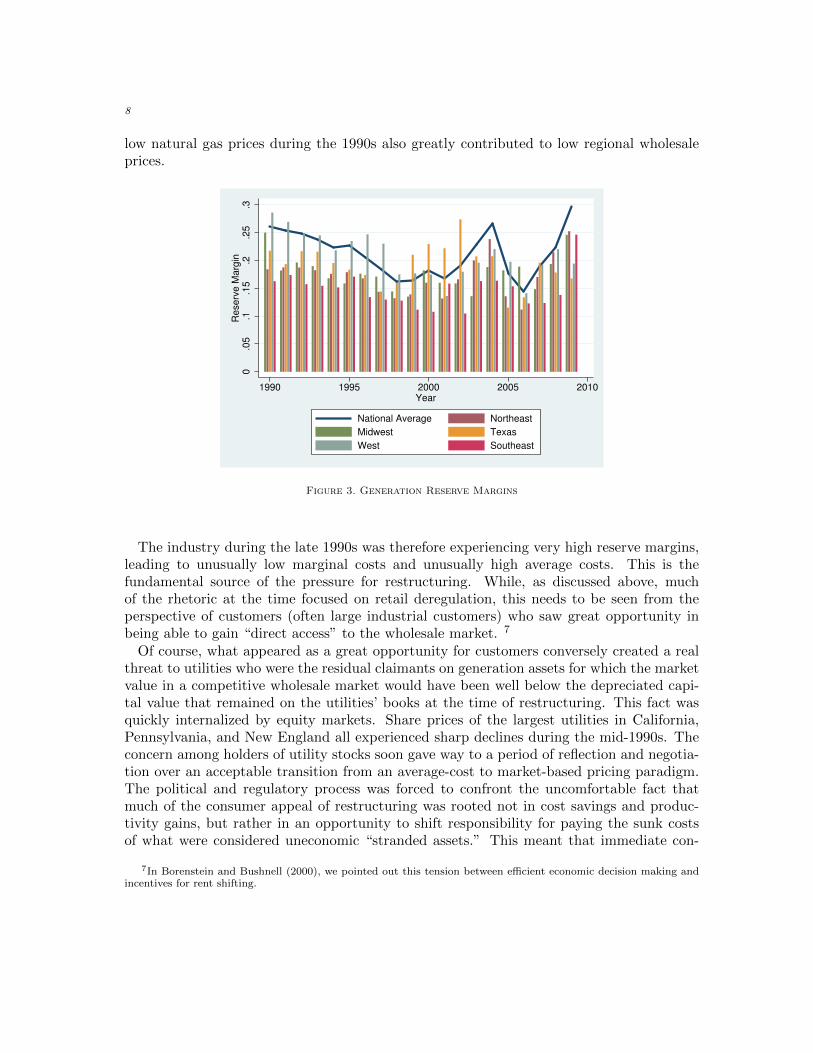
In the early 1990s, just prior to the initial years of restructuring, much of the countryexperienced large generation reserve margins (see Figure 3). Until the last few years (withthe rise of intermittent renewable generation), this statistic was a very good proxy for mea-suring the efficient deployment of capital. Larger reserve margins generally imply installedcapacity (and capital) that is underutilized. Lower utilization implies higher average costsas the capital expenditures are spread across a smaller consumer base. Lower utilizationrates also often implied that generation with relatively low marginal cost was often available,and marginal, thereby contributing to relatively low regional wholesale prices. Historically
8
low natural gas prices during the 1990s also greatly contributed to low regional wholesaleprices.
0.0
5.1
.15
.2.2
5.3
Re
se
rve
Ma
rgin
1990 1995 2000 2005 2010Year
National Average Northeast
Midwest Texas
West Southeast
Figure 3. Generation Reserve Margins
The industry during the late 1990s was therefore experiencing very high reserve margins,leading to unusually low marginal costs and unusually high average costs. This is thefundamental source of the pressure for restructuring. While, as discussed above, muchof the rhetoric at the time focused on retail deregulation, this needs to be seen from theperspective of customers (often large industrial customers) who saw great opportunity inbeing able to gain “direct access” to the wholesale market. 7
Of course, what appeared as a great opportunity for customers conversely created a realthreat to utilities who were the residual claimants on generation assets for which the marketvalue in a competitive wholesale market would have been well below the depreciated capi-tal value that remained on the utilities’ books at the time of restructuring. This fact wasquickly internalized by equity markets. Share prices of the largest utilities in California,Pennsylvania, and New England all experienced sharp declines during the mid-1990s. Theconcern among holders of utility stocks soon gave way to a period of reflection and negotia-tion over an acceptable transition from an average-cost to market-based pricing paradigm.The political and regulatory process was forced to confront the uncomfortable fact thatmuch of the consumer appeal of restructuring was rooted not in cost savings and produc-tivity gains, but rather in an opportunity to shift responsibility for paying the sunk costsof what were considered uneconomic “stranded assets.” This meant that immediate con-
7In Borenstein and Bushnell (2000), we pointed out this tension between efficient economic decision making andincentives for rent shifting.
ELECTRICITY RESTRUCTURING 9
sumer savings were largely dependent upon an equivalent reduction in returns for utilityshareholders. This is an important theme we will return to when we examine the currentrhetoric about the “utility of the future.”
In the end, utilities in all restructuring states persuaded regulators that the implicit agree-ment between the regulator and the IOU (commonly refered to as a “regulatory compact”)required that the utility be made whole for any lost asset value from restructuring. Nearlyall the generation assets with market value below the IOU’s remaining book value had beenbuilt with the approval, and in some cases mandate, of regulatory commissions,8 so it wasgenerally concluded that to force restructuring without compensation for stranded assetswould violate the regulatory compact. Most state restructuring schemes included a plan for100% recovery by utilities of any stranded investment and the others aimed at nearly 100%recovery.
The most common mechanism for recovering stranded cost was to allow a transition pe-riod in which portions of utility retail prices would be frozen at what were then consideredto be above-market rates during a transition period. Utilities would therefore be allowedto apply these excess retail margins to pay down the stranded costs on their divested andretained generation assets. This approach produced devastating consequences for Californiawhere the excess retail margins suddenly turned negative and caused the 2000-01 Californiaelectricity crisis.9 In order to avoid conflict between the goals of fostering retail competitionand recovery of stranded costs, these competition transition charges were generally appliedas surcharges to the bills of distribution companies who maintained a monopoly franchiseover the wires components of the business. Therefore, somewhat ironically, while the cus-tomer impetus that started electricity restructuring was a desire to avoid paying for highaverage costs during a period when marginal costs were lower, the transition charges largelyguaranteed that utilities recovered something close to those costs anyway.
C. Restructuring and Reform of Retail Services
The aspect of restructuring to receive the most rhetorical attention and market hype wasthe relaxing of the utility monopoly franchise over retailing. Phrases evoking liberty andfreedom, such as “customer choice” and “freedom to choose” were rhetorical staples of therestructuring process. There was also much hope that electricity retail competition mightspur innovation in retail services in the way that it had for telecommunications. Exactlyhow this was supposed to be achieved was never clear.10 Electricity service has proven tobe less amenable to the sorts of usage and complementary product innovation that wired
8In addition to generation assets operated by utilities, stranded assets in several states included uneconomic long-term contracts with IPPs that were mostly mandated by PUCs under the Public Utilities Regulatory Power Act of1978. See White (1996).
9Through a combination of real scarcity and generator market power (caused in part by high local natural gasprices that followed a pipeline explosion), California wholesale electricity prices skyrocketed in summer 2000 andremained extremely high into May of 2001. Under the competition transition plan, the two largest utilities in thestate were not allowed to raise retail rates to reflect the high wholesale prices. One of them, Pacific Gas & Electric, wasforced into bankruptcy and the other, Southern California Edison nearly followed. For detailed discussions of theseevents, see Joskow (2001), Blumstein, Friedman and Green (2002), Borenstein (2002), Wolak (2003b), and Bushnell(2004).
10See Joskow’s (2000) discussion of the potential for new product innovation under electricity restructuring.
10
telecom service experienced in the 1980s and 1990s. Perhaps this isn’t surprising giventhat the product is so narrow – just the electricity, not any devices that use it – and sohomogeneous. In order to use the grid, electricity must meet exact specifications that makeone provider’s product indistinguishable from another’s. The place where innovation didseem valuable and likely to occur with retail choice was in financial arrangements: priceschedules, payment plans, and options to bundle purchases with complementary products.
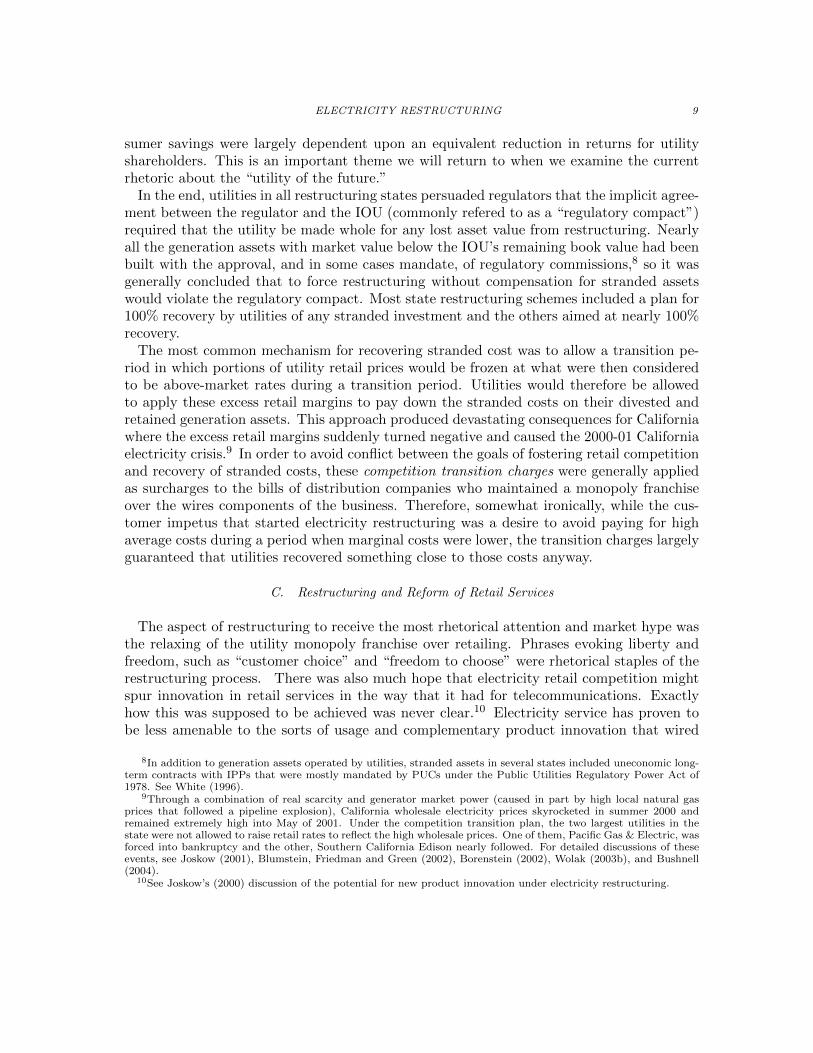
More concretely, retail restructuring involved giving customers access to new “energy-only” retail providers who produced or acquired wholesale power for sale to end users.The incumbent utility (and the grid operator) maintained a franchise over distributionand transmission related functions. In many cases the incumbent utility was allowed tocontinue to offer a default “bundled” retail rate for customers who did not switch retailers.11
Customers who did switch received a bill for “energy-only” service from the third-partyretailer they chose, and a separate charge, intended to recover transmission and distributionsystem investments made by the incumbent utility.
Figure 4. Share of Retail Sales from Retail Power Marketers
The extent to which this transformation has materialized has varied greatly around theU.S. Figure 4 illustrates the fraction of total sales in each state from entities with anownership classification of ’retail power marketer.’12 Texas has far outstripped the rest ofthe country on the retail competition front, with the only other significant activity clusteredin the Northeast.
11The bundled rate combined energy with the incumbent utility’s transmission, distribution and retailing charge.This was sometimes called the “default provider” or “provider of last resort” (or POLR) rate. In some states, thedefault provider franchisee is selected through auctions overseen by local regulators.
12These data are compiled from EIA form 861.

ELECTRICITY RESTRUCTURING 11
Retail Price Reform. — To understand the potential for efficiency improvements inpricing electricity, it helps to review the inefficiency concerns raised by the typical 1990selectricity retail tariff. Throughout most of the history of electric utilities, retail pricingpolicy has been driven more by equity than efficiency considerations. Because customershad little alternative to the monopoly utility provider, and the utility was focused on satis-fying the terms of cost-of-service regulation more than maximizing profits, there was littleinitiative to improve the efficiency of pricing. However, with greater competition and de-mand elasticity – from non-utility energy sources and retail suppliers, and more recentlyfrom improved opportunities to generate electricity on the customer side of the meter – thepressure to align prices with marginal costs has grown.
Efficient retail prices should reflect the short-run marginal cost in every hourly (or evenshorter) time period at every location on the grid. At the beginning of restructuring, nearlyall residential, commercial and industrial customers faced prices that did not vary hour tohour. Furthermore, utilities recovered nearly all of their costs through volumetric charges,including the substantial share of costs that are fixed with respect to a customer’s marginalconsumption. For most residential customers, the rate was a simple constant price perkilowatt-hour (kWh) consumed, regardless of when the energy was used, set to cover all theutility’s costs, variable and fixed.13
Setting price equal to short-run time-specific and location-specific marginal cost leads toefficient consumption given the level of investment, but only under a very narrow set ofconditions does it exactly cover total costs.14 In reality, there are almost certainly somecosts that scale less than proportionally with the total quantity sold, so efficient marginalpricing would result in a revenue shortfall.
A fixed charge can be used to capture the additional needed revenue. A fixed charge(per month, for instance) is particularly efficient in residential electricity markets becausethe elasticity of connecting to the grid with respect to the monthly fixed charge is likelynear zero over a wide range of charges. Thus, the deadweight loss that could result if somecustomers chose to consume zero because the fixed charge exceeds their consumer surplusis likely to be small.
For basically the same reason, however, the distributional consequences of a fixed chargeare of great concern. Moving from a flat volumetric rate and no fixed charge to a lower flatrate and a fixed charge is very regressive. Borenstein (2011) shows that such a revenue-neutral change to a higher fixed charge and lower volumetric rate would raise the averagebills of low-income customers by 69% to 92% of the fixed charge across the three largeinvestor-owned utilities in California. Equity notions often suggest that the fairest alloca-tion of such a revenue requirement would be in proportion to quantity consumed.15 Thatapproach, however, steers back towards average cost pricing and the inefficiencies that it isknown to produce.
The problem of average cost pricing is exacerbated in the electricity industry by the na-
13Borenstein and Holland (2007) show that the break-even flat price could be higher or lower than the second-bestoptimal flat rate, depending on whether peak or off-peak price elasticities are higher.
14Under constant returns to scale, optimal pricing covers costs if capacity is also set optimally. If capacity is greaterthan the optimum level, optimal pricing will generate less revenue than is needed to cover total costs.
15Or, if data were available, in proportion to consumer surplus gained by each customer.
12
ture of the contract between the retail provider and the customer. In nearly all cases, thecustomer has an option, but not an obligation, to purchase any quantity at the announcedprice, known in the industry as a “requirements contract.” This in itself wouldn’t be adestabalizing force if price adjusted quickly,16 but with long lags between cost changes andprice adjustment, this creates an opportunity for buyers to switch between alternative sup-pliers inefficiently. This is the same phenomenon as described earlier for the state decisionto deregulate, but manifest in contemporaneous customer choice among competing sources.The combination of requirements contracts and average-cost retail pricing could create in-creasing problems if distributed generation (“behind the meter”) continues to expand, aswe discuss below.
Thus, as restructuring began 20 years ago, retail pricing deviated considerably from theideal efficient structure. It seemed at least possible that competitive pressure on the existingstructure would lead to substantial changes in pricing, and the potential for differentiationamong the products retailers sold. The technological and market configuration, however,turned out to leave much less space for pricing innovation than was suggested at the time.
The principle technological constraint was metering: in the 1990s, virtually all residentialcustomers, and most commercial and industrial customers, had meters that recorded onlythe aggregate amount of electricity that had flowed through them. They did not have thecapability to collect information on when the electricity was consumed. This meant thattime-varying pricing wasn’t feasible without a significant investment in metering. Nor coulda retailer necessarily overcome this constraint just by metering its own customers, becausethe arrangements for billing and payments among retailers and the utility providing distri-bution services were generally not set up to accommodate time-varying pricing. Instead, inmost cases a retailer was deemed responsible for providing power to its customers – eithergenerating it, signing long-term contracts, or buying on the spot market – based on a stan-dard assumed “load shape” (a time-varying pattern of consumption) that was applied to allcustomers within broad location, customer type, and sometimes size, classes. The assumedload shape was independent of the prices the customer faced, so the retailer had no incentiveto charge time-varying prices. With the expansion of smart meters in the late 2000s, thegroundwork is now being laid for broader use of time-varying pricing, but the vast majorityof residential customers with non-utility retail providers still see no time-variation in theprices they pay. Commercial and industrial customers have experienced a much greatershift towards time-of-use pricing, which entails two or three different pre-set prices thatapply at different times of the week. TOU pricing, however, is known to capture a smallshare of the hourly variation in wholesale electricity prices.17
A second way in which retailers might have offered greater differentiation was in reliability,but this too was undermined by the structure of the retail markets that were established.Because the grid operator must always balance supply and demand to avoid service dis-ruptions, the grid operators in these markets procured enough reserves to make sure thatthe full expected demand could be met. If one retailer did not procure sufficient supplies
16In a sense, sellers in any commodity market operate under requirements contracts, at least over a large range ofpurchase quantity, but they can and do change prices rapidly as market conditions change.
17See Borenstein (2005).
ELECTRICITY RESTRUCTURING 13
to meet its retail demand obligation, the result was not reduced supply to the customersof that retailer – as would occur with nearly any other product. Instead, the grid operatordrew on its reserves to make sure all demand was met. The cost of those reserves was spreadover all retail quantities whether or not the provider to a particular customer ever causedthe grid operator to need those reserves. Reliability was assured by the grid operator andcharged to every kWh supplied, so there could be no differentiation on reliability. Alterna-tive arrangements – in which the customer either lost power when its supplier had procuredinsufficient quantities (which posed technological challenges along the same lines as real-time metering) or the retailer or customer were charged a very high fee for running short ofdelivered electricity – would have created a significant cost for insufficient supply and likelyled to greater product differentiation along these lines, but these weren’t widely adopted.The lack of retailer responsibility for reliability also undermines the incentive to implementprice-responsive demand, which could be a valuable tool for a retailer in balancing its supplyand demand while keeping costs down.
Reliability differentiation also could extend to the ramifications of exit by the retailer. Ifa retailer exits the market, what cost is borne by its customers? If customers can easilyswitch to another supplier at a pre-determined rate, then a similar moral hazard problemarises in which a retailer can procure short-term power at spot prices when that price is low,but exit if the spot price rises, leaving the customer to switch to some default rate. If thatdefault rate is a price that reflects average procurement costs over a longer period, then onceagain the variation in average versus marginal price drives behavior in the market. Enronand some other retail providers in California took this path when prices in the Californiawholesale market spiked in 2000. In Texas, which has the most extensive retail residentialcompetition (see figure 4), rules have been adjusted so that customers of a retail providerthat exits are moved, by default, to a tariff that reflects the contemporaneous marginal costof procuring power.
III. Electricity Market Performance Since Restructuring Began
Electricity restructuring’s most consequential economic changes took place on the whole-sale production and marketing sectors of the industry. We therefore begin by discussingthe evolution of the industry since 1997 at the wholesale level. As discussed above, formalcentralized markets only formed in the parts of the country that embraced the RTO/ISOstructure, which were also the areas with the highest prices and for which the average costexceeded marginal cost by the largest amount.
A. Wholesale Markets
The regions with RTO/ISOs are also the markets for which the best data on wholesaleprices are available. Figure 5 summarizes annual average prices from two data sources.For 1998 through 2001 we use data from Bushnell, Mansur and Saravia (2008), which aredrawn from ISO websites. For 2001 on, we report data from the Intercontinental Exchange(ICE) for trading hubs in Southern California (SP15), western Pennsylvania (PJM) Mas-sachusetts (ISO-NE) and the Pacific Northwest (Mid C) hubs. The dashed line in figure 5

14
summarizes the U.S. average city gate natural gas price, taken from the Energy InformationAdministration.
02
46
81
0N
at.
Ga
s (
$/M
CF
)
02
04
06
08
01
00
Ele
c.
Price
s (
$/M
Wh
)
1998 2000 2002 2004 2006 2008 2010 2012Year
New England So. California
West Penn. Pac. northwest
Natural Gas
1998−2000 are ISO hourly average prices. 2001−2013 are ICE peak power contracts.
Figure 5. Wholesale Electricity and Citygate Natural Gas Prices
Since 1998, two facts are worth noting. First, although somewhat muted by the annual ag-gregation in the data, the California market stands out as suffering from sustained extremelyhigh price levels during the 2000-2001 period. Both academic research and subsequent reg-ulatory findings have determined that this market suffered from a lack of competition madeacute by a combination of tightening capacity and a near total absence of forward contract-ing.18 Second, in the other markets wholesale power market prices are dominated by naturalgas prices, though somewhat less so in the Pacific Northwest. This is consistent with thegeneral fact that natural gas fired generation units are the marginal source of power in mostmarkets during most times, but the Pacific Northwest is influenced more by the availabilityof hydro-electric power.
Because gas generation comprises a minority share in most electricity markets, underaverage-cost based regulation it did not dominate rate making. Prices for deregulatedgeneration, however, are driven by the marginal producer, which is much more commonlygas generation. Thus to a degree that was not appreciated at the time, restructuring ofgeneration greatly increased the exposure of electricity rates to natural gas costs, even ifa fairly small share of electricity was sourced from gas-fired plants. As natural gas pricesnearly tripled during the first half of the 2000s, the impact on retail rates and the rentscreated for infra-marginal generation were far greater than they would have been under
18See Borenstein (2002), Borenstein, Bushnell and Wolak (2002), Joskow and Kahn (2002), Wolak (2003a), Bush-nell(2004) and Puller (2007).

ELECTRICITY RESTRUCTURING 15
regulation.
During 2006 and 2008 the U.S. natural gas price peaked above $11/MMBTU. The highergas prices drove up generation costs and power market prices. By this time, the relationshipbetween marginal and average costs of power production had again reversed so that marginalcost-based market prices were higher than the average costs of operating and producingfrom a mixed generation portfolio. Many of the nuclear and coal-fired power plants inrestructured states, which had been considered “stranded” assets in the late 1990s, wereby 2007 tremendously profitable due to their low operating costs and the relatively highmarket prices they earned for their output.
The combination of higher prices and healthy profits earned by power producers in restruc-tured states contributed to a strong dissatisfaction with restructuring in several states.19
This mood of ex-post regret in restructured states peaked in 2007-2008. States such asIllinois, Maryland and Maine initiated proceedings that were characterized as rolling backderegulation.20 After 2009, however, with plummeting natural gas prices and increasingreserve margins, momentum for significant changes dissipated.
B. Restructuring and Plant Operations
One aspect of restructuring that has been studied at a micro level has been its impacton the performance and efficiency of power plants. Overall the results point to a positiveinfluence of restructuring on the operations of plants. Unfortunately, while cost data onregulated plants are extensive, there is much less data available on the costs of non-utilitygeneration. Thus, studies of plant-level impacts of restructuring have either focused on itsimpact on regulated plants or were limited to a focus on the few performance variablesthat continue to be reported for deregulated plants. Fabrizio, Rose, and Wolfram (2007)compared the performance of regulated plants in states that pursued restructuring (by theEnergy Information Administration’s definition, which we discuss further below) againstregulated plants in states that did not initiate restructuring, and against publicly ownedplants in both types of states. They find modest efficiency gains in the restructured states,much of these focused on employment and labor productivity. There is some evidencethat the efficiency of fuel consumption, the largest single variable expense in power plants,can be influenced by incentives and skill,21 but to date the evidence on fuel efficiency atrestructured plants has been inconclusive.
The most dramatic documented impact of restructuring on power plant operations hasbeen on the performance of nuclear plants, shown by Davis and Wolfram (2012). Almosthalf of the nuclear generation plants in the U.S. were divested to non-utility producers since1998.22 Davis and Wolfram show that industrywide U.S. nuclear power plants have greatlyincreased capacity factors since 1998, but relative to their regulated counter-parts, outputat the restructured plants increased 10 percent between 1998 and 2010. They estimate this
19See Johnston (2007).20See Sharp (2007) and Behr (2009).21See Bushnell and Wolfram (2009)22Since 1998, no new nuclear plants have come online.

16
additional output has a market value of $2.5 billion dollars annually.23
C. Restructuring and Retail Prices
It is useful to begin a review of retail prices under deregulation by examining conditionsin 2007, when dissatisfaction with restructuring peaked. In 2007, the New York Times rana series of articles highlighting the fact that rates had risen faster in restructured statesthan in regulated ones. The articles cited studies that relied upon average retail price datareported to the Energy Information Administration and essentially performed a differencein difference comparison between restructured and non-restructured states.24
A central challenge in studies like this is to identify what constitutes “restructured” inorder to assign a state to one category or the other. Many papers have relied upon theEnergy Information Administration’s definition, which is focused on the status of retailcompetition. An alternative measure of restructured is based upon the fraction of energygenerated in a state that is produced by Independent Power Producers (IPP). Figure 2illustrates these values for 2012, but we can apply the full panel of values to capture theunderlying points of transition in each state.
As one examines recent data on retail rates, it is clear that many of the conditions of 2007have since dramatically reversed. Table 1 summarizes the average retail rates in states con-sidered “restructured” according to two alternative measures against those that remainedunder traditional regulation25 The first measure is the one used in a study by Showalter(2007) for Power in the Public Interest (PPI) that is cited in the NY Times article. Thisdefinition excludes from the restructured category states such as Illinois and Pennsylvaniawhich by 2012 have almost all of their energy provided from non-utility sources. As analternative measure, we assign states to the restructured category if they had more than40% of their energy provided by non-utility sources in 2012.26
From Table 1 one can see that at this level of analysis the definition of restructuredmakes only a small difference. The time period examined, however, makes an enormousdifference as rates in restructured states increased at a pace nearly 50% higher than thosein non-restructured states between 1997 and 2007 but have actually declined slightly since2007. Average rates in states that did not restructure have continued to increase since2007, though at a slightly lower pace than between 1998-2007. Overall there is almostno difference in the change in average rates for the two groups over the full sample from1998-2012.
Figure 6 illustrates the annual levels of rates in restructured and non-restructured statesusing our generation-based definition, along with the national average city gate natural gas
23Hausman (2014) concludes that the gains in utilization were not accompanied by degradation of safety amongderegulated plants.
24See Showalter (2007) and Tierney (2007).25Retail price data come from the EIA form 861, which report sales and revenues by utility. We examine the
average rate across all major rate categories, including residential, industrial and commercial. Several previousstudies, including Showalter (2007) and Apt (2005) have focused on rates paid by industrial customers.
26The NY Times article lists the restructured states as CA, CT, DC, DE, MA, MD, ME, MI, MT, NH, NJ, NY,RI, and TX. Our generation-based definition puts CA, CT, DE, IL, MA, MD, ME, MT, NH, NJ, OH, PA, NY, RI,TX, and VT into the restructured category.

ELECTRICITY RESTRUCTURING 17
Table 1—Summary of Retail Price Changes
Definition Status Average Retail Price Percent Change1997 2007 2012 97 to 07 07 to 12 98 to 12
PPI Definition Not Restructured 5.89 7.44 8.72 0.21 0.15 0.32Restructured 8.96 12.53 12.35 0.29 -0.01 0.27
At least 40% Not Restructured 5.67 7.23 8.57 0.22 0.16 0.34IPP in 2012 Restructured 8.83 11.99 11.95 0.26 0.00 0.26
price. Restructured states experienced higher rates during the 1990s, a major factor in theirelection to adopt restructuring. The gap between traditionally regulated and restructuredstates narrows around 1998, reflecting the impact of legislation that required immediate ratereductions accompany restructuring in several states. Since that time, rates in restructuredstates more closely follow the trajectory of gas prices up during the early 2000s and backdown since then.
02
46
81
01
2R
eta
il E
lectr
ic a
nd
Cityg
ate
Ga
s P
rice
1990 1995 2000 2005 2010Year
Non−restructured States Restructured States
Elec. Price Difference Natural Gas Price ($/MCF)
Figure 6. U.S. Average Retail Rates and Natural Gas Prices
To further test this relationship between natural gas prices, restructuring and electricityrates we estimate the following regression on state level annual changes in electricity pricesand city-gate natural gas prices.
(1) ∆Elecs,t = α+ β1FractionIPPs,t + β2∆NGass,t + β3FractionIPPs,t ∗ ∆NGs,t,
18
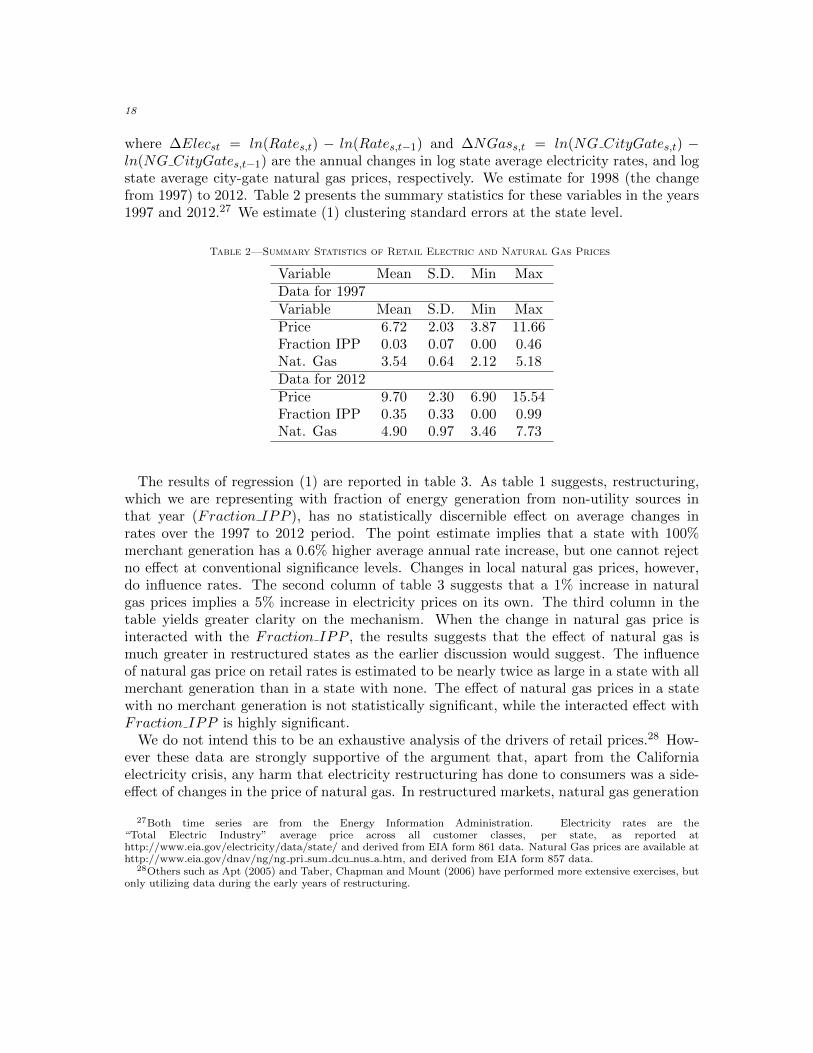
where ∆Elecst = ln(Rates,t) − ln(Rates,t−1) and ∆NGass,t = ln(NG CityGates,t) −ln(NG CityGates,t−1) are the annual changes in log state average electricity rates, and logstate average city-gate natural gas prices, respectively. We estimate for 1998 (the changefrom 1997) to 2012. Table 2 presents the summary statistics for these variables in the years1997 and 2012.27 We estimate (1) clustering standard errors at the state level.
Table 2—Summary Statistics of Retail Electric and Natural Gas Prices
Variable Mean S.D. Min MaxData for 1997Variable Mean S.D. Min MaxPrice 6.72 2.03 3.87 11.66Fraction IPP 0.03 0.07 0.00 0.46Nat. Gas 3.54 0.64 2.12 5.18Data for 2012Price 9.70 2.30 6.90 15.54Fraction IPP 0.35 0.33 0.00 0.99Nat. Gas 4.90 0.97 3.46 7.73
The results of regression (1) are reported in table 3. As table 1 suggests, restructuring,which we are representing with fraction of energy generation from non-utility sources inthat year (Fraction IPP ), has no statistically discernible effect on average changes inrates over the 1997 to 2012 period. The point estimate implies that a state with 100%merchant generation has a 0.6% higher average annual rate increase, but one cannot rejectno effect at conventional significance levels. Changes in local natural gas prices, however,do influence rates. The second column of table 3 suggests that a 1% increase in naturalgas prices implies a 5% increase in electricity prices on its own. The third column in thetable yields greater clarity on the mechanism. When the change in natural gas price isinteracted with the Fraction IPP , the results suggests that the effect of natural gas ismuch greater in restructured states as the earlier discussion would suggest. The influenceof natural gas price on retail rates is estimated to be nearly twice as large in a state with allmerchant generation than in a state with none. The effect of natural gas prices in a statewith no merchant generation is not statistically significant, while the interacted effect withFraction IPP is highly significant.
We do not intend this to be an exhaustive analysis of the drivers of retail prices.28 How-ever these data are strongly supportive of the argument that, apart from the Californiaelectricity crisis, any harm that electricity restructuring has done to consumers was a side-effect of changes in the price of natural gas. In restructured markets, natural gas generation
27Both time series are from the Energy Information Administration. Electricity rates are the“Total Electric Industry” average price across all customer classes, per state, as reported athttp://www.eia.gov/electricity/data/state/ and derived from EIA form 861 data. Natural Gas prices are available athttp://www.eia.gov/dnav/ng/ng pri sum dcu nus a.htm, and derived from EIA form 857 data.
28Others such as Apt (2005) and Taber, Chapman and Mount (2006) have performed more extensive exercises, butonly utilizing data during the early years of restructuring.

ELECTRICITY RESTRUCTURING 19
Table 3—Analysis of Retail Price Changes
1 2 3Pct IPP 0.006 0.007 0.006
(0.005) (0.005) (0.005)Pct Change in 0.051 0.023Nat. Gas (0.016) (0.016)∆NGasxPctIPP NA 0.018
(0.005)N 720 720 720
Dependent variable is change in log annual state-level average electric-
ity rates. Standard Errors are clustered by state.
determines market prices and therefore the remuneration for all the non-utility assets. Themore non-utility assets featured in a state’s generation mix, the more exposed that state isto the natural gas market.
Simply put, restructuring in the U.S. was in hindsight very poorly timed. Assets thatwere viewed as stranded in 1998 were sold as white elephants at prices far below what theywould have fetched in 2007. Conversely, large customers in the 1990s were motivated by lowwholesale prices to push for restructuring, but the switch to market pricing, which increasedtheir exposure to the natural gas market, came just as natural gas price increases startinga long climb up to a peak in 2007. This timing is not coincidental: the same factors thatcontributed to the low valuation of utility assets in the late 1990s (low wholesale prices)were the ones that made the prospect of restructuring so appealing to customers and policymakers.
D. The Evolution of Retail Price Structures
Unfortunately, data on retail price structures are much less available than data on averageretail price levels. Nonetheless, it is clear that there has been gradual movement towardstime-varying pricing, primarily for commercial and industrial customers. In the last decade– partially in response to funding from the 2009 American Recovery and ReinvestmentAct (ARRA) – many utilities have rolled out so-called “smart meters” to even residentialcustomers. Estimates vary, but by 2013 it is likely that more than 40% of all customers inthe U.S. had smart meters.29
These meters record total electricity consumption in hourly or shorter periods, and can fa-cilitate much wider use of pricing that changes frequently to reflect real-time supply/demandbalance, known as dynamic pricing.30 So far, such granular and timely pricing has appearedfor only a narrow slice of large industrial and commercial customers, but with smart meters
29See FERC (2013).30The meters also communicate information to the utility without onsite visit by a meter reader. Savings on meter
reading labor have been the largest benefits projected by utility installing smart meters.

20
now in place, most of the financial cost of dynamic pricing down to even residential cus-tomers has been sunk. Still, there remains substantial resistance to dynamic pricing amongresidential consumers and groups that represent them. Data from a 2012 EIA survey ofutilities suggest that only a few percent of customers are on tariffs that have any dynamicpricing component.31
Of course, the efficiency gain from dynamic pricing depends on the ability and willingnessof customers to respond to those prices. Opponents have generally argued that householdswon’t pay the attention necessary to adjust thermostat settings, washer/dryer use, andother electricity-consuming activities in response to dynamic prices. Simple calculations,such as in Borenstein (2013), show that the financial gain from paying attention to suchprice fluctuations has been modest. Still, increased penetration of intermittent generationresources (wind and solar) is likely to increase wholesale price volatility and raise the socialreturn to such attention, while automation is likely to continue lowering the cost of thenecessary attention.
A very large literature has now developed using randomized control trials, randomizedencouragement designs and quasi-experiments to analyze just how much consumers do re-spond to dynamic pricing. The evidence is fairly consistent that even without automation,customers respond significantly on average, though with a fairly small elasticity, generallyestimated to be in the -0.1 to -0.2 range.32 The research suggests that the larger elasticitiesresult from interventions that include technology to convey information, such as emails,text messages, and in-home electricity usage displays.
The literature on elasticity with automated demand response is much thinner; it is prettymuch non-existent in economics outlets. But programmable controllable thermostats –which can permit a person to automate response to a price or other warning signal or allowan authorized third party to do so – have been in use for more than a decade. Industrypublications suggest these technologies greatly increase potential demand response.33
IV. The Next 20 Years
After a tumultuous period from 1996 to 2005, the regulatory/legal status of electricityrestructuring – in generation, transmission, distribution and retailing – has changed littlein the last decade. In recent years, however, the continuing evolution in technology and inenvironmental concerns has disrupted the industry in new ways. These changes are ongoingand are likely to continue for many years.
The greatest change occurring in electricity markets today – and likely going forward formany years – is the increased recognition of environmental costs of electricity generation,most notably (but not exclusively) greenhouse gas emissions. Environmental issues haveplayed a significant role in electricity for decades, but most of the emphasis in past yearswas on limiting the local air and water pollution from traditional generation sources. Ofcourse, appropriate pricing of the environmental externalities – either through a tax or a
31See FERC (2013) and EIA Form 861.32See Jessoe and Rapson (2014), Ito (2014), and Wolak (2011b).33See Faruqui and George (2002).

ELECTRICITY RESTRUCTURING 21
cap-and-trade program – would be the simplest and most efficient way to incorporate theseenvironmental costs.34 Currently, most U.S. utilities either pay zero for their greenhousegas emissions, while a minority pay prices well below the most common estimates of thesocial cost of those emissions. In that situation, raising marginal retail price above theutility’s private marginal cost can be efficient, of course, and it can at the same time reducethe need for fixed charges discussed earlier.
01
00
20
03
00
40
0
Ge
ne
ratio
n in
TW
h
2001 2002 2003 2004 2005 2006 2007 2008 2009 2010 2011 2012
Biomass Geothermal
Solar Wind
Figure 7. Electricity produced from non-hydro renewable sources (excludes distributed generation)
In the last decade, with growing concern about climate change and with improving tech-nology, environmental stakeholders have turned more and more to goals for increasing gen-eration from renewable sources. While hydro-electric and nuclear generation are by far thelargest low-carbon sources in the U.S., wind and solar are growing rapidly, as shown infigure 7.
The growth of wind and solar generation sources raises two issues that are now coming todominate policy discussions among utilities and policy makers: (1) economic and technicalmanagement of intermittent-production resources for which costs are largely sunk beforeproduction begins and (2) policy towards distributed generation resources that are on theproperty of the end user (so-called “behind the meter” generation). The latter is primarilyan issue with rooftop solar PV today, but could expand to batteries and other generationor storage devices in the future.
34“Appropriate” is a key word here. Simply setting a tax or a quantity cap addresses the issue efficiently only ifthe tax or quantity limit is set correctly. This is an obvious point, but one that seems to be missed or ignored bymany policymakers.
22
A. Management of Intermittent Generation Resources
Numerous regulatory and legislative initiatives, including President Obama’s Clean PowerPlan proposed in 2014, are pressuring electricity providers to reduce the greenhouse gasfootprint of the power they supply. Many options exist for reducing GHG emissions fromelectricity, but among the most prevalent today are greater use of wind and solar power.Economic and technical integration of these intermittent renewable generation resources islikely to be one of the principal challenges facing the electricity industry in the next fewdecades.
The technical challenge stems primarily from the fact that production from these resourceoccurs intermittently and largely outside the control of the owner – when the wind blows orthe sun shines.35 Because the physics requires that quantities supplied and demanded in anelectrical grid must balance at all times for the system to be stable – and because storage isstill quite expensive – the intermittency of wind and solar implies that either other flexiblesupply resources must be available to offset these fluctuations or demand must change inresponse. Both solutions are technically feasible, though supply-side responses have beenthe focus of more discussion.
Intermittency problems occur on both short and long timescales. Large fluctuations inelectrical generation can occur second by second from solar PV, and minute by minutefrom wind. On a longer scale, both wind and solar can exhibit many hours of higher orlower production than was forecast even a day in advance.36 Short scale intermittency isgenerally localized and idiosyncratic, so a diversity of locations may substantially mitigatethe problem, though studies suggest that some additional balancing resources or demandresponsiveness will still be necessary at high penetration.37
Longer-scale intermittency is likely to be a more formidable problem if wind and solarbecome a large share of generation capacity. Absent inexpensive electricity storage, days orweeks without much sunshine or wind would create energy supply fluctuations that wouldbe very costly for demand to follow. If the existence of those days requires full or nearly-fullcapacity coverage from conventional fossil resources, then the full cost of supplying powerwith high renewables penetration grows significantly.
Further complicating the technical challenge, conventional fossil generation is constrainedin how quickly it can “ramp” output up and down to offset large changes in output fromrenewable resources. In general, the most flexible conventional generation is from gas-firedpeaker plants, which are also the least efficient and most expensive. Larger combined-cyclegas turbine plants are somewhat less flexible, but lower cost, and coal and nuclear plantsare the least flexible.
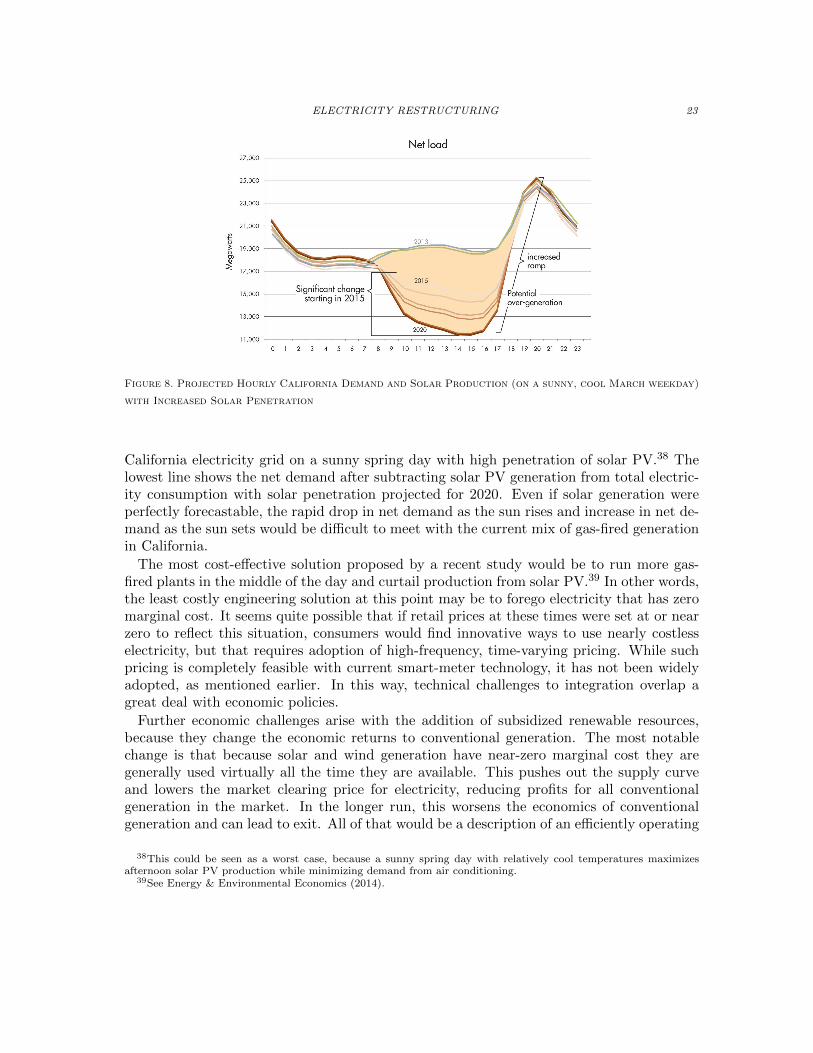
A well-know concern is illustrated in what has become known as the “duck chart” shownin figure 8. The duck chart presents the forecast total demand and net demand for the
35In reality, these resources can be adjusted downward, just not upward if wind or sun aren’t present. Both windand solar PV are potentially curtailable, but require communication between the grid operator and the resource.Wind turbine blades can be positioned so as not to catch the wind and stop turning. Solar PV curtailment requriesa smart inverter that can be told to disconnect the PV system from the grid. The inverters currently on nearly allresidential and small commercial systems do not have this capability.
36See Joskow (2011) and Schmalensee (2012).37See Mills and Wiser (2010) and Tabone and Callaway (2013).
ELECTRICITY RESTRUCTURING 23
Figure 8. Projected Hourly California Demand and Solar Production (on a sunny, cool March weekday)
with Increased Solar Penetration
California electricity grid on a sunny spring day with high penetration of solar PV.38 Thelowest line shows the net demand after subtracting solar PV generation from total electric-ity consumption with solar penetration projected for 2020. Even if solar generation wereperfectly forecastable, the rapid drop in net demand as the sun rises and increase in net de-mand as the sun sets would be difficult to meet with the current mix of gas-fired generationin California.
The most cost-effective solution proposed by a recent study would be to run more gas-fired plants in the middle of the day and curtail production from solar PV.39 In other words,the least costly engineering solution at this point may be to forego electricity that has zeromarginal cost. It seems quite possible that if retail prices at these times were set at or nearzero to reflect this situation, consumers would find innovative ways to use nearly costlesselectricity, but that requires adoption of high-frequency, time-varying pricing. While suchpricing is completely feasible with current smart-meter technology, it has not been widelyadopted, as mentioned earlier. In this way, technical challenges to integration overlap agreat deal with economic policies.
Further economic challenges arise with the addition of subsidized renewable resources,because they change the economic returns to conventional generation. The most notablechange is that because solar and wind generation have near-zero marginal cost they aregenerally used virtually all the time they are available. This pushes out the supply curveand lowers the market clearing price for electricity, reducing profits for all conventionalgeneration in the market. In the longer run, this worsens the economics of conventionalgeneration and can lead to exit. All of that would be a description of an efficiently operating
38This could be seen as a worst case, because a sunny spring day with relatively cool temperatures maximizesafternoon solar PV production while minimizing demand from air conditioning.
39See Energy & Environmental Economics (2014).
24
competitive market if no generation sources were subsidized, all sources paid their full socialmarginal cost, and electricity prices reflected the social value of marginal production at everypoint in time. However, renewable generation costs are artificially low due to investment andproduction subsidies, while conventional generation does not pay for its negative pollutionexternalities. And wholesale prices do not reflect the value of marginal power at a specificpoint in time or space; instead, the system operator separately arranges for electricity neededto maintain voltage in specific areas, to offset fluctuation of intermittent resources and forother operational constraints, and to respond to un-forecasted demand volatility. One ofthe common ways to assure needed capacity does not exit is through capacity payments,which generally pay companies to have generation available regardless of the electricity itis called upon to generate.40
B. Policy towards distributed generation
Cost reductions in solar PV technologies have also changed the economics of self-generationby end-use customers, known as distributed generation. In California, Hawaii and othersunny locations with high electricity prices, falling PV system costs have combined withsubstantial federal and state subsidies to make installing solar PV a money saver for somecustomers. The result has been a booming market in behind-the-meter solar PV. In theU.S., distributed solar PV capacity installation has increased from 400 MW in 2009 toabout 1900 MW in 2013, with about half of new installations occurring in California.41
This trend has led some observers and utility executives to predict a “death spiral” inwhich a significant number of customers self-generate much of their electricity, forcing theutility to raise rates for the electricity they still sell in order to cover fixed investments,in turn making solar PV economic for a larger set of customers who then reduce theirpurchases, leading to a greater revenue shortfall and another rate increase, and restartingthe cycle. Ultimately, some argue, the monopoly utility disappears. This scenario hastriggered widespread debate – both positive and normative – about the future and viabilityof the utility. The regulator in New York state has even proposed a complete redesign ofutility systems that is focused on customers also being generators.42
The social welfare gain from increasing reliance on distributed PV generation, however,is still far from clear. Even the most optimistic cost scenarios suggest that the full so-cial levelized cost of electricity from residential solar PV is likely at least $0.20/kWh inrelatively sunny areas, more than double the full cost of gas-fired generation including agreenhouse gas cost of $40/ton.43 Distributed PV generation is eligible for the same taxbenefits as large scale solar, a 30% tax credit through the end of 2016 and accelerateddepreciation. Borenstein (2015) estimate that the accelerated depreciation amounts to an
40See Joskow (2008) for a broad overview of the role of capacity payments.41See Sherwood (2014). These numbers are the sum of residential and non-residential installations that are non-
utility scale.42See NYS Department of Public Service (2014).43The $0.20/kWh figure uses the calculations in Borenstein (2012) and recent system cost figures reported by
Barbose, Weaver and Darghouth(2014) to be as low as $4 per watt of installed capacity. Most estimates of the long-run private cost of gas-fired generation are around $0.06/kWh and emissions of about 0.0004 tons of GHG per kWh.Valuing the social cost of GHG emissions at $40/ton yields a full social cost of $0.076/kWh.
ELECTRICITY RESTRUCTURING 25
additional effective subsidy of about 15%.44
Distributed PV generation also benefits from being compensated at retail prices for thepower it produces. Under “net metering,” which has been adopted in most of the U.S.,customers are credited for all power produced from their PV system by deducting thequantity from the customer’s consumption.45 In reality, calculations by Darghouth, Barboseand Wiser (2013) suggest that less than two-thirds of the power produced by a typicalhousehold PV system is consumed onsite – actually reducing the customer’s retail demand– but net metering treats all power as demand reduction, thereby crediting it at the retailrate the customer would have paid.46 If the full benefits that DG solar PV power brings tothe market are less than the marginal rate the customer pays, then net metering policieslead to over-compensation of DG solar production. A simple calculation suggests this isvery much the case, but the full system benefits are a matter of some dispute.47 Whatis clear is that retail electricity rates are set in ways that are not closely tied to long-runmarginal cost, so incentivizing DG solar through net metering will conflate solar policy withrate design policy and will have unpredictable effects on the incentive to install residentialsolar.
Probably the clearest illustration of perverse incentives from net metering policy is inCalifornia, where more than half of U.S. residential PV has been installed and where thegap between marginal retail rates and marginal cost may be highest. Most Californiautilities use increasing-block residential electricity pricing, meaning that the marginal pricea customer faces increases in steps as the customer’s consumption increases during thebilling period. The two largest California utilities, each of which has an average residentialretail price around $0.18/kWh, have four blocks in their residential tariffs with prices fromabout $0.12/kWh up to more than $0.35/kWh on the highest block. Borenstein (2015)reports that a greatly disproportionate share of California households installing PV from2007 to 2013 had consumption levels that reached into the two highest price tiers. He alsofinds that installations have been calibrated to eliminate consumption on the highest-pricetiers, but not to crowd out the lower-price consumption. Borenstein (2015) estimates thatthe average bill savings from installing DG solar for customers of these utilities was about25%-50% greater due to increasing block pricing than it would have been if the utilitycharged a flat rate equal to their average residential price per kWh. He estimates that thebill savings were more than double what they would have been if the utilities had charged$0.10/kWh, a rough approximation of social marginal avoided cost.48
44Actually, the accelerated depreciation benefit is available only if the system is owned by a company, not anindividual. This has been a significant factor behind the rapid growth of third-party owned residential systems inwhich the third-party owner leases the system to the homeowner or, more commonly, sells the electricity from thesystem to the homeowner. Third-party owners of these systems point out that this model also greatly lowers, oreliminates, the up-front payment the homeowner would otherwise have to make.
45See http://dsireusa.org/solar/solarpolicyguide/?id=17 for timely information on U.S. state net metering policies.46This is for a system that generates electricity equal to about 60% of the household’s demand. The figure would
be even lower for a system that is larger relative to household demand.47See Borenstein (2012) and Cohen and Callaway (2013).48The best estimates of long-run marginal cost from gas-fired generation is about $0.06/kWh as mentioned earlier,
but DG solar PV consumed onsite also avoids the 7%-9% of electricity that is dissipated through line losses as thepower flows from generation through transmission and distribution lines to the end user. See Borenstein (2008).Accounting for line losses, the electricity delivered for consumption from conventional generation has a marginal cost
26
Talk of a “death spiral” and questions of the viability of utilities, however, raises a questionthat extends far beyond these issues of implicit and explicit subsidies and the value ofincremental DG solar generation. Can DG really function without the grid? Without low-cost electricity storage, and tolerance of less reliable electricity at some times (e.g., a weekwithout sunshine), it seems unlikely that most customers will be ready to operate off thegrid anytime soon. If the grid is needed, how should it be paid for? The utility pricing modelto date has been based on volumetric average cost pricing. Distributed generation at thispoint looks very much like the push for restructuring discussed in section 2: a comparisonof average cost to marginal cost that ignores that the difference is not a real savings, butrather cost shifting. To the extent that a DG solar household has costs greater than orequal to the social marginal cost of grid-supplied electricity, the private savings are offset,or more than offset, by a revenue shortfall at the utility. That shortfall must then be madeup by utility shareholders or, more likely, remaining rate payers. In fact, the notion of adeath spiral – with rising retail rates as consumption declines – necessarily implies thatprice is above marginal cost, and an excessive incentive to install DG.
V. Summary
The changes in the electricity industry over the last two decades have been dramatic, butmany were not the changes that were anticipated at the beginning of the industry’s grandexperiment with market-based pricing of generation and retail services. While the revenuesfor much of the nation’s conventional and nuclear generation sources are now based uponmarket prices rather than production costs, retail pricing for the vast majority of residentialcustomers remains dominated by state regulatory processes.
In the mid-1990s, the strong momentum for restructuring was driven by a large gapbetween market-based prices – which were based upon marginal cost in competitive markets– and regulated rates – which were based upon average production costs. During thisperiod of relatively large capacity margins and low natural gas prices, market-based pricingappealed to customers and terrified utility shareholders whose assets would become strandedabsent other compensation. However, despite the allure of market-based pricing, the realityof the regulatory process, and of case law, dictated that utilities be allowed to recover thebulk of what appeared at the time to be stranded costs.
The great irony of this period is that a half decade after transition arrangements largelycompensated utilities for the losses incurred in selling or transferring these assets, the marketvalue of those same assets had fully recovered. By the mid-2000s the relationship betweenaverage and marginal cost had largely reversed, and many states expressed a great deal ofregret about the decision to restructure. However, since the formerly regulated generationassets were now largely held by private, deregulated firms, there was no clear path to
closer to $0.065/kWh. The timing of power from solar PV also boosts its value, or the cost of alternative sources.Solar PV generation produces more at peak times, so it is replacing power at times when marginal electricity costs arehigher. Borenstein (2008) estimates that in real-world grid operation this increases the cost of the alternative powersource by an average of 20%, bringing marginal cost of alternative generation to around $0.078/kWh. Inclusion of thecost of GHG emissions raises the cost of alternative generation by $0.015-$0.02 per kWh at a GHG price of $40/ton,bringing the alternative marginal cost to about $0.10.
ELECTRICITY RESTRUCTURING 27
dramatically “re-regulate” the industry without paying full market value for those assets.Looked at this way, one can view the disappointment with restructuring as being drivenby magnificently poor market timing. Utilities sold off their assets at the nadir of theirvalue; then, as natural gas prices climbed throughout the 2000s, those assets became quitevaluable under market-based pricing.
Since 2009, this story has largely reversed yet again. Natural gas prices have declinedsharply, nearly to the levels seen at the dawn of the restructuring movement. The attentionof policymakers has now been consumed by environmental priorities, particularly the impli-cations of coal generation decline and renewable generation growth for costs and greenhousegas emissions. A surge of subsidized renewable generation, combined with low natural gasprices, has driven wholesale prices steadily lower. As one would expect, in the short runthis has benefited consumers in market-based states disproportionately more than those inregulated states.
Going forward, the role of intermittent renewable generation at both the wholesale anddistributed level is likely to continue to dominate the economics and policy of the industry.The low wholesale prices that have resulted from expansion of subsidized renewables are notsufficient to cover the total cost of renewable or conventional sources, so the prominence ofextra-market sources of revenue – such as above-market contracts and capacity payments –is likely to continue to grow. This will mean that even in the “market” states, the true costof supply will increasingly diverge from the underlying price of the fundamental commodity,electrical energy.
At the retail level, distributed energy threatens to unravel the economics of retail dis-tribution supply. Again the juxtaposition of average and marginal cost is a driving forcehere, although the differences are exacerbated by inefficient rate-making and political econ-omy. Current rate-making practices encourage individuals to install distributed generation,such as solar PV, that is privately economic because rates, which include the fixed costsof transmission and distribution, exceed the marginal cost of generated energy by a largemargin. The next natural step in the rate-making process will be a move to two-part tariffsthat include monthly charges decoupled from the volume of electricity consumed. There isspeculation that the cost of storage technologies, perhaps deployed in a joint applicationsuch as with electric vehicles, could decline enough that households might bypass the gridcompletely.49 Such an outcome would be a giant leap forward in technology, but it couldbe a step backward in economics if such decisions would again be motivated by an abilityto shift sunk costs – this time of grid assets – onto other customers or utility shareholders.Policymakers again have a chance to make economically rational decisions based on trueincremental costs. We can only hope that this time they will grab that opportunity.
VI. References
Apt J. 2005. Competition Has Not Lowered U.S. Industrial Electricity Prices. The Elec-tricity Journal, 18:52-61.
Barbose GL, Weaver S, Darghouth N. 2014. Tracking the Sun VII: An Historical Summary
49See Lacey, 2014
28
of the Installed Price of Photovoltaics in the United States from 1998-2013. LawrenceBerkeley National Laboratory Report #.
Behr P. 2009. Showdown looms over Md. electricity re-regulation. The New York Times:Greenwire. April 11.
Blumstein C, Friedman LS, Green R. 2002. The History of Electricity Restructuring inCalifornia. Journal of Industry, Competition and Trade. 2:9-38.
Borenstein S. 2002. The Trouble with Electricity Markets: Understanding California’sRestructuring Disaster. Journal of Economic Perspectives. 16:191-211.
Borenstein S. 2005. Time-Varying Retail Electricity Prices: Theory and Practice. In Griffinand Puller, eds., Electricity Deregulation: Choices and Challenges. Chicago: Universityof Chicago Press, 2005.
Borenstein, S. 2008. The Market Value and Cost of Solar Photovoltaic Electricity Produc-tion. Center for the Study of Energy Markets Working Paper #176, U.C. Berkeley.
Borenstein S. 2011. Regional and Income Distribution Effects of Alternative Retail Elec-tricity Tariffs. Energy Institute at Haas Working Paper #225, U.C. Berkeley.
Borenstein S. 2012a. The Private and Public Economics of Renewable Electricity Genera-tion. Journal of Economic Perspectives. 26:67-92
Borenstein S. 2012b. The Redistributional Impact of Non-Linear Electricity Pricing. Amer-ican Economic Journal: Economic Policy. 4:56-90.
Borenstein S, 2013. Effective and Equitable Adoption of Opt-In Residential Dynamic Elec-tricity Pricing. Review of Industrial Organization. 42:127-160.
Borenstein S, Bushnell JB. 2000. Electricity restructuring: deregulation or reregulation?Regulation. 23(2):46-52.
Borenstein S, Bushnell JB, and Wolak FA. 2002. Measuring Market Inefficiencies in Califor-nia’s Restructured Wholesale Electricity Market. American Economic Review. 92:1376-1405.
Borenstein S, Holland S. 2005. On the Efficiency of Competitive Electricity Markets WithTime-Invariant Retail Prices. RAND Journal of Economics. 36:469-493.
Borenstein S. 2015. The Private Net Benefits of Residential Solar PV: And Who GetsThem. Energy Institute at Haas Working Paper #, U.C. Berkeley.
Bushnell, JB. 2004. California’s electricity crisis: a market apart? Energy Policy 32:1045-1052.
Bushnell JB, Mansur ET, Saravia C. 2008. Vertical Arrangements, Market Structure, andCompetition: An Analysis of Restructured U.S. Electricity Markets. American Eco-nomic Review. 98:237-266.
Bushnell JB, Wolfram C. 2008. The Guy at the Controls: Labor Quality and Power PlantEfficiency. in International Differences in the Business Practices and Productivity ofFirms. Chicago: University of Chicago Press. 79-102.
Bushnell JB, Wolfram C. 2005. Ownership Change, Incentives and Plant Efficiency: TheDivestiture of U.S. Electricity Generating Plants. Center for the Study of EnergyMarkets Working Paper #140, U.C. Berkeley.
Cohen MA, Callaway DS (2013). Modeling the effect of geographically diverse pv gener-ation on California’s distribution system. Smart Grid Communications. 2013 IEEE

ELECTRICITY RESTRUCTURING 29
International Conference:702-707.Darghouth N, Barbose G, Wiser R. 2013. Electricity Bill Savings from Residential Pho-
tovoltaic Systems: Sensitivities to Changes in Future Electricity Market Conditions.Lawrence Berkeley National Laboratory Report #LBNL-6017E.
Davis LW, Wolfram C. 2012. Deregulation, Consolidation, and Efficiency: Evidence fromU.S. Nuclear Power. American Economic Journal: Applied Economics. 4:194-225.
Energy & Environmental Economics. 2014. Investigating a Higher Renewables PortfolioStandard.Available at https://ethree.com/public projects/renewables portfolio standard.php
Fabrizio K, Rose NL, Wolfram C. 2007. Do markets reduce costs? Assessing the impactof regulatory restructuring on U.S. electric generation efficiency. American EconomicReview. 97:1250-1277.
Faruqui A and George SS. 2002. The Value of Dynamic Pricing in Mass Markets. ElectricityJournal. 15:45-65.
Federal Energy Regulatory Commission. 2013. Assessment of Demand Response & Ad-vanced Metering. Staff Report. October 2013, Washington D.C.
Hausman C. 2014. Corporate Incentives and Nuclear Safety. American Economic Journal:Economic Policy, 6:178-206.
Ida T, Ito K, Tanaka M. 2014. The Persistence of Intrinsic and Extrinsic Motivation:Experimental Evidence from Energy Demand. National Bureau of Economic ResearchWorking Paper #.
Ito K. 2014. Do Consumers Respond to Marginal or Average Price? Evidence from Non-linear Electricity Pricing. American Economic Review, 104:537-563.
Jessoe K, Rapson D. 2014. Knowledge is (Less) Power: Experimental Evidence from Resi-dential Energy Use. American Economic Review, 104:1417-1438.
Johnston DC. 2007. Competitively Priced Electricity Costs More, Studies Show. The NewYork Times. November 6.
Joskow PL. 1997. Restructuring, competition and regulatory reform in the U.S. electricitysector. Journal of Economic Perspectives 11:119-138.
Joskow PL. 2001. California’s electricity crisis. Oxford Review of Economic Policy. 17:365-388.
Joskow PL. 2006. Markets for power in the United States: An interim assessment. TheEnergy Journal 27: 1-36.
Joskow PL. Capacity payments in imperfect electricity markets: Need and design. UtilitiesPolicy. 16:159-170.
Joskow PL. 2011. Comparing the Costs of Intermittent and Dispatchable Electricity Gen-erating Technologies. American Economic Review Papers & Proceedings. 101: 23841.
Joskow PL. 2012. Creating a smarter U.S. electricity grid. Journal of Economic Perspec-tives. 26: 29-48.
Joskow PL, Tirole J. 2006. Retail electricity competition. RAND Journal of Economics37:799-815.
Joskow PL, Kahn E. 2002. A quantitative analysis of pricing behavior in California’s whole-sale electricity market during Summer 2000. Energy Journal 23: 1-35.

30
Kleit AN, Reitzes JD. 2008. The Effectiveness of FERC’s Transmission Policy: Is Trans-mission Used Efficiently and When Is It Scarce? Journal of Regulatory Economics.34:1-26.
Lacey, S. 2014. Morgan Stanley: Fixed Charges on Solar May Cause ‘Tipping Point’ for GridDefection. Greentech Media. August 4. http : //www.greentechmedia.com/articles/read/Solar−Fixed− Charges−May − Cause−Grid−Defection?utmsource = Daily
Mansur ET. 2007. Upstream Competition and Vertical Integration in Electricity Markets.Journal of Law and Economics 50:125-156.
Mansur ET. 2008. Measuring Welfare in Restructured Electricity Markets. Review ofEconomics and Statistics 90:369-386.
Mansur ET, White MW. 2012. Market Organization and Efficiency in Electricity Markets.Dartmouth University Working Paper. http : //www.dartmouth.edu/ mansur/papers/mansurwhitepjmaep.pdf .
Mills A, Wiser R. 2010. Implications of Wide-Area Geographic Diversity for Short-TermVariability of Solar Power. Lawrence Berkeley National Laboratory Report #LBNL-3884E.
New York State Department of Public Service. 2014. Reforming the Energy Vision. Case14-M-0101, 2/24/2014. (Available at http://www3.dps.ny.gov/W/PSCWeb.nsf/96f0fec0b45a3c6485257688006a701a/26be8a93967e604785257cc40066b91a/$FILE/ATTK0J3L.pdf/Reforming%20The%20Energy%20Vision%20%28REV%29%20REPORT%204.25.%2014.pdf)
Puller SL. 2007. Pricing and firm conduct in California’s deregulated electricity market.Review of Economics and Statistics. 89:75-87.
Schmalensee, R. 2012. Evaluating policies to increase electricity generation from renewableenergy. Review of Environmental Economics and Policy. 6:45-64.
Sharp D. 2007. Utility rates in Maine on the rise; State lawmakers consider rollback ofderegulation. Bangor Daily News. April 21.
Sherwood L. 2014. U.S. Solar Market Trends 2013. Interstate Renewable Energy Council,Inc.
Showalter M. 2007. Price Trends for Industrial Electricity, Deregulated vs. RegulatedStates. Power in the Public Interest (PPI) Report. November 6. http://www.ppinet.org/PDFs/PPI-rp-INDjul07data-nov07.pdf
Taber J, Chapman D, Mount T. 2006. Examining the effects of deregulation on retailelectricity prices. Cornell University Working Paper WP-2005-14.
Tabone MD, Callaway DS. (2013). Parameterizing fluctuations in solar photovoltaic gener-ation using Hidden Markov Models. Power and Energy Society General Meeting (PES).(pp. 1-6). IEEE.
Tierney S. 2007. Decoding Developments in Todays Electric Industry Ten Points in thePrism. Analysis Group, Prepared for the Electric Power Supply Association.
White MW. 1995. Valuing market trading mechanisms: Evidence from electricity markets.POWER Working Paper #PWP-033, University of California Energy Institute.
White MW. 1996. Power Struggles: Explaining Deregulatory Reforms in Electricity Mar-kets. Brookings Papers on Economic Activity. 1996: 201-267.
Wolak FA. 2003a. Measuring unilateral market power in wholesale electricity markets:the California market, 1998-2000. American Economic Review Papers & Proceedings.93:425-430.
ELECTRICITY RESTRUCTURING 31
Wolak FA. 2003b. Diagnosing the California Electricity Crisis. Electricity Journal. 16(7):11-37.
Wolak FA. 2011a. Measuring the Benefits of Greater Spatial Granularity in Short-TermPricing in Wholesale Electricity Markets. American Economic Review Papers & Pro-ceedings. 101:247-252.
Wolak FA. 2011b. Do Residential Customers Respond to Hourly Prices? Evidence froma Dynamic Pricing Experiment.” American Economic Review: Papers & Proceedings,101:8387.
Wolfram C. 2005. The Efficiency of Electricity Generation in the U.S. After Restructur-ing,” in James Griffin and Steve Puller, eds., Electricity Deregulation: Choices andChallenges. Chicago: University of Chicago Press.
U.S. Energy Information Administration. 1995. Electric Power Annual 1994, Volume II(Operational and Financial Data). Washington D.C.: U.S. Department of Energy.