the u.s. congress established the east-west center · 2017-05-05 · the u.s. congress established...
TRANSCRIPT

The U.S. Congress established the East-West Centerin 1960 to foster mutual understanding and coopera-tion among the governments and peoples of theAsia Pacific region including the United States.Funding for the Center comes from the U.S. govern-ment with additional support provided by privateagencies, individuals, corporations, and Asian andPacific governments.
East-West Center Working Papers are circulated forcomment and to inform interested colleagues aboutwork in progress at the Center.
For more information about the Center or to orderpublications, contact:
Publication Sales OfficeEast-West Center1601 East-West RoadHonolulu, Hawaii 96848-1601
Telephone: 808-944-7145Facsimile: 808-944-7376Email: [email protected]: www.EastWestCenter.org

E A S T - W E S T C E N T E R W O R K I N G P A P E R SE A S T - W E S T C E N T E R W O R K I N G P A P E R SE A S T - W E S T C E N T E R W O R K I N G P A P E R SE A S T - W E S T C E N T E R W O R K I N G P A P E R SE A S T - W E S T C E N T E R W O R K I N G P A P E R S
Economics SeriesEconomics SeriesEconomics SeriesEconomics SeriesEconomics Series
No. 77, May 2005
Relative Economic Decline andUnrealized DemographicOpportunity in the Philippines
Christopher Edmonds and Manabu Fujimura
Christopher Edmonds is a Fellow in the Economics StudyArea of the Research Program at the East-West Center.He is also an affiliate graduate faculty member with theEconomics Department at the University of Hawaii atManoa. He joined the Center in 2003. Before coming toHonolulu, he was an economist at the Asian DevelopmentBank (ADB) in Manila, Philippines, and an affiliate scientistat the International Rice Institute (IRRI) in Los Baños,Philippines (1998 to 2003). He received his Ph.D. inagricultural and resource economics from the Universityof California, Berkeley, in 1998.
Manabu Fujimura is a Professor in the Economics Depart-ment of Aoyama Gakuin University in Tokyo, Japan. Hewas previously an economist at the Asian DevelopmentBank (ADB) in Manila, Philippines, where he worked from1998 to 2003. He obtained his Ph.D. in economics at theUniversity of Hawaii at Manoa in 1994 and is a former East-West Center Degree Fellow.
East-West Center Working Papers: Economics Series is anunreviewed and unedited prepublication series reporting onresearch in progress. The views expressed are those of theauthor and not necessarily those of the Center. Please directorders and requests to the East-West Center's PublicationSales Office. The price for Working Papers is $3.00 each plusshipping and handling.

Relative Economic Decline and Unrealized Demographic Opportunity in the Philippines
Christopher Edmonds and Manabu Fujimura
May 2005
Abstract The paper examines the long-run relationship between demographic and macroeconomic development trends in the Philippines, and compares trends observed in that country to trends in eight regional neighbors in East and Southeast Asia. The Philippines stands out from these countries in that available data suggests the country has completed its demographic transition to a much lesser extent than comparison countries. Analysis of trends shows that the Philippine economy has lost ground to the country’s neighbors over the past 50 years, and that its unfulfilled demographic transition has played a key role in explaining the country’s relative economic decline. The paper reviews established economic theory and a few simple counter-factual simulations to explain and support this conclusion. The authors also consider the relationship between demographic trends and associated economic developments, and the political situation in the country. Despite discouraging findings regarding the Philippines’ relative economic decline, the paper notes the country’s more favorable performance in social development vis-à-vis its neighbors. The paper ends on an optimistic note, pointing to: recent economic reforms, the unrealized potential of a ‘demographic dividend,’ rising demand and use of modern family planning among Philippine households, and the favorable long run outlook for Philippine Overseas Contract Workers, as causes for optimism regarding future demographic change and the country’s economic prospects. JEL Codes (listed in order of relevance—most to least): J13, J18, N35, O15, D13, E66
1

I. Introduction After showing mediocre growth rates of 3.0-4.5% during 2000-2003, the Philippine economy grew by
6.1% in 2004, its highest rate in 15 years. The country’s Current Account has maintained a surplus
since 1999, but widened from US$1.4 billion in 2003 to US$2.1 billion in 2004. International
currency reserves have been maintained at a healthy level of about US$16 billion in 2003-2004,
which is equivalent to 4-6 months of imports. Total exports increased by 14.0% in 2004 (4.4% in
2003). Export of electronic products increased by more than 10% and accounted for a 67% share of
total exports. Other recent good news about Philippine economy includes rising retail sales, strong
growth in employment and remittances overseas firms outsourcing services to the Philippines, such as
US telecom firms relocating call centers—to the country.
Do these positive developments of recent years signal that the Philippine economy is finally
turning around and joining the ranks of other strongly performing economics of East Asia?
Regrettably, no, as there are equally worrying signs concerning the economy’s health and its long-
term growth prospects. The Philippine government continues to rely on persist fiscal deficits to
finance its operations. Foreign public borrowing has reached 47.6% of total public borrowing. The
slow pace of public enterprise reform and lingering problems in the country’s financial sector is
making it difficult for firms in the country to secure external financing. The country’s unemployment
rate remained high at 11.8% in 2004 (a slight increase over the 11.4% rate in 2003). Persistent high
inflation and weakening of the national currency (P51.6 per dollar in 2002, P54.2 per dollar in 2003
and P56.03 in 2004) are other indicators of weakness in the Philippine economy. In export marks,
while the share of manufactured products in exports has shown an impressive increase, it has not been
accompanied by a corresponding shift in the manufacturing share of GDP and total employment. The
share of manufacturing in GDP has been relatively flat, declining from 25% in 1985 to 22-23% in
2000-2003. . Similar trends are evident in employment structure: the share of agriculture in total
employment declined from 49% in 1985 to around 37% in 2000-2003, while the share of
manufacturing was stable—hovering around 9.5-10.0% throughout the period 1985-2003, and the
share of services increased from 41% in 1985 to 52-53% in 2000-2003. These trends suggest that the
2

country has begun de-industrializing before it completed industrializing, and do not bode well for
prospects for sustained economic and employment growth in the country. 1
Philippine efforts to propel the country’s economy forward by attracting foreign direct
investment (FDI) face the globalizing world’s harsh reality that the it must compete against other
developing economies in Asia (most notably China) and worldwide. Multinationals are moving
quickly to organize increasingly multinational production processes according to the most efficient
intra-firm organization in the region. This process of rationalization seems likely to be further
hastened by trade liberalization under ASEAN Free Trade Agreement (AFTA) and ASEAN-China
FTA (ACFTA).2 In this regard, the Philippines seems to be losing their production bases to China and
Thailand among others. Industrial parks constructed in southern Luzon (Laguna, Cavite, and
Batangas) to attract foreign manufactures are not filling available facilities as quickly as the
government hoped despite tax incentives and other government concessions. Part of the lackluster
performance of the southern Luzon industrial parks is due to less than satisfactory transport
infrastructure around this area as well as broader problems stemming from poor governance and a
lack of positive spillovers from other firms also locating their manufacturing facilities in the country.3
Particularly symbolic of the Philippine’s poor management of public infrastructure is the new terminal
at the Ninoy Aquino International Airport. The government completed construction of the facility two
years ago, but it remains unopened due to legal disputes over ownership of the land upon which it was
built. Such adverse circumstances make the Philippine economy’s recent GDP growth at more than
6% per annum rather surprising.
Much of the Philippine economy’s resilience despite institutional shortcomings and high rates
of unemployment and underemployment can be attributed to sustained high levels of remittances sent
to the country by overseas Filipinos. Overseas Contract Workers (OCWs) sent remittances estimated
to amount to as much as 23-24% of the total export earnings during the years 2001-2003.4 The success
Philippine workers have had in securing employment abroad is both a blessing and a curse to the
1 Economic data used in this paragraph are taken from Asian Development Bank (2005; 2004). 2 Concluded in November 2004. 3 Information obtained from informal discussion at Japan External Trade Organization (JETRO). 4 Calculated from the balance of payment data in IMF (2005).
3
country’s economy. On the one hand, OCWs remittances infuse the economy with foreign currency
and provide valuable income to support families back home so provide and important social safety net
as well as stimulating consumer demand and providing a source of capital to small family-based
enterprises. On the other hand, migrants and OCWs—be they unskilled workers or professionals—
seem to have become ‘role models’ for those who aspire for better lives and represent a drain of the
competitive human resources from the economy. By providing a relatively easy channel to exit from
the Philippine economy and its institutions, established networks of Philippine contract workers
diffuse dissatisfaction, which viewed from one perspective is positive because it lessens political
conflicts but from another perspective can be understood as stifling any reformist pressures.
While the efforts of reform and improved governance being undertaken by the Arroyo
administration are fully appreciated, the focus of this paper is to examine long-run economic and
social trends that have brought the Philippines economy to its current state. As will be discussed in
detail, trends indicate that in many important respects the Philippine economy has been in a state of
relative decline compared to neighboring economies since the 1960s. Factors commonly considered as
contributing to this decline include widespread corruption, weak public/civil institutions and poor
governance, a high level of economic inequality, and the country’s high rate of population growth.
This paper focuses on the last of these factors as one that most clearly distinguishes the Philippines
from other East and Southeast Asian economies—notwithstanding the importance of the other factors.
We argue that the Philippines’ economic decline relative to its Asian neighbors can be attributed—to
a substantial degree—to the country’s failure to undergo a demographic transition like those that took
place in other countries in the region. The next section gives a snapshot look at historical trends in
economic and social indictors and provides the empirical basis for our argument. Section 3 takes a
closer look at these trends and considers some counterfactual simulations. In this section we also
provide some theoretical support to our argument. Section 4 considers in greater detail several of the
trends reviewed in a cursory way in Section 2 and provides greater historical background on recorded
trends. Section 5 concludes the paper by considering future prospects for family planning in the
Philippines and prospects for the Philippine economy if current trends continue. Thankfully, this
enables the paper to end a fairly positive note.
4

II. A Snapshot Look
Table 1 summarizes some key social and economic statistics for eight East and Southeast Asian
economies during their Post-WWII development years. The countries were selected as regional
neighbors of the Philippines and because their levels of economic development were broadly
comparable to that of the Philippines in 1960. That year, the Philippine’s GDP per capita far exceeded
that of China, Indonesia, Thailand, and Vietnam. At the time the Philippines was rapidly expanding its
stock of capital as indicated by the high level of capital formation per capita. Capital accumulation
was fostered by the country’s high level of savings, which greatly surpassed average savings levels
observed in its neighbors. The high rates of savings and capital formation per capita in the Philippines
were associated with the country’s high average value added of industrial output per worker in 1975,
which totaled nearly US$7,000 (valued in 1995 US$). Indicators only available in 1970 show the
Philippines was also among the most developed countries in the region in terms of its social
development. Its literacy rate was the highest among the economies listed, and was much higher than
rates in China, Indonesia, and Malaysia. Judged from the perspective of these economic and social
indicators in 1960/70, one might easily conclude that the Philippines had relatively brighter prospects
for development than most of their neighbors.
Table 1: East/Southeast Asian region in 1960s-1970s
Life expect-ancy at birth (years)
Population (millions)
Total GDP (Billions, constant 1995 US$)
GDP per capita (constant 1995 US$)
Gross savings per capita (constant 1995 US$)
Capital formation per capita (constant 1995 US$)
Value added per worker in industry (constant 1995 US$) /1
Literacy rate (pct. populat. 15 or older)/2 Men
Wo-men
China 650.7 61.37 94 158 /3 37 367 52.9 35.1 37.6 Indonesia 100.1 24.93 249 69 /4 17 3,315 56.1 40.7 42.3 Korea 24.8 32.84 1,325 562 92 6,125 -- 52.6 55.8 Malaysia 8.4 8.22 975 208 155 6,533 58.1 52.8 55.9 Philippines 27.1 20.67 725 672 117 6,966 81.8 51.6 55.3 Taiwan 11.2 23.62 /2 1,618 /2 629 /5 186 -- 56.9 /6 -- -- Thailand 27.5 12.78 465 63 81 5,357 80.2 50.6 54.8 Vietnam 31.7 10.86 /7 185 /7 23 /8 27 /8 926 -- 42.6 46.3
Notes: All figures are from 1960 unless indicated otherwise below. /1 Figures reflect estimates for 1975. /2 Figures are from 1970, the earliest year for which figures are available. /3 Figure is from 1978—first year this figure is reported for China in WDI. /4 Figure is from 1967—first year this figure is reported for Indonesia in WDI. /5 Figure is from 1972, the earliest year for which figures are available. /6 Figure is from 1956, the most proximate year for which figure is available, source: US Bureau of Census (2005). /7Figure is from 1984, which is the first year this figure is reported for Vietnam in the World Bank’s World Development Indicators (WDI). /8 Figure is from 1989—first year this figure is reported for Vietnam in WDI.
5

Table 2 reports the same indicators summarized on Table 1 for the year 2000. Comparing
these figures with the earlier ones starkly illustrates the relative decline of the Philippine economy vis-
à-vis its neighbors. Per capita GDP of the Philippines in 2000 was less than one-tenth of that of the
Republic of Korea and Taiwan, as compared to about half in 1960. Per capita GDP in Malaysia and
Thailand grew to surpass the Philippines, while China’s GDP per capita (PPP) has nearly caught up.
Gross savings had per capita in the Philippines fell sharply, from $672 (ranked first) in 1960 to only
$76 (ranked fourth) in 2000, at the same time most of the countries saw their average level of savings
rise. Indonesia also suffered a fall in its gross savings per capita, but the fall was much less dramatic
(from $69 to $56). The concurrent rise in per capita GDP and fall in savings suggests there was
substantial capital flight from the Philippines during the period, since the marginal propensity to save
should increase with average income. Although gross capital formation per capita in the Philippines
nearly doubled between 1960 and 2000, the country’s ranking dropped from 3rd to 6th and the relative
speed of its accumulation lagged dramatically behind that of Korea, Malaysia, Taiwan, and Thailand.
The relative fall in savings and capital formation are closely linked because either domestic savings or
foreign investments are needed to finance capital formation, and although net foreign direct
investment was only reported for the Philippines beginning in 1977, trends show that average net FDI
per Filipino rose from the equivalent of $13 (2000 US $) to $24 between 1977 and 2001. This
increase lagged far behind those registered in neighboring economies and was not nearly large enough
to offset the country’s sharp fall in average savings. The relative decline in capital formation was
associated with an absolute decline in the estimated value added per worker in the industrial sector.
The Philippines was the only country among those listed where this value fell between 1960 and
2000. In the other economies, the average value of output added per industrial worker rose by
between 38% (Indonesia) and 513% (China).
6

Table 2: East/Southeast Asian region in 2000
Life expect-ancy at birth (years)
Population (millions)
Total GDP (Billions, constant 1995 US$)
GDP per capita (constant 1995 US$)
Gross savings percapita (constant 1995 US$)
Capital formation per capita (constant 1995 US$)
Value added per worker in industry (constant 1995 US$)
Literacy rate (pct. populat. 15 or older) Men
Wo-men
China 1,268.9 1,046.34 825 181 302 2,249 85.2 68.6 72.0 Indonesia 224.1 227.42 1,014 56 161 4,572 86.8 64.2 68.0 Korea 47.3 623.79 13,199 2,575 3,435 33,906 -- 69.8 76.9 Malaysia 21.8 104.78 4,808 1,243 1,368 13,363 87.4 70.2 75.0 Philippines 79.7 93.55 1,173 76 229 5,194 94.9 67.3 71.3 Taiwan 22.2 176.31 13.820 3,361 3,159 -- 96.0 73.6 79.3 Thailand 62.4 171.49 2,828 347 566 8,229 95.5 66.7 71.1 Vietnam 79.1 29.22 370 34 /1 112 1,754 92.5 66.7 72.0
Note: /1 Figure is from 1997, which is the latest year this figure is reported for Vietnam in WDI. Data sources are the same as those in Table 1.
This quick comparison of some basic economic statistics of the selected East and Southeast
Asian economies provides a broadly pessimistic characterization of Philippines’ economic
development over the past 40 years, but a relatively less discouraging picture emerges from review of
social indicators. Improvements in social indicators for the Philippines have largely in line with that
of its neighbors. Literacy and life expectancy both increased moderately (by 16% and 30%,
respectively) between 1960 and 2000. This was about the same percentage as increases registered in
Thailand over this period.
III. A Closer Look
The combined population of the eight economies listed above more than doubled, between 1960 and
2001 from growing 883 million to 1.804 billion during these years. This represented an average
annual rate of population growth of 1.8%. However, these years saw the rate of population growth
change markedly over time. The arrival of Green Revolution technologies in rice and other cereal
crops and broader modernization of Asian agriculture began in the 1960s and was associated with a
sharp upturn in the population growth rate of these countries. Population increases averaged well over
2 percent per annum from 1963 to 1974. By early 1970s, however, most economies in the region
began their demographic transitions and population growth rates began to fall. The overall average
fell from 2.74% in 1971 to less than 1.5% per annum in the early 1980s. The rate hovered around 1.5-
1.75% per annum range during 1980s and into the early 1990s, before once again showing decline
during the latest decade—falling from 1.5% in 1991 to 0.9% in 2000 and 2001.
7

Figure 1: Rates of population change (year-on-year)
-1.00
-0.50
0.00
0.50
1.00
1.50
2.00
2.50
3.00
3.50
1951
1953
1955
1957
1959
1961
1963
1965
1967
1969
1971
1973
1975
1977
1979
1981
1983
1985
1987
1989
1991
1993
1995
1997
1999
2001
2003
Perc
ent
China Indonesia Korea (Rep. of) Malaysia Philippines Taiwan ThailandSource: Authors' calculations based on U.S.Bureau of the Census: International Data Base (2005)
Figure 1 presents population trends in the eight economies previously discussed and graphs
the rate of change in total population. The figure illustrates the general trend toward lower population
growth over time, and all eight economies had lower population growth rates in 2001 than in 1960.
China and Thailand display the largest declines, while the declines were most modest for Malaysia
and the Philippines. While population growth in the Philippines has fallen over time, the country’s
population growth rate was highest among the 8 countries each year, and its 40-year averaged was
about equal to that of Malaysia.5 Trends in population growth rates largely follow trends in fertility
rates (see Figure 2).
Considering population and fertility trends is a useful way to begin to examine demographic
change in the Philippines and its cohort economies, but recent economic demography literature goes
beyond simple growth-population correlations to look into the relative size of the working-age against
dependent population and consider the dynamic impact of changes in the age distribution over time.
For example, Kelley and Schmidt (2001) conclude that declining population growth, fertility, and
mortality, as well as larger populations and higher densities have all spurred growth of the world
economy over the period of 1960-95, while a decline in the growth of the working-age population has
been the sole growth-inhibiting trend. Williamson (2001) also finds a powerful positive impact of the
growth in the working age population on per capita GDP growth, referring to this as a demographic
5 Malaysia has had an active policy to promote births in response to perceived labor force needs and to counteract economic incentives against child rearing in this relatively modern industrialized country.
8

Figure 2: Fertility rates
0.00
1.00
2.00
3.00
4.00
5.00
6.00
7.00
8.00
9.00
1960 1962 1965 1967 1970 1972 1975 1977 1980 1982 1985 1987 1990 1992 1995 1997 2000 2001 Years
Birt
hs p
er 1
00 W
oman
China Indonesia Korea Malaysia Philippines Taiwan Thailand VietnamSource: Author's calculations based on data from World Bank (2004) and Taiwan Statistical Yearbook (2004).
dividend in the middle phase of the demographic transition. The demographic dividend is also termed
“a demographic window of opportunity” that typically lasts 40 to 50 years before countries complete
their transitions to low-mortality and low-fertility. Williamson argues that as much as a third of the
“East Asian miracle” can be explained by such population dynamics.
Table 3 shows trends of age dependency ratios (the ratio of population aged 0-14 or over 65
against population aged 15-64) for the economies considered in this paper, which provides a simple
portrayal of the age cooperative of countries’ populations. The age-dependency ratios for all
economies except Philippines have seen steep declines in the last two decades and have all fallen
below 60% by 2003. This suggests these economies have benefited from the demographic dividend.
In contrast, the Philippines has yet to garner an equivalent demographic benefit due to its high
dependency ratio. Alonzo et al. (2004) suggest that at the current slow pace of the decline in total
fertility rate, the effects of population growth momentum would persist in the Philippines for another
60 years. If the Philippines fails to hasten its slow pace in lowering fertility, the population would be
expected to triple to from the current size to 240 million before the country’s population ceases to
grow.
At the heart of the differing demographic trends observed among these countries are the
differing approaches they have taken toward family planning and population growth, which in turn,
9

Table 3: Age dependency ratios (%)
1980 1990 2000 2003China 67 50 46 44
Indonesia 78 66 56 53 Korea 61 45 39 39
Malaysia 76 67 61 59 Philippines 85 79 70 67
Taiwan 57 50 44 43 Thailand 77 56 46 43 Vietnam 90 78 63 56 Data source: ADB (2004)
reflect their differing socio-cultural and religious attitudes towards contraception. China and Vietnam
have pursued aggressive state directed efforts to reduce population growth. China adopted a ‘one child
policy’ and Vietnam a ‘two child policy’, which legally mandated family size limits and prohibited
children in excess of the mandated figures from receiving public education or other benefits. Thailand
underwent a ‘reproductive revolution’ in which non-governmental organizations (NGOs) took a
leading role in changing social norms and promoting contraceptive use. It achieved marked increases
in contraceptive prevalence and decreases in birthrates beginning in the 1970s while relying solely on
education and contraceptive distribution. In Indonesia, the government has long taken a lead in
promoting family planning program aimed at increasing access to contraceptives and reducing
population growth. Malaysia adopted a policy toward increasing population in the face of economic
disincentives to child rearing common among advanced industrialized countries. While the
government policy has been directed toward fostering population growth, there is widespread access
to most types of contraception in the country. In the Philippines, the largest predominantly Catholic
country in Asia, the church’s opposition to artificial contraception has clearly played an important role
in the country’s high fertility rate. In general, more rural or agriculturally based economies at earlier
stages of development have higher population growth rates, while more urban based economies create
disincentives for having large numbers of children. The Philippines’ high population growth reflects
its level of development, its policies, as well as its social and religious beliefs.
It could be argued that a policy of encouraging Philippine workers to seek higher paying
employment outside the country and to send back remittances has been pursued by the various
Philippine administrations as a rational response to demographic pressure and the social and political
difficulty of promoting family planning aggressively. As early as 1985, Cesar Virata, a prominent
10

Philippine economist and prime minister under Marcos administration, warned that rapid population
growth remained the most serious problem facing the country. His fears echoed concerns by
population experts and by academics within the Roman Catholic Church. Nonetheless, the Philippine
Catholic community has consistently taken a pro-natal stance and supported only abstinence and the
rhythm method as methods of family planning consistent with the Catholic faith.
The Aquino administration (1986-92), which was able to topple the Marcos administration in
large measure due to the support of the Catholic Church and its parishioners, stressed family planning
as a health service rather than a means to reduce population. Nonetheless, the government met strong
resistance to its modest efforts to expand family planning service. The conflict between a secular need
for population control and Catholic principle became more pronounced during Ramos administration
(1992-1998). Within weeks of the inauguration, President Ramos, a Protestant, articulated that the
achievement of per capita income of $1,000 by 1998 would require a population growth rate below 2
percent. He appointed Juan Flavier, a medical doctor and an advocate of family planning, as secretary
of the Department of Health, and formulated a program that made available a range of birth control
methods including pills, IUD, and sterilization, to couples wishing to limit their number of children.
Catholic bishops responded by declaring “total war” on the program. The conflict over the family
planning debate subsided by 1997 as President Ramos dampened his rhetoric to the effect that it was
not wise to speak about birth control alone, but instead the population control had to be addressed
under the concept of population-resources-environment balance. While population control remains a
controversial issue in the country’s national politics, some more progressive priests and nuns that
work among the poor in more isolated rural areas or in urban slums are reportedly often sympathetic
to the desire of couples to limit family size and assist poor families in their family planning efforts.6
The Philippines is a predominantly Catholic country, but it also has large evangelical
Christian and minority Muslim populations. Until recently, leaders from these two religious groups
have generally been strong in their opposition to any public efforts to promote family planning in the
6 This paragraph draws on Youngblood (1998).
11

county.7 Nonetheless, there have been a number of public and NGO sector sponsored efforts to
promote contraceptive use and encourage family planning. These efforts date back to the early 1970s
(i.e., the Population Act of 1971). Contraceptive prevalence in the country has been increasing since
1985—the year official statistics began recording it—although the prevalence remains the lowest (47
percent) among the economies considered in this paper.
Population growth and economic development
The relationship between population growth and economic development is complex and has been the
subject of voluminous literature in economics dating from the inception of the discipline. Malthus
(1967 [1793]) theorized that populations will tend to grow to the capacity of the economy to support
human life, and gave birth to the Malthusian economics tradition that continues to find currency more
recently in the writings of environmentalists (e.g., Lester Brown or Garret Hardin). Solow’s (1956)
neoclassical growth model provides the base upon which much economic theory regarding population
and growth proceeds. In simple terms, population growth plays a key role in determining how rapidly
an economy accumulates productive factors or resources. More rapid labor force growth lessens the
rate at which capital per worker can increase. Savings and investment rates and the technical
efficiency of factor use are other key factors in determining an economy’s growth rate and level under
the Solow model. Rapid capital accumulation aided by slowed population growth seen in many East
and Southeast Asian economies helps explain the region’s high economic growth since the 1960’s.
The decline in population growth (demographic transition) had great effect on output per capita
through its effect on savings, which compounded the direct effect of reduced labor force growth.
Across the eight economies and forty years (1960-2000) considered, there was a negative (-4.25)
correlation between change in GDP per capita and change in population and the correlation
coefficient was statistically significant (based on an F-test). 8
7 A recent exception to this generalization involves a March 2004 ‘Fatwah’ (official ruling) endorsed by 22 Muslim religious leaders representing Islamic religious authorities in the Philippines. This Fatwah is discussed in the final section of the paper. 8 It is beyond the scope of this paper to fully discuss the theoretical underpinnings of the inverse relationship between population and economic growth in detail. See Ray (1988), for example, for the recent discussion of the earlier works. Mason (1999) provides an excellent review of the vast literature examining population change and economic development theoretically and empirically. This paper reviews economic theory regarding the impact of
12

Figure 3 displays the trend in per capita GDP from 1960 to 2002. It indicates Philippines’
relatively stronger growth in the period of 1960-82, a marked decline from 1983 to 1985, and a slower
growth since 1985. Because the figure shows trends only to the year 2002, it does not reflect the
recent upturn in the Philippine economy registered during the past couple of years, which was detailed
earlier. In contrast, many of the Philippines’ neighbors have achieved rates of increase in their per
capita GDP that are higher than the Philippine rate throughout the years shown in the figure, and
experienced initial accelerations in their growth in GDP per capita in the mid-1980s. Related to its
slow growth in GDP per capita, property rates in the Philippines are high. Prior to the Asian Financial
Crisis in 1997, which saw poverty rise in the most heavily impacted economies, nationwide about
38% of the Philippine population had income below the poverty line, which meant the country has
one of the highest poverty rates in the region. Despite showing a modest improvement in the poverty
headcount over the few years the figure is reported, the absolute number of poor has steadily risen due
to the country’s rising population.
Figure 3: Trends in GDP per capita
-
2,000
4,000
6,000
8,000
10,000
12,000
14,000
16,000
1960
1962
1964
1966
1968
1970
1972
1974
1976
1978
1980
1982
1984
1986
1988
1990
1992
1994
1996
1998
2000
2002 Years
Cons
tant
199
5 $U
S
China Indonesia Korea, Rep. MalaysiaPhilippines Taiwan Thailand Vietnam
Sources: Author's calculations based on World Bank (2004), U.S. Bureau of Census International Data Base (2005), and Directorate-General of Budget, Republic of China (2004).
population growth on development, the family planning policy pursued in the post-WW II period, and assesses the contribution of slower population growth to the region’s rapid economic development progress during these years. He also reviews growth-accounting analysis adapted to focus on the issue of the roles of increasing capital stock and labor in explaining Asian economies growth experiences over roughly the period considered in this paper.
13

Figure 4 shows what trends in Philippine GDP per capita would have been if the country’s
population had increased at the other countries’ rates but the country’s aggregate economic growth
rate was unchanged from actual figures. Had the population grown at the Chinese rate, the GDP per
capita of the Philippines in 2002 would have been 52% higher than the actual figure. At the Thai
population growth rate, it would have been 25 percent higher than the actual figure. The mean
increase in per capita GDP that the average Filipino would have obtained is nearly 80 percent of the
international poverty line ($1 US per day) at the Thai population growth. This simple counterfactual
can be considered a first-order estimate that does not take account of further positive impacts on
growth through greater savings and investment. Clearly, the estimate’s assumption that aggregate
GDP growth would remain unchanged in the face of marked changes in population is hard to sustain.
Proponents of the view that lower population growth fosters faster economic growth by encouraging
savings, investment, and the adoption of labor saving technology that increase worker productivity.
The opposing view would argue that the reduced manpower implied by lower population growth
would lead to falling GDP as the economy faces the task of producing goods and services with fewer
workers. Treating aggregate GDP as unchanged vis-à-vis actual GDP seeks to set a neutral position
regarding the impact of population change on GDP growth in the simulation.
The relationship between economic development, household income, and family decision-
making regarding childrearing can be considered in a microeconomic framework though the
household utility optimization model. Proceeding under the assumption that families consider the
benefits and costs of having children in choosing family size, the model has been applied to examine
how incentives for large numbers of children change as economies develop. In the early stage of
development, when average incomes are low, having greater numbers of children brings parents high
relative benefits in the form of old age security and extra household income, while the opportunity
costs of parents’ time spent on child-bearing and other indirect costs are low. As economic
development progresses and incomes rise, lower infant mortality and the emergence of public or
employer-based old-age social security systems lower the overall benefit of having many children at
the same time the cost of education and the opportunity cost of parents time (particularly the mothers’
time) increase.
14

Figure 4: Counterfactual GDP per capita for the Philippines – Alternative population growth scenarios
700
900
1,100
1,300
1,500
1,700
1,900
1960 1962 1964 1966 1968 1970 1972 1974 1976 1978 1980 1982 1984 1986 1988 1990 1992 1994 1996 1998 2000 2002 Years
Con
stan
t 199
5 $U
S
Philippines Philippines at China rate of popul. grwth. Philippines at Korea rate of popul. grwth.Philippines at Taiwan rate of popul. grwth. Philippines at Thai rate of popul. grwth.
Sources: Author's calculations based on World Bank (2004), U.S. Bureau of Census International Data Base (2005), and Directorate-General of Budget, Republic of China (2004).
Access to reliable forms of saving that offer higher returns also tends to improve as financial
markets and banking institutions develop along with general economic advancement. As an economy
progresses from a rural agricultural base to a more diverse sectors wherein returns to human capital
are higher, parents’ incentives move toward having fewer children in order to focus human capital
investments in these children so they can secure higher future income streams.
In a simplified static setting, the trade off between having children or consuming other goods
or saving at a higher rate can be represented graphically. In Figure 5, suppose an initial equilibrium is
represented by point A, where household utility is maximized given the relative price between
commodities/savings and children (represented by line a). In the figure, the price of children can be
understood as including both direct and indirect costs of childrearing. A demographic transition from
the second (high birth rate and low mortality rate) to third phase (low birth rate and low mortality
rate) can be represented in the graph as an increase in the opportunity cost of childrearing and an
increase in total household income. The effect of the former is represented by a rotation of the budget
line from a to b, and the latter as an outward parallel shift in the budget line from b to c. Household
preferences for different combination of children and commodities/savings are represented by the
convex indifference curves in the figure. The point of tangency between the budget line and the
indifference curve gives the optimal mix of children and commodities/savings. If the income effect is
15

not too large, the household would typically desire to have a fewer number of children and consume a
greater quantity of commodities (moving from point A to point C) as a result of the economy’s
advancement. The rotation of the budget line (from a to b) is termed the substitution effect and
reduces the number of children desired. The outward shift of the budget line (from b to c), invokes an
‘income effect’ and increases household demand for both children and commodities/savings, but the
new desired number of children (q3) is lower than the initial demand (q1) and the household’s overall
level of satisfaction is higher.
We can apply this simple framework to illustrate the effects of religiously related changes in
preferences on household decision making in this framework. A household that shares the Catholic
principle against birth control would have a preference in favor of larger number of children; therefore,
their indifference curves would be more steeply sloped than non-Catholic household (i.e. at a given
level of utility, greater qualities of commodities of savings would be required for that household to
offset the decline in utility it would suffer from a reduction in the number of children). This has the
effect of shifting the equilibrium toward a larger number of desired children and a smaller amount of
commodities at all price lines and muting the effect of price changes associated with economic
development in terms of reduced family size (see Figure 6). As the economy develops and the
opportunity costs of childrearing rise, households’ incentives to decrease their number of children are
influenced by church doctrine.
Figure 5: Childrearing as household consumption optimization
Children
Commodities/Savings
b a
c
AB
C
q1q2 q3
16

The household’s embrace of the church’s positions changes household preferences and increases the
number of desired children at the expense of household consumption of commodities/savings.
Figure 6: ‘Catholic preferences’ and the response to price
changes associated with development
Children
Commodities/Savings
b a
c
AB
C
A*B*
C*
q1q2 q3
To summarize, lower population growth and economic development can have mutually
reinforcing effects and demographic research highlights the role of changes in the age composition of
population in spurring or slowing economic growth. 9 One contributing factor to the so-called East
Asian miracle was these economies’ demographic transitions. Evidence supporting the opposing
proposition (i.e., that higher population growth leads to greater average wealth in non-agricultural
economies) finds less support in recent empirical research. Population growth appeared to have
fostered faster economic growth in the aftermath of World War II due to a number of unique
circumstances of this period. Labor scarcity that prevailed following war-related fertility and
population declines, the prevailing discrimination against female work outside the home and massive
labor requirements of the post-war rebuilding task contributed to the positive relationship between
population growth and economic growth during this time. But with the rise of industrialization and
9 Ironically, many advanced economies—including some East Asian economies—have experienced rapid demographic transition and have entered the stage where the problem of declining child bearing threatens sustainability of social security system and necessitates government intervention toward increasing incentives for having more children.
17

increased mechanization of manufacturing and agriculture, and the rise in female labor market
participation, the link between the manpower supply and aggregate output has weakened.
High population growth and labor market conditions in the Philippines
The Philippines’ high population growth appears to have adversely influenced the country’s labor
market and productive capacity, and to have contributed to the high and sustained levels of
unemployment and under-employment in the country. Although the labor force participation rate in
the country has shown a very slight decline since 1960 (75% of individuals over the age of 15 were
reported to be in the labor force in 1960 as compared with just under 72% in 2001), the overall
number of workers in the economy has more than tripled over this period. The Philippines’
unemployment rate—measured as employed workers with fewer than 40 hours of work time per week
that expressed a preference for greater hours—has consistently been the highest among the economies
considered in this paper, and has displayed a broadly rising trend. In 1980, the figure was 4.8 but the
latest figure for 2004 is as high as 17.6%.10 Rates of unemployment and underemployment are
particularly high among certain segments of the population (e.g., youths aged 15 to 24 suffer
unemployment at rates that are nearly double those of prime working aged workers).
Reduced labor absorption that accompanies industrialization appears to have exacerbated the
surplus labor apparent in the Philippine economy. This conjecture finds support in the figures
summarized in Table 4, which compares employment elasticity by industry in four Asian economies.
Estimated employment elasticities indicate the weak labor absorption capacity of the industrial sector,
particularly in the Philippines and Indonesia. This may suggest that the Philippines and Indonesia
developed inappropriately capital-intensive industrialization during the years considered on the table.
The relatively high employment absorption by the service sector in the Philippines may also be
considered troubling in that service sector employment generally provides less opportunity for value
adding activities and productivity increasing technical change, and may reflect the large proportion of
informal service workers in the economy.
10 The latest figure is taken from ADB (2005) based on the Philippines labor force survey.
18

Table 4: Employment elasticity by industry
Korea 1963-80
Taiwan 1960-80
Philippines 1960-80
Indonesia 1971-80
Agriculture - 0.044 -0.151 0.325 0.115 Industry 0.148 0.189 0.062 0.048 (Manufacturing) 0.111 0.145 0.049 0.023 Service 0.173 0.189 0.298 0.156 All industries 0.092 0.075 0.228 0.108
(Note) Employment elasticity of the i-th industry is calculated as [G(Li)/G(Yi)]・(Li/L) where G(Li) and G(Yi) are the growth rates of i-th industry’s employment and output, respectively, and (Li/L) is the employment share of the i-th industry. (Source) Watanabe, 1996, p.145, Table 4-1.
Surplus labor in the Philippine economy may also be reflected in the large number of
Filipinos who have emigrated or obtain jobs overseas. According to one recent report, more than 7.5
million Filipinos live or work outside the country (equal to nearly one quarter of the country’s total
labor force) and sent an estimated $8.54 billion in remittances back to the Philippines in 2004 (Lane,
2004). Remittances provide a vital source of foreign exchange and helps finance a private safely net
for families of OCWs. The future availability of employment opportunities abroad for Filipino
workers appears promising due to population aging in many of the richer economies that currently
host large numbers of Philippine OCWs. This favorable outlook appears likely despite greater
competition from would be OCWs from other Asian countries (e.g., China, Indonesia, Thailand, and
Vietnam) and Philippine workers’ disadvantaged access to some markets that have been large markets
for Filipino OCWs (most notably Hong Kong).
Negative impact of rapid population growth on savings, investment, and labor productivity
Slow progress in improving the average level of wealth in the Philippines also appears to have had
negative implications for the level of domestic savings and investment in the country. Figure 7 shows
trends in gross savings per capita. It indicates that the Philippines has gone from being the country
with the highest level of per capita gross savings in 1960 to having among the lowest level of average
savings in 2001. The decline in average savings was dramatic in the early 1960s, and again in the
early 1980s, after which time savings rates have been relatively steady. The negative trend in savings
in the Philippines went against the region’s prevailing trend toward higher per capita savings
observed before the Asian Financial Crisis (1997-98). It appears that the high population growth has
provided at least some of the impetus for the fall in savings by necessitating consumption of
19

economic output to sustain the larger population. Falling savings, in turn, has contributed to the
country’s decline in investment and labor productivity.
Figure 7: Gross savings per capita
0
500
1000
1500
2000
2500
3000
3500
4000
4500
1960
1962
1964
1966
1968
1970
1972
1974
1976
1978
1980
1982
1984
1986
1988
1990
1992
1994
1996
1998
2000
Years
Con
stan
t (19
95) $
US
China Indonesia Korea Malaysia Philippines Taiwan Thailand Vietnam
Source: Author's calculations based on data from Asian Development Bank (various years), World Bank (2004), and US Census Bureau (2004).
Notes: Reported constant values of Gross Domestic Savings in Local Currency Units (LCU) were dvidied bu total population and multiplied by the officialexchange rate to derive the statistics displayed in the figure.
Across the eight countries and 40-year period considered in the figure, higher population
growth was generally associated with lower per capita savings. There was a -0.275 correlation
between per capita savings and population growth and the relation was statistically significant (F-test)
at a 99 percent confidence level. Clearly, other factors including instability in the country’s financial
system, political instability, and resulting capital flight, also help account for the fall in per capita
savings, but although FDI and net income from abroad to the Philippines fluctuated over the period,
these flows appear to only have acted broadly to lessen the decline in gross savings per capita.
As shown in Figure 8, the higher trend line revealed for the Philippines under the other
economies’ scenarios suggests the direct effect of high population growth on average savings.
However, it is important to note that even under the lowest rate of population growth - China’s - the
broad declining in savings per capita in the Philippines would remain.
The declining trend in savings and investment has been associated with stagnation in
Philippine capital formation. As shown in Figure 9, over the past 40 years per capita gross capital
20
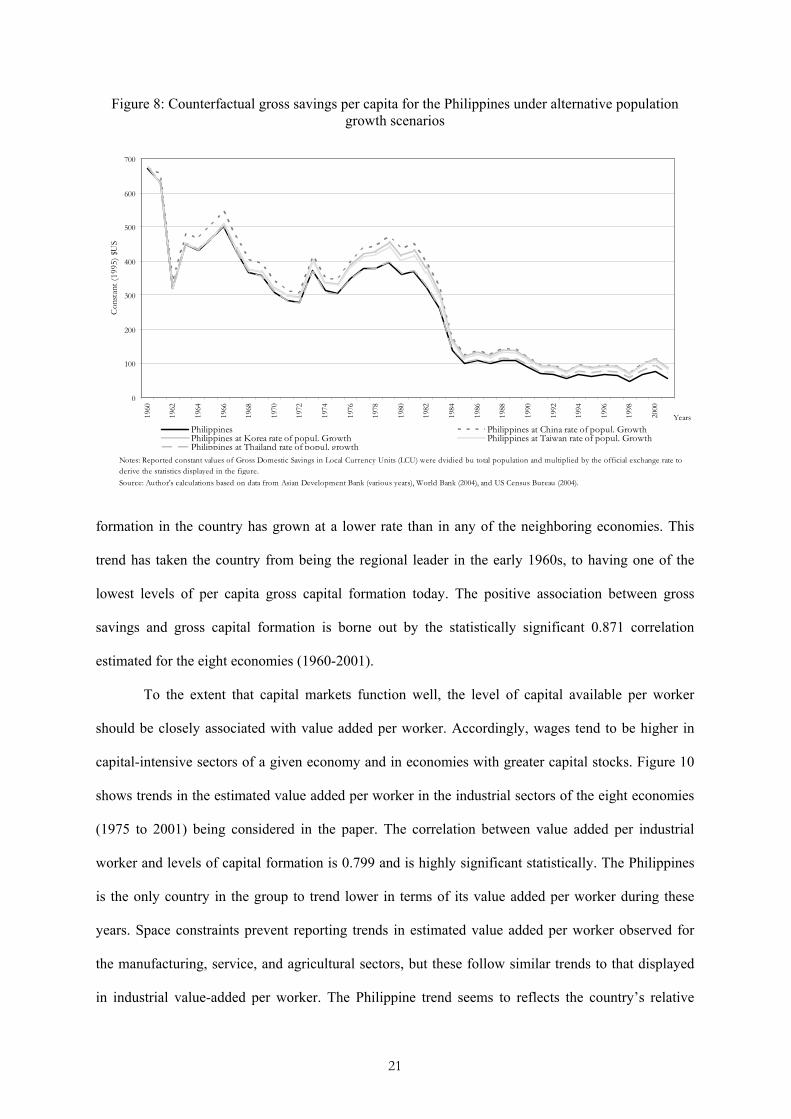
Figure 8: Counterfactual gross savings per capita for the Philippines under alternative population growth scenarios
0
100
200
300
400
500
600
70019
60
1962
1964
1966
1968
1970
1972
1974
1976
1978
1980
1982
1984
1986
1988
1990
1992
1994
1996
1998
2000
Years
Con
stan
t (19
95) $
US
Philippines Philippines at China rate of popul. GrowthPhilippines at Korea rate of popul. Growth Philippines at Taiwan rate of popul. GrowthPhilippines at Thailand rate of popul. growth
Source: Author's calculations based on data from Asian Development Bank (various years), World Bank (2004), and US Census Bureau (2004).
Notes: Reported constant values of Gross Domestic Savings in Local Currency Units (LCU) were dvidied bu total population and multiplied by the official exchange rate toderive the statistics displayed in the figure.
formation in the country has grown at a lower rate than in any of the neighboring economies. This
trend has taken the country from being the regional leader in the early 1960s, to having one of the
lowest levels of per capita gross capital formation today. The positive association between gross
savings and gross capital formation is borne out by the statistically significant 0.871 correlation
estimated for the eight economies (1960-2001).
To the extent that capital markets function well, the level of capital available per worker
should be closely associated with value added per worker. Accordingly, wages tend to be higher in
capital-intensive sectors of a given economy and in economies with greater capital stocks. Figure 10
shows trends in the estimated value added per worker in the industrial sectors of the eight economies
(1975 to 2001) being considered in the paper. The correlation between value added per industrial
worker and levels of capital formation is 0.799 and is highly significant statistically. The Philippines
is the only country in the group to trend lower in terms of its value added per worker during these
years. Space constraints prevent reporting trends in estimated value added per worker observed for
the manufacturing, service, and agricultural sectors, but these follow similar trends to that displayed
in industrial value-added per worker. The Philippine trend seems to reflects the country’s relative
21

decline in per capita capital formation and underlies the lower growth in GDP per capita during these
decades.
Figure 9: Gross capital formation per capita
0
500
1000
1500
2000
2500
3000
3500
4000
4500
5000
1960
1962
1964
1966
1968
1970
1972
1974
1976
1978
1980
1982
1984
1986
1988
1990
1992
1994
1996
1998
2000
Years
Cons
tant
$U
S (1
995)
China Indonesia Korea Malaysia Philippines Taiwan Thailand Vietnam
Source: Author's calculations based on data from Taiwan Statistical Data Book (2004) and World Bank (2003).Notes: Gross capital formation in constant (1995 US$) reported by the World Bank (2003) was divided by population to obtain the statistics reported on this figure.
In terms of social development indicators, the Philippines has generally performed much
better in keeping up with the neighboring economies. While laudable, trends showing recurrent and
rising public deficits and accumulating foreign debt suggest unsustainable levels of debt accumulation
helped enable the Philippines’ social development success. To satisfy the demands for improved
public services of a rapidly increasing population in the face of sluggish growth in the economy and
in public revenues, the government has had to rely on external financing. It is unlikely that the
government can continue to operate this way—with roughly one-third of public revenues currently
going to finance debt service payments and a public deficit equaling roughly 4.6 percent of total GDP
(2003).
Although social development indicators suggest the Philippines has generally kept pace with
its neighbors, growth in the population has also put pressure on scarce public resources and made it
harder for the public sector to deliver quality public services to the growing population. The
Philippine educational system is a case in point. In the 1950’s it was among the best systems in Asia
22

Figure 10: Value added per worker in industry
0
5000
10000
15000
20000
25000
30000
35000
4000019
75
1976
1977
1978
1979
1980
1981
1982
1983
1984
1985
1986
1987
1988
1989
1990
1991
1992
1993
1994
1995
1996
1997
1998
1999
2000
2001 Years
(in c
onst
ant 1
995
US$
)
China Indonesia Korea Malaysia Philippines Thailand Vietnam
Notes: World Bank (2004) provides data on the total value added of principal sectors of the economy from 1960 to 2001, and total employment and the share of employment in eachsector for 1980 to 2001. To calculate the average value added per worker for the period 1960 to 2001, the number of workers in each sector and total employment were estimatedfor 1960 to 1979 through linear extrapolation of employment shares reported for 1980 to 2001, then the total sector value added was divided by the number of workers in eachsector. Source: Author's calculation based on World Bank (2004).
and universities in the country attracted students throughout Asia. Toady, many public primary and
secondary schools have had to resort to teaching two or even three shifts of students each day in order
to accommodate all the students. Philippine colleges and universities must now often devote the first
year of study of new entrants to teach remedial writing and math skills. While Philippine universities
continue to attract students from abroad, they seem to have lost their position of leadership in the
region to universities in Malaysia, Singapore, Thailand, and China.
IV. Summary of Observations
The relatively poor performance of the Philippine economy threatens to fuel dissatisfaction and to
increase support for populist politicians offering more radical policy changes. It also fosters popular
nostalgia for the country’s relatively favorable economic standing in the 1950s and 1960s and the
‘strong man’ politics of the Marcos Regime that dominated Philippine politics during those years.
Post-WWII Philippines federal politics have been dominated by populist personality-based
leadership, and although the attraction of the country’s voters to populist politicians is certainly not
23

unique, the presidential campaigns of former-President Estrada and candidate Fernando Poe Jr.
demonstrated the resurgent strength of populist politicians with Marcos family ties. The electoral
popularity of such populist candidates and the rejection of more established politicians with clearer
leadership qualifications can only be helped by the country’s long relative economic decline.
The analysis in this paper suggests the country’s high rate of population growth has
contributed to the relatively slow economic development and lackluster improvements in the standard
of living of Filipinos during the past four decades. Long term trends toward capital dis-investment
and declining productivity help explain this decline. Public infrastructure appears stretched to
capacity limits across the Philippines’ growing population (e.g., road infrastructure, quality public
education, etc.). Worsening fiscal and debt positions have been associated with successive
devaluations of the Philippine peso, which provide other visible reminders of the country’s relative
economic decline.
Corruption and weak governmental institutions certainly play a large role in the Philippines’
relatively poor economic record during the past several decades. However, the country shares
shortcomings in these areas with most of its neighbors, and expansion of the gap between the
Philippines and its neighbors in the 1980s coincided with the most pronounced division in cross-
country demographic trends.
The past four decades have seen the Philippines reduce its savings rate and its rate of capital
formation per worker, deteriorating the economy’s productivity. In particular, lower savings and
capital formation have led to lower worker productivity in the industrial sector—the sector of the
economy often credited with spurring the export-led growth of more successful economies in the Asia
region. Considered in the light, policies to stem rapid population growth in the country appear central
to the country’s ambitions to spur growth, reduce poverty, and catch up with its neighbors.
Neighboring countries that have embraced family planning have found it easier to undertake serious
economic reforms and to achieve sustained high levels of growth capable of steadily improving their
citizens’ well being. Although family planning policy debacles are numerous in the world,
experiences of neighbor economies offer examples where public and civil action was successful in
24

speeding demographic transition. Moreover, the other problems in the Philippines would be easier to
address, were its population growth rate lower.
V. Prospects for family planning in the Philippines
The chief obstacles to promoting family planning in the Philippines are both social and political. An
estimated 83 percent of the population is self-declared to be Catholic or Protestant (9 percent) and the
country’s religious leaders from both faiths tend to strongly oppose efforts to promote use of
contraceptives or other ‘artificial’ methods of family planning. Church involvement in public affairs
in the Philippines has been longstanding and extensive. It is commonplace for Philippine churches to
provide politically important election endorsements. For example, in the 1998 Presidential election
the support of the evangelical churches “El Shaddai” and “Iglesia ni Cristo” were widely credited
with helping to deliver millions of votes to former-President Estrada. In the 2004 presidential
election, the Iglesia ni Cristo endorsed Arroyo’s candidacy late in the election. Leaders of other
churches made public their support of Arroyo through either public appearances or thinly veiled
statements of support, which undoubtedly helped her to be elected. President Arroyo, like most
Philippine politicians, is a devoted follower of the Catholic faith and opposed all artificial forms of
contraception in running for election. In the 2004 presidential election, only candidate Panfilo 'Ping'
Lacson favored government promotion of family planning, and advocated the adoption of policies to
encourage families to have no more than two children. He garnered less than 10 percent of the
popular vote according to exit polls. In light of these political realities, the outlook for efforts at
family planning in the Philippines seems dire.
Yet one can point to a number of developments in the Philippines that may suggest brighter
prospects for family planning in the country. A number of Philippine NGOs have aggressively and
successfully promoted family planning, and today, many forms of contraception are available at a low
cost in the country. Filipino families have been increasing their contraceptive use over the past
several years. So, in some sense, the demand for artificial contraceptives and use of family planning is
advancing in the country even without government support. For example, Perez and Palmore (1997)
found there was significant unmet need— above what earlier researchers had found— for family
25

planning in the Philippines. A 2004 pre-election survey conducted by the Manila-based polling firm
showed that 82% of the respondents support candidates who favor giving couples a free choice of
family planning methods. This rate represented an increase of 13 percentage points from the figure
obtained in a pre-election poll in 2000 (Pulse Asia Inc., 2004).
The unmet need for family planning in the Philippines is likely driven by the rising
opportunity cost of childrearing—particularly the opportunity cost of prime working aged females.
Table 5 shows that female workers in the country generally have equal or superior education than
men, particularly among workers completing education at the secondary or higher levels. With the
rising educational attainment of Philippine women, the opportunity costs of child-rearing would
naturally be expected to lead to “induced evolution” toward institutions and social norms that are
more accommodating of modern family planning.
Another positive development, which holds the promise of improving economic prospects for
the Philippines in coming decades, relates to foreseen increases in the demand for OCWs from the
country. Recent years have seen the number of OCWs and the value of remittances they send to the
Philippines rise. Projected population ageing in several of the wealthier economies in East Asia is
expected to maintain growth in overseas employment opportunities for Philippine workers and help
alleviate economic pressure from the country’s relatively high rate of population growth.
Table 5: Education indicators (%)
Gross Primary School Enrollment Ratio
Female Male (year)
Gross Secondary School Enrollment Ratio
Female Male (year)
Gross Tertiary School Enrollment Ratio
Female Male (year) China 114 114 (2000) 64 69 (1999) 6 12 (1999)
Indonesia 110 112 (2001) 58 58 (2001) 14 16 (2001) Korea 102 102 (2001) 91 91 (2001) 61 102 (2001)
Malaysia 95 95 (2001) 73 66 (2001) 28 26 (2000) Philippines 111 113 (2001) 86 78 (2001) 35 27 (2001)
Taiwan 101 100 (2000) 100 98 (2002) 86 81 (2002) Thailand 96 100 (2001) 81 85 (2000) 38 35 (2001) Vietnam 100 107 (2001) 67 72 (2001) 9 11 (2001)
Data source: ADB (2004)
Support for family planning among Philippine business leaders appears to be growing as
well. A poll of members of the Makati Business Club (2002)—an influential non-profit business
association in the Philippines—showed 96% of the club’s members were concerned about the size
and growth of the Philippine population. Ninety percent of business leaders surveyed felt that the
26

large and fast-growing population was a detriment to the economy and endorsed government policy
to promote and make available to the public all methods (natural and artificial) of family planning and
birth control.
Recent developments in the ecclesiastical community in the Philippines also give modest
hopes that religious opposition to family planning may be moderating. Philippine Islamic leaders in
Mindanao recently adopted a “Fatwah” (official ruling) in favor of all methods of contraception. This
reversed longtime taboos against discussing sexual matters and prohibitions against contraception
previously understood as emerging from the Koran. What was particularly remarkable about the
Fatwah was its recognition of the alarming maternal and neo-natal health conditions in impoverished
Mindanao and the role of family planning in fostering a stronger Muslim nation socially,
economically, and politically. The retirement of longtime Catholic Cardinal Sin from his post more
than a year ago has left the Philippine Catholic church without its most recognizable public figure and
most ardent opponent of family planning. It may also be significant that in the recent election,
endorsements of key church leaders occurred later in the campaign than in previous elections and
seemed to follow—rather than lead—public opinion.
References Alonzo, R.P. et al (2004). “Population and Poverty: the Real Score”, School of Economics, University of the Philippines, December 2004. Available on-line at: http://www.econ.upd.edu.ph/respub/dp/pdf/DP2004-15.pdf Asian Development Bank (ADB) (2005). Asian Development Outlook 2005. Manila: Oxford University Press. ADB (2004). Key Indicators 2004. Manila. International Monetary Fund (IMF) (2005). “Philippines: Staff Report for the 2004 Article IV Consultation and Post-Program Monitoring Discussions”, Asia and Pacific Department. Washington DC. February 2005. Kelley, A.C. and R.M. Schmidt (2001). “Economic and Demographic Change: A Synthesis of Models, Findings, and Perspectives”, chapter 4 in N. Birdsall, A.C. Kelley and S.W. Sinding, eds. Population Matters: Demographic Change, Economic Growth, and Poverty in the Developing World (New York: Oxford University Press). Lane, K. (20050. “Manila Ponders Securitization of Remittances,” Asian Wall Street Journal, April 28, 2005, p. M-4.
27

28
Makati Business Club. (2002). Business community calls for stronger population and family planning program. Retrieved April 10, 2004. Available at: http://www.mbc.com.ph/economic_research/boss/boss02_population.htm Malthus, T.R. (1798). Population: The First Essay. Reprinted in 1967 by University of Michigan Press, Ann Arbor, MI: Ann Arbor Paperbacks. Mason, A. (1999). Population and Economic Growth in East Asia. East-West Center Working Papers (Population Series), No. 88-25 (November), 54 p. Perez, A.E. & Palmore, J.A. (1997). Reevaluating the unmet need for family planning in the Philippines. Asia-Pacific Population Research Reports (East-West Center Program on Population), No. 10 (April), 16 p. Pulse Asia Inc. (2004). Ulat Ng Bayan Survey on Population & Family Planning. Retrieved April 12, 2004. Available at: http://www.plcpdfound.org/hdl/myths.asp Ray, D. (1998). Development Economics. Princeton University Press. Sison, M. (2003, January 31). “Arroyo steps into birth-control minefield.” Asia Times, January 31, 2003. Solow, R.M. (1956). “A Contribution to the Theory of Economic Growth.” Quarterly Journal of Economics 70(1) February, pp. 65-94. Watanabe, T. (1996). Kaihatsu Keizaigaku: Keizaigaku to Gendai Ajia (Development Economics for Contemporary Asia), Tokyo: Nihon Hyoronsha. World Bank (2004). World Development Indicators (CD-ROM), International Bank for Reconstruction and Development: Washington, D.C. Williamson, J.G. (2001). “Demographic Change, Economic Growth, and Inequality”, chapter 5 in N. Birdsall, A.C. Kelley and S.W. Sinding, eds. Population Matters: Demographic Change, Economic Growth, and Poverty in the Developing World (New York: Oxford University Press). Youngblood, Robert L. (1998). “President Ramos, the Church, and Population Policy in the Philippines.” Asian Affairs vol. 25, issue 1, pp. 3-19.