the ups and downs of gold recycling€¦ · electronics from the 1980s and 1990s is likely in...
TRANSCRIPT
The Ups and Downs of Gold RecyclingUnderstanding Market Drivers and Industry Challenges

The Boston Consulting Group (BCG) is a global management consulting firm and the world’s leading advisor on business strategy. We partner with clients from the private, public, and not-for-profit sectors in all regions to identify their highest-value opportunities, address their most critical challenges, and transform their enterprises. Our customized approach combines deep insight into the dynamics of companies and markets with close collaboration at all levels of the client organization. This ensures that our clients achieve sustainable competitive advantage, build more capable organizations, and secure lasting results. Founded in 1963, BCG is a private company with 81 offices in 45 countries. For more information, please visit bcg.com.
The World Gold Council is the market development organization for the gold industry. Working within the investment, jewelry, and technology sectors, as well as engaging with governments and central banks, our purpose is to provide industry leadership, whilst stimulating and sustaining demand for gold. Based in the UK, with operations in India, the Far East, Europe, and the U.S., the World Gold Council is an association whose members comprise the world’s leading gold mining companies. For more information, please visit gold.org.

March 2015
Alistair Hewitt, Trevor Keel, Matthias Tauber, and Trinh Le-Fiedler
The Ups and Downs of Gold RecyclingUnderstanding Market Drivers and Industry Challenges

2 The Ups and Downs of Gold Recycling
AT A GLANCE
The gold-recycling industry will undergo important changes in the coming years. The World Gold Council and The Boston Consulting Group joined forces to analyze the landscape and identify key themes meriting close attention by industry players.
Drivers of Global Gold RecyclingGold recycling increases over the long run. In the short run, it responds swiftly to changes in the price of gold and to economic shocks. Recycling reached a seven- year low in 2014 and will likely remain low in 2015.
The Technology of Gold RecyclingReclaiming metals, including gold, from end-of-life electronics is more complicated than reclaiming them from high-value sources of recycled gold (primarily jewelry).
The Gold-Recycling IndustryIndustry players face complex challenges as well as opportunities. Challenges include overcapacity and increased competition. The growing volume of electrical and electronic waste offers huge opportunities for the recycling of industrial materials, although the waste that lends itself to gold recycling will constitute only 2 percent of the produced waste volume.
The Boston Consulting Group • World Gold Council 3
Gold has long captured humankind’s imagination. It is malleable, ductile, and corrosion resistant, and it has many uses—from jewelry to technologies
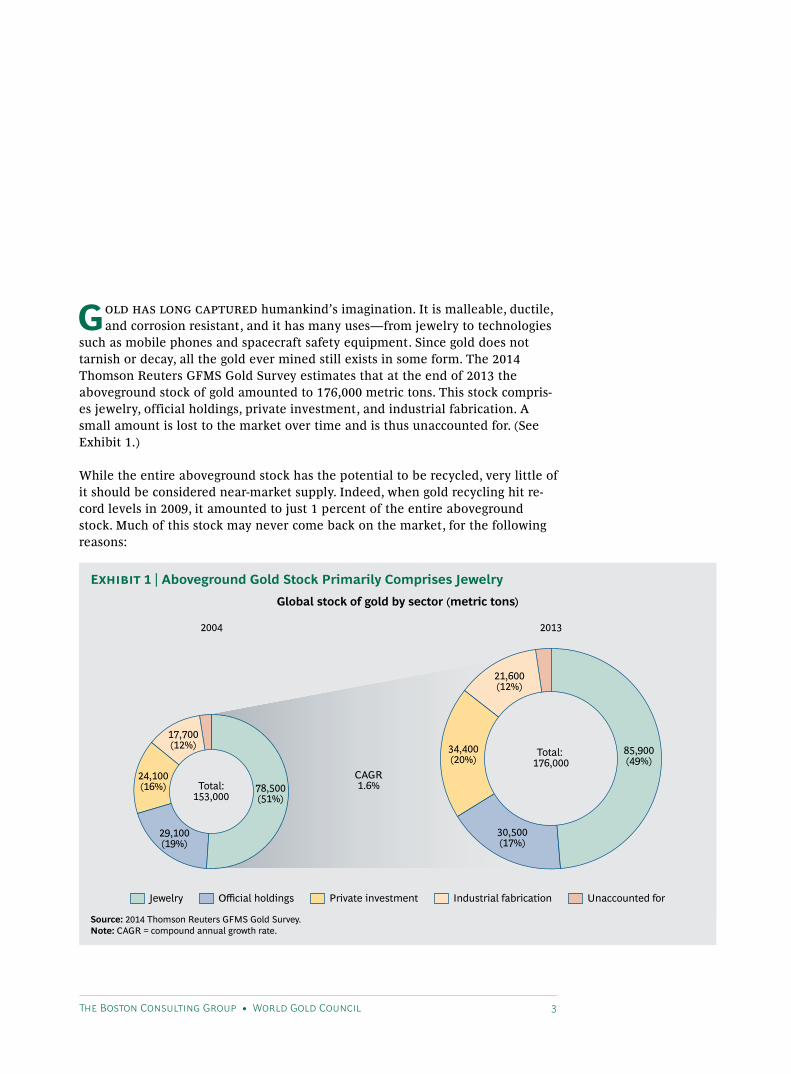
such as mobile phones and spacecraft safety equipment. Since gold does not tarnish or decay, all the gold ever mined still exists in some form. The 2014 Thomson Reuters GFMS Gold Survey estimates that at the end of 2013 the aboveground stock of gold amounted to 176,000 metric tons. This stock compris-es jewelry, official holdings, private investment, and industrial fabrication. A small amount is lost to the market over time and is thus unaccounted for. (See Exhibit 1.)
While the entire aboveground stock has the potential to be recycled, very little of it should be considered near-market supply. Indeed, when gold recycling hit re-cord levels in 2009, it amounted to just 1 percent of the entire aboveground stock. Much of this stock may never come back on the market, for the following reasons:
Global stock of gold by sector (metric tons)
2004 2013
Total:153,000
CAGR1.6%
Total: 176,000
Jewelry Official holdings Private investment Industrial fabrication Unaccounted for
78,500(51%)
85,900(49%)
30,500(17%)
34,400(20%)
21,600(12%)
29,100(19%)
24,100(16%)
17,700(12%)
Source: 2014 Thomson Reuters GFMS Gold Survey.Note: CAGR = compound annual growth rate.
Exhibit 1 | Aboveground Gold Stock Primarily Comprises Jewelry
4 The Ups and Downs of Gold Recycling
• For many people, jewelry has sentimental value and evokes powerful emotions, making them reluctant to part with it.
• Some people’s connection with gold is religious. Much of the gold stored in Indian temples, for example, is viewed as sacred.
• Many investors view gold as an intergenerational asset, to be handed down through families rather than sold.
• Central banks view gold as an important reserve asset, and recent trends suggest they are more likely to buy than sell gold.
• Some people are not aware of the value of gold in their technological devices, and they throw out old mobile phones and computers. Much of the gold in electronics from the 1980s and 1990s is likely in landfills.
Still, thanks to its unique properties, gold lends itself to recycling—so much so that recycled gold accounted for about a third of total supply, on average, from 1995 through 2014.1
The gold-recycling industry comprises two segments, each constituting a unique market with its own value chain:
• High-value recycled gold accounts for roughly 90 percent of the total supply of recycled gold. Although this segment is mostly made up of jewelry, gold bars and coins often get recycled, too.
• Industrial recycled gold makes up the remaining 10 percent, up from less than 5 percent ten years ago. It consists primarily of gold found in waste electrical and electronic equipment (WEEE).2
But what exactly is gold recycling? The World Gold Council, which produced this re-port jointly with The Boston Consulting Group, defines recycled gold as that sold for cash by consumers or other supply-chain players, such as jewelry manufacturers that sell old stock. The definition does not include exchanges of gold for gold—when consumers exchange old jewelry for new pieces at retailers, for example. Nor does it include what the U.S. Geological Survey describes as process, or new, scrap, which is generated during manufacturing. Because of gold’s high value, manufactur-ers strive to recover and reuse such material; it seldom leaves the plant. (If a manu-facturer does sell gold for cash and the gold is processed through a refiner, it is cap-tured in the data for recycled gold.)
Drivers of Global Gold Recycling Gold recycling fluctuates fluidly with gold prices and economic conditions. (See Ex-hibit 2.) In 1999, it accounted for just 17 percent of the total gold supply. In 2009, with higher gold prices and the global economy faltering, recycled gold hit a record 1,728 metric tons, accounting for 42 percent of the total gold supply. When the glob-al financial crisis struck, a new breed of recycling collectors sprang up in Western
Gold lends itself to recycling—so much
so that recycled gold accounted for about a
third of total supply from 1995 through
2014.

The Boston Consulting Group • World Gold Council 5
markets to collect high-value recyclable gold from cash-strapped consumers selling their jewelry. In the U.S., a swarm of cash-for-gold shops descended onto Main Street, many supported by large call centers and big-budget media campaigns. They enjoyed healthy profit margins—for a while. Indeed, in 2009, Cash4Gold.com, a mail-in refinery that snapped up gold, silver, and platinum jewelry, ran a 30-second advertisement during the Super Bowl, a lavishly expensive investment. Just three years later, it filed for bankruptcy. Its fate exemplified the sharp contraction of the cash-for-gold business. And in recent years, as gold prices fell and the global econo-my began recovering, gold recycling decreased: 2014 saw the lowest level of recy-cling since 2007—1,122 metric tons—accounting for just 26 percent of total supply.
Gold recycling’s responsiveness helps keep the global gold market in balance. Mine production, which generates the lion’s share of the total annual gold supply, takes longer to respond to price changes. For example, for 126 mines that started produc-tion during the period from 2004 through 2013, the average development time to production was 17 years.3
To better understand the drivers of gold recycling, the World Gold Council conduct-ed an econometric analysis of annual recycling data from 1980 through 2012.4 It confirmed three major themes:
• The recycled-gold supply increases over time. Over the long run, it grows by 4 percent annually, in part owing to increases in jewelry consumption. According to Thomson Reuters GFMS, the stock of jewelry has grown 2 to 9 percent per year since 1982, standing at nearly 86,000 metric tons as 2013 ended.
• Economic crises boost recycling. When financial crises strike, people turn to gold as
Gold price per ounce ($) Recycled gold (percentage of total gold supply) (%)
0
20
40
60
80
100
0
500
1,000
2004 2012201020082006 2014
1,500
2,000
30%
409 444604
695
872972
1,225
1,5721,669
1,4111,266
27%35% 33% 39%
42% 39% 37% 37%30%
26%
Gold prices Recycled gold
Source: Thomson Reuters GFMS; World Gold Council.
Exhibit 2 | Gold Recycling Rates Reflect Shifts in the Price of Gold

6 The Ups and Downs of Gold Recycling
a liquid asset to raise cash. The Asian financial crisis in the late 1990s boosted recycling by 19 percent, mostly in Asian countries. The 2008-2009 global financial crisis exerted a bigger impact, increasing global recycling by 25 percent. However, the effects of a sharply higher gold price as well as the financial crisis would have been combined over this period. We believe that, in general, financial crises boost gold recycling, over and above a price effect, by about 20 percent.
• Changes in gold price have an immediate but temporary effect. Price changes account for around 75 percent of annual changes in gold recycling once we account for major economic crises. For every 1 percent increase in price in a year, the supply of recycled gold will increase 0.6 percent. If the price stabilizes at this higher level, the increase in recycling will reverse in the following year. This is probably because a price increase flushes out the near-market supply, a dynamic that does not recur the next year.
There are regional differences in gold recycling, too. For example, North America and Europe’s contribution to total recycling grew from 27 percent in 2004 to 43 per-cent in 2011, largely driven by the global financial crisis. Within Asia, as China’s stock of gold has grown, so too has its level of recycling. Meanwhile, India’s level of recycling has remained fairly stable and makes up a remarkably small proportion of its total stock of gold—less than 0.5 percent of the estimated annual 22,000 met-ric tons in India.
We also analyzed country-level data to see how economic conditions and price changes affect a nation’s share of global gold recycling. We found that measures of economic distress, especially the unemployment rate, explained 60 to 65 percent of annual changes in this share. In India, for example, a 1 percent rise in unemploy-ment leads to a 1.3 percent increase in India’s share of global recycled gold.5 Price changes play a less important role, accounting for only about 30 percent of annual changes in a country’s share of global recycled gold.
Taking into account these insights and recent macroeconomic trends, we expect global recycling to remain low in 2015.
The Technology of Gold RecyclingThere are two types of source materials for gold recycling, each with distinct pro-cesses.
High-Value Source Materials. High-value source materials for gold recycling contain a significant proportion of gold alloyed with one or more metals. Separating these metals from one another is relatively straightforward, and the processes available to refiners are all well-established chemical- and physical-separation procedures. Some refiners separate metals simply by heating and melting an alloy. Jewelers can do this themselves on a small scale because little specialist equipment or knowledge is required.
However, such simple procedures are not adequate for refining to the higher levels of purity often required by the industry. To achieve this purity, more complex proce-
Measures of econom-ic distress, especially
the unemployment rate, explain 60 to 65
percent of annual changes in a nation’s
share of global gold recycling.

The Boston Consulting Group • World Gold Council 7
dures have been developed, often relying on chemical reactions. Examples include the aqua regia process, which involves dissolving the alloy in strong acids and then recovering the gold electrolytically through the Wohlwill process, enabling removal of all residual platinum-group metals and thus delivery of extremely pure gold.
Refiners’ choice of method depends on several variables. The desired purity of the output is the first and most important. Gold destined for realloying into new jewel-ry does not need to be refined to the 99.999 percent purity standard, so a company would select a simpler (and cheaper) process. Input quality also matters, as certain alloying metals can negatively affect some processes. (For instance, the aqua regia process cannot be used to efficiently recycle silver-rich alloys.) Finally, availability of chemicals, equipment, and expertise is critical. Some techniques are appropriate only for large-scale refiners.
Industrial Source Materials. Reclaiming metal from WEEE is considerably more complicated than from high-value sources. Gold is used in the electronics industry primarily in the form of thin wires and as a plating metal. In 2010, printed circuit boards and mobile phones contained 200 to 350 grams of gold per metric ton, creating a rich “urban mine” of end-of-life products.6
Yet these materials can contain up to 60 different elements as well as numerous complex and often dangerous chemicals. Plastics and steel tend to dominate by weight, but gold and other precious metals dominate by value. For example, in 2010, gold, palladium, and silver made up an estimated 93 percent of the value of an end-of-life mobile phone.7 Extracting valuable metals from these materials safely and efficiently is difficult. But if managed effectively, WEEE material can make a positive contribution to a “circular economy,” one in which valuable products and resources are reused and recycled.8
Some companies have developed state-of-the-art recovery operations to surmount the challenge of extracting gold and other metals from WEEE material. For exam-ple, Umicore’s plant in Hoboken, Belgium, recovers 17 metals at high yield from a range of waste streams, such as spent catalytic converters and chemical catalysts, industrial materials, and various types of manufacturing waste. The facility uses an eco-efficient process, whereby almost no outputs go to waste.9 Even the slag is used as aggregate, and sulphuric acid (a smelting by-product) is captured and utilized.
Not all recycling operations are run at such high standards, however. The lure of the urban mine, combined with higher precious-metal prices, has driven growth in the unregulated recovery of metals from WEEE. Chemical leaching involving cyanide and aqua regia is sometimes used without proper safeguards, particularly in the de-veloping world. In untrained hands, this is a polluting and inefficient way to recover metals, and it offers no protection from the dangerous chemicals in these source materials.
Numerous agencies and companies are working to resolve problems associated with WEEE recycling, with an eye toward turning challenges into opportunities. WorldLoop, for example, cooperates with recycling companies to train African en-trepreneurs to establish environmentally sound solutions for WEEE collection and
Only 15 to 20 percent of WEEE is recycled; the rest goes straight into landfills and incinerators.
8 The Ups and Downs of Gold Recycling
dismantling. Thanks to these partnerships, numerous African countries now have sustainable operations. To date, these operations have collectively dismantled more than 1,000 metric tons of WEEE and have sent more than 25 metric tons of circuit boards to high-standard recycling sites.
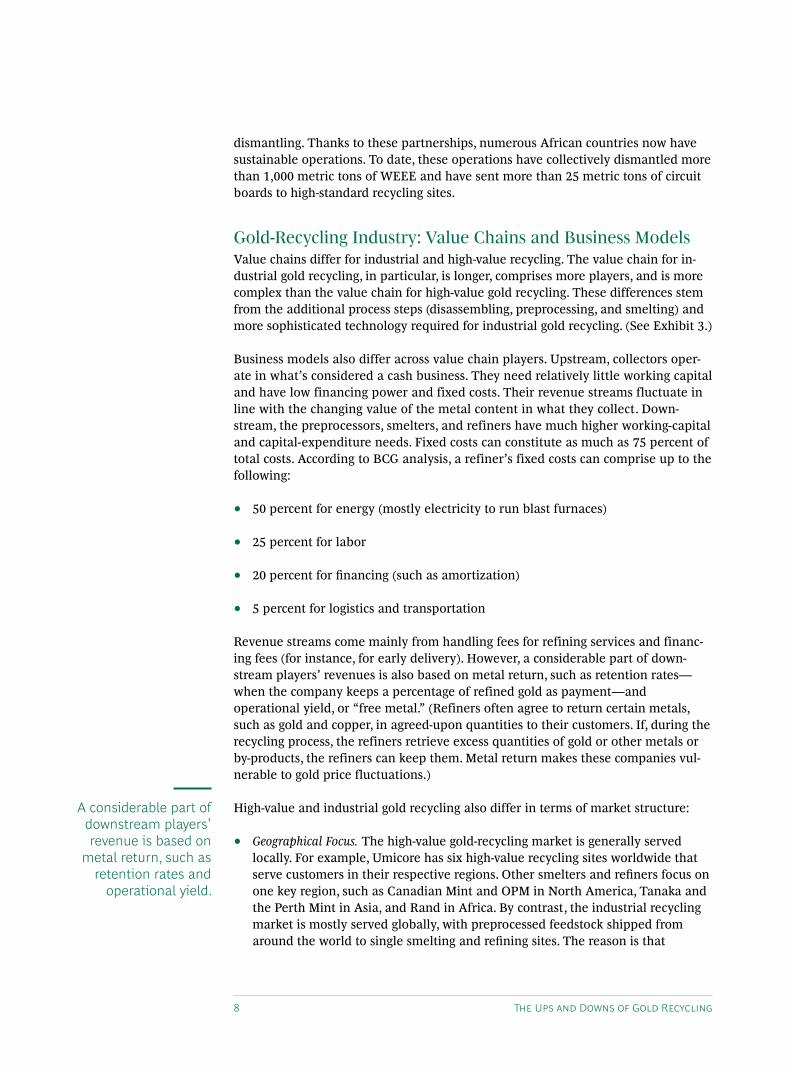
Gold-Recycling Industry: Value Chains and Business ModelsValue chains differ for industrial and high-value recycling. The value chain for in-dustrial gold recycling, in particular, is longer, comprises more players, and is more complex than the value chain for high-value gold recycling. These differences stem from the additional process steps (disassembling, preprocessing, and smelting) and more sophisticated technology required for industrial gold recycling. (See Exhibit 3.)
Business models also differ across value chain players. Upstream, collectors oper-ate in what’s considered a cash business. They need relatively little working capital and have low financing power and fixed costs. Their revenue streams fluctuate in line with the changing value of the metal content in what they collect. Down-stream, the preprocessors, smelters, and refiners have much higher working-capital and capital-expenditure needs. Fixed costs can constitute as much as 75 percent of total costs. According to BCG analysis, a refiner’s fixed costs can comprise up to the following:
• 50 percent for energy (mostly electricity to run blast furnaces)
• 25 percent for labor
• 20 percent for financing (such as amortization)
• 5 percent for logistics and transportation
Revenue streams come mainly from handling fees for refining services and financ-ing fees (for instance, for early delivery). However, a considerable part of down-stream players’ revenues is also based on metal return, such as retention rates—when the company keeps a percentage of refined gold as payment—and operational yield, or “free metal.” (Refiners often agree to return certain metals, such as gold and copper, in agreed-upon quantities to their customers. If, during the recycling process, the refiners retrieve excess quantities of gold or other metals or by-products, the refiners can keep them. Metal return makes these companies vul-nerable to gold price fluctuations.)
High-value and industrial gold recycling also differ in terms of market structure:
• Geographical Focus. The high-value gold-recycling market is generally served locally. For example, Umicore has six high-value recycling sites worldwide that serve customers in their respective regions. Other smelters and refiners focus on one key region, such as Canadian Mint and OPM in North America, Tanaka and the Perth Mint in Asia, and Rand in Africa. By contrast, the industrial recycling market is mostly served globally, with preprocessed feedstock shipped from around the world to single smelting and refining sites. The reason is that
A considerable part of downstream players’ revenue is based on
metal return, such as retention rates and
operational yield.

The Boston Consulting Group • World Gold Council 9
industrial recycling requires large sites and complex equipment, so recyclers consolidate their operations in one location to serve the global market.
• Operational Scale and Flexibility. High-value gold recycling requires relatively small, simple processing equipment, which allows for more flexible on-off operations. Meanwhile, the large blast furnaces required for smelting of recycla-ble WEEE must be operated around the clock to ensure high rates of equipment utilization. As a result, smelters have difficulty quickly adapting their operations to changes in feedstock volume and quality, making it ideal to have high-quality feedstock flowing continuously into their plants. However, smelters have an advantage if they can accept lower-quality stock to trade off lower yields and lower feedstock cost to maximize profitability. Capital expenditure is highest for base-metal smelters, followed by refiners and preprocessors.
• Market Maturity and Drivers. Industrial gold recycling is a much smaller and younger industry than high-value gold recycling and is driven primarily by legislation. The industry originated with implementation of the Electric House-hold Appliance Recycling Law in Japan in 2001 and the Waste Electrical and Electronic Equipment Directive in Europe in 2003. Recycling of industrial materials happened before those dates, but the legal frameworks helped “professionalize” the industry by defining collection rate requirements—which led to reliable forecasts of upcoming feedstock.
Thanks to these early laws, the European and Japanese industrial-recycling markets are more mature than the North American market. Only 28 U.S. states
• Consumers (private or institutional)• Jewelry manufacturers
• Pawn shops• “Chain” collectors
• Regional and national B2B collectors • Integrated or specialized refiners
SupplyHigh-value
goldrecycling
Consolidationlevel (European market)
RefiningCollection andtransport Intermediaries (in some markets)
• Consumers• Corporations (example: In the U.S., corporations account for up to 75 percent of collection)
• Municipalities• Nongovernmental organizations• Retailers and electronics manufacturers
• Domestic recyclers • Base-metal smelters, integrated smelters and refiners, or specialized “e-scrap” recyclers
• Integrated refiners
Supply
Industrialgold
recycling
RefiningCollection andtransport
Sampling andpreprocessing Smelting
~10,000collecting
~1,000dismantling
~7 smeltingand refining
Source: BCG analysis.
Exhibit 3 | Value Chains Differ for Industrial and High-Value Gold Recycling
10 The Ups and Downs of Gold Recycling
have introduced legislation to regulate used-electronics products, and this legislation varies in rigor. (California has the most comprehensive framework, while other states do not impose mandatory take-back standards at all.) Cur-rently, the only smelting and refining capacity in North America is provided by Glencore in Canada. For similar reasons, the industrial recycling industries in China, India, and South America are immature. Such countries have large, informal recycling sectors characterized by backyard smelting.
Despite the above-described differences, high-value and industrial gold recycling share similarities. In both industries, relationships are built on reputation, customer loyalty, and operational excellence. A collector or preprocessor chooses its smelters and refiners based on past experience, assaying accuracy, and value-added services, such as metal management and financing, rather than price only. But even though price is not a key selection criterion, getting the pricing right to ensure margin is vi-tal for all participants.
The Organisation for Economic Co-operation and Development’s Due Diligence Guidance for Responsible Supply Chains of Minerals from Conflict-Affected and High-Risk Areas has influenced how refiners do business. Refiners accredited by the London Bullion Market Association (LBMA) or certified by the Responsible Jewellery Council (RJC) cannot accept a new source of gold without first going through a comprehensive certification process outlined in the refiners’ responsi-ble-practice documentation.10 Some refineries, particularly in the Far East, may not be LBMA-accredited or RJC-certified because they are small or involved primarily in closed-loop selling, such as refineries owned by electronics companies supplying high-specification material for their own business needs. The increased interna-tionalization of the gold market, however, coupled with higher regulatory scrutiny of the responsible sourcing of metals (such as section 1502 of the U.S. Dodd-Frank Act), is enhancing transparency in the market and fueling a push for certification of large-scale refineries.
Challenges and OpportunitiesA number of significant challenges in the gold-recycling industry also present a wealth of opportunities.
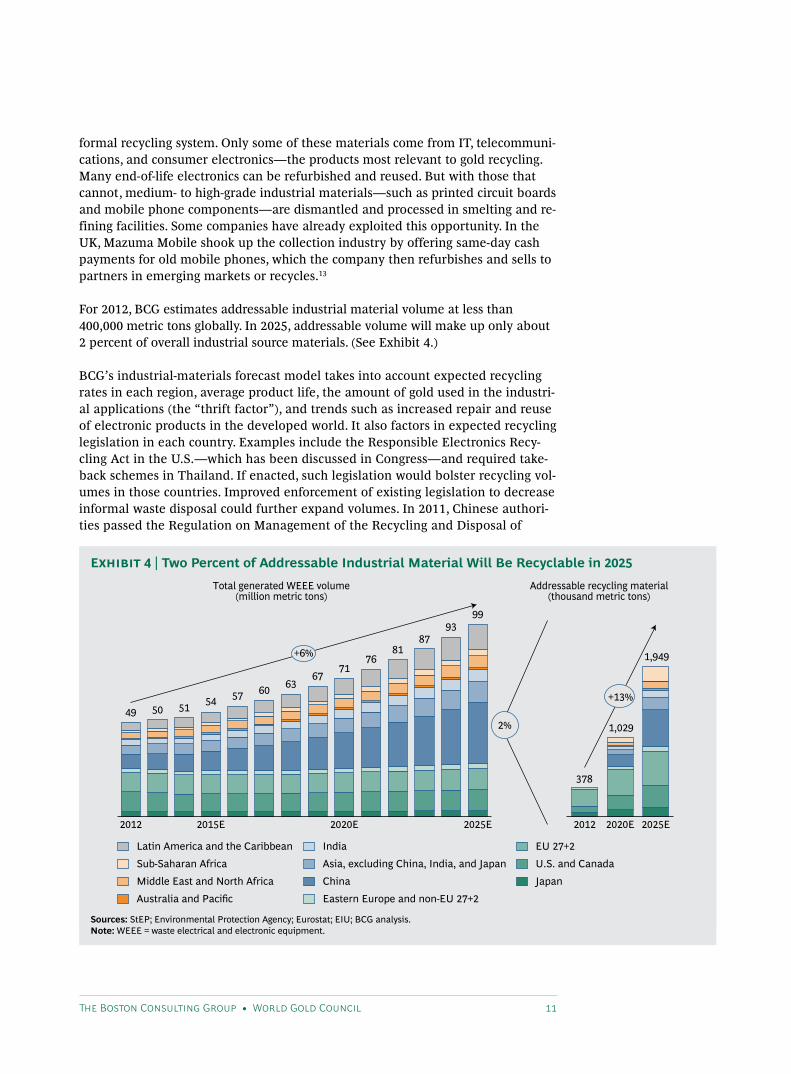
Expanding WEEE Volumes. Thanks to rising global consumer-electronics sales and ever-shorter product life cycles, the volume of industrial materials produced will expand. Mobile phone sales are expected to grow from 1.75 billion units in 2011 to 2.2 billion in 2017, and tablet sales will grow from 0.1 billion units to 0.5 billion in the same period.11 According to BCG’s industrial-materials forecast model—which is built on the United Nations’ global WEEE estimate for 2012—the global volume of WEEE (including large household appliances) could grow by 6 percent annually, from 49 million metric tons in 2012 to 99 million metric tons in 2025.12
Although this volume seems large, the amount of industrial material that is ad-dressable—that lends itself to gold recycling through smelting and refining—is rather small. The source materials have to be collected and then brought into the
Despite differences between high-value
and industrial gold recycling,
relationships in both industries are built on reputation, customer
loyalty, and operation-al excellence.
The Boston Consulting Group • World Gold Council 11
formal recycling system. Only some of these materials come from IT, telecommuni-cations, and consumer electronics—the products most relevant to gold recycling. Many end-of-life electronics can be refurbished and reused. But with those that cannot, medium- to high-grade industrial materials—such as printed circuit boards and mobile phone components—are dismantled and processed in smelting and re-fining facilities. Some companies have already exploited this opportunity. In the UK, Mazuma Mobile shook up the collection industry by offering same-day cash payments for old mobile phones, which the company then refurbishes and sells to partners in emerging markets or recycles.13
For 2012, BCG estimates addressable industrial material volume at less than 400,000 metric tons globally. In 2025, addressable volume will make up only about 2 percent of overall industrial source materials. (See Exhibit 4.)
BCG’s industrial-materials forecast model takes into account expected recycling rates in each region, average product life, the amount of gold used in the industri-al applications (the “thrift factor”), and trends such as increased repair and reuse of electronic products in the developed world. It also factors in expected recycling legislation in each country. Examples include the Responsible Electronics Recy-cling Act in the U.S.—which has been discussed in Congress—and required take-back schemes in Thailand. If enacted, such legislation would bolster recycling vol-umes in those countries. Improved enforcement of existing legislation to decrease informal waste disposal could further expand volumes. In 2011, Chinese authori-ties passed the Regulation on Management of the Recycling and Disposal of
Latin America and the Caribbean
Sub-Saharan Africa
Middle East and North Africa
Australia and Pacific
India EU 27+2
U.S. and Canada
JapanChina
Eastern Europe and non-EU 27+2
Asia, excluding China, India, and Japan
49 50 51 54 57 60 6367
7176
8187
93
378
1,029
1,949
99
2012 20122015E 2020E 2020E2025E 2025E
Total generated WEEE volume(million metric tons)
Addressable recycling material (thousand metric tons)
+6%
+13%
2%
Sources: StEP; Environmental Protection Agency; Eurostat; EIU; BCG analysis.Note: WEEE = waste electrical and electronic equipment.
Exhibit 4 | Two Percent of Addressable Industrial Material Will Be Recyclable in 2025
12 The Ups and Downs of Gold Recycling
Waste Electrical and Electronic Equipment, which resembles the EU’s WEEE Di-rective. (China has also signed the Basel Convention, limiting the export of non-hazardous waste.) However, the new regulation in China has not yet been en-forced. In the event that it becomes enforced, more industrial waste could find its way into the formal recycling system, contributing about 30 percent of total global WEEE by 2025.
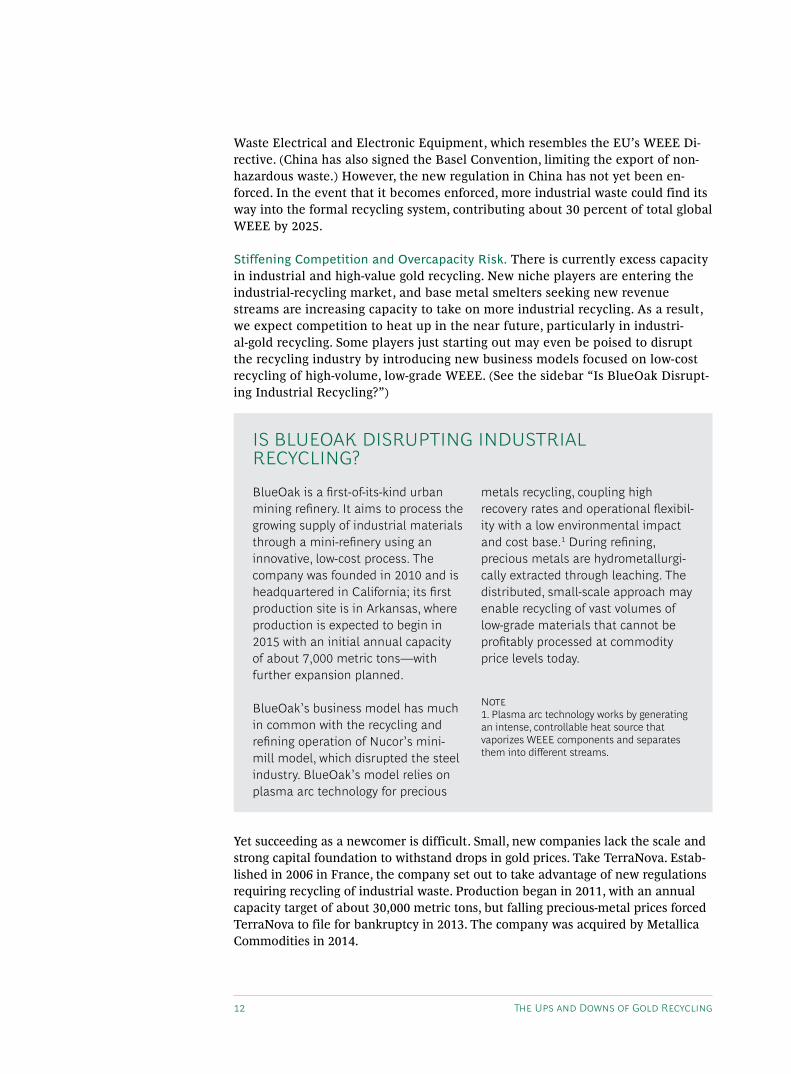
Stiffening Competition and Overcapacity Risk. There is currently excess capacity in industrial and high-value gold recycling. New niche players are entering the industrial-recycling market, and base metal smelters seeking new revenue streams are increasing capacity to take on more industrial recycling. As a result, we expect competition to heat up in the near future, particularly in industri-al-gold recycling. Some players just starting out may even be poised to disrupt the recycling industry by introducing new business models focused on low-cost recycling of high-volume, low-grade WEEE. (See the sidebar “Is BlueOak Disrupt-ing Industrial Recycling?”)
Yet succeeding as a newcomer is difficult. Small, new companies lack the scale and strong capital foundation to withstand drops in gold prices. Take TerraNova. Estab-lished in 2006 in France, the company set out to take advantage of new regulations requiring recycling of industrial waste. Production began in 2011, with an annual capacity target of about 30,000 metric tons, but falling precious-metal prices forced TerraNova to file for bankruptcy in 2013. The company was acquired by Metallica Commodities in 2014.
BlueOak is a first-of-its-kind urban mining refinery. It aims to process the growing supply of industrial materials through a mini-refinery using an innovative, low-cost process. The company was founded in 2010 and is headquartered in California; its first production site is in Arkansas, where production is expected to begin in 2015 with an initial annual capacity of about 7,000 metric tons—with further expansion planned.
BlueOak’s business model has much in common with the recycling and refining operation of Nucor’s mini-mill model, which disrupted the steel industry. BlueOak’s model relies on plasma arc technology for precious
metals recycling, coupling high recovery rates and operational flexibil-ity with a low environmental impact and cost base.1 During refining, precious metals are hydrometallurgi-cally extracted through leaching. The distributed, small-scale approach may enable recycling of vast volumes of low-grade materials that cannot be profitably processed at commodity price levels today.
Note1. Plasma arc technology works by generating an intense, controllable heat source that vaporizes WEEE components and separates them into different streams.
Is BLUEOAk DIsRUPTING INDUsTRIAL RECyCLING?

The Boston Consulting Group • World Gold Council 13
In addition to the newer entrants, some established companies—particularly base-metal smelters—have invested heavily to expand capacity for industrial-mate-rials recycling. Aurubis, for instance, invested €62.5 million in 2011 to ramp up ca-pacity from 75,000 metric tons to 140,000 metric tons. Boliden dedicated €200 mil-lion in capital expenditure to boost its recycling capacity from 45,000 metric tons to 120,000 metric tons per year.
Thanks to these and other expansion moves, global capacity for WEEE recycling leaped from an estimated 337,000 metric tons in 2008 to 600,000 metric tons in 2014. Currently planned expansion projects could drive capacity to 690,000 metric tons by 2018. BCG analysis suggests a high risk of overcapacity in the next two to three years, because the supply of industrial recyclable materials is estimated at only about 442,000 metric tons in 2014—considerably lower than total capacity. Nevertheless, we expect that addressable recycling materials volume will outstrip capacity by 2018. (See Exhibit 5.)
In high-value gold recycling, BCG industry analysis suggests up to a 40 percent idle-capacity rate. Such recycling has boomed in recent years, thanks to consum-ers’ increased jewelry recycling. And with recent growth in bar and coin demand, refiners have profited from turning gold into investment-grade bars and coins. Un-til 2013, refiners had a steady stream of business producing LBMA “good delivery” bars to meet institutional investors’ demand, including from exchange-traded funds. And in 2013, as global gold-bar and -coin demand soared and gold flowed from West to East, refiners processed gold into bars and coins for consumers in In-dia, China, and Southeast Asia. For a while, there were even bottlenecks in the val-ue chain as refining capacity was exhausted. However, the decrease in high-value recycling and investment demand in 2014 has resulted in major underutilization of refining capacity in the current market. But as noted above, high-value recyclers have more operational flexibility to adjust to volume changes than industrial recy-clers do.
0
500
1,000Estimated overcapacity
1,500Thousand metric tons
2012 2013 2014 2015 2016 2017 2018 2019 2020 2021 2022
Addressable recycling material Capacity estimate
378
560413
590442
600511
617 594 652 684 685784
685
899
685
1,0291,175
1,337
685 685 685
Sources: Eurostat; company websites (XStrata, Boliden, and Umicore); Berenberg Report 2012; Namias Report 2013; expert estimates; BCG analysis.
Exhibit 5 | WEEE Recycling Overcapacity Will Persist Through 2017

14 The Ups and Downs of Gold Recycling
Margin Pressure from Lower Precious-Metal Prices. Short-term decreases in pre-cious-metal prices have squeezed margins along the recycling value chain, spurring consolidation among collectors and intermediaries. The price of gold dropped from peak levels of $1,920 per ounce in 2011 to about $1,200 per ounce in December 2014. Numerous upstream players (pawn shops, collectors, preprocessors, interme-diaries), especially newer entrants, have struggled to stay in business.
Moreover, industrial material for recycling has become commoditized. Much of it is now categorized and standardized—making selling prices and sampling processes transparent. Consequently, purchasing prices for such material are expected to con-tinue to rise. If they do, recyclers will have an even harder time adding value from their processes. For example, intermediaries in the U.S. make a profit of just half a cent to one cent per pound of WEEE. These margins are expected to tighten further.
Electronics: Rising Complexity and Shrinking Gold Content. Electronic products are growing ever more complex. Devices are smaller than ever, and manufacturers are increasingly substituting other metals for gold. Although gold made up 90 percent of bonding wires in 2008, it now constitutes just 50 percent. From 2004 through 2014, the gold content in printed circuit boards fell by roughly 40 percent per metric ton, according to our analysis, which is based on industry experts’ estimates. To extract the same amount of gold from electronic products as they did previously, recyclers will have to process larger volumes of WEEE.
Shifting Center of Gravity for the Supply of Recyclable Gold. The center of gravity for gold recycling will shift east as Asia’s stock of gold keeps growing. India’s and China’s gold-jewelry consumption rose from 28 percent of the global total in 2004 to 60 percent in 2014, as populations expanded and household incomes rose. In China, regulatory changes opened up the gold market. We expect India and China—and Asia more generally—to remain major centers of global gold demand.
Given these trends, local competition for gold-recycling business could heat up in Asia. The lack of (or failure to enforce) environmental regulations in the region has created a huge, informal, and very cheap recycling market. Western players with highly advanced but expensive recycling processes could find it difficult to compete in this arena. However, these regions could present opportunities for Western recy-clers if stricter regulations result in a need for cleaner and more sophisticated recy-cling processes.
Strategies for Success. It is beyond the scope of this report to detail the best-in-class strategic approaches that will allow each industry player to address the challenges and opportunities in the gold-recycling industry. However, we have identified broad strategic considerations in three key areas:
• Building Scale Through M&A. As we noted earlier, the upstream market is a cash business driven by local conditions—including customer behavior, environmen-tal regulations, and collection infrastructure. Thus, the economies of scale gained by M&A and global consolidation have only limited relevance for these businesses. However, for downstream players such as regional and global smelters and refiners, M&A can provide the portfolio diversification needed for
The center of gravity for gold recycling will
shift east as Asia’s stock of gold keeps
growing.

The Boston Consulting Group • World Gold Council 15
companies to weather metal price fluctuations. It can also help them secure a stable supply of feedstock on a global scale as well as profit from cost synergies gained through reductions in overlapping activities and markets.
• Managing Overcapacity. Given the threat of overcapacity, companies must boost the value provided to customers while also securing their bottom lines. They can do so by maximizing efficiency and effectiveness in their operations. Smelters and refiners can learn much about this approach from the value-in-use operat-ing models adopted by industries facing similar overcapacity challenges, such as steel and shipping.14 In particular, they should reconfigure their operating models to achieve maximum efficiency in energy usage, higher operational stability, faster output time, and higher operational yield—rather than trying to achieve maximum capacity utilization. This will have the desired side effect of limiting collective overcapacity in the industry.
• Minimizing Reputational Risk. In gold recycling, an impeccable reputation is critical for cultivating enduring customer relationships and securing supply—es-pecially in the current challenging market. Companies that adopt a transparent and risk-managed pricing mechanism to minimize reputational risks while getting their pricing right will have the best chance of riding out the coming ups and downs in the gold-recycling market.
Recycled gold forms a large part of the total gold supply. Although the vol-ume of recycled gold increases over the long term, in the short run it responds
quickly to changes in prices and economic shocks. In 2014, gold recycling fell to its lowest level in seven years, and we expect it to remain low throughout 2015. The World Gold Council’s econometric analysis presented in this paper provides indus-try participants and gold market analysts a framework for thinking about how gold recycling will evolve over time.
Meanwhile, industry players—whether in the high-value or industrial recycling seg-ment—face a complex blend of challenges (particularly overcapacity) and opportu-nities. What’s more, while industrial waste volumes may be increasing (total vol-ume could grow by 6 percent annually in the foreseeable future), addressable volume (which is relevant for the recycling industry) will likely make up only about 2 percent of overall industrial source materials for gold recycling. Given these chal-lenges, BCG believes that companies will need to rethink their competitive strate-gies and operating models.
Notes1. Total supply is defined as mine production, recycling, and net producer hedging.2. Unless otherwise stated, we use “WEEE” in this report according to the definition used in the EU WEEE Directive 2002/96/EC.3. SNL Metals & Mining Report, “Strategies for Gold Reserves Replacement,” June 2014.4. Conducted with Avinash Persaud, chairman of Intelligence Capital, a financial advisory company based in London.
Given the threat of overcapacity, compa-nies must boost the value provided to customers while securing their bottom lines.

16 The Ups and Downs of Gold Recycling
5. For another perspective on country-level recycling, see “Turkey: Gold in Action,” World Gold Council, 2015.6. M. Grehl and U. Sehrt, eds., Precious Materials Handbook, Umicore, 2012.7. Christopher W. Corti and Christian Hageluken, “Recycling of Gold from Electronics: Cost-Effective Use through ‘Design for Recycling,’” Gold Bulletin, Volume 43, Number 3, September 2010; http://link.springer.com/article/10.1007%2FBF03214988; http://link.springer.com/article/10.1007%2FB-F03214988#page-1. 8. For more details, see www.ellenmacarthurfoundation.org; http://www.technology.matthey.com/article/56/4/267-270/.9. See http://www.preciousmetals.umicore.com/PMR/Process/.10. www.lbma.org.uk/assets/market/gdl/RGG20130118_v5.pdf and www.responsiblejewellery.com/files/G003_2012_RJC_CoC_Cert_Handbook_PM.pdf.11. Gartner Information Research: www.gartner.com/newsroom/id/2408515.12. United Nations University research (Prof. Huisman Research) as published by Jaco Huisman in the 2012-2013 annual report of the StEP initiative; http://www.step-initiative.org/files/step/StEP_AR/StEP_AR.html. 13. Ellen MacArthur Foundation, www.ellenmacarthurfoundation.org/case_studies/mazuma-mobile.14. See Coping with Overcapacity: Navigating Steel’s Capacity Conundrum, BCG Focus, October 2014.
The Boston Consulting Group • World Gold Council 17
About the AuthorsAlistair Hewitt is head of market intelligence at the World Gold Council. you may contact him by e-mail at [email protected].
Trevor Keel is head of technology at the World Gold Council. you may contact him by e-mail at [email protected].
Matthias Tauber is a partner and managing director in the Munich office of The Boston Consult-ing Group. you may contact him by e-mail at [email protected].
Trinh Le-Fiedler is a principal in BCG’s Munich office. you may contact her by e-mail at [email protected].
AcknowledgmentsThe authors would like to acknowledge the BCG team that contributed to this report, including konrad von szczepanski, Martin Feth, Christian Niebuhr, and stephen Amery. They would also like to acknowledge the World Gold Council team—Johan Palmberg, Louise street, and krishan Go-paul—as well as Andrew Leyland (GFMs, Thomson Reuters) and Christina Meskers (Umicore). The authors would also like to thank Lauren keller Johnson for her writing assistance, as well as kather-ine Andrews, Gary Callahan, sarah Davis, kim Friedman, Abby Garland, and sara strassenreiter for their help with editing, design, and production.
For Further ContactIf you would like to discuss this report, please contact one of the authors.

To find the latest BCG content and register to receive e-alerts on this topic or others, please visit bcgperspectives.com.
Follow bcg.perspectives on Facebook and Twitter.
© The Boston Consulting Group, Inc. 2015. All rights reserved.3/15