the upper san marcos river watershed protection plan
TRANSCRIPT

THE UPPER SAN MARCOS RIVERWATERSHED PROTECTION PLANAUs 1814_01, 1814_02, 1814_03, and 1814_04

September 2018
601 University Drive, San Marcos TX 78666512.245.9200 | [email protected] | www.MeadowsWater.org
THE UPPER SAN MARCOS RIVERWATERSHED PROTECTION PLANAUs 1814_01, 1814_02, 1814_03, and 1814_04

ii The Meadows Center for Water and the Environment
ACKNOWLEDGMENTSThe Upper San Marcos Watershed Protection Plan was a collaborative effort, resulting from many hours of hard work and the diligence, perseverance, and vision of stakeholders and partners. While proper recognition of every person and organization that contributed to this planning process is not possible, the San Marcos Wa-tershed Initiative Stakeholder Committee and The Meadows Center for Water and the Environment gratefully acknowledge that this effort would not have been possible without the level of community involvement and dedication provided. We thank these individuals and organizations for their outstanding contributions of time, effort, and commitment to the development of the Upper San Marcos Watershed Protection Plan.
Special Thanks to:• The San Marcos Watershed Initiative Stakeholders, Committee and Subcommittee Members• Texas Commission on Environmental Quality• United States Environmental Protection Agency• Texas State Soil Water Conservation Board• Texas A&M AgriLife Extension Service• Guadalupe-Blanco River Authority• City of San Marcos• Hays County• Hays County Tax Appraisal District• Comal County Tax Appraisal District• United States Department of Agriculture Natural Resource Conservation Service • Edwards Aquifer Authority• Texas State University• San Marcos River Foundation• San Marcos Greenbelt Alliance• The Nature Conservancy of Texas• Tim Osting, Aqua Strategies• Tom Hegemier, Alan Plummer and Associates• Lisa Arceneaux, Environmental Engineer• Melani Howard• John Gleason & the Water Quality Protection Plan Team• Mary Van Zant• Kristina Tolman• And many others dedicated to the protection of the San Marcos River
Funding for this effort was provided through a federal Clean Water Act §319(h) grant from the U.S. Environ-mental Protection Agency, administered by the Texas Commission on Environmental Quality.

The Upper San Marcos Watershed Protection Plan iii
LIST OF ACRONYMS AND ABBREVIATIONSAC-FT Acre Feet
BMP Best Management Practices
BSEACD Barton Springs/Edwards Aquifer Conservation District
BST Bacterial Source Tracking
cfu colony forming units
Cl-1 Chloride
COSM City of San Marcos
CRP Clean Rivers Program
CWA Clean Water Act
DO Dissolved Oxygen
EAA Edwards Aquifer Authority
EAHCP
EARZ Edwards Aquifer Recharge zone
E. coli Escherichia coli
e.g. Exempli Gratia (“for example”)
E&O Education and Outreach
EMC Event Mean Concentration
EPA Environmental Protection Agency
ETJ Extraterritorial Jurisdiction
ft(2 or 3) Foot(squared or cubed)
GBRA Guadalupe-Blanco River Authority
HHW Household Hazardous Waste
HSPF Hydrological Simulation Program - Fortran
HTGCD Hays Trinity Groundwater Conservation District
IH-35 Interstate Highway 35
IPM Integrated Pest Management
lbs Pounds
LDC Land Development Code
LID Low Impact Development
MGD Million Gallons per Day
mg/L Milligrams Per Liter
mi(2) square miles
ml Milliliter
MPN Most Probable Number
MS4 Municipal Separate Storm Sewer System
NELAP National Environmental Laboratory Accreditation Program
NEMO Nonpoint Education for Municipal Officials
NGO Non-Governmental Organization
NH3-N Ammonia Nitrogen
NOAA National Oceanic and Atmospheric Administration
NRCS Natural Resource Conservation Service
OSSF On-site Sewage Facility
pH Potential of Hydrogen
PPCP Pharmaceutical and Personal Care Product
PSA Public Service Announcement
QAPP Quality Assurance Project Plan
SELECT Spatially Explicit Load Enrichment Calculation Tool
SIPES Social Indicator Planning & Evaluation System
SMGA San Marcos Greenbelt Alliance
SMRC San Marcos River Corridor
SMRF San Marcos River Foundation
SMTX San Marcos, Texas
SMWI San Marcos Watershed Initiative
SSURGO Soil Survey Geographic Database
SO4 -2 Sulfate
TAC Texas Administrative Code
TCEQ Texas Commission on Environmental Quality
TDS Total Dissolved Solids
TKN Total Kjeldahl Nitrogen
TN Total Nitrogen
TP Total Phosphorus
TPWD Texas Parks and Wildlife Department
TSS Total Suspended Solids
TSSWCB Texas State Soil and Water Conservation Board
TST Texas Stream Team
USDA U.S. Department of Agriculture
USFWS U.S. Fish and Wildlife Service
USGS U.S. Geological Survey
WPP Watershed Protection Plan
WQPP Water Quality Protection Plan
WWTF Waste Water Treatment Facility

1 The Meadows Center for Water and the Environment
List of Figures 3
List of Tables 4
Nine Element Crosswalk 5
1 Introduction to the Watershed 7
The Watershed Approach to Planning 7
Significance of the San Marcos River and Watershed 7
Watershed Description 9
Existing Watershed-Based Management Efforts 11
Upper San Marcos WPP Stakeholder Committee 12
Stakeholder Goals 14
Water Quality 16
Subbasin Scale Water Quality Issues 25
2 Management Measures for the Upper San Marcos Watershed 35
A Comprehensive Approach 35
Future Conditions with Edwards Aquifer Management Measures 37
Areas of Vulnerability 42
Stakeholder Identified BMPs 23
BMPs for Implementation 45
Adaptive Management - BMPs for Future Implementation 62
Technical and Financial Assistance 62
3 Education and Outreach Plan 66
Education and Outreach Strategy 66
4 Monitoring Plan 77
Tracking Load Reductions from Management Measures 77
Coordinating Existing and Future Monitoring Efforts 80
5 References 85
Appendix A: Watershed Characteristics 90
TABLE OF CONTENTS

The Upper San Marcos Watershed Protection Plan 2
Appendix B: Modeling Methodology 91
Appendix C: Subbasin Scale Water Quality Analysis 92
Appendix D: Comprehensive Watershed Best Management Practices 93

3 The Meadows Center for Water and the Environment
Figure Page
Figure 1.1 San Marcos Study Area 10
Figure 1.2. SMWI Project Logo 12
Figure 1.3 Stakeholder Group Communication Structure 13
Figure 1.4 Stakeholder Group Structure for SMWI WPP Development 13
Figure 1.5 Deer density (Armstrong and Young, 2000) in the study area and estimated current E. coli load from deer from SELECT calculations.
18
Figure 1.6 Feral hog density within the study area and estimated current E. coli load from hogs from SELECT calculations
19
Figure 1.7 Existing E. coli load from dogs from SELECT calculations 20
Figure 1.8 Existing On-site Sewage Facilities within the San Marcos watershed (Hays County Geographical Information Systems Data, 2013)
21
Figure 1.9 Existing E. coli load from cattle from SELECT calculations 22
Figure 1.10 HSPF Modeled Subbasins 26
Figure 1.11 Upper San Marcos WPP watershed boundaries, flood control structures, and accumulation points (pentagons)
26
Figure 1.12 Parameters Exceeding Targets and/or Standards in the 2035 Scenarioat the Subbasin Scale
32
Figure 2.1 Upper San Marcos Water and Edwards Aquifer Zones 36
Figure 2.2 Map of Subbasins with Significant Future Development 38
Figure 2.3 Map of Subbasins with Significant Future Development with Overlay for Edwards Aquifer Zone Boundaries
38
Figure 2.4 Concentration of TDS in Selected Developing Subbasins 39
Figure 2.5 Concentration of TSS in Selected Developing Subbasins 40
Figure 2.6 Concentration of TN in Selected Developing Subbasins 40
Figure 2.7 Concentration of E. coli in Selected Developing Subbasins 41
Figure 2.8 Concentration of Total Phosphorus in Selected Developing Subbasins 41
Figure 4.1 Texas Stream Team monitoring sites along the Upper San Marcos River 82
LIST OF FIGURES

The Upper San Marcos Watershed Protection Plan 4
Table Page
Table 1.1 Upper San Marcos River Water Quality Standards and Targets 15
Table 1.2 City of San Marcos WWTF permitted effluent limits 17
Table 1.3 Historical Discharge Data from A.E. Wood State Fish Hatchery 17
Table 1.4 Historical discharge data from DMRs (City of San Marcos WWTF) 17
Table 1.5 Water quality parameters, primary sources, and their potential causes 23
Table 1.6 Future Accumulation Point and Subbasin Instream Concentrations and Required Reductions for E. coli, Nitrogen, Phosphorus, and TDS
28
Table 1.7 Future Accumulation Point and Subbasin Instream Concentrations and Required Reductions, TSS mg/l and lb/yr/subbasin
30
Table 1.8 Future Cumulative Instream Concentrations at Accumulation Points and Required Reductions
34
Table 2.1 Urban and Suburban Measures and Milestones for Implementation 46
Table 2.2 Rural Measures and Milestones for Implementation to be implemented in Years 3-5 51
Table 2.3 Land Conservation Measures and Milestones for Implementation 53
Table 2.4 Water Quality and Buffer Zones Defined by Offset Method Inside EARZ (from Code SMTX)
57
Table 2.5 Water Quality and Buffer Zones Defined by Offset Method Outside EARZ (from Code SMTX)
57
Table 2.6 Ground/Source water measures and milestones for implementation, years 1-3 59
Table 2.7 Financial Assistance Available for WPP Implementation 63
Table 2.8 Technical Assistance Available for WPP Implementation 65
Table 3.1 E&O Plan Goals and Audience 66
Table 3.2 E&O Implementation Plan Activities 67
Table 4.1 Monitoring Efforts and Data to be included in Monitoring Plan 78
LIST OF TABLES

5 The Meadows Center for Water and the Environment
NINE ELEMENT CROSSWALKThe Environmental Protection Agency (EPA) has identified nine key elements that are critical for achieving improvements in water quality. These nine elements are required by the EPA to be addressed in watershed plans funded with the incremental Clean Water Act section 319 funds. The EPA will review watershed plans that provide the basis for section 319-funded projects.
For more information, please refer to EPA’s “Handbook for Developing Watershed Plans to Restore and Protect Our Waters”.

The Upper San Marcos Watershed Protection Plan 6
A GUIDE TO FINDING THE EPA WATERSHED PLANNING ELEMENTS IN THE
UPPER SAN MARCOS WATERSHED PROTECTION PLAN
Element Element Description Watershed Protection Plan Section Page #
AIdentification of causes and sources of pollution that need to be controlled to achieve load reductions
Ch 1. Introduction to the Watershed 25
BEstimation of load reductions expected from management strategies
Ch 2. Management Measures 48
C Description of management strategies Ch 2. Management Measures 57
DEstimation of technical and financial assistance needed to implement the plan
Ch 2. Technical and Financial Assistance 86
EInformation and education component used to enhance public understanding of the plan
Ch 3. Education and Outreach 91
FSchedule for implementation of management strategies
Ch 2. Management Measures 58
G
Description of interim, management milestones for determining whether management strategies are being implemented
Ch 2. Management Measures 60
HSet of criteria that can be used to determine whether load reductions in (B) are being achieved
Ch 2. Management Measures 61
IA monitoring component to evaluate the effectiveness of the implementation efforts over time
Ch 4. Monitoring Plan 105

7 The Meadows Center for Water and the Environment
1. INTRODUCTION TO THE WATERSHED
The Watershed Approach to PlanningA watershed is a topographically-defined area of land that contributes water, nutrients, pollutants, and sediments to a common downstream point such as a stream, river, or lake. When it rains, water moves downhill across the land’s surface or underground. Moving farther downhill by force of gravity, the water converges into a progressively larger system. The U.S. Geological Survey (USGS) defines a watershed as “the land area that drains water to a particular stream, river, or lake and can be identified by tracing a line along the highest elevations between two areas on a map” (USGS, 2014). Watersheds are comprised of many smaller subwatersheds or subbasins.
A watershed based approach is a flexible framework for managing water resource quality and quantity within specified watersheds. This approach includes stakeholder involvement and management actions supported by sound science and appropriate technology. The watershed planning process works within this framework by using a series of cooperative, iterative steps to characterize existing conditions, identify and prioritize problems, define management objectives, develop protection or remediation strategies, and implement and adopt selected actions as necessary. Using a watershed approach, addresses problems in a holistic manner and the stakeholders in the watershed are actively involved in selecting the management strategies that will be implemented to solve those problems (EPA, 2008).
Significance of the San Marcos River and Watershed
Surface and Groundwater Connectivity
The Edward’s Aquifer is an artesian aquifer and a major source of drinking water for two million people in central and south-central Texas. The potential for surface water and groundwater interactions throughout the watershed are greatly increased by the karstic nature of the landscape, the number of faults and fractures, and the direct conduits of recharge and discharge features along streambeds. Water quality in the river and its tributaries is directly tied to water quality in the aquifer and an increase in nonpoint source pollution in the watershed affects both surface and groundwater.
Artesian spring water from the Edwards Aquifer emerges into Spring Lake from hundreds of spring openings, creating one of the most productive spring-fed systems in Texas. Flows from these springs form Spring Lake and serve as the headwaters of the Upper San Marcos River. These flows are of vital importance to San Marcos and surrounding communities, as well as to the aquatic life in the lake and river.
There are many pressures on the Upper San Marcos River and its source waters, the Edwards Aquifer. Growth and associated nonpoint source pollution in the watershed impact the quality (and quantity) of both surface and groundwater resources. Water quality in Spring Lake and the Upper San Marcos River is shown to decline after storm events. Pollutants are carried across the landscape and eventually flow into the river and the tributaries that feed it.

The Upper San Marcos Watershed Protection Plan 8
Biodiversity
Due to the river’s high biodiversity and presence of endemic and endangered species, the United States Fish and Wildlife Service (USFWS) designated the San Marcos Springs and Spring Lake as critical habitat. Further, because of the potential sensitivity of the headwaters to environmental perturbation and the limited geographic range of many of the spring-adapted organisms, several species have been federally- and state-listed as endangered or threatened.
The San Marcos salamander (Eurycea nana), Texas wild rice (Zizania texana), the fountain darter (Etheostoma fonticola), the Comal Springs riffle beetle (Heterelmis comalensis), and the Texas Blind Salamander (Typhlomolge rathbuni) are all present in the headwaters or the river and are listed by USFWS as endangered or threatened. The Guadalupe Roundnose minnow (Dionda nigrotaeniata) and the Bigclaw River Shrimp (Macrobrachium carcinus) also occur in the headwaters and river, and have been identified by the Texas Comprehensive Wildlife Conservation Strategy as species of “high priority” for conservation. These species are sensitive to pollution, water temperature, and rely on suitable flows for survival.
Recreation, Tourism, Character and Culture
The San Marcos River is known for its high clarity and constant temperature, making it a popular location for water recreation including swimming, tubing, boating, canoeing, kayaking, snorkeling, SCUBA diving, and fishing. Thousands of tourists visit the river each year, generating millions of dollars in tax revenues and sustaining local jobs. Ecotourism is also expanding in the area and is primarily based on river recreation.
The City of San Marcos (COSM) and surrounding areas acknowledge the influence of the unique resources associated with the river, lake, and springs on the character and culture of the City, University, and region. The presence of Spring Lake and the San Marcos River on the Texas State University campus provides a unique experience for students, many of who believe that the river is a resource that needs to be protected. The title of the City’s current comprehensive plan is Vision San Marcos: A River Runs Through Us. Environmental resource protection is a common theme throughout community driven planning documents.
Spring Lake and the San Marcos River also play an important cultural role in the regional Native American Community and are the feature of several sacred rituals and celebrations each year.
Population Growth
The COSM is situated in the Southeast portion of the watershed, and the river and its tributaries run through the city, providing a source of drinking water, recreational opportunities, and miles of unique riparian corridor habitat. Both the COSM urban sector and more rural surrounding areas are growing at an unprecedented rate, as is the entire Central Texas region.
The San Marcos population is expected to increase by two to four percent (60,000 to 100,000 people) over the next 20 years (San Marcos Daily Record, 2017). In ecologically and hydrologically sensitive areas of this watershed, the effects of an increase in impervious cover can be significant. Increased impervious cover associated with urbanization can lead to increased pollutant concentrations. In addition, the installation of drainage systems and concrete channels can result in pollutant loadings being delivered to waterways faster and in greater concentrations than in undeveloped areas with natural drainage systems. Urbanization has also been shown to fragment the landscape, potentially impacting biodiversity.

9 The Meadows Center for Water and the Environment
Changing Water Quality
In 2010, the Upper San Marcos River was listed on Texas Commission on Environmental Quality’s (TCEQ) 303(d) list of impaired water bodies, for exceeding Total Dissolved Solids (TDS) water quality standards (TCEQ, 2012). Currently, TDS meets required standards, but several other pollutants have been identified as a concern. This Watershed Protection Plan (WPP) addresses the previously listed impairment as well as Escherichia Coli (E. coli), nutrients, sediment, and other pollutants associated with future growth and development.
Surface water quality standards and screening levels are set by the TCEQ. This includes standards for the following designated uses in the Upper San Marcos River: Contact Recreation, Exceptional Aquatic Life Use, and Aquifer Protection. However, because the Upper San Marcos River is spring fed and has exhibited exceptional water quality in the past, Stakeholders felt that these allowable levels of pollutants were insufficient to protect this unique river system. Therefore, the Stakeholders set target levels for chloride (Cl-1), sulfate (SO4-2), TDS, dissolved oxygen (DO), total suspended solids (TSS), nitrogen + nitrate, phosphorus, oil and grease, and E. coli, that are more stringent than state water quality standards and screening levels (Table 1.1).
Watershed Description
Spring Lake and the San Marcos River (Segment 1814)
Artesian spring water from the Edwards Aquifer emerges through 200 spring openings forming Spring Lake and the headwaters of the San Marcos River. The lake is a horseshoe-shaped water body with two main regions: the Spring Arm to the North and the Slough Arm to the South. Most of the hydrological inputs to Spring Lake occur from spring openings in the Spring Arm, meaning that most of the flow in the Upper San Marcos River is comprised of groundwater. Sink Creek is the lake’s only significant surface water tributary, and discharges into the Slough Arm of the lake (Nowlin and Schwartz, 2012).
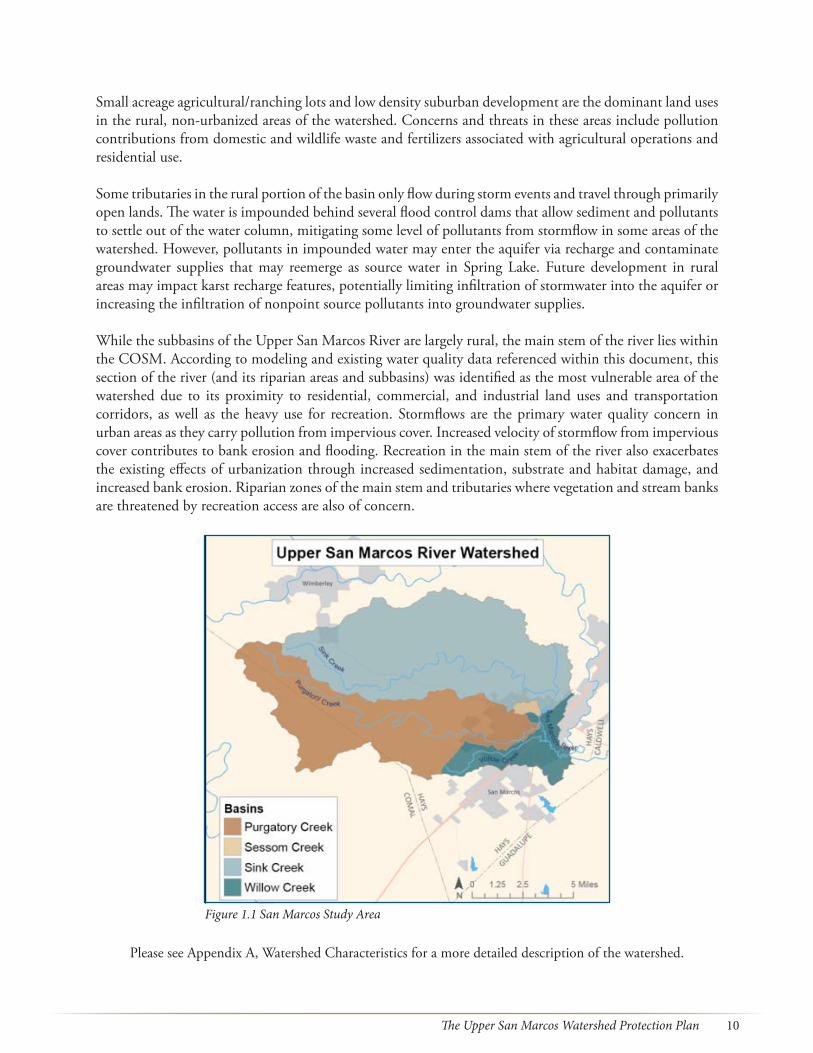
The Upper San Marcos River (Segment 1814) is 4.5 miles long and receives periodic inputs of rainwater from four major tributaries before joining the Blanco River. Segment 1814 is separated into four assessment units: the lower 1.5 miles (1814_01); from that point to Interstate Highway-35 (IH-35) (1814_02); from I-H 35 to Spring Lake (1814_03); and, the remaining portion of the segment to the headwaters (1814_04). These combined rivers meet the Guadalupe River in Gonzalez, Texas and flow into San Antonio Bay. Figure 1.1 shows the boundaries of the Upper San Marcos Watershed used in this watershed protection planning process.
The Upper San Marcos Watershed
The Upper San Marcos watershed is 94.6 square miles (mi2) (60,605 acres) and is divided into four main contributing subbasins: Sink Creek (48.26 mi2/30,906 acres), Sessom Creek (0.63 mi2/402 acres), Purgatory Creek (36.96 mi2/23,698 acres) and Willow Creek (5.90 mi2/3,778 acres). For analyzing pollutant trends in the watershed, these subbasins were further divided into 35 smaller subbasins, shown in Figure 1.10 and in Appendix A, Watershed Characteristics.
Land use in the watershed is dominated by rangeland and undeveloped land although, dense urbanization occurs in the southeastern portion of the watershed and is spreading westward along established transportation routes. Development in the Upper San Marcos watershed is expected to increase, with rural land uses converting to intense urban developments (Nowlin and Schwartz, 2012).
The Upper San Marcos Watershed Protection Plan 10
Small acreage agricultural/ranching lots and low density suburban development are the dominant land uses in the rural, non-urbanized areas of the watershed. Concerns and threats in these areas include pollution contributions from domestic and wildlife waste and fertilizers associated with agricultural operations and residential use.
Some tributaries in the rural portion of the basin only flow during storm events and travel through primarily open lands. The water is impounded behind several flood control dams that allow sediment and pollutants to settle out of the water column, mitigating some level of pollutants from stormflow in some areas of the watershed. However, pollutants in impounded water may enter the aquifer via recharge and contaminate groundwater supplies that may reemerge as source water in Spring Lake. Future development in rural areas may impact karst recharge features, potentially limiting infiltration of stormwater into the aquifer or increasing the infiltration of nonpoint source pollutants into groundwater supplies.
While the subbasins of the Upper San Marcos River are largely rural, the main stem of the river lies within the COSM. According to modeling and existing water quality data referenced within this document, this section of the river (and its riparian areas and subbasins) was identified as the most vulnerable area of the watershed due to its proximity to residential, commercial, and industrial land uses and transportation corridors, as well as the heavy use for recreation. Stormflows are the primary water quality concern in urban areas as they carry pollution from impervious cover. Increased velocity of stormflow from impervious cover contributes to bank erosion and flooding. Recreation in the main stem of the river also exacerbates the existing effects of urbanization through increased sedimentation, substrate and habitat damage, and increased bank erosion. Riparian zones of the main stem and tributaries where vegetation and stream banks are threatened by recreation access are also of concern.
Figure 1.1 San Marcos Study Area
Please see Appendix A, Watershed Characteristics for a more detailed description of the watershed.
11 The Meadows Center for Water and the Environment
Existing Watershed-Based Management Efforts There are many existing structural management measures or best management practices (BMPs) in the watershed. Several flood retention structures were built in the watershed in the 1980s to reduce the amount and frequency of runoff during severe rain events. These structures effectively limit initial runoff entering the river, but do not eliminate downstream flooding. Reduced pulse flows to the river result in aggradation, or deposition and accumulation of sediment in the river. The structures have also had a significant impact on the routing of nonpoint source pollutants across the watershed and into the aquifer. Flood control structures hold water from overland stormflows that would otherwise carry pollutants to tributaries and the main stem of the river. Some of the pollutants and sediments settle out of the stormwater in the flood retention structures, reducing the total pollutant and sediment levels. However, because downstream flooding is not eliminated, these structures only reduce nonpoint source pollution on a local scale.
Because pulse flows are reduced by the presence of flood control structures, sediment that may have washed downstream during flood events can instead accumulate upstream of the flood control structures. In an unaltered system, sediment would be purged and washed downstream periodically, but because of the altered flows, sediment may accumulate in tributaries. Additionally, accumulated sediment may be washed downstream in large concentrations if flooding is significant enough to breach the flood control structures. As flows are impounded behind detention structures, some of the water is absorbed into the soil and local recharge features. Stormflows with high concentrations of nonpoint source pollutants can also enter the aquifer and later emerge as surface water flows in Spring Lake or other tributaries.
Detention ponds in the watershed also impact flooding and may alter the level of pollutants entering tributaries and the river. As with flood control structures, detention ponds slow the flow of water across the landscape and allow sediment and other pollutants to settle out.
Non-structural management practices, including ordinances, regulations, and educational efforts in the watershed may mitigate land based pollutants although little is known about the effectiveness of the efforts. Currently, there are many overlapping initiatives in the watershed to reduce flooding, minimize pollution, plan for future development, and protect water quality for endangered species. Partners in these efforts include the COSM, Hays County, Texas State University, other agencies and numerous non-governmental organizations (NGOs). Under the umbrella of this WPP, partners have shared data, outcomes and lessons learned. Current and future efforts to protect water quality and minimize nonpoint source pollution are coordinated through and captured to the extent possible in this WPP. Specifically, the watershed protection planning process encompassed efforts, recommendations and outcomes of the Edwards Aquifer Habitat Conservation Plan (EAHCP) based water quality protection plan (WQPP), City and University comprehensive master planning processes, and the City’s Watershed Master Plan and land development code (LDC) rewrite process (Code San Marcos, TX (SMTX).
The EAHCP is intended to provide assurance that suitable habitat for threatened and endangered species will remain in both the San Marcos and Comal Springs, despite lawful water use activities within the Edwards Aquifer region. The WQPP is being developed for the San Marcos area under the authority of the EAHCP as a requirement that the City and University take actions that increase the likelihood of survival and recovery of threatened and endangered species found in the Edwards Aquifer and Upper San Marcos River ecosystems. Code SMTX is the process to update the City of San Marcos Land Development Code. The Code contains rules for development and regulates the use of land. The Code is being revised so that new development fits the community’s vision for the future. Although these are separate programs, the

The Upper San Marcos Watershed Protection Plan 12
goals, materials, messaging, and milestones were also harmonized with City and University Municipal Separate Storm Sewer System (MS4) Programs.
Detailed information about existing management efforts and initiatives is provided in the Existing Watershed-Based Management Efforts, included in the Supporting Documents section on the San Marcos Watershed Initiative website.
Upper San Marcos WPP Stakeholder Committee
Stakeholder Committee Formation
In 2009, The Meadows Center for Water and the Environment (The Meadows Center) convened community stakeholders, local organizations, and various agency partners in the watershed. The group was comprised of members from the COSM, Hays County, Texas State University, the San Marcos River Foundation (SMRF), San Marcos River Rangers, San Marcos Greenbelt Alliance (SMGA), Edwards Aquifer Research and Data Center, the Guadalupe Blanco River Authority), the USGS, and others. Meeting through 2012, this stakeholder group (the Upper San Marcos Coordinating Group) bridged diverse perspectives, interests, and resources and provided input into the development of a watershed characterization and the resulting recommendations for the management of nutrients and other identified nonpoint source pollutants in the Spring Lake watershed. Please refer to the Spring Lake Watershed Characterization Report, Section 2.5 located in the Supporting Documents section on the San Marcos Watershed Initiative website for a summary of the project and its results. This group provided the initial structure for the Upper San Marcos WPP Stakeholder Committee and was expanded to include additional sectors of the community.
During the formation of the San Marcos Watershed Initiative (SMWI) Stakeholder Committee, the goal was to diversify representation and expand the geographic area to better represent the community and their interests. For this effort, the stakeholders chose a name and logo to represent the effort and developed a vision statement and goals, Figure 1.2.
Figure 1.2. SMWI Project Logo

13 The Meadows Center for Water and the Environment
Committee Organization and StructureWatershed Stakeholders created the Core Committee, the decision-making body for oversight and official representation of all major stakeholder interests, and seven initial subcommittees, shown in Figure 1.3. The 12-member Core Committee represents community priorities and often conducted activities via subcommittees and stakeholder work groups. The Core Committee, with information and recommendations from the subcommittees and stakeholder workgroups, was responsible for decisions about the direction of this watershed planning process, as well as the final content of the plan.
Subcommittees were issue-based and members had significant interest or expertise in relevant subject matter. Throughout the first two years of the project, approximately 50 dedicated stakeholders were active in subcommittee activities, identifying concerns, possible sources of pollution, sources of data and information, and potential BMPs. Committee and subcommittee members, goals, guiding principles and the full suite of stakeholder findings gathered during the first year of stakeholder meetings can be found in the Stakeholder Committee Information document located in the Supporting Documents section on the SMWI website. Figure 1.4 shows the interaction between the Core Committee and the entities that guided the watershed protection planning process.
Figure 1.3 Stakeholder Group Communication Structure
Figure 1.4 Stakeholder Group Structure for SMWI WPP Development

The Upper San Marcos Watershed Protection Plan 14
SMWI Stakeholders’ vision is “a healthy watershed that supports a clean, clear, and flowing San Marcos River for the future, as it was in the past.”
Stakeholder Goals
Coordinating Efforts
Stakeholders identified several high priority efforts and initiatives in the watershed that should be coordinated with WPP efforts. The WPP was viewed as an “umbrella” that could cover water quality and watershed protection efforts. A primary goal of the Stakeholder Committee was to incorporate the COSM and the University’s EAHCP WQPP efforts into the Plan and to align WPP efforts with other City, County, University, and NGO initiatives to protect water quality and flow. Management measures in this WPP include City LDC rewrites, University Master Planning, County EAHCP activities, Land Trust initiatives and other relevant watershed protection activities. This WPP seeks to align and coordinate education and outreach (E&O) amongst various water quality protection programs, including the EAHCP and the City and University MS4 programs. For additional information, see Section III, Partner Activities and Initiatives of the Existing Watershed-Based Management Efforts document located in the Supporting Documents section on the SMWI website.
Protecting Flow
Because the San Marcos River is a groundwater driven system, Stakeholders identified groundwater (source water) and spring flow protection as a goal. Management measures were included in the WPP to protect recharge features and promote water conservation.
Protecting and Improving Water Quality
Although the purpose of this WPP is to protect the watershed from a TDS impairment, Stakeholders identified several other water quality concerns related to increasing development including nutrients, bacteria, and emerging contaminants (primarily oil and grease). Modeling results show that rapid urbanization in the coming years is likely to have water quality impacts at the subbasin and watershed levels. Further, most current nonpoint source pollution in the watershed is stormwater driven, and can impact water quality in the exchange between surface water and groundwater. For example, polluted stormwater can infiltrate the aquifer and later reemerge as polluted surface waters in Spring Lake. In addition, instream pollutants may be reduced in concentration when coupled with groundwater-based spring flow.
With a few exceptions and storm related spikes in pollutants, the Upper San Marcos River consistently has better water quality than the state’s water quality standards and screening levels. For this reason, and because of the river’s unique groundwater driven system, Stakeholders determined that state standards and screening levels were not adequate to maintain water quality. Stakeholders selected water quality target levels that better reflected their desired conditions for the river and its tributaries, shown in Table 1.1. Stakeholders used observed data and the state standards to develop their water quality targets. For example, the average of observed TSS data for samples taken near IH-35 and the Blanco confluence is 10 milligrams per liter (mg/L). The average TSS value in Spring Lake is 2.3 mg/L. The state standard of 5.0 mg/L is slightly below the midpoint of these samples (6.15 mg/L) and the additional targets selected are lower than TSS laboratory detection limit.

15 The Meadows Center for Water and the Environment
Two water quality target regimes were selected by the Stakeholder Committee to be implemented incrementally over time. The Target A levels include a 10% improvement over the state standard and screening level for all parameters, with the exceptions of a 5% improvement in TDS, and a 9% improvement in nitrogen. Target B levels include a 20% improvement over the state standard and screening level for all parameters, with the exceptions of a 10% improvement in TDS, and an 18% improvement in nitrogen.
In summary, stakeholders assessed existing water quality measurements, modeled future conditions and pollution ranges, and identified subwatershed vulnerabilities, including high levels of TSS contribution, significant recharge features and endangered species habitat. These characteristics were used to select and locate BMPs within the watershed. In addition, BMPs were selected for implementation in high traffic areas. For example, stream stabilization activities are prioritized for early implementation to reduce sediment loads in the Sessom Creek watershed. Land management and conservation measures are prioritized in the Sink Creek watershed to protect water quality in the headwaters. Visible stormwater retrofits were selected for placement near downtown and river recreation areas, such as City Park.
Table 1.1 Upper San Marcos River Water Quality Standards and Targets
The following section provides information related to:
Element A. Identification of causes of impairment and pollutant sources or groups of similar sources that need to be controlled to achieve needed load reductions.
mg/L
colony forming
units (CFU)/100ml
(milliliter)
Parameter ChlorideCl -1
SulfateSO4
-2
TDS DO TSS* Nitrogen+Nitrate
Phosph-orus
Oil & Grease
E. coli(Geomean)
TCEQ State Standard/ Screening level/Detection Limits
50 50 400 6.0 5.0 1.95 0.69 N/A 126
Target A (% change Improvement from Standard/Screening Level) to be Implemented 2025
45 (10%) 45 (10%)
380 (5%)
6.6 (10%)
4.5(10%)
1.775 (9%) 0.621(10%)
5.0* 113.4 (10%)

The Upper San Marcos Watershed Protection Plan 16
P * for base flow and average storm events**Typical analysis detection limits are 5.0 mg/L. (Sources: TCEQ, 2012b; TCEQ, 2010)
mg/L
colony forming
units (CFU)/100ml
(milliliter)
Target B (% change Improvement from State Standard/Screening Level) to be Implemented 2035
40 (20%) 40 (20%)
360(10%)
7.2(20%)
4.0(20%)
1.60 (18%) 0.55(20%)
5.0** 101 (20%)
Water Quality Nonpoint source pollution comes from many diffuse natural and anthropogenic sources, often entrained and transported by water (EPA, n.d. [b]). Sources of nonpoint source pollution include suspended sediments from denuding of topsoil, fecal matter from animals, and transport of nutrient rich vegetation debris. Urban areas are great contributors of nonpoint source pollutants from various human activities including but not limited to fertilizer and pesticides from urban lawns, sediment from improperly managed construction sites, oil debris from parking lots, athletic fields, and leaking septic tanks. General Causes and Sources of Pollution
Point Sources
There are two-point sources located in the Upper San Marcos River watershed, the Texas Parks and Wildlife A.E. Wood State Fish Hatchery and the City of San Marcos Waste Water Treatment Facility (WWTF). The San Marcos WWTF adheres to strict water quality regulations and has been rated superior by the State of Texas. The wastewater treatment plant is owned by the City of San Marcos and operated by CH2M Hill. The WPP routinely monitors the effluent to ensure compliance of the permitted effluent limits (Table 1.2) Fully-permitted conditions consistent with the TCEQ Texas Pollutant Discharge Elimination System permit, were used for the future condition models.
All modeling activities assumed that these facilities discharge continuously at a constant rate. Historical records of effluent flow and loading obtained from the EPA PCS database were used for the existing condition model (Table 1.3 and Table 1.4).
Due to the karstic limestone and the interconnectivity between rainfall, surface waters, and groundwater, the watershed and the groundwater is vulnerable to nonpoint source pollutants. Such dispersed pollutants can be part of infiltration or surface water runoff from development, septic systems, spray and subsurface effluent irrigation systems, spills or dumping of chemical pollutants, fertilizer applications and other agricultural activities, including animal waste.

17 The Meadows Center for Water and the Environment
Table 1.2 City of San Marcos WWTF permitted effluent limits
Table 1.4 Historical discharge data from DMRs (City of San Marcos WWTF)
Table 1.3 Historical Discharge Data from A.E. Wood State Fish Hatchery
Parameter Maximum Monitored
Discharge (Million Gallons per Day) 9.0 MGD Daily
TSS 5.0 mg/L Daily
DO 5.0 mg/L Daily
Carbonaceous Biochemical Oxygen Demand 5.0 mg/L Daily
Ammonia Nitrogen (NH3-N) 2.0 mg/L Daily
Total Phosphorus (TP) 1.0 mg/L Daily
Texas Parks and Wildlife Department A.E. WOOD Fish Hatchery
Average for available data years, 2009-2012
MGD Acre-Feet (AC-FT)/YEAR
Discharge 2.168258 2,428.85
mg/L Pounds (lbs)/YEAR
BOD 5.854 38,665.25
TSS 5.239 34,602.25
NH3-N 0.042 279.25
TP 0.781 no data; assume same as WWTF
Nitrate -- --
Total Nitrogen (TN) 1.000 no data; assume same as influent springs (source water)
E. coli (Most Probable Number (MPN)/100mL)
0 no data; assume zero because of chlorination
TDS 399.0 no data; assume source water is same as springs
City of San Marcos WWTF
Average for available data years, 2009-2012, 2014
MGD Acre-Feet (AC-FT)/YEAR
Discharge 4.7646 5341.04
mg/L Pounds (lbs)/YEAR
BOD 2.031 29501.8
TSS 1.173 17041.4
TP 0.781 11339
NH3 0.304 4419
Nitrate 7.530 --
TN 7.834 no data; assume sum of NH3+NO3
E. coli (MPN/100mL) 2.74 Geometric mean
TDS 376.0 2014 only
The Upper San Marcos Watershed Protection Plan 18
SELECT Calculations of E. Coli
Although event mean concentrations (EMC) can be used to calculate instream concentrations of bacteria, discussed in more detail below and in Appendix B, they cannot identify specific sources, (i.e. dogs, cattle, etc.), or priority subwatersheds. The Spatially Explicit Load Enrichment Calculation Tool (SELECT) was used above and beyond the calculations from EMCs, to further identify and quantify sources and locations of bacterial pollution from animal sources.
The maps shown in this section can be used to prioritize the locations of BMPs to achieve the largest water quality impacts possible. Although these maps only show bacterial sources, many BMPs proposed in this plan will also remove other parameters of concern including nutrients, TSS, and TDS. Implementation of BMPs in the prioritized subbasins will result in reductions of multiple parameters of concern.
White-tailed Deer
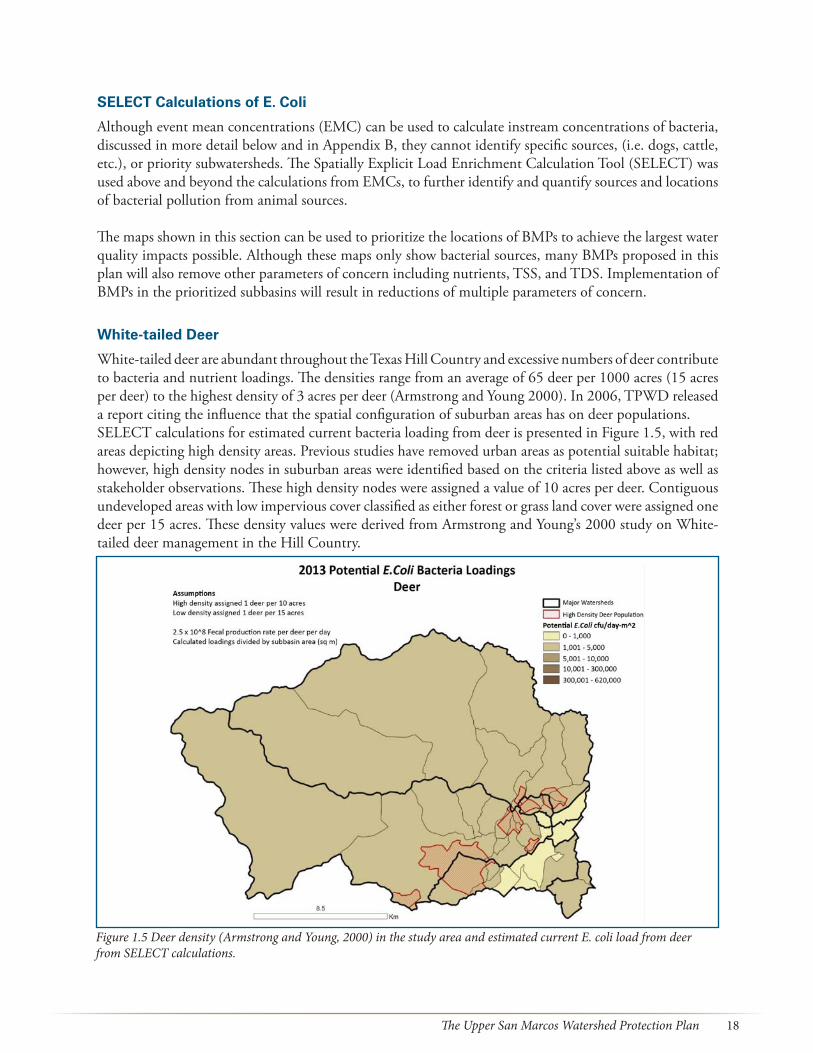
White-tailed deer are abundant throughout the Texas Hill Country and excessive numbers of deer contribute to bacteria and nutrient loadings. The densities range from an average of 65 deer per 1000 acres (15 acres per deer) to the highest density of 3 acres per deer (Armstrong and Young 2000). In 2006, TPWD released a report citing the influence that the spatial configuration of suburban areas has on deer populations. SELECT calculations for estimated current bacteria loading from deer is presented in Figure 1.5, with red areas depicting high density areas. Previous studies have removed urban areas as potential suitable habitat; however, high density nodes in suburban areas were identified based on the criteria listed above as well as stakeholder observations. These high density nodes were assigned a value of 10 acres per deer. Contiguous undeveloped areas with low impervious cover classified as either forest or grass land cover were assigned one deer per 15 acres. These density values were derived from Armstrong and Young’s 2000 study on White-tailed deer management in the Hill Country.
Figure 1.5 Deer density (Armstrong and Young, 2000) in the study area and estimated current E. coli load from deer from SELECT calculations.
19 The Meadows Center for Water and the Environment
Feral Hogs
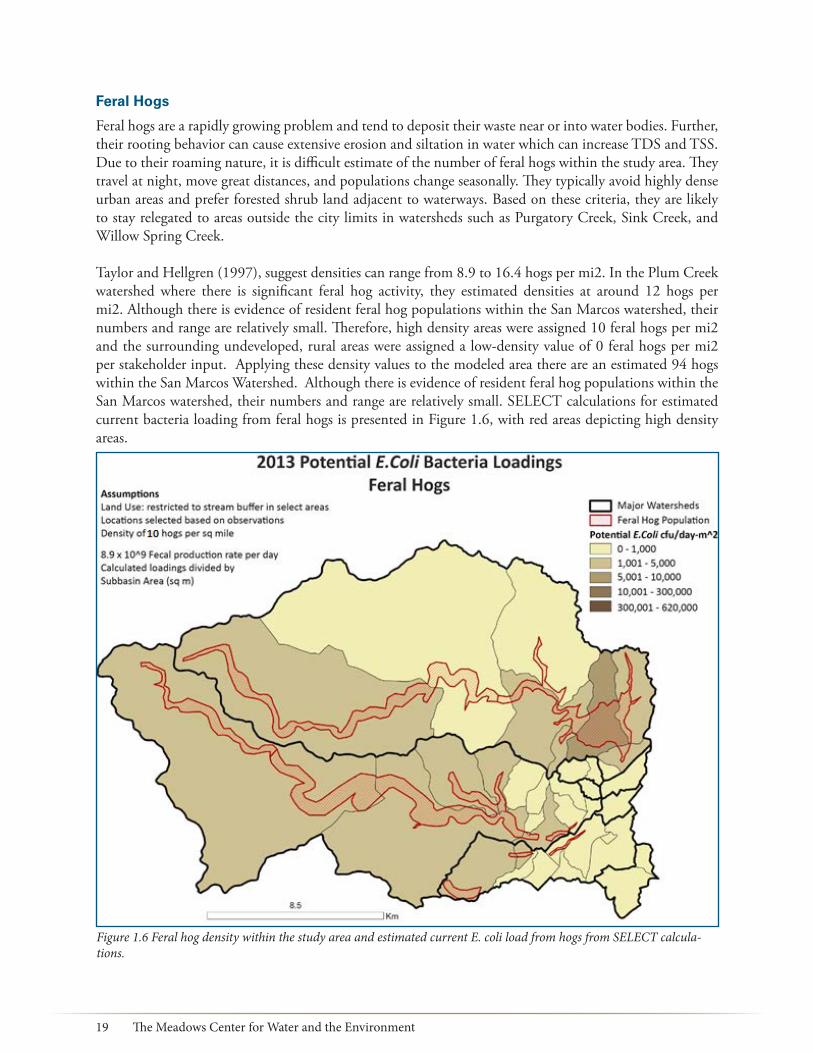
Feral hogs are a rapidly growing problem and tend to deposit their waste near or into water bodies. Further, their rooting behavior can cause extensive erosion and siltation in water which can increase TDS and TSS. Due to their roaming nature, it is difficult estimate of the number of feral hogs within the study area. They travel at night, move great distances, and populations change seasonally. They typically avoid highly dense urban areas and prefer forested shrub land adjacent to waterways. Based on these criteria, they are likely to stay relegated to areas outside the city limits in watersheds such as Purgatory Creek, Sink Creek, and Willow Spring Creek.
Taylor and Hellgren (1997), suggest densities can range from 8.9 to 16.4 hogs per mi2. In the Plum Creek watershed where there is significant feral hog activity, they estimated densities at around 12 hogs per mi2. Although there is evidence of resident feral hog populations within the San Marcos watershed, their numbers and range are relatively small. Therefore, high density areas were assigned 10 feral hogs per mi2 and the surrounding undeveloped, rural areas were assigned a low-density value of 0 feral hogs per mi2 per stakeholder input. Applying these density values to the modeled area there are an estimated 94 hogs within the San Marcos Watershed. Although there is evidence of resident feral hog populations within the San Marcos watershed, their numbers and range are relatively small. SELECT calculations for estimated current bacteria loading from feral hogs is presented in Figure 1.6, with red areas depicting high density areas.
Figure 1.6 Feral hog density within the study area and estimated current E. coli load from hogs from SELECT calcula-tions.

The Upper San Marcos Watershed Protection Plan 20
Dogs
When not properly disposed, pet waste can enter waterways, lower the quality of the water, and increase pathogen levels. Pet waste contains nutrients, including nitrogen, E. coli, and other types of bacteria and parasites that can be harmful to humans. Because the flood control structures capture most of the runoff from rural rangeland, the most likely source of E. coli loadings in tributaries is attributed to pet waste, primarily from dogs.
According to the American Veterinary Medical Association (AVMA, 2012), 36.5 percent of U.S. households own dogs. Each household that has dogs own an average 1.6 dogs per household. 2010 Census block data were used to estimate the approximate number of occupied households per subbasin. Number of Dogs equation below calculates the approximate number of dogs per subbasin and the potential E. coli equation below estimates the potential E. coli bacteria loadings per subbasin. The final potential loadings are enumerated as CFU/day-m2.
Number of Dogs = (#Households) x (0.365) * 1.6 Potential E. coli = [(#Dogs) x (5 x 10⁹ CFU/day) x (0.5)] ÷ Area Subbasin
Current potential watershed loadings for dogs are shown in Figure 1.7.
Figure 1.7 Existing E. coli load from dogs from SELECT calculations.

21 The Meadows Center for Water and the Environment
In addition, future development in the watershed will increase the opportunities for water quality impairments due to elevated pathogens, nutrients, sedimentation/siltation, organic enrichment, depressed oxygen levels, reduced aquifer recharge, habitat alterations, and biological impairments.
Septic Tanks
Homeowners are responsible for the maintenance of their On-site Sewage Facilities (OSSFs). Septic systems work well when functioning correctly and sited in the correct soil. However, soil type, age, design, and lack of maintenance can contribute to OSSF failure. Septic system failure can impact the quality of ground and surface water and often contribute bacteria, nutrients, TDS, and oil and grease pollutants within the watershed. The estimated number of OSSF’s in the watershed is 1,545.
Estimating the percent of OSSFs which are failing involved assessing the approximate age of the system and soil characteristics to quantify a potential septic failure rate (Suitability Rating Equation). The Hays County OSSF shapefile contained no attribute data such as type of OSSF or installation date. Approximate septic age was derived from Hays County Tax Appraisal District Parcel data. To estimate the soil septic rate, each OSSF was merged with a corresponding Natural Resources Conservation Service (NRCS) Soil Survey Geographic Database (SSURGO) class. Percent failure rate was calculated based on the approximate age of the subdivision and the SSURGO septic drainage limitation class. According to the 2011 American Community Survey, a service of the U.S. Census Bureau, the average number of people per household in Hays County was 2.79.
Suitability Rating = 0.7 x Soil Rate + 0.3 x Age Rate
Figure 1.8 shows existing OSSFs within the watershed and current potential bacteria loadings.
Figure 1.8 Existing On-site Sewage Facilities within the San Marcos watershed (Hays County Geographical Information Systems Data, 2013)

The Upper San Marcos Watershed Protection Plan 22
Agriculture
The thin, rocky soil in the watershed makes it difficult to grow row, forage, or other types of crops. Stakeholders and local ranchers have agreed the primary use of agriculture exempt land is for rangeland cattle. Properties east of IH-35, downstream of Willow Springs Creek watershed also have crops and pastured cattle. Bacteria can enter waterways from waste excreted by livestock and was considered in pollutant loadings and BMPs.
To calculate the amount of cattle, soil data from SSURGO and USDA stocking values were used to estimate the amount of forage per acre per year that can sustain a cattle animal unit. Poor forage conditions were used to calculate amount of available forage estimated in pounds per acre during drought conditions. Moreover, a conservative stocking rate of 25 percent was used to calculate the number of usable acres (3800 * 0.25 = 950 usable acres). Based on NRCS estimates one animal unit (mother and calf ) requires 30 lb. of forage per day. This equates to annual amount of 10,950 lb. per year to sustain one animal unit. These values were assigned to each subwatershed to perform the SELECT calculations.
Current potential watershed loadings for cattle are shown in Figure 1.9.
Figure 1.9 Existing E. coli load from cattle from SELECT calculations

23 The Meadows Center for Water and the Environment
Table 1.5 Water quality parameters, primary sources, and their potential causes
Ground/Source Water Water quality in streams can directly affect water quality in the aquifer because of rapid recharge through fractures and sinkholes in streambeds. The reverse is also true where springs contribute to river flows. Specialized and targeted monitoring will occur during the implementation of this plan to perform TDS constituent analyses to determine the amount of TDS that is naturally occurring because of the geology of the aquifer.
Summary of Water Quality Sources and Potential Causes
Table 1.5 summarizes parameters of concern by subbasin and their sources and potential causes. The primary causes of increased nitrogen levels in the watershed are due to residential and commercial application of fertilizers, OSSFs, and animal waste.
TSS levels spike when human activities disturb natural processes on otherwise undeveloped land and are exacerbated by storm events. E. coli bacteria are naturally present in the intestines of warm blooded animals and are attributed to OSSFs, pet waste, and wildlife.
Subbasin Numbers
Parameter Land Use/Land Cover Sources of Pollutant
Loads
Potential Causes
Sink Creek Watershed
1-9 TSS Commercial, Residential, Transportation
Anthropogenic activities where land cover is disturbed, impervious cover and natural processes on undeveloped land. Soil across much of the watershed is shallow which limits ground cover. Low base flows with periodic high flows and flooding.
Sessom Creek Watershed
10, 11 E. coli, Nitrogen, TSS
Commercial, Residential, Transportation
Residential and commercial application of fertilizer. OSSFs, animal waste, overland flow, impervious cover, atmospheric deposition and low flows.
City Park/Downtown
12, 13 E. coli, Nitrogen, TSS
Commercial, Residential, Industrial, Transportation, Undeveloped
Residential and commercial application of fertilizer. OSSFs, animal waste, overland flow, impervious cover, atmospheric deposition and low flows.
Purgatory Creek Watershed
14, 15 TSS Residential, Transportation, Crop, Range
Anthropogenic activities where land cover is disturbed, impervious cover and natural processes on undeveloped land. Soil across much of the watershed is shallow which limits ground cover. Low base flows with periodic high flows and flooding.
16, 20, 22, 24
E. coli, Nitrogen, TSS
Commercial, Residential, Industrial, Transportation, Crop
Residential and commercial application of fertilizer. OSSFs, animal waste, overland flow, impervious cover, atmospheric deposition and low flows.

The Upper San Marcos Watershed Protection Plan 24
Subbasin Numbers
Parameter Land Use/Land Cover Sources of Pollutant
Loads
Potential Causes
17 TSS Commercial, Transportation Anthropogenic activities where land cover is disturbed, impervious cover and natural processes on undeveloped land. Soil across much of the watershed is shallow which limits ground cover. Low base flows with periodic high flows and flooding.
18, 19 TSS Commercial, Residential, Transportation
Anthropogenic activities where land cover is disturbed, impervious cover and natural processes on undeveloped land. Soil across much of the watershed is shallow which limits ground cover. Low base flows with periodic high flows and flooding.
21 TSS Transportation Anthropogenic activities where land cover is disturbed, impervious cover and natural processes on undeveloped land. Soil across much of the watershed is shallow which limits ground cover. Low base flows with periodic high flows and flooding.
23 E. coli, TSS Commercial, Residential, Industrial, Transportation
Residential and Commercial application of Fertilizer. OSSFs, animal waste, overland flow, impervious cover, atmospheric deposition and low flows.
25 E. coli, Nitrogen, TSS
Commercial, Residential, Transportation
Residential and commercial application of fertilizer. OSSFs, animal waste, overland flow, impervious cover, atmospheric deposition and low flows.
Willow Springs Creek
26 Nitrogen, TSS Residential, Transportation Residential and commercial application of fertilizer. OSSFs, animal waste, overland flow, impervious cover, atmospheric deposition and low flows.
27 E. coli, Nitrogen, TSS
Commercial, Residential, Transportation
Residential and commercial application of fertilizer. OSSFs, animal waste, overland flow, impervious cover, atmospheric deposition and low flows.
28 TSS Commercial, Residential, Industrial, Transportation
Anthropogenic activities where land cover is disturbed, impervious cover and natural processes on undeveloped land. Soil across much of the watershed is shallow which limits ground cover. Low base flows with periodic high flows and flooding.
29, 30 E. coli, TSS Commercial, Residential, Industrial, Transportation
Residential and commercial application of fertilizer. OSSFs, animal waste, overland flow, impervious cover, atmospheric deposition and low flows.
31 E. coli, Nitrogen, TSS
Commercial, Residential, Industrial, Transportation
Residential and commercial application of fertilizer. OSSFs, animal waste, overland flow, impervious cover, atmospheric deposition and low flows.
32 TSS Undeveloped Anthropogenic activities where land cover is disturbed. Soil across much of the watershed is shallow which limits ground cover. Low base flows with periodic high flows and flooding.

25 The Meadows Center for Water and the Environment
Subbasin Scale Water Quality IssuesThe Meadows Center performed water quality modeling to assess existing land use conditions as of 2013, future land use conditions through 2035, and identified areas and potential sources of nonpoint source pollutants. The Hydrological Simulation Program – Fortran (HSPF) BASINS (Better Assessment Science Integrating Point and Nonpoint Sources) 4.1 was used to perform the subbasin and watershed scale nonpoint source analyses. BASINS 4.1 is a watershed and water quality-based assessment system developed by the EPA, that integrates geographical information system, national watershed data, and environmental assessment and modeling tools into one package. The HSPF model is a modeling tool within BASINS. The HSPF model simulates the movement of water, sediment, nutrients, and pesticides on pervious and impervious surfaces to model watershed hydrology and water quality. The HSPF model uses information such as the time history of rainfall, temperature, and solar radiation; land surface characteristics such as land-use patterns; and land management practices to simulate the processes that occur in a watershed. The results of this investigation characterize the time history of the quantity and quality of runoff and the effects of land use and impervious cover relative to existing and predicted future development patterns.
A combined modeling approach was used to estimate receiving water quality conditions at the watershed scale. The HSPF model was used to predict hydrology patterns for each of the 35 subbasins based upon historical rainfall, existing soils, and land use/land cover data for current and future conditions. Current land based pollutant loadings as of 2013 and modeled loadings in 2035 for each subbasin are located by parameter in Appendix C Subbasin Scale Water Quality Analyses.
HSPF model results were used to estimate loading to receiving streams of selected water quality constituents based upon commonly used EMCs. To account for load reductions resulting from existing flood control structures, pollution loads were accumulated at eleven locations near flood control structures or tributary confluences, referred to herein as accumulation points (Figure 1.11). Instream concentrations for each of these locations was estimated based upon HSPF flow and accumulated load at selected accumulation points. Pollutant loading for each constituent was accumulated in a post-processing spreadsheet using mass conservation and stream routing principals, where water and constituents in the water travel downstream.
Subbasin Numbers
Parameter Land Use/Land Cover Sources of Pollutant
Loads
Potential Causes
33 Nitrogen, Phosphorus, TSS
Commercial, Residential, Transportation, Crop
Residential and commercial application of fertilizer. OSSFs, animal waste, overland flow, impervious cover, atmospheric deposition and low flows.
34 TDS Commercial, Residential, Transportation Crop, Range
Residential and commercial application of fertilizer. OSSFs, animal waste, overland flow, impervious cover, atmospheric deposition and low flows.
35 Nitrogen, Phosphorus, TDS, TSS
Crop, Range, Undeveloped Residential and commercial application of fertilizer. OSSFs, animal waste, overland flow, impervious cover, atmospheric deposition and low flows.

The Upper San Marcos Watershed Protection Plan 26
Figure 1.10 HSPF Modeled Subbasins
Figure 1.11 Upper San Marcos WPP watershed boundaries, flood control structures, and accumulation points (penta-gons).

27 The Meadows Center for Water and the Environment
Conditions of receiving water quality were estimated in this project for three primary scenarios: current condition as of 2013, future condition in 2035, and modified future condition which includes the management measures included in the plan. Current conditions accounts for years of Hays County and COSM compliance with the TCEQ Edwards Aquifer Rule requiring TSS removal over the recharge zone. Differences between the current and future scenarios were used to identify what modifications (i.e. management measures) can be applied to the future condition scenario to result in favorable receiving water quality conditions in the future. Water quality conditions for the future scenario are presented here. Additional information about future water quality conditions and modeled current conditions can be found in Appendix C. Subbasin Scale Water Quality Analyses. Results and management implications for modified future conditions in five subbasins with the most significant future development are shown in Figures 2.2 and 2.3 and discussed in Management Measures for the Upper San Marcos Watershed, Section I. Edwards Aquifer Measures.
At the confluence of the San Marcos and the Blanco Rivers, where water quality standards are measured for the watershed, river flow is comprised primarily of high quality spring water. The influence of pollutants contributed via overland flow from tributaries is diluted by the spring water and tends to be lower than concentrations found in the intermittent tributaries. Instream concentrations were modeled for several points in the watershed and at the confluence to estimate cumulative totals of pollutants contributed from all subbasins. The estimated influence of existing flood control structures in the watershed were included in this analysis to account for the structural impacts (reduction) on nonpoint source pollution.
Model results for accumulation points and at the subbasin scale are presented in Table 1.6 and Table 1.7. These tables summarize the information presented for the future water quality scenario in Appendix C, Subbasin Scale Water Quality Analyses. This information includes required reductions in instream concentrations at the subbasin scale (labeled as “Instream Concentration Reductions Required for Standard/Screening”) and recommended land based load reductions to achieve water quality targets at each accumulation point (labeled as “Load Reduction Required at Standard/Screening”). For relevance, the subbasins are organized by the accumulation point to which they contribute. Table1.6 shows load reductions required from land based sources, and the difference in in-stream concentrations for nitrogen, phosphorus, TDS, and E. coli at the subbasin scale (no reductions are recommended at accumulation points for E. coli as bacteria exceedances typically only occur during storm events). Table 1.7 provides the same information for TSS. State standards, screening levels and stakeholder water quality targets can be found in Table 1.1.

The Upper San Marcos Watershed Protection Plan 28
Table 1.6 Future Accumulation Point and Subbasin Instream Concentrations and Required Reductions for E. coli, Nitro-gen, Phosphorus, and TDS
The following section provides information related to Element B. Estimate of the load reductions required from management measures.
Su
bb
asin
Nu
mb
er
Para
met
er
Futu
re L
oca
l Su
bb
asin
In
stre
am C
on
cen
trat
ion
Futu
re L
and
Bas
ed L
oad
Inst
ream
Co
nce
ntr
atio
n
Red
uct
ion
s R
equ
ired
for
Sta
nd
ard
/Scr
een
ing
Load
Red
uct
ion
R
equ
ired
at
Sta
nd
ard
/S
cree
nin
g
Diff
eren
ce in
co
nce
ntr
atio
n R
equ
ired
fo
r Tar
get A
Load
Red
uct
ion
R
equ
ired
for T
arge
t A
Diff
eren
ce in
co
nce
ntr
atio
n R
equ
ired
fo
r Tar
get
B
Load
Red
uct
ion
R
equ
ired
for T
arge
t B
NO REDUCTIONS REQUIRED for Accumulation Points 1-3 (Dam 1 - Upper Sink Creek, Dam 2 - Tributary to Sink Creek, Dam 3 - Lower Sink Creek) NO REDUCTIONS REQUIRED for Sink Creek Watershed (Subbasins 1-9)
Accumulation Point 8 (Sessom Creek at confluence)
n/a Nitrogen 1.63 --- --- --- --- --- 0.03 ---
Sessom Creek Subbasins
10 E. coli 132.74 79,673.10 6.74 4,045.61 19.34 11,608.36 31.74 19,051.07
Nitrogen 1.64 1,509.25 --- --- --- --- 0.04 38.97
11 E. coli 140.73 43,597.86 14.73 4,564.38 27.33 8,467.73 39.73 12,309.12
Nitrogen 1.62 769.30 --- --- --- --- 0.02 10.45
Accumulation Point 7 (Spring Lake)
n/a TDS 386.0 --- --- --- 6.0 --- 26.0 ---
NO REDUCTIONS REQUIRED for Accumulation Points 10-11(San Marcos River near IH-35, San Marcos River u/s Blanco River)
City Park/Downtown Subbasins
12 E. coli 179.76 188,386.30 53.76 56,342.56 66.36 69,546.93 78.76 82,541.71
Nitrogen 1.66 2664.28 --- --- --- --- 0.06 97.20
13 E. coli 165.18 61,613.24 39.18 14,614.63 51.78 19,314.49 64.18 23,939.75
NO REDUCTIONS REQUIRED for Accumulation Points 4-6(Dam 4 - Upper Purgatory Creek, Dam 5 - Lower Purgatory Creek, Purgatory Creek at confluence) NO REDUCTIONS REQUIRED for Subbasins 14, 15, 17-19
Purgatory Creek (and below) Subbasins
16 E. coli 104.36 144,929.62 --- --- --- --- 3.36 4,664.02
Nitrogen 1.64 3,492.94 --- --- --- --- 0.04 91.03
20 E. coli 111.85 58,137.60 --- --- --- --- 10.85 5,640.48
Nitrogen 1.64 1,305.17 --- --- --- --- 0.04 31.94
22 E. coli 107.88 62,083.89 --- --- --- --- 6.88 3,959.07
Nitrogen 1.66 1,458.90 --- --- --- --- 0.06 49.18
23 E. coli 139.92 83,254.68 13.92 8,280.69 26.52 15,778.09 38.92 23,156.48

29 The Meadows Center for Water and the Environment
*nc = not calculated*Instream measurements are in the following units: Nitrogen, Phosphorus, TDS =mg/L; E. coli= cfu/100mL*Land Based Loads are in the following units: Nitrogen, Phosphorus, TDS =lb/yr/subbasin; E. coli= billion cfu/yr/subbasin (geomean)
Su
bb
asin
Nu
mb
er
Para
met
er
Futu
re L
oca
l Su
bb
asin
In
stre
am C
on
cen
trat
ion
Futu
re L
and
Bas
ed L
oad
Inst
ream
Co
nce
ntr
atio
n
Red
uct
ion
s R
equ
ired
for
Sta
nd
ard
/Scr
een
ing
Load
Red
uct
ion
R
equ
ired
at
Sta
nd
ard
/S
cree
nin
g
Diff
eren
ce in
co
nce
ntr
atio
n R
equ
ired
fo
r Tar
get A
Load
Red
uct
ion
R
equ
ired
for T
arge
t A
Diff
eren
ce in
co
nce
ntr
atio
n R
equ
ired
fo
r Tar
get
B
Load
Red
uct
ion
R
equ
ired
for T
arge
t B
24 E. coli 198.75 56,837.56 72.75 20,805.28 85.35 24,408.51 97.75 27,954.55
Nitrogen 1.62 710.28 --- --- --- --- 0.02 9.77
25 E. coli 182.25 145,670.34 56.25 44,959.02 68.85 55,030.15 81.25 64,941.42
Nitrogen 1.69 2065 --- --- --- --- 0.09 107.05
NO REDUCTIONS REQUIRED for Accumulation Point 9(Willow Creek at confluence) NO REDUCTIONS REQUIRED for Subbasins 28 and 32
Willow Springs Creek (and below) Subbasins
26 Nitrogen 1.62 5,881.31 --- --- --- --- 0.02 88.41
27 E. coli 101.09 36,952.26 --- --- --- --- 0.09 32.24
Nitrogen 1.63 910.64 --- --- --- --- 0.03 15.20
29 E. coli 143.32 109,717.19 17.32 13,258.12 29.92 22,904.03 42.32 32,396.83
30 E. coli 153.00 290,620.89 27.00 51,279.30 39.60 3.53.46 52.00 98,767.71
31 E. coli 204.39 116,523.04 78.39 44,689.01 90.99 51,872.42 103.39 58,941.80
Nitrogen 1.66 1,451.11 --- --- --- --- 0.06 54.57
33 Nitrogen 1.81 3,786.05 --- --- 0.06 126.57 3.50 440.12
Phosphorus 0.93 674.72 0.24 nc 0.30 nc 0.38 nc
34 TDS 371.04 433,945.1 --- 467,817.7 --- 444,426.8 11.04 12,909.24
35 Nitrogen 2.79 447.31 0.84 134.13 1.04 166.25 1.19 190.34
Phosphorus 0.68 109.12 --- --- 0.06 9.54 0.13 20.79
TDS 637.52 102,390.00 237.52 64,242.26 257.52 61,030.15 277.52 44,571.94

The Upper San Marcos Watershed Protection Plan 30
Table 1.7 Future Accumulation Point and Subbasin Instream Concentrations and Required Reductions, TSS mg/l and lb/yr/subbasin
Su
bb
asin
Nu
mb
er
Futu
re L
oca
l Su
bb
asin
In
stre
am C
on
cen
trat
ion
Futu
re L
and
Bas
ed L
oad
Diff
eren
ce in
C
on
cen
trat
ion
Req
uir
ed
for
Sta
nd
ard
/Scr
een
ing
Load
Red
uct
ion
R
equ
ired
At
Sta
nd
ard
/S
cree
nin
g
Diff
eren
ce in
co
nce
ntr
atio
n R
equ
ired
Fo
r Tar
get A
Load
Red
uct
ion
R
equ
ired
Fo
r Tar
get A
Diff
eren
ce in
co
nce
ntr
atio
n R
equ
ired
Fo
r Tar
get
B
Load
Red
uct
ion
R
equ
ired
Fo
r Tar
get
B
Accumulation Point 1 (Dam 1 - Upper Sink Creek)
n/a 13.0 --- 8.0 --- 8.5 --- 9.0 ---
Accumulation Point 2 (Dam 2 – Tributary to Sink Creek)
n/a 18.8 --- 13.8 --- 14.3 --- 14.8 ---
Accumulation Point 3 (Dam 3 - Lower Sink Creek)
n/a 10.8 --- 5.8 --- 6.3 --- 6.8 ---
Sink Creek Subbasins
1 10.10 179,982.0 5.10 116,876.5 5.60 123,187.0 6.1 129,497.60
2 10.08 13,2190.8 5.08 51,485.55 5.58 59,556.08 6.08 67,626.60
3 9.94 72,686.5 4.94 54,688.39 5.44 56,488.2 5.94 58,288.01
4 10.10 105,959.8 5.10 77,846.97 5.60 80,658.25 6.1 83,469.53
5 10.10 12,012.02 5.10 9,074.02 5.60 9,367.82 6.1 9,661.62
6 9.83 67,421.35 4.83 54,437.75 5.33 55,736.11 5.83 57,034.47
7 10.14 27,046.03 5.14 18,301.78 5.64 19,176.2 6.14 20,050.63
8 10.10 23,389.96 5.10 19,895.58 5.60 20,245.02 6.1 20,594.46
9 10.10 7,048.41 5.10 5,994.64 5.60 6,100.02 6.1 6,205.39
Accumulation Point 8 (Sessom Creek at confluence)
n/a 61.8 --- 56.8 --- 57.3 --- 57.8 ---
Sessom Creek Subbasins
10 9.98 28,151.3 4.98 23,556.66 5.48 24,016.12 5.98 24,475.59
11 10.09 14,878.18 5.09 12,506.76 5.59 12,743.9 6.09 12,981.05
No Reductions Required for Accumulation Points 7, 10(Spring Lake, San Marcos River near IH35, San Marcos River u/s Blanco River)
Accumulation Point 11 (San Marcos River u/s Blanco River)
n/a 8.4 --- 3.4 --- 3.9 --- 4.4 ---
City Park/Downtown Subbasins
12 64.41 8.36 3.36 43,216.42 3.86 44,018.64 4.36 44,820.85
13 64.18 8.43 3.43 15,470.06 3.93 15,755.6 4.43 16,041.13
Accumulation Point 4 (Dam 4 - Upper Purgatory Creek)
n/a 13.6 --- 8.6 --- 9.1 --- 9.6 ---
Accumulation Point 5 (Dam 5 - Lower Purgatory Creek)
n/a 15.3 --- 10.3 --- 10.8 --- --- ---

31 The Meadows Center for Water and the Environment
Note: For subbasin scale TSS instream concentrations in this table, land based loadings and load reductions required were derived using the secondary analysis methodology based on average wet conditions.
Su
bb
asin
Nu
mb
er
Futu
re L
oca
l Su
bb
asin
In
stre
am C
on
cen
trat
ion
Futu
re L
and
Bas
ed L
oad
Diff
eren
ce in
C
on
cen
trat
ion
Req
uir
ed
for
Sta
nd
ard
/Scr
een
ing
Load
Red
uct
ion
R
equ
ired
At
Sta
nd
ard
/S
cree
nin
g
Diff
eren
ce in
co
nce
ntr
atio
n R
equ
ired
Fo
r Tar
get A
Load
Red
uct
ion
R
equ
ired
Fo
r Tar
get A
Diff
eren
ce in
co
nce
ntr
atio
n R
equ
ired
Fo
r Tar
get
B
Load
Red
uct
ion
R
equ
ired
Fo
r Tar
get
B
Accumulation Point 6 (Purgatory Creek at confluence)
n/a 28.2 --- 23.2 --- 23.7 --- 24.2 ---
Purgatory Creek (and below) Subbasins
14 25.45 9.02 4.02 156,719.8 4.52 165,807.5 5.02 174,895.2
15 24.02 11.04 6.04 135,008.2 6.54 141,297.6 7.04 147,587.1
16 48.05 9.61 4.61 47,583.12 5.11 48,646.21 5.61 49,709.31
17 36.16 8.91 3.91 27,792.3 4.41 28,777.57 4.91 29,762.84
18 57.37 8.71 3.71 124,839.3 4.21 127,372.3 4.71 12,9905.2
19 54.7 8.81 3.81 35,276.2 4.31 36,023.77 4.81 36,771.33
20 56.72 8.50 3.50 18,769.36 4.00 19,167.24 4.50 19,565.13
21 63.82 8.43 3.43 5,822.07 3.93 5,930.25 4.43 6,038.43
22 58.74 8.43 3.43 21,470.87 3.93 21,911.4 4.43 22,351.94
23 61.78 8.43 3.43 23,567.3 3.93 2,4022.8 4.43 24,478.29
24 67.57 8.32 3.32 12,410.11 3.82 12,629.02 4.32 12,847.93
25 65.79 8.34 3.34 33,696.58 3.84 34,308.44 4.34 34,920.29
Accumulation Point 9 (Willow Creek at confluence)
n/a 61.1 --- 56.1 --- 56.6 --- 57.1 ---
Willow Springs Creek (and below) SubbasinsNo reduction required for Subbasin 34
26 53.79 9.24 4.24 88,623.8 4.74 90,434.08 5.24 92,244.36
27 66.16 7.52 2.52 13,719.72 3.02 13,999.54 3.52 14,279.37
28 61.71 8.45 3.45 15,812.85 3.95 16,117.97 4.45 16,423.08
29 68.11 8.45 3.45 34,142.7 3.95 34,728.72 4.45 35,314.74
30 56.48 9.02 4.02 73,366.9 4.52 74,820.99 5.02 76,275.07
31 65.18 8.40 3.40 23,993.97 3.90 24,430.39 4.40 24,866.81
32 27.17 8.42 3.42 891.79 3.92 943.86 4.42 995.94
33 66.64 8.33 3.33 58,397.58 3.83 59,442.77 4.33 60,487.95
35 76.68 8.43 3.43 5,354.74 3.93 5,435.04 4.43 5,515.34

The Upper San Marcos Watershed Protection Plan 32
Figure 1.12 shows predicted subbasin scale water quality exceedances of state standards/screening levels and water quality targets. Subbasins contributing to exceedances in water quality constituents at the identified accumulation points in the watershed will be prioritized for the implementation of BMPs between 2017 and 2035. Both rural and urban subbasins across the watershed will be targeted for BMPs and management activities that reduce TSS. Subbasins within the Sessom Creek watershed will be targeted for BMPs and management activities that mitigate nitrogen and E. coli because Sessom Creek is a highly urbanized tributary that contributes significant sediment loads into the river, which is habitat for endangered species. Downtown/City Park area will also be targeted for BMPs and management because high use and visibility makes it an ideal location to raise public awareness about water quality and nonpoint source pollution through BMPs. Sink Creek was also prioritized by stakeholders for protective measures as it discharges into the headwaters, the most ecologically sensitive portion of the river. These activities are described in detail in the following section, Management Measures for the Upper San Marcos Watershed.
Figure 1.12 Parameters Exceeding Targets and/or Standards in the 2035 Scenario at the Subbasin Scale
Watershed Scale Water Quality Issues
Currently, occasional exceedances in TCEQ standards and screening levels occur. For examples of these exceedances, please see Water Quality Monitoring Information: Stormwater, Baseflow Monitoring Analyses section located in the Supporting Documents section on the SMWI website and Appendix C Subbasin Scale Water Quality Analyses, Current Instream Concentrations. This pollution is observed in relatively small quantities and infrequently – typically in conjunction with storm events that produce run off. This pollution is best managed at the subbasin scale. However, it is expected that both subbasin scale and watershed level pollution will rise as development and land use changes continue across the watershed.
Table 1.8 summarizes predicted future water quality exceedances by parameter and accumulation point. Exceedances are shown for state standards and screening levels as well as for more stringent instream pollutant levels identified by stakeholders, Table 1.1. In general, only the confluences at Sessom and Willow
33 The Meadows Center for Water and the Environment
Creek showed significant declines in multiple water quality parameters.
Future instream concentrations of TDS are expected to exceed Stakeholder Water Quality Target A at Spring Lake (modeling shows that future conditions are very similar to current conditions) and Target B in the main stem of the river (at IH-35 crossing and near the confluence with the Blanco River). Instream TDS concentrations throughout the watershed and at the confluence are not expected to exceed TCEQ standards in the future watershed scenario.
Model predictions for TSS show exceedances of TCEQ standards and both water quality targets in all locations, except Spring Lake and the main stem of the river near IH-35. During storm events, many intermittent tributaries exceed the water quality standards and the stakeholder goals for TSS (see the Groundwater Protection Planning: Additional Watershed Scale Water Quality Analyses located in the Supporting Documents section on the SMWI website, Accumulation points noted under Condition as “Storm Avg”).
Nitrate-Nitrogen predictions exceed only the most stringent water quality target levels (across a range of conditions including ambient conditions) at the Willow and Sessom Creek confluences.
Total phosphorus predictions are lower than the water quality targets and the TCEQ screening criterion of 0.69 mg/L at all locations for both existing and future conditions. An increase in total phosphorus is evident between current and future conditions in Willow Creek because of projected future land use changes, and in the San Marcos River main stem because of increased point source effluent discharges. This increase is discussed in the subbasin scale analysis.
Observed data and model outputs show that bacteria typically only exceed TCEQ standards during storm events. During storm events, many of the intermittent tributaries exceed the water quality standards and the target goals for E. coli bacteria (see the Groundwater Protection Planning: Additional Watershed Scale Water Quality Analyses located in the Supporting Documents section on the SMWI website, Accumulation points noted under Condition as “Storm Avg”). Storm water runoff is the primary source of nonpoint source pollution in all the tributaries.
Texas Stream Team (TST) monitoring has reported incidents of high levels of bacteria, especially at City Park, indicating that the source(s) may be localized. Localized sources may be best managed with watershed wide education and management activities at the subbasin scale.

The Upper San Marcos Watershed Protection Plan 34
Table 1.8 Future Cumulative Instream Concentrations at Accumulation Points and Required Reductions
Accumulation Point Predicted Future Parameters Exceeding TCEQ Standard/Screening Level, Target A (2025) and/or Target B (2035) & Concentration Reductions
Required
See Table 1.1 for water quality standards and targets
TDS mg/L
TDS Reduction Requiredmg/L
TSS mg/L
TSS Reduction Requiredmg/L
Nitrate- Nitrogen mg/L
Nitrate-Nitrogen Reduction Requiredmg/L
1. Dam 1 - Upper Sink Creek
-- -- 13 TCEQ=8 Target A=8.5Target B=9
-- --
2. Dam 2 - Tributary to Sink Creek
-- -- 18.8 TCEQ=13.8Target A=14.3Target B=14.8
-- --
3. Dam 3 - Lower Sink Creek
-- -- 10.8 TCEQ=5.8Target A=6.3Target B=6.8
-- --
4. Dam 4 - Upper Purgatory Creek
-- -- 13.6 TCEQ=8.6Target A=9.1Target B=9.6
-- --
5. Dam 5 - Lower Purgatory Creek
-- -- 15.3 TCEQ=10.3Target A=10.8Target B=10.8
-- --
6. Purgatory Creek at confluence
-- -- 28.2 TCEQ=23.2Target A=23.7Target B=24.2
-- --
7. Spring Lake 386 Target A=6 -- -- -- --
8. Sessom Creek at confluence
-- -- 61.8 TCEQ=56.8Target A=57.3Target B=57.8
1.63 Target B=0.03
9. Willow Creek at confluence
-- -- 61.1 TCEQ=56.1Target A=56.6Target B=57.1
1.60 At maximum for Target B
10. San Marcos River near IH-35
365 Target B=5 -- -- -- --
11. San Marcos River u/s Blanco River
-- -- 8.4 TCEQ=3.4Target A=3.9Target B=4.4
-- --

35 The Meadows Center for Water and the Environment
2 MANAGEMENT MEASURES FOR THE UPPER SAN MARCOS WATERSHED
Although the Upper San Marcos River was originally listed for TDS, modeling and monitoring identified additional existing and emerging water quality issues. This WPP addresses the previously listed impairment as well as E. coli, nutrients, sediment and other pollutants associated with future growth and development. Stakeholders felt it was important to implement water quality targets that provide higher levels of protection than the state standards and screening levels. To meet the protective goals, targets become more rigorous over time. The immediate goal is to meet state standards and then improve upon them incrementally in 2025 and 2035, through the implementation of additional BMPs and the use of adaptive management. Stakeholders elected to prioritize a wide range of management measures including ordinances, expanded use of TCEQ Edwards Aquifer Authority (EAA) measures, stream and riparian restoration efforts, stormwater retrofits, land conservation, education, and voluntary programs.
Table 1.8 shows the predicted future exceedances and stakeholder goals for reductions of instream concentrations of pollutants at several key points in the watershed. The primary constituents requiring treatment are TSS and bacteria. Water quality modeling shows that there may not be any exceedances at the confluence of the Upper San Marcos River with the Blanco River (where water quality parameters are measured for the watershed). However, many of the subbasins within the watershed show increased levels of TSS and bacteria in the future scenario. Stakeholders determined that the best course of action to protect water quality would be to achieve load reductions at the key accumulation points in Table 1.8.
A Comprehensive ApproachThe TCEQ Edwards Aquifer rules were developed to protect water quality in the Edwards Aquifer, including its wells and springs, water sources, and upland areas draining directly to the aquifer and surface streams. These rules, found in Title 30 Texas Administrative Code (TAC) Chapter 213, address activities that threaten water quality and apply specifically to the contributing and recharge zones within the Edwards Aquifer in eight counties, including those encompassed by the Upper San Marcos Watershed. BMPs to reduce the impact of development activities on water quality in and upstream of the aquifer are required for compliance with these rules. A technical guidance document provides detailed descriptions of available BMPs.
The COSM, Texas State University, and Hays County are required to follow these regulations in areas of the watershed that are designated as contributing and recharge zones to the aquifer, as seen in Figure 2.1.
In addition, optional enhanced water quality measures and BMPs were developed to provide a higher level of water quality and to enhance the protection of threatened and endangered species and can be applied to the watershed. The Optional Enhanced Measures for the Protection of Water Quality in the Edwards Aquifer - Appendix A to RG-348. Step-by-step guide to activities affected by the Edwards Aquifer rules in eight counties: Williamson, Travis, Hays, Comal, Bexar, Medina, Uvalde, and Kinney can be found in the TCEQ Edwards Aquifer Optional Enhanced Water Quality Protection Measures in the Supporting
The following section provides information related to:
Element B. Estimation of load reductions expected from management strategies

The Upper San Marcos Watershed Protection Plan 36
Figure 2.1 Upper San Marcos Water and Edwards Aquifer Zones
Documents section on the SMWI website. The USFWS issued a concurrence that “these voluntary enhanced water quality measures will protect endangered and candidate species from impacts due to water quality degradation.”
Stakeholders determined that an important and economically sensible protective measure for the Upper San Marcos River watershed would be the adoption and expansion of TCEQ Edwards Aquifer rules and enhanced measures. The expansion would include the implementation of the enhanced measures over the entire recharge zone, expansion of the contributing zone to all city and Extraterritorial Jurisdiction (ETJ) boundaries, expansion of stream buffer requirements over the recharge zone, river corridor, and future development, and changing the current river corridor ordinances to mirror TCEQ enhanced rules. This has been proposed in the latest LDC Draft (included on SMWI website under Supporting Documents) and is recommended by the WQPP. Several areas for increased water quality protection measures are noted:
• Recharge Zone – Development is required to implement water quality controls, under both TCEQ and COSM jurisdictions.
• Contributing Zone within the Transition Zone – A separate unit of the Edwards Aquifer south and east of the recharge zone that drains “back” into the recharge zone. Development is not required to implement water quality controls by either TCEQ or the COSM.
• Transition Zone – A unit of the Edwards Aquifer south and east of the recharge zone that can impact the aquifer if recharge features are present. Development is not required to implement water quality controls by TCEQ, and only by the COSM.
• San Marcos River Corridor (SMRC) and “all other watersheds” – Development is required to implement

37 The Meadows Center for Water and the Environment
water quality controls within the SMRC, but not in watersheds draining to critical habitat if located outside the SMRC.
• Sessom Creek Watershed – Development is not required to implement water quality controls, but a special regulatory district has been proposed by Code SMTX.
• Spring Lake Watershed – There are mixed levels of protection/non-protection, as the watershed contains portions in the recharge zone, contributing zone within the transition zone, and transition zone, plus there is confusion as to whether the Slough Arm is part of Spring Lake or in Sink Creek (by most accounts, it is part of Spring Lake).
The WQPP also identified all areas of concern for protection of critical habitat using only 3 designations:
• Water Quality Zone A = Recharge Zone• Water Quality Zone C = Contributing Zone within Transition Zone• Water Quality Zone T/R = Transition and River Zone
A review of expected load reductions from the adoption of the TCEQ Edwards Aquifer rules is provided in the Future Conditions with Edwards Aquifer Management Measures Section. The BMP implementation schedule is categorized by vulnerability (see Areas of Vulnerability Section) and watershed-wide measures. For a full list of BMPs and adaptive measures, please see the Groundwater Protection Planning document on the SMWI website under Supporting Documents and Appendix D Comprehensive Watershed BMPs.
Future Conditions with Edwards Aquifer Management Measures Much of the Upper San Marcos River watershed is located within the COSM which represents an urban, developed area. Five subbasins with the most potential for significant future development were identified (Figures 2.2). For these subbasins, the effect of existing water quality control guidelines was evaluated when applied to new development areas. Areas 6 (subbasin within Sink Creek watershed), 16 (subbasin within Purgatory Creek watershed), and 18 (subbasin within Purgatory Creek watershed) are all located within the Edwards Aquifer Recharge Zone (EARZ) or Contributing Zone (Figure 2.3); therefore, any development will be required to construct stormwater quality capture and treatment structures. Areas 26 and 27 (both subbasins within Willow Creek watershed) have portions of new development within those zones, but other portions lie in the transition zone where the stormwater quality requirements do not apply. Despite this, any development within the transition zone were treated in this analysis as if they were entirely within the recharge zone boundary and subject to the same rules. Treating the areas within the transition zone that are likely to be developed as if they were entirely within the recharge zone will enhance water quality protection and improve overall instream concentrations of most pollutants.

The Upper San Marcos Watershed Protection Plan 38
Figure 2.2 Map of Subbasins with Significant Future Development Note: Bold outlines: Subbasins 6, 16, 18, 26, 27. Pink areas represent proposed development.
Figure 2.3 Map of Subbasins with Significant Future Development with Overlay for Edwards Aquifer Zone Boundaries.

39 The Meadows Center for Water and the Environment
Figure 2.4 Concentration of TDS in Selected Developing Subbasins Note: TCEQ Standard is 400 mg/L
Expected future concentrations of pollutants for these subbasins are presented in Figures 2.4 through 2.8. Future concentrations with management measures applied (“Future w/BMPs”) are based on removal efficiencies presented in Appendix D. With increased development, TDS is expected to decrease slightly because of conversion of cropland and rangeland into areas that generate less dissolved solids in runoff (Figure 2.4). Stormwater treatment has a beneficial impact on TSS in the subbasins where the “Future w/BMPs” concentrations are generally lower than the existing and future conditions (Figure 2.5). This arises because of the replacement of natural areas with developed areas where 80% removal of TSS is required as part of the EARZ rules. This will not be the case across the watershed, but is anticipated to hold true in areas where TCEQ Edwards Aquifer rules and enhanced option measures are applied.
Additional mitigation efforts will be a priority in watersheds within recharge and contributing zones with higher loadings of nitrogen and bacteria. Because nitrogen and bacteria removal are more difficult using typical stormwater management measures, the nitrogen and E. coli concentrations are not significantly reduced for the future conditions with BMPs (Figure 2.5 and 2.6). Concentration of total phosphorus in the future, with management measures applied, is higher than existing conditions, but significant removal is exhibited (Figure 2.8).

The Upper San Marcos Watershed Protection Plan 40
Figure 2.5 Concentration of TSS in Selected Developing Subbasins Note: TCEQ standard is 5.0 mg/L for base flow and average storm events.
Figure 2.6 Concentration of TN in Selected Developing Subbasins Note: TCEQ screening level is 1.95 mg/L

41 The Meadows Center for Water and the Environment
Figure 2.8 Concentration of Total Phosphorus in Selected Developing Subbasins Note: TCEQ screening level is 0.69 mg/L
Figure 2.7 Concentration of E. coli in Selected Developing Subbasins Note: TCEQ currently recommends a geomean water quality standard for E. coli of 126 cfu/100mL in freshwater streams.

The Upper San Marcos Watershed Protection Plan 42
Areas of Vulnerability Modeling outputs identifying individual subbasins with water quality exceedances are presented in Appendix C. Initial findings indicate that while urban development does increase pollution, the BMPs currently in place, coupled with the unique hydrology in the watershed result in manageable pollutant loads in the main stem of the river. The percentage of urban land, even with the predicted full development, is relatively small compared to undeveloped land. Further, the tributaries only provide flow during storm events and travel through primarily open lands. The water is then impounded behind flood control dams. It is likely that these dams allow sediment and pollutants to settle out from the water column and curtail the contribution of these pollutants to downstream reaches of the river. In the more urbanized portion of the watershed, nearly the entire flow is comprised of spring water. At the confluence with the Blanco River, where water quality standards are measured, the river flow is primarily pristine spring water and all water quality parameters are being met during ambient conditions. However, model outputs show exceedances in water quality standards in many subbasins in the urban portion of the watershed. Preventing impairments at the confluence will depend upon successful pollution mitigation in the most impaired subbasins.
The Meadows Center sought input from the SMWI subcommittees and Core Committee to determine areas of vulnerability in the watershed. Each Subcommittee was first asked to identify concerns and threats to water quality in the watershed based on their area of expertise. They were then asked to rank or prioritize their identified concerns/threats within the watershed to determine the top 5 concerns or threats. These top five lists were then compiled to determine overlapping concerns/threats, which correlated with model outputs. Results of the stakeholders’ perceived watershed vulnerabilities and general findings from water quality modeling efforts are summarized as follows for urbanized and rural areas.
Urbanized Areas
While the subbasins of the Upper San Marcos River watershed are largely rural, the main stem of the river lies within the COSM. This section of the river (and its riparian areas and subbasins) was identified as the most vulnerable area of the watershed due to its proximity to residential, commercial, and industrial land uses, and transportation corridors, as well as its use for recreation. Stormflows are the primary concern in urban areas as they carry pollution from impervious cover associated with these land uses at increased loadings and velocity. Increased velocity of stormflow from impervious cover contributes to bank erosion. Recreation in the main stem exacerbates the existing effects of urbanization. Recreation brings increased trash, increased sedimentation, substrate and habitat damage, and increased bank erosion. Riparian zones of the main stem and tributaries where vegetation and stream banks are threatened by recreation access are also of concern.
Rural Areas
A majority of the Upper San Marcos River watershed is largely undeveloped. Small acreage agricultural/ranching lots and low density suburban development are the dominant land uses in the rural, non-urbanized areas of the watershed. Concerns/threats in these areas include stormwater runoff from domestic and wildlife waste, fertilizers associated with agriculture/ranching operations and residential applications. Tributaries in the rural portion of the basin only provide flow during storm events and travel through primarily open lands. The water is then impounded behind flood control dams. It is likely that these dams allow sediment and pollutants to settle out from the water column, mitigating pollutants from stormflow

43 The Meadows Center for Water and the Environment
Stakeholder Identified BMPsThe following sections catalog the BMPs and other management activities researched, selected, and approved by the SMWI Stakeholders to mitigate current, as well as future potential water quality degradation in the watershed above and beyond the recommended expanded LDC protections. A subset of these BMPs was prioritized for immediate implementation, while others will be implemented over many years, as required to mitigate nonpoint source pollution from future development and other activities in the watershed. When possible, these suggested measures are linked to:
P Groundwater protection strategies (see the Groundwater Protection Planning document on the SMWI website under Supporting Documents)
P E&O components to prevent nonpoint source pollution, increase awareness of WPP activities and increase compliance with new water quality protection regulations, ordinances and best practices (E&O Plan, Section 3) and
P The Monitoring Plan that will track BMP and WPP effectiveness and identify new water quality threats as they arise (Section 3).
The BMPs and management measures outlined in this plan are coordinated to the extent possible with EAHCP, MS4 efforts, and with COSM and University implementation of Master Planning and other water quality and watershed protection efforts.
Number, Type and Placement of Measures
Table 1.5 summarizes the primary types and causes of pollution by subwatershed and subbasin, as determined by modeling and monitoring. Note that the major land uses listed as pollutant contributors include Commercial, Residential, Industrial, and Transportation. Additional detailed information is provided in Appendices C and D. This information, along with load reduction calculations and analysis of water quality were used to guide the placement, type, and priority of BMP implementation in each
in some areas of the watershed. However, some of these pollutants may enter the aquifer and contaminate groundwater supplies that later reemerge as source water in Spring Lake and other spring fed systems. Future development in rural areas may impact karst recharge features, potentially limiting infiltration of stormwater into the aquifer or increasing the infiltration of nonpoint source pollutants into groundwater supplies.
The following section provides information related to:
Element C. Description of the nonpoint source management measures that will need to be implemented to achieve load reductions;
Element F. Schedule for implementation of management strategies;
Element G. Description of interim, management milestones for determining whether management strategies are being implemented; and
Element H. Set of criteria that can be used to determine whether loading reductions are being achieved over time and substantial progress is being
made toward attaining water quality standards.

The Upper San Marcos Watershed Protection Plan 44
subbasin. These BMPs will be used to meet state requirements and stakeholder selected targets for water quality at each of the accumulation points in the watershed that require improvements.
Categories of Measures
Measures outlined in the following sections for immediate and future implementation include structural BMPs, water quality protection measures for new development, retrofits for existing development, and projects to encourage adoption of water quality protection practices. Also included are non-structural management measures: land management strategies, preservation of undeveloped land, and information gathering to address remaining water quality data gaps. A general summary of these measures is presented by applicable location within the watershed:
P Urban and suburban areasP Rural and undeveloped areasP Watershed wide
Detailed lists of BMPs and management measures are provided in Appendix D and are organized in the following categories:
P Stakeholder selected regionally appropriate measuresP Low impact development (LID) and green infrastructure incentives P EAHCP WQPP measuresP Additional potential water quality retrofits P Land development codes P Land conservation and management
Implementation Timeline and Milestones
While stakeholders recognized that water quality goals for the watershed must be long term (through 2035), implementation of BMPs should be considered over shorter time periods. Stakeholders selected a set of BMPs for immediate implementation (high priority in years 1-5, years 1-3 for groundwater and education/outreach measures). Additional BMPs were selected for adaptive management and may be used to replace initially prioritized measures, add capacity to high priority measures or expand pollution mitigation efforts as needed. These BMPs will be implemented as part of an adaptive management cycle over time, based on progress toward meeting milestones and water quality goals. If associated water quality concentrations are not trending downward on an annual basis, measures for that reach or subbasin will be reviewed.
Milestones are check points to ensure that the Plan is on schedule and meeting goals. Measurable milestones can be documented through load reductions (e.g. (for example) 5% reduction of TSS) or area of coverage (e.g. 5,000 feet of permeable sidewalk constructed). If the milestones are not achieved, the appropriate adaptive management will be initiated, monitored, and adjusted as needed. Continued monitoring for water quality, groundwater, biology, and flows are necessary for the Stakeholder Committee to know if the plan is successful at maintaining or improving water quality. The strategy developed by the committee involves compiling existing data and newly collected data into datasets that can be analyzed to identify water quality trends and threats (Chapter 4. Monitoring Plan). If this data does not show significant improvements in water quality (5% improvement, at least for annual average and geomean), then adaptive management may be triggered. Implementation progress and any implementation changes resulting from adaptive management will be included in updates to the WPP.
45 The Meadows Center for Water and the Environment
Milestones along with management measures scheduled for implementation in the first five years of implementation are presented in the Tables 2.1 through 2.3. The potential pollution prevention, when available, is provided as a percentage per BMP or unit as future pollution loadings are estimated and are only as accurate as the current level of available data allows. If a BMP cannot be implemented or monitoring shows that the desired pollution mitigation is not being achieved, stakeholders will select adaptive measures from the comprehensive list of selected BMPs in Appendix D.
BMPs for Implementation Through the watershed protection planning efforts, the Stakeholder Committee determined that initial implementation activities should focus on coordinating efforts, protecting flow, and improving water quality. This will be accomplished by increasing coordination of existing Community, City, University, and County efforts to address threats to water quality, implementing BMPs, protecting undeveloped land necessary for recharge and filtration of pollutants, and mitigating stormflow in urban areas (LID and green infrastructure).
Because stakeholders chose to assess pollutant loads at the subbasin level and accumulation points, there are multiple goals associated with pollutant reduction, as shown in Table 1.1 (future cumulative instream concentration at accumulation points). Watershed wide targets were determined by stakeholders as shown in Table 1.1. Measures to achieve the water quality targets are presented as urban/suburban measures, rural and undeveloped measures, and watershed-wide measures. Additional pollution mitigation activities include source water management and education and outreach.
These measures will be implemented over many years, beginning in years 1 through 5, with BMPs and activities designed to reduce pollution in existing priority areas and to increase public awareness of nonpoint source pollution. As development and subsequent pollution increase in the watershed, stakeholders will need to assess changes in water quality and select appropriate BMPs to address pollutant loads.Stakeholder water quality targets will be met through the implementation of the BMPs proposed in Tables 2.1 and 2.2 and adaptive management.
Urban and Suburban Measures
Table 2.1 lists the BMPs selected for implementation in urban and suburban areas in years 1-5. Other relevant measures are presented in the watershed-wide section. Additional measures will be selected over time to ensure that water quality targets are being met throughout the watershed.
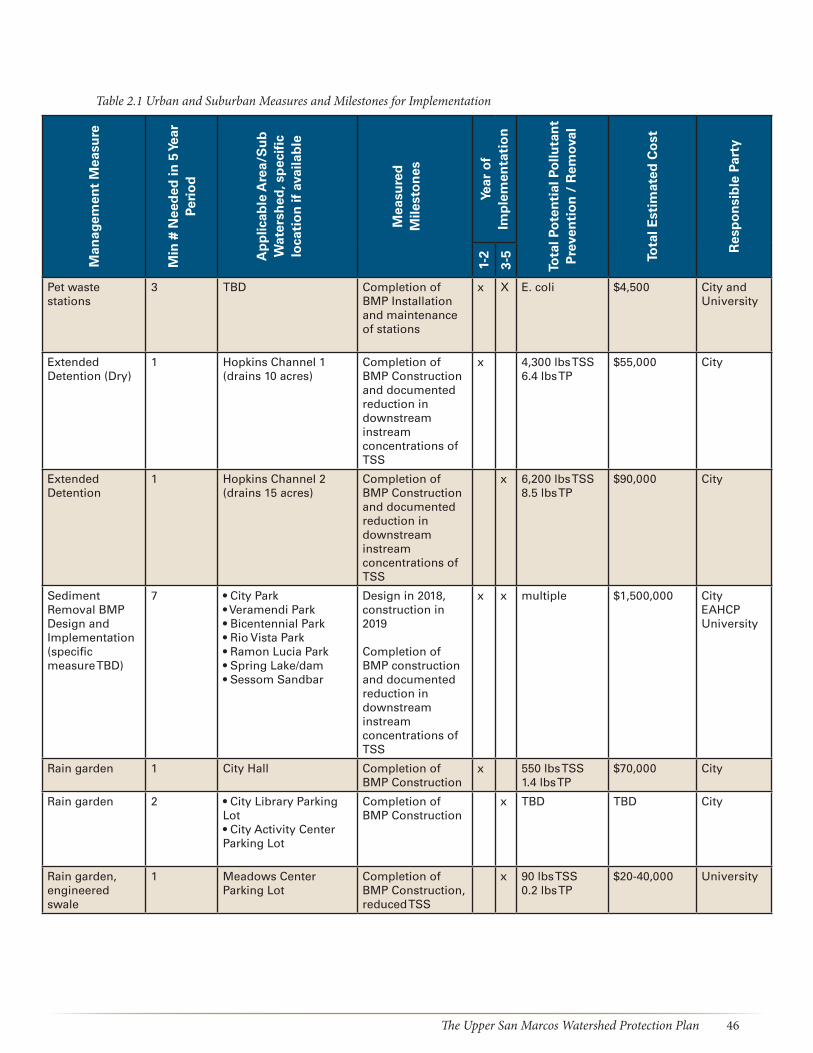
The Upper San Marcos Watershed Protection Plan 46
Table 2.1 Urban and Suburban Measures and Milestones for Implementation M
anag
emen
t M
easu
re
Min
# N
eed
ed in
5 Y
ear
Peri
od
Ap
plic
able
Are
a/S
ub
Wat
ersh
ed, s
pec
ific
loca
tio
n if
ava
ilab
le
Mea
sure
dM
ilest
on
es
Year
of
Imp
lem
enta
tio
n
Tota
l Po
ten
tial
Po
lluta
nt
Pre
ven
tio
n /
Rem
oval
Tota
l Est
imat
ed C
ost
Res
po
nsi
ble
Par
ty
1-2
3-5
Pet waste stations
3 TBD Completion of BMP Installation and maintenance of stations
x X E. coli $4,500 City and University
Extended Detention (Dry)
1 Hopkins Channel 1 (drains 10 acres)
Completion of BMP Construction and documented reduction in downstream instream concentrations of TSS
x 4,300 lbs TSS6.4 lbs TP
$55,000 City
Extended Detention
1 Hopkins Channel 2(drains 15 acres)
Completion of BMP Construction and documented reduction in downstream instream concentrations of TSS
x 6,200 lbs TSS 8.5 lbs TP
$90,000 City
Sediment Removal BMP Design and Implementation (specific measure TBD)
7 • City Park• Veramendi Park• Bicentennial Park• Rio Vista Park• Ramon Lucia Park• Spring Lake/dam• Sessom Sandbar
Design in 2018, construction in 2019
Completion of BMP construction and documented reduction in downstream instream concentrations of TSS
x x multiple $1,500,000 City EAHCPUniversity
Rain garden 1 City Hall Completion of BMP Construction
x 550 lbs TSS 1.4 lbs TP
$70,000 City
Rain garden 2 • City Library Parking Lot• City Activity Center Parking Lot
Completion of BMP Construction
x TBD TBD City
Rain garden, engineered swale
1 Meadows Center Parking Lot
Completion of BMP Construction, reduced TSS
x 90 lbs TSS0.2 lbs TP
$20-40,000 University

47 The Meadows Center for Water and the Environment
Man
agem
ent
Mea
sure
Min
# N
eed
ed in
5 Y
ear
Peri
od
Ap
plic
able
Are
a/S
ub
Wat
ersh
ed, s
pec
ific
loca
tio
n if
ava
ilab
le
Mea
sure
dM
ilest
on
es
Year
of
Imp
lem
enta
tio
n
Tota
l Po
ten
tial
Po
lluta
nt
Pre
ven
tio
n /
Rem
oval
Tota
l Est
imat
ed C
ost
Res
po
nsi
ble
Par
ty
1-2
3-5
Rain garden and Rainwater Harvesting (RWH)
3 • Alamo Neighborhood Garden• Fire Station• Freeman Aquatic Biology Building
Completion of green infrastructure - RWH with “Smart” controller system and Rain Garden
x TBD TBD City University
Storm Drain Inlet System
1 City Park at Hutchinson Street
Completion of BMP Construction
x 70-80% TSS $25,000 City
Extended detention/vegetated channel
1 Dunbar Park Completion of BMP Construction and documented reduction in downstream instream concentrations of TSS
x 8,100 lbs TSS40 lbs TP
$360,000 City
Extended Detention / Sedimentation Pond
1 Veramendi Park (beside Hopkins St Bridge)
Completion of BMP Construction and documented reduction in downstream instream concentrations of TSS
x 87% of all runoff8.5lbs TP
$73,000 City
Infiltration and Extended Detention Pond
1 Wastewater facility(treat 176 acres)
Completion of BMP Construction and documented reduction in downstream instream concentrations of TSS
x 93% capture efficiency 141 lbs TP
$1,524,000 City
Biofiltration Pond/Treatment
1 Veterans Memorial Park (treat 86 acres, 55% impervious)
Completion of BMP Construction and documented reduction in downstream instream concentrations of TSS, P
x 63.8 lbs TPTSS TBD
$319,100 City
Streambank Restoration and Stabilization & Riparian Restoration
2 Canyon Road reach of Sessom Creek/Reach 2 (labeled Restor 9)Windmill Tributary to Sessom Creek (labeled Restor 10)
Completion of BMP Construction and documented reduction in downstream instream concentrations of TSS
x 503 lbs TSS (50%), 1.6 lbs TP (50%), 6.7 lbs TN (50%)250 lbs TSS (66%), .6 lbs TP (66%), 3.35 lbs TN (66%)
$150,000-200,000
CityEAHCP

The Upper San Marcos Watershed Protection Plan 48
Man
agem
ent
Mea
sure
Min
# N
eed
ed in
5 Y
ear
Peri
od
Ap
plic
able
Are
a/S
ub
Wat
ersh
ed, s
pec
ific
loca
tio
n if
ava
ilab
le
Mea
sure
dM
ilest
on
es
Year
of
Imp
lem
enta
tio
n
Tota
l Po
ten
tial
Po
lluta
nt
Pre
ven
tio
n /
Rem
oval
Tota
l Est
imat
ed C
ost
Res
po
nsi
ble
Par
ty
1-2
3-5
Repair and Stabilize Tributary/Outfall/Retaining Wall
3 Sessom Creek Outfall to SM River (labeled Restor 1)
Sessom Creek Retaining Wall Tributary (labeled Restor 4)
N LBJ Sessom Tributary, (labeled Restor 7) in conjunction with RPS Espy projects 7-9
Completion of repairs
x TBD TBD City
Detention Pond Restoration and retrofit as an extended detention pond
1 “Gulch” Detention Pond
(labeled Restor 8) in conjunction with RPS Espy project 10
Restoration completed
Retrofit completed
x 27 lbs TP, 13.9 lbs TP (retrofit)TSS TBD
$500,000 University
Turf Management System Plan
1 General - As required in section 5.4.9 of the EAHCP and in consideration of BMPs 5.01 and 5.06 of the City’s stormwater management plan, develop a Management Plan to minimize the potential water quality impact of municipal athletic fields.
Completed and implemented Turf Management System Plan
x TBD TBD City, Parks and Rec
Hog Removal 1 Feral hog trap installed on University campus to reduce hog numbers/impact
Hogs removed x TBD TBD University
Sediment Removal and Retrofit
1 Sessom Wet Pond(treats 476 ac)
Sediment removal and retrofit completed
x 253 lbs TPTSS - TBD
TBD University
Land Conservation
1 Sessom watershed, Headwater Tract
Preservation of headwater protection via purchase, easement, management activities
x TBD $115,000 City

49 The Meadows Center for Water and the Environment
Man
agem
ent
Mea
sure
Min
# N
eed
ed in
5 Y
ear
Peri
od
Ap
plic
able
Are
a/S
ub
Wat
ersh
ed, s
pec
ific
loca
tio
n if
ava
ilab
le
Mea
sure
dM
ilest
on
es
Year
of
Imp
lem
enta
tio
n
Tota
l Po
ten
tial
Po
lluta
nt
Pre
ven
tio
n /
Rem
oval
Tota
l Est
imat
ed C
ost
Res
po
nsi
ble
Par
ty
1-2
3-5
Riparian Restoration, Restricted River Access Points,
2 Cape’s Camp and TBD Completion of efforts to limit river access points by establishing native riparian areas and promoting entry points to the river that minimize erosion and littering; signage
x TBD $30,000 City
Pervious Walkways
1 Meadows Center Peninsula, Americans with Disabilities Act Walking Paths
Removal of impervious surface, replacement with pervious material; reduced sediment and visible substrate entering lake
x 148 lbs TSS 0.2 lbs TP
$76,000 University
Pervious Walkways
1 University Campus TBD
Design; removal of impervious surface, replacement with pervious material
x TBD, minimum of 50 lbs TSS
TBD University
Parking Lot Retrofit
1 Meadows Center Parking Lot
Removal of impervious cover and replacement with pervious material;
x 684 lbs TSS1.8 lbs TP
$600,000 University
Parking Lot Retrofit
1 TBD on campus, from approved list
Removal of impervious cover and replacement with pervious material
x TBD TBD University
Riparian Buffers 2 Managed Buffer Areas
TBD Identify and prioritize locations for implementation, commitments for buffer management
x N – 50%TSS – 74%E. coli – 30%
TBD City, SMGA and other
Xeriscaping/Nativescaping
1 City, 1 University area
Subbasins 10, 11, 12, 13, 16, 20, 22, 23, 24, 26
Establishment of at least 2 areas and use in new development
x Sediment – 94%N – 23% P – 97%
$10/lin. ft. per 900 ft2. vegetated installation,+ $200/year for maintenance
City, University, HOA
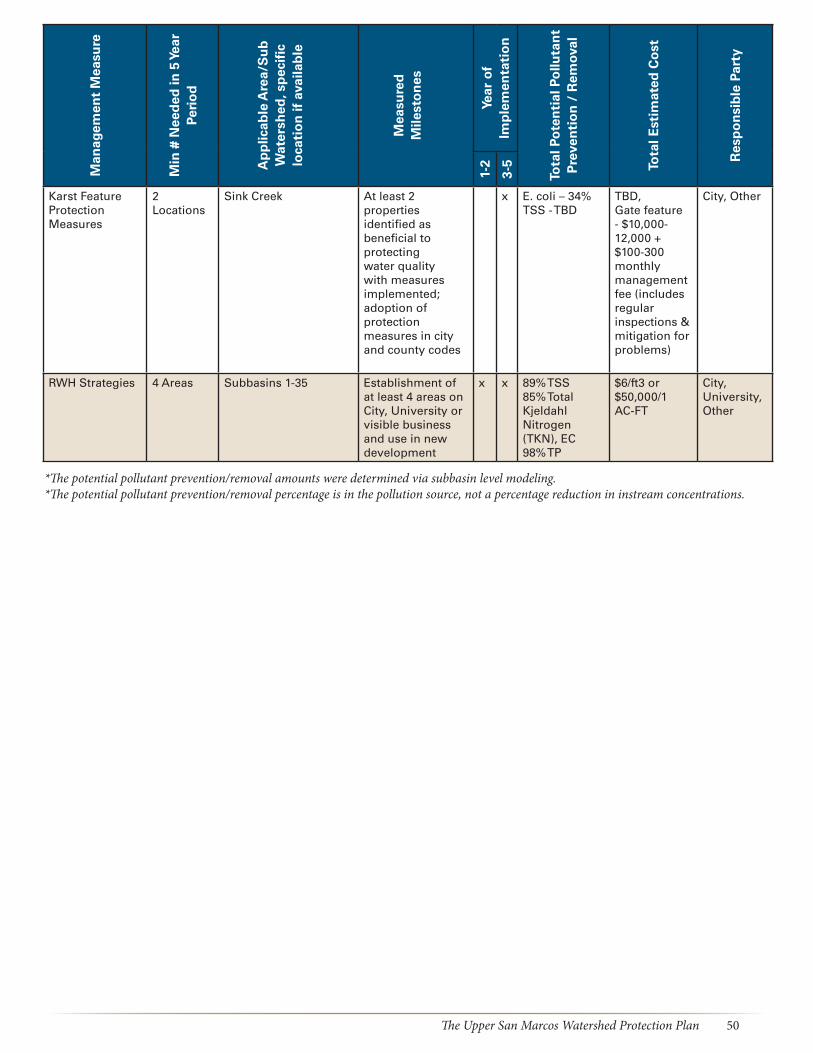
The Upper San Marcos Watershed Protection Plan 50
Man
agem
ent
Mea
sure
Min
# N
eed
ed in
5 Y
ear
Peri
od
Ap
plic
able
Are
a/S
ub
Wat
ersh
ed, s
pec
ific
loca
tio
n if
ava
ilab
le
Mea
sure
dM
ilest
on
es
Year
of
Imp
lem
enta
tio
n
Tota
l Po
ten
tial
Po
lluta
nt
Pre
ven
tio
n /
Rem
oval
Tota
l Est
imat
ed C
ost
Res
po
nsi
ble
Par
ty
1-2
3-5
Karst Feature Protection Measures
2 Locations
Sink Creek At least 2 properties identified as beneficial to protecting water quality with measures implemented; adoption of protection measures in city and county codes
x E. coli – 34%TSS - TBD
TBD,Gate feature - $10,000-12,000 + $100-300 monthly management fee (includes regular inspections & mitigation for problems)
City, Other
RWH Strategies 4 Areas Subbasins 1-35 Establishment of at least 4 areas on City, University or visible business and use in new development
x x 89% TSS85% Total Kjeldahl Nitrogen (TKN), EC98% TP
$6/ft3 or $50,000/1 AC-FT
City, University, Other
*The potential pollutant prevention/removal amounts were determined via subbasin level modeling. *The potential pollutant prevention/removal percentage is in the pollution source, not a percentage reduction in instream concentrations.

51 The Meadows Center for Water and the Environment
Rural and Undeveloped Land Measures
Tables 2.3 and 2.4 list the BMPs selected for implementation in rural areas in years 1-5, as well as land conservation activities. Although land conservation efforts are expected to be basin wide, stakeholders identified Sink Creek as the highest priority because:
• It has a high risk of future development,• It is a major contributor of stormwater pollution which delivers a large amount of pollutants, and• Water from Sink Creek resurfaces in the headwaters of the San Marcos River.
(See Watershed Characterization supporting document on the San Marcos Watershed Initiative website and Appendix B for subbasin level modeling that shows levels of pollution). Other relevant measures are presented in the watershed-wide section.
Table 2.2 Rural Measures and Milestones for Implementation to be implemented in Years 3-5
Management Measure
Min # Needed,
5 Year Period
Applicable Area/Sub
Watershed, specific
location if available
MeasuredMilestones
Potential Pollutant
Prevention / Removal
Total Estimated
Cost
Responsible Party
Karst Feature Protection Measures
1 Location TBD, outside ETJ
At least 1 property identified as beneficial to protecting water quality with measures implemented; adoption of protection measures in city and county codes
E. coli – 34%TSS - TBD
TBD, Gate feature - $10,000-12,000 + $100-300 monthly management fee
County (coordinated with City)
Riparian Buffers/Vegetated filter strips or equivalent
2 Managed Buffer Areas
TBD, outside ETJ
Identify and prioritize locations for implementation, commitments for buffer management
N – 50%TSS – 74%E. coli – 30%
TBD County
Land Conservation Toolbox
1 All subbasins with large tracts of undeveloped land
Development of a tool box to provide information and resources to landowners regarding land management best practices and conservation opportunities*Should be updated as City and County programs change
N/A $10,000 plus printing costs
City, County, University, SMRF, other

The Upper San Marcos Watershed Protection Plan 52
Management Measure
Min # Needed,
5 Year Period
Applicable Area/Sub
Watershed, specific
location if available
MeasuredMilestones
Potential Pollutant
Prevention / Removal
Total Estimated
Cost
Responsible Party
Agricultural Management Toolbox
1 All subbasins with large tracts of undeveloped land
Development of a tool box to provide information and new and existing resources to landowners regarding agricultural and ranch land management best practices *companion to Land Conservation Toolbox
N/A To be determined
City, County, University, Texas A&M AgriLife Extension Service, SMRF, other

53 The Meadows Center for Water and the Environment
Management Measure Measured Milestones Year of Implementation
Responsible Party
1-2 3-5
Develop a strategic plan for open space protection in the watershed
Utilize recently completed land conservation prioritization and strategy studies to identify key areas and properties for management and conservation and appropriate program activities
x City (Support from County, University, SMGA, SMRF, Trust for Public Land, Save our Springs Alliance, and other Land conservation orgs)Explore mitigation options for developments in areas that are
planned for higher density x
Explore regional stormwater detention fee-in-lieu program to fund flood mitigation projects, enhancements to the existing dams, support land conservation
x
Evaluate the creation of a Regional Stormwater Management Program in the Upper San Marcos River watershed with the COSM and Hays County to generate revenue from new land development projects for flood control dam maintenance and land conservation
x
Finance land acquisition through issuance of open space bonds and/or pursuit of land acquisition grants
Completion of City and County bond packages (by year 5) – coordinated with Trust for Public LandApplication submitted for Texas Water Development Board State Water Implementation Fund for Texas funding 2 Applications submitted to foundations2 Applications submitted for state, federal or other sources of funding
x
Implement fee based programs to fund conservation activities
Financial feasibility study and estimated ion potential revenue completedFee and fee-in-lieu of programs created and revenues tied to Open Space Master Plan objectives
x City
Evaluate land along the river and consider land acquisition, building removal and site restoration when suitable properties become available. (COSM Parks and Open Space Master Plan)
Ongoing evaluation of available land, review of Sink and Sessom Creek as priorities
x x City with cooperation from SMRF and local land trust orgs
Table 2.3 Land Conservation Measures and Milestones for Implementation

The Upper San Marcos Watershed Protection Plan 54
Management Measure Measured Milestones Year of Implementation
Responsible Party
1-2 3-5
Develop strategies to encourage private land easements for riparian buffers, floodplains, and recharge features (i.e. easement holding partner, funding, and promotion to landowners).
Comprehensive strategies developed and integrated into Open Space strategic plan, information included in landowner tool boxes and online resources
x City, County, TPWD, The Nature Conservancy
Protection of riparian areas throughout the watershed to ensure that trees, vegetation, and creek channel storage remain intact to slow flood velocities, provide channel storage, and retain sediment during floods(Beginning creek buffer zones at a watershed area of 32 acres indicated that almost 18 percent of the watershed would be in a buffer zone)
Protection elements incorporated into City LDC and related ordinances and County regulations
x City, County

55 The Meadows Center for Water and the Environment
Watershed-wide Measures
Land Development Codes
Some BMPs and management activities are applicable throughout the entire watershed. At a high level, the Stakeholder Committee recommended:
• Continuing the practice of requiring stormwater detention for land development and redevelopment activities through the COSM and Hays and Comal counties’ ordinances and technical standards to prevent development projects from increasing peak flow rates • Implementing the LDC with the following components as drivers:
o Build while decreasing global eco footprint: complete, compact, walkable mixed-use developments produce less carbon pollutiono Incentivize development where city wants it: "preferred development areas," outside recharge areao Keep San Marcos Clear: keep the river crystal clear, but add access to river, bicycle and walking pathso Not one size fits all with environmental regulations: tailor regulations to place a wider range of options, flexibilityo Use green infrastructure: green offsets grey, plants as infrastructure, cheaper than pipes
Specific components of the LDC that the WPP recommends for adoption and that could receive support for implementation, education/outreach, staff training, and other technical assistance include:
CODE REQUIREMENTS (SEC. 6.1.1.1 (A) (4); 6.1.4.1) for the Recharge ZoneTSS removal: change from limiting the TSS increase to no more than 20% above naturally occurring levels to requiring an 89% reduction in increased TSS.
Stream protection volume: change from no standard to requiring the capture of runoff from the developed area from 1.6 inches of rainfall (90th percentile storm rainfall depth) for infiltration or detainment for 48 hours.
Applicability: new development and redevelopment. For redevelopment that increases gross floor area or improved site area by 25% or less the environmental standards shall apply to the additional floor or site area only. For redevelopment that increases gross floor area or site area by more than 25% both the existing building or site and the additional floor or site area must conform to the environmental standards.
CODE REQUIREMENTS (SEC. 6.1.1.1 (A) (4); 6.1.4.1) for the Transition Zone and Contributing Zone within the Transition ZoneTSS removal: change from no standard to requiring an 80% reduction in increased TSS.
Stream protection volume: change from no standard to requiring the capture of runoff from the developed area from 1.25 inches of rainfall (85th percentile storm rainfall depth) for infiltration or detainment for 48 hours.
Applicability: new development and redevelopment. For redevelopment that increases gross floor area or improved site area by 25% or less the environmental standards shall apply to the additional floor or site area only. For redevelopment that increases gross floor area or site area by more than 25% both the existing

The Upper San Marcos Watershed Protection Plan 56
building or site and the additional floor or site area must conform to the environmental standards.
CODE REQUIREMENTS (SEC. 6.1.1.1 (A) (4); 6.1.4.1) For the San Marcos River Protection ZoneTSS removal: For outside the SMRC a change from no standard to requiring an 80% reduction in increased TSS. For inside the SMRC a change from treatment with a sand filter (89% reduction efficiency) to 80% reduction in increased TSS.
Stream protection volume: For outside the SMRC a change from no standard to requiring the capture of runoff from the developed area from 1.25 inches of rainfall (85th percentile storm rainfall depth) for infiltration or detainment for 48 hours. For inside the SMRC a change from requiring the capture of 0.5 inches of rainfall from the developed area to requiring the capture of 1.25 inches of rainfall (85th percentile storm rainfall depth) from the developed area for infiltration or detainment for 48 hours.
Applicability: new development and redevelopment. For redevelopment that increases gross floor area or improved site area by 25% the environmental standards shall apply to the additional floor or site area only. For redevelopment that increases gross floor area or site area by more than 25% both the existing building or site and the additional floor or site area must conform to the environmental standards.
CODE REQUIREMENTS (6.2.2.1; 6.2.2.2) Expanded Stream Water Quality and Buffer Zones • No administrative adjustment should be allowed for cut and fill standards in water quality or buffer zones• Allow the combined width of water quality and buffer zones to exceed the width of the 100-year floodplain• Have the “Sub-Minor” waterway designation apply to the Transition Zone• Encourage developers to keep waterways natural even if they are very small• The code should not allow waterways to be filled in• The proposed code should help incentivize preserving natural waterways
Stream Water Quality and Buffer Zones:
Inside EARZ: waterway type “sub-minor waterways” has been added for waterways having a drainage area greater than or equal to 5-acres and less than 50-acres. Sub-minor waterways shall have a minimum water quality zone width of 25-feet on each side of the waterway centerline or equal to the limits of the 100-year floodplain based on a fully developed watershed. A buffer zone of 25-feet in width has also been established sub-minor waterways (Table 2.4)
Outside EARZ: waterway type “minor waterways” was revised to include waterways having a drainage area greater than or equal to 50-acres and less than 120 acres. Minor waterways have a minimum water quality zone width of 50-feet on each side of the waterway centerline or equal to the limits of the 100-year floodplain based on a fully developed watershed. The buffer zone is 50-feet in width for a minor waterway (Table 2.5)

57 The Meadows Center for Water and the Environment
Waterway Type
Defining Drainage Area
(DA)
Existing Code Revised Code
Water Quality Zone Width Offset from
Stream Centerline
Buffer Zone Width Offset from Water
Quality Zone
Water Quality Zone Width Offset from
Stream Centerline
Buffer Zone Width Offset from Water
Quality Zone
Sub-Minor Waterways
5 ≤ DA < 50 acres
No Requirement No Requirement 25 feet 25 feet
Minor Waterways
50 ≤ DA < 250 acres
50 feet 100 feet 50 feet 100 feet
Intermediate Waterways
250 ≤ DA < 1000 acres
100 feet 100 feet 100 feet 100 feet
Major Waterways
1000 acres ≤ DA 200 feet 100 feet 200 feet 100 feet
Table 2.4 Water Quality and Buffer Zones Defined by Offset Method‐ Inside EARZ (from Code SMTX)
Waterway Type
Defining Drainage Area
(DA)
Existing Code Revised Code
Water Quality Zone Width Offset from
Stream Centerline
Buffer Zone Width Offset from Water
Quality Zone
Water Quality Zone Width Offset from
Stream Centerline
Buffer Zone Width Offset from Water
Quality Zone
Sub-Minor Waterways
50 ≤ DA < 120 acres
No Requirement No Requirement 50 feet 50 feet
Minor Waterways
120 ≤ DA < 250 acres
50 feet No Requirement 50 feet 50 feet
Intermediate Waterways
250 ≤ DA < 1000 acres
100 feet No Requirement 100 feet 100 feet
Major Waterways
1000 acres ≤ DA 200 feet No Requirement 200 feet 100 feet
Table 2.5 Water Quality and Buffer Zones Defined by Offset Method‐ Outside EARZ (from Code SMTX)

The Upper San Marcos Watershed Protection Plan 58
Code Recommendations (SEC. 6.1.1.1 (A)) Example: Section 7.2.3.1 (C) (2) was added which states “Landscaping and vegetation installed as part of a stormwater management feature may be counted towards the landscaping requirements.”
Develop Stormwater Technical Manual: Will include more detailed and up to date design standards to meet drainage requirements. Will include more detailed design, material specification, and maintenance requirements for LID features.
Sourcewater Protection: Although associated costs are not reported, recommended groundwater and source water protection measures are presented in Table 2.6 for the first t Table 2.6 Ground/Source water measures and milestones for implementation, years 1-3 hree years of implementation. Additional lower priority measures (years 4-7) can be found in the Groundwater Protection Planning document on the SMWI website under Supporting Documents.

59 The Meadows Center for Water and the Environment
So
urc
e W
ater
Qu
anti
ty (
*so
urc
ed f
rom
EA
A G
rou
nd
wat
er C
on
serv
atio
n P
lan
)
Man
agem
ent
Pra
ctic
eM
easu
re C
ateg
ory
Mea
sure
Mile
sto
nes
R
esp
on
sib
le
Part
yIn
crea
se r
euse
of
trea
ted
effl
uen
t*: T
he
use
of
trea
ted
effl
uen
t is
an
eff
ecti
ve m
eth
od
o
f re
du
cin
g g
rou
nd
wat
er u
sag
e. U
se o
f tr
eate
d m
un
icip
al e
fflu
ent
is r
egu
late
d b
y th
e T
CE
Q u
nd
er C
hap
ter
210
of
the
TAC
. Fo
r G
rou
nd
wat
er C
on
serv
atio
n P
lan
pu
rpo
ses,
th
e re
use
wat
er s
ho
uld
be
clea
rly
rela
ted
to
a d
ecre
ase
in r
elia
nce
on
th
e aq
uif
er. F
or
wat
er
qu
alit
y p
rote
ctio
n p
urp
ose
s, t
he
use
of
trea
ted
effl
uen
t o
n t
he
EA
RZ
is d
isco
ura
ged
.
Reg
ula
tory
ap
pro
ach
, C
OS
M m
un
icip
al
man
agem
ent
acti
vity
, Un
iver
sity
m
anag
emen
t ac
tivi
ty
Pro
gra
m a
nd
sch
edu
le
imp
lem
enta
tio
n
Sta
ff t
rain
ing
Cit
yU
niv
ersi
ty
Ath
leti
c fi
eld
co
nse
rvat
ion
*: Im
ple
men
t a
pro
gra
m t
hat
rec
om
men
ds
or
req
uir
es
wat
erin
g r
egim
ens
that
use
s o
nly
th
e am
ou
nt
of
gro
un
dw
ater
nec
essa
ry t
o m
ain
tain
th
e vi
abili
ty o
f th
e tu
rf a
nd
mai
nta
in t
he
turf
in a
saf
e co
nd
itio
n. G
rou
nd
wat
er m
ust
o
nly
be
app
lied
to
are
as t
hat
are
ess
enti
al t
o t
he
use
of
the
fiel
d. A
dd
itio
nal
pro
gra
m
req
uir
emen
ts c
ou
ld in
clu
de
irri
gati
on
au
dit
s an
d m
ow
ing
bes
t p
ract
ices
ou
tlin
ed
by
the
Texa
s A
&M
Ag
riLi
fe E
xten
sio
n S
ervi
ce, h
ttp
://p
ub
licat
ion
s.ta
mu
.ed
u/T
UR
F_LA
ND
SC
AP
E/P
UB
_tu
rf_A
thle
tic%
20Fi
eld
s%20
and
%20
Wat
er%
20C
on
serv
atio
n.p
df
CO
SM
mu
nic
ipal
m
anag
emen
t ac
tivi
ty, U
niv
ersi
ty
man
agem
ent
acti
vity
Pro
gra
m a
nd
sch
edu
le
imp
lem
enta
tio
n
Sta
ff t
rain
ing
Cit
yU
niv
ersi
ty
Nu
rser
y/g
reen
ho
use
co
nse
rvat
ion
*: Im
ple
men
t a
pro
gra
m t
hat
rec
om
men
ds
or
req
uir
es w
ater
ing
reg
imen
th
at u
ses
on
ly t
he
amo
un
t o
f g
rou
nd
wat
er n
eces
sary
to
re
pla
ce e
vap
otr
ansp
irat
ion
an
d t
o m
ain
tain
th
e vi
abili
ty o
f p
lan
ts. T
o a
cco
mm
od
ate
a va
riet
y o
f cr
op
s w
ith
diff
eren
t w
ater
req
uir
emen
ts, t
he
per
mit
ho
lder
mu
st c
reat
e an
d
mai
nta
in u
se o
f m
ult
iple
wat
erin
g z
on
es. G
rou
nd
wat
er m
ust
be
app
lied
th
rou
gh
usa
ge
of
curr
ent
irri
gati
on
tec
hn
iqu
es s
uch
as
low
-pre
ssu
re s
pri
nkl
ers
and
/or
mic
ro ir
riga
tio
n
syst
ems.
Reg
ula
tory
or
ince
nti
ve a
pp
roac
hPr
og
ram
im
ple
men
tati
on
Info
rmat
ion
ava
ilab
le
on
line
Sta
ff t
rain
ing
Cit
yU
niv
ersi
ty
Tabl
e 2.6
Gro
und/
Sour
ce w
ater
mea
sure
s and
mile
stone
s for
impl
emen
tatio
n, y
ears
1-3

The Upper San Marcos Watershed Protection Plan 60
So
urc
e W
ater
Qu
anti
ty (
*so
urc
ed f
rom
EA
A G
rou
nd
wat
er C
on
serv
atio
n P
lan
)
Co
olin
g t
ow
er c
on
serv
atio
n*:
Th
e g
reat
est
op
po
rtu
nit
y to
co
nse
rve
wat
er in
co
olin
g
tow
ers
app
licat
ion
s ca
n b
e re
aliz
ed b
y co
ntr
olli
ng
th
e am
ou
nt
of
ble
ed-o
ff a
nd
mak
e-u
p w
ater
req
uir
ed b
y th
e sy
stem
. Im
ple
men
t a
pro
gra
m t
hat
rec
om
men
ds
or
req
uir
es
ind
ust
rial
use
rs t
o u
tiliz
e p
roce
sses
or
equ
ipm
ent
that
incr
ease
s co
olin
g t
ow
er
effi
cien
cy b
y m
inim
izin
g t
he
amo
un
t o
f re
qu
ired
mak
e-u
p w
ater
, wh
ile s
till
mee
tin
g t
he
op
erat
ing
par
amet
ers
of
the
coo
ling
sys
tem
, in
clu
din
g:
• p
erfo
rm a
n e
ffici
ency
au
dit
on
eac
h c
oo
ling
to
wer
to
iden
tify
are
as o
f im
pro
vem
ent;
•
use
sh
ield
ing
to
min
imiz
e ev
apo
rati
ve lo
ss;
• u
tiliz
e sa
fe c
hem
ical
ad
dit
ives
to
co
ntr
ol s
calin
g a
nd
co
rro
sio
n a
nd
ext
end
use
able
“l
ife”
of
wat
er in
co
olin
g t
ow
er;
• ru
n s
yste
m w
ith
incr
ease
d c
ycle
s o
f co
nce
ntr
atio
n;
• in
stal
l filt
rati
on
sys
tem
s to
rem
ove
solid
s an
d b
iolo
gic
al m
atte
r;•
inst
all c
on
du
ctiv
ity
or
Pote
nti
al o
f H
ydro
gen
(p
H)
mo
nit
ori
ng
sys
tem
s to
co
ntr
ol
ble
ed-o
ff;
• in
stal
l met
ers
to m
on
ito
r am
ou
nt
of
ble
ed-o
ff a
nd
mak
e u
p w
ater
; •
if f
easi
ble
, in
stal
l an
au
tom
atic
sh
ut-
off
sys
tem
to
po
wer
-do
wn
co
olin
g t
ow
er w
hen
n
ot
in u
se;
• co
llect
wat
er f
rom
oth
er o
n s
ite
use
s th
at is
su
itab
le f
or
mak
e-u
p w
ater
or
can
be
trea
ted
fo
r su
ch u
se;
• if
fea
sib
le, u
tiliz
e re
cycl
ed w
ater
fo
r co
olin
g t
ow
er m
ake-
up
wat
er;
• h
arve
st r
ainw
ater
as
avai
lab
le t
o u
se a
s m
ake-
up
wat
er; a
nd
•
reu
se b
leed
-off
wat
er f
or
oth
er p
roce
sses
on
sit
e
Reg
ula
tory
or
ince
nti
ve a
pp
roac
h,
Un
iver
sity
fac
iliti
es
man
agem
ent
acti
vity
Pro
gra
m
imp
lem
enta
tio
n
Sta
ff t
rain
ing
Cit
yU
niv
ersi
ty
En
han
ced
pu
blic
info
rmat
ion
an
d s
cho
ol e
du
cati
on
pro
gra
ms:
Incr
ease
pro
mo
tio
n o
f co
ord
inat
ed w
ater
co
nse
rvat
ion
mes
sag
ing
an
d in
form
ing
th
e p
ub
lic o
f th
e n
eces
sity
to
use
wat
er e
ffici
entl
y. A
n e
ffec
tive
pu
blic
info
rmat
ion
pro
gra
m s
ho
uld
incl
ud
e,
bu
t is
no
t lim
ited
to
: pro
vid
ing
sp
eake
rs t
o e
mp
loye
es, c
om
mu
nit
y g
rou
ps,
an
d t
he
med
ia; u
sin
g p
aid
an
d p
ub
lic s
ervi
ce a
dve
rtis
ing
; usi
ng
bill
inse
rts;
pro
vid
ing
tre
nd
an
d c
om
par
iso
n in
form
atio
n o
n b
ills;
an
d p
rovi
din
g in
form
atio
nal
pam
ph
lets
, flye
rs,
and
man
ual
s. A
n e
ffec
tive
sch
oo
l ed
uca
tio
n p
rog
ram
sh
ou
ld in
clu
de,
bu
t is
no
t lim
ited
to
, cla
ssro
om
pre
sen
tati
on
s, in
stru
ctio
nal
ass
ista
nce
, an
d d
istr
ibu
tio
n o
f ed
uca
tio
nal
m
ater
ials
. E
ffo
rts
sho
uld
incl
ud
e p
arti
cip
atio
n in
th
e G
rou
nd
wat
er G
uar
dia
n P
rog
ram
, w
hic
h p
rovi
des
su
pp
ort
fo
r aw
aren
ess
and
co
nse
rvat
ion
act
ivit
ies
(htt
p://
ww
w.
gro
un
dw
ater
.org
/act
ion
/co
mm
un
ity/
gu
ard
ian
.htm
l)
E&
OE
&O
eff
ort
s in
teg
rate
d
into
exi
stin
g E
&O
p
rog
ram
s
Cit
yU
niv
ersi
tyM
erm
aid
S
oci
ety
Priv
ate
sch
oo
lsO
ther
NG
Os
En
han
ced
lan
dsc
ape
con
serv
atio
n p
rog
ram
s*: E
stab
lish
an
d p
rovi
de
no
n-r
esid
enti
al
and
res
iden
tial
cu
sto
mer
s w
ith
met
ho
ds
for
imp
rovi
ng
lan
dsc
ape
wat
er-u
se e
ffici
ency
, cu
sto
mer
su
pp
ort
an
d e
du
cati
on
. Cit
y o
f S
an A
nto
nio
reb
ate
pro
gra
ms
wer
e id
enti
fied
as
a p
ote
nti
al e
xam
ple
, htt
p://
ww
w.s
aws.
org
/co
nse
rvat
ion
/ou
tdo
or/
. Co
mp
on
ents
may
in
clu
de
- tr
ain
ing
in la
nd
scap
e m
ain
ten
ance
an
d ir
riga
tio
n s
yste
m m
ain
ten
ance
an
d
des
ign
; fin
anci
al in
cen
tive
s to
co
nver
t la
nd
scap
e m
ater
ial t
o X
eris
cap
e; r
ebat
es a
nd
in
cen
tive
s to
pu
rch
ase
con
serv
atio
n e
qu
ipm
ent
to im
pro
ve e
ffici
ency
incl
ud
ing
rai
n
sen
sors
or
soil-
mo
istu
re s
enso
rs; n
oti
ces
at t
he
star
t an
d e
nd
of
the
irri
gati
on
sea
son
al
erti
ng
cu
sto
mer
s to
ch
eck
irri
gati
on
sys
tem
s an
d t
o m
ake
rep
airs
an
d a
dju
stm
ents
as
nec
essa
ry.
No
n-r
egu
lato
ry a
nd
re
gu
lato
ry a
pp
roac
h;
Un
iver
sity
fac
iliti
es
man
agem
ent
acti
vity
Inte
gra
tio
n o
f p
rog
ram
s in
to R
WH
an
d o
ther
C
ity
init
iati
ves
and
p
rog
ram
s; a
nn
ual
fu
nd
ing
an
d p
rog
ram
ex
pan
sio
n
Cit
y

61 The Meadows Center for Water and the Environment
So
urc
e W
ater
Qu
anti
ty (
*so
urc
ed f
rom
EA
A G
rou
nd
wat
er C
on
serv
atio
n P
lan
)
Prov
ide
reso
urc
es f
or
Pub
lic S
cho
ol t
each
ers
to a
tten
d e
du
cati
on
al p
rog
ram
s at
Th
e M
ead
ow
s C
ente
r, E
AA
, an
d B
arto
n S
pri
ng
s E
dw
ard
s A
qu
ifer
Co
nse
rvat
ion
Dis
tric
t (B
SE
AC
D).
Th
ese
are
oft
en o
ffer
ed a
t n
o c
ost
, bu
t te
ach
ers
do
no
t g
et p
aid
an
d o
ften
do
n
ot
rece
ive
trav
el f
un
ds.
Fo
r ex
amp
le, “
Gro
un
dw
ater
to
th
e G
ulf”
is a
su
mm
er in
stit
ute
fo
r te
ach
ers
wh
ich
pro
vid
es t
each
ing
res
ou
rces
fo
r co
nse
rvin
g g
rou
nd
wat
er a
nd
oth
er
rela
ted
to
pic
s: h
ttp
://b
seac
d.o
rg/e
du
cati
on
/g2g
/
E&
OE
&O
inte
gra
ted
into
ex
isti
ng
E&
O p
rog
ram
s
An
nu
al w
ork
sho
ps
sch
edu
led
, co
nte
nt
avai
lab
le o
nlin
e
Cit
yU
niv
ersi
tyM
erm
aid
S
oci
ety
Priv
ate
sch
oo
lsO
ther
NG
Os
Rec
har
ge Q
ual
ity
(Man
agem
ent
Mea
sure
s in
ad
dit
ion
to
WP
P M
easu
res)
Man
agem
ent
Pra
ctic
eM
easu
re C
ateg
ory
Mea
sure
Mile
sto
nes
Res
po
nsi
ble
Pa
rty
Co
mm
un
ity
E&
O t
o c
om
mu
nit
y an
d lo
cal b
usi
nes
ses
for
pro
per
ap
plic
atio
n a
nd
st
ora
ge
of
chem
ical
s, s
pill
cle
an-u
p a
nd
ch
emic
al/c
on
tain
er d
isp
osa
l no
t co
vere
d in
su
rfac
e w
ater
ed
uca
tio
n m
easu
res
Co
uld
als
o a
pp
ly t
o U
niv
ersi
ty F
acili
ties
E&
OE
&O
eff
ort
s in
teg
rate
d
into
exi
stin
g E
&O
p
rog
ram
s
Cit
yU
niv
ersi
ty
Ad
dit
ion
al/E
nh
ance
d In
teg
rate
d P
est
Man
agem
ent
(IP
M)
acti
viti
es f
or
Cit
y an
d
Un
iver
sity
invo
lves
th
e ca
refu
lly m
anag
ed u
se o
f th
ree
diff
eren
t p
est
con
tro
l tac
tics
–
bio
log
ical
, cu
ltu
ral,
and
ch
emic
al –
to
get
th
e b
est
lon
g-t
erm
res
ult
s w
ith
th
e le
ast
dis
rup
tio
n o
f th
e en
viro
nm
ent.
Bio
log
ical
co
ntr
ol m
ean
s u
sin
g n
atu
ral e
nem
ies
of
the
pes
t, li
ke la
dy
bu
gs
to c
on
tro
l ap
hid
s. C
ult
ura
l or
ho
rtic
ult
ura
l co
ntr
ol i
nvo
lves
th
e u
se o
f ga
rden
ing
met
ho
ds,
like
mo
win
g h
igh
to
sh
ade
ou
t w
eed
s. C
hem
ical
co
ntr
ol
invo
lves
th
e ju
dic
iou
s u
se o
f p
esti
cid
es.
CO
SM
mu
nic
ipal
m
anag
emen
t ac
tivi
ty,
Un
iver
sity
m
anag
emen
t ac
tivi
ty
Ad
op
tio
n o
f IP
M
pro
gra
ms
Cit
yU
niv
ersi
ty
Ses
som
Cre
ek W
ater
shed
Sp
ecia
l Dis
tric
t o
r G
rou
nd
wat
er P
rote
ctio
n Z
on
e –
can
be
dev
elo
ped
in c
on
jun
ctio
n w
ith
th
e C
od
e S
MT
X L
DC
act
ivit
ies
and
co
uld
be
exp
and
ed
else
wh
ere
in t
he
Up
per
San
Mar
cos
Wat
ersh
ed. F
eatu
res
wo
uld
incl
ud
e co
vera
ge
of
TC
EQ
Ed
war
ds
Aq
uif
er R
ech
arg
e R
ule
s, a
nd
imp
rove
men
t b
eyo
nd
cu
rren
tly
pro
po
sed
ru
les.
Reg
ula
tory
ap
pro
ach
Ad
op
tio
n o
f LD
C
Stu
dy
and
im
ple
men
tati
on
of
bes
t o
pti
on
s fo
r p
rote
ctio
n
dis
tric
t o
r zo
ne
Cit
y,
Hay
s Tri
nit
y G
rou
nd
wat
er
Co
nse
rvat
ion
D
istr
ict
(HT
GC
D),
EA
A

The Upper San Marcos Watershed Protection Plan 62
Adaptive Management - BMPs for Future Implementation The stakeholder committee identified comprehensive strategies to protect water quality which were refined as the stakeholder committee reviewed, voted to adopt, and prioritized BMPs for initial implementation. It is possible that the BMPs selected for initial implementation may require changes, additions or other updates. Not all the BMPs selected were included in the first stage of implementation but are expected to be implemented in future years. They are included in Appendix D for future efforts and adaptive management. Management measures in the watershed, like the MS4 and EAHCP activities, LDC changes, and water quality regulations in the recharge zone will result in load reductions not included in this plan. Once the new ordinances and additional water quality protection activities have been implemented, and the effects of these efforts are better understood, adaptive management and fine tuning of implementation activities is likely.
The Stakeholder Committee and key watershed partners will review monitoring data and this Plan to identify if milestones are being met and BMPs are working effectively. The Stakeholder Committee will submit an adaptive management review after the first three years of implementation.
The following section provides information related to:
Element D. Estimate of the amounts of technical and financial assistance needed, associated costs, and/or the sources and authorities that will be relied
upon to implement this plan.
Technical and Financial AssistanceThroughout this multi-year effort, the Upper San Marcos WPP Stakeholder Committee worked together with governmental and nongovernmental organizations to investigate potential commitments for implementing WPP activities. Formal financial agreements will be updated as required. The funding agreements will include the COSM, Hays County, Texas State University, and other partner’s pledges to commit and seek additional funding required to implement the plan.
University and local government’s participation are contingent upon approved financial appropriations. University, City, and County representatives have pledged to support and present the WPP implementation needs to their respective bodies for approval on an annual basis.
The Stakeholder Committee and project partners will apply for additional funding to implement Plan components in the future and will solicit technical support on an ongoing basis. Table 2.7 lists potential funding sources and grants available for WPP implementation activities, including federal, state and private monies. Sources of potential additional technical assistance are listed in Table 2.8.

63 The Meadows Center for Water and the Environment
Table 2.7 Financial Assistance Available for WPP Implementation
Financial Assistance, Grants for WPP Implementation Activities
Program Focus Area Organization Additional Information
STATE
Outdoor Recreation, Parks Grants
Recreation, open spaces, and parks
TPWD
http://tpwd.texas.gov/business/grants/recreation-grants/grant-programs, http://tpwd.texas.gov/business/grants/recreation-grants/#coop
Small Towns Environment Program, Texas Capital Fund Main Street Improvements Program, Texas Capital Fund Infrastructure Development Program
Development, infrastructure, and green infrastructure
Texas Dept. of Agriculture (TDA) and the Texas Department of Rural Affairs
http://www.texasagriculture.gov/GrantsServices/RuralEconomicDevelopment/RuralCommunityDevelopmentBlockGrant(CDBG)/SmallTownsEnvironmentalProgram.aspx,https://www.texasagriculture.gov/GrantsServices/RuralEconomicDevelopment/TexasCapitalFund/MainStreetImprovementProgram.aspx, https://texasagriculture.gov/GrantsServices/RuralEconomicDevelopment/TexasCapitalFund.aspx
Feral Hog Abatement Grant Program
Reduction in hog related bacteria and TSS pollution
TDA
https://www.texasagriculture.gov/GrantsServices/TradeandBusinessDevelopment/FeralHogGrantProgram
FEDERAL
Environmental Quality Incentives Program
Watershed protection and flood prevention
NRCS)/ United States Department of Agriculture (USDA)
http://www.nrcs.usda.gov/wps/portal/nrcs/detail/national/programs/financial/eqip/?cid=stelprdb1242633
Grassland Reserve Program Farm & Ranch Lands Protection Program
Land and water management and conservation
NRCS (USDA)http://www.nrcs.usda.gov/wps/portal/nrcs/main/national/programs/easements/farmranch/
Agricultural Conservation Easement Program
Land and water management and conservation
NRCS (USDA)http://www.nrcs.usda.gov/wps/portal/nrcs/main/tx/programs/easements/acep/
Rural Development Program (USDA-RD)Enhancement Program*
Multiple water and environmental programs
USDAhttp://www.rd.usda.gov/programs-services
OTHER
Environmental Education Grants (Public and Private)
Environmental E&O
Multiple (EPA, National Environmental Education Foundation, etc)
https://www.epa.gov/education/environmental-education-ee-grants, https://www.neefusa.org/grants,
Texas Agricultural Land Trust conservation easement funding
Land conservationTexas Agricultural Land Trust
http://www.txaglandtrust.org/
Various Land Trust Organizations and Trust for Public Land
Land and water management and conservation
Multiple (local, regional, state, and national)
http://www.texaslandtrustcouncil.org/, http://www.landtrustalliance.org/,https://www.tpl.org/, http://www.texaslandconservancy.org/, http://www.lwcfcoalition.org/, http://hillcountryconservancy.org/, http://www.gbrtrust.org/, www.nature.org/texas

The Upper San Marcos Watershed Protection Plan 64
Financial Assistance, Grants for WPP Implementation Activities
Private, Foundation Funding and Grants
Water quality, watershed protection, restoration, water conservation, land management and conservation, and implementation of WPP activities
Multiple --
Specific Implementation, Management Measure Funding
Water quality, watershed protection, restoration, water conservation, land management and conservation, and implementation of WPP activities
Corporate partnerships, COSM, Hays County, Guadalupe Blanco River Authority, NGOs, and civic groups,
--
EAHCP
The COSM is required to spend $150,000 annually to implement measures in the WQPP; EAA provides additional funding for water quality related EAHCP activities and the City will utilize Capital Improvements Plan and other funds to complete WQPP related efforts above the minimum $150,000
Annual funding requirements
http://eahcp.org/http://eahcp.org/index.php/habitat_protection/http://eahcp.org/index.php/document_library_selected?c=19&c=19

65 The Meadows Center for Water and the Environment
Technical Assistance for WPP Implementation Activities
Organization Focus/Management AreaNational Center for Appropriate Technology, EPA, San Antonio River Authority, Watershed Management Group, The Meadows Center, COSM/EAHCP, Texas State University (facilities, Environmental Health, Safety and Risk Management), and EAHCP Implementation Committee
Green infrastructure, LID, stormwater retrofits, riparian buffers, and BMP installation
SMGA Open spaces, watershed protection, and recreation
Hays County Master Naturalists, COSM/EAHCP Riparian restoration and native planting
TCEQ Region 11 On-site sewage facility
BSEACD, EAA, and HTGCDGroundwater–surface water management, data collection/analysis, and groundwater management
TPWDWildlife related management strategies, feral hog removal, and E&O
Texas Department of Transportation Various
NRCS Conservation plans and easements
Texas State Soil and Water Conservation Board (TSSWCB)
Conservation plans, riparian buffers, and BMP installation
Texas A&M AgriLife Extension ServiceEducation and outreach for conservation plans, riparian buffers, feral hogs, agricultural BMPs, and E&O
Lone Star Healthy Streams Program (AgriLife)E&O on bacterial contamination originating from livestock operations and feral hogs
Private Lands and Habitat Management Program and TPWD Education and Technical Assistance Programs
Land, riparian, and habitat management
Project WILD and Project WILD Aquatic Programs E&O
Texas Land Trust Council and other Land Trust organizations
Land management, watershed protection, easements, and land protection
Texas Rivers Protection Association, SMRF, Hill Country Alliance, and TST
E&O and data collection
GBRAE&O, data collection, and technical assistance with data analysis
Texas Watershed Stewards and similar Texas A&M AgriLife programs
E&O, technical assistance with BMP implementation
The Nature ConservancyE&O; data collection; land owner assistance; land, riparian, and habitat management activities; land and watershed protection
Texas State University, TCEQ, and Texas Water Resources Institute
Development of local Event Mean Concentrations
The Meadows Center LDCs
Hays County Tree protection strategies
The Meadows Center, TPWD, Water Casa, and American Water Works Association (Texas Chapter Texas Water Works Association)
Water conservation strategies
EPA, Smart Growth Network Compact development and site-specific development
TWDB, GBRA, Federal Emergency Management Agency, EPA
Flooding and stormwater
Table 2.8 Technical Assistance Abailable for WPP Implementation

The Upper San Marcos Watershed Protection Plan 66
3. EDUCATION AND OUTREACH PLANEducation and outreach measures were developed and compiled by the stakeholder led E&O Subcommittee, and were approved by the stakeholder committee. The efforts and programs outlined will be used to enhance public understanding of watershed protection activities and to encourage participation of citizens, students, businesses, and decision makers in implementing pollution prevention measures. Additional measures and efforts will be identified over time and it is anticipated that new partnerships will arise, bringing additional resources to the watershed. This document provides a thorough list of planned efforts but is not exhaustive.
Education and Outreach Strategy The Upper San Marcos WPP E&O Plan was developed by the stakeholder E&O Subcommittee. Stakeholders, entities engaging in local watershed outreach, E&O experts, and members of the public all contributed to this plan. Because there are many concurrent educational efforts happening in the watershed, activities that promote educational goals for the WPP, EAHCP, and Code SMTX were prioritized. These efforts are likely to be funded and implemented to promote consistent, science driven messaging across the watershed. E&O components will be aligned to the extent possible with current MS4 activities, although efforts and funding source will be kept separate.
Education and Outreach Plan, Goals, and Target Audiences
The purpose of the E&O Plan is to define the Upper San Marcos River Community’s E&O goals and objectives for the WPP. Plan goals and target audiences are shown in Table 3.1.
The following section provides information related to:
Element E. Information and education component used to enhance
Public understanding of the plan
Educational activities and BMPs will be targeted toward audiences identified as most in need. Cost and responsible parties for implementing E&O activities in the first three years have been identified. Some activities have been identified for years four through ten and it is likely that, through adaptive management, additional activities, efforts, programs, and measures will be identified and implemented. Additional activities are described in the E&O Plan and will be developed during updates to the WPP. Measures to be implemented in year one through ten are summarized in Table 3.2.
Table 3.1 E&O Plan Goals and Audience
E&O Plan Goals E&O Plan Target Audiences
Increase public awareness Community at large, including tourists and students
Increase community engagement Homeowners/landowners and business owners
Educate and support decision makersBusiness owners
Government/Education

67 The Meadows Center for Water and the Environment
E&
O To
pic
Res
po
nsi
ble
Par
tyE
stim
ated
C
ost
Nu
mb
er
Imp
lem
ente
d
in Y
ears
1-3
Nu
mb
er
Imp
lem
ente
d
in Y
ears
4-1
0
Tota
l Co
st,
Year
1-3
*Pri
ce fo
r ye
ars
4-10
to
be
det
erm
ined
A. E
ven
tsW
ork
sho
ps
GB
RA
, TC
EQ
, TS
SW
CB
, Tex
as A
&M
A
gri
Life
Ext
ensi
on
Ser
vice
, Mea
do
ws
Cen
ter,
CO
SM
, Hay
s C
ou
nty
, SM
RF,
M
erm
aid
So
ciet
y, H
CA
, NG
Os
and
co
mm
un
ity
gro
up
s
$250
08
14$2
0,00
0
Sta
keh
old
er M
eeti
ng
sS
take
ho
lder
Co
mm
ittee
, Wat
ersh
ed
Co
ord
$012
7$0
(in
kin
d
do
nat
ion
s)
Sm
art
Gro
wth
an
d N
on
po
int
Ed
uca
tio
n f
or
Mu
nic
ipal
Offi
cial
s (N
EM
O) W
ork
sho
p f
or
Ele
cted
Offi
cial
s
Texa
s A
&M
Ag
riLi
fe E
xten
sio
n S
ervi
ce,
Sta
keh
old
er C
om
mitt
ee, C
OS
M$5
000
6$3
0,00
0
Ho
use
ho
ld H
azar
do
us
Was
te a
nd
B
rush
y/B
ulk
Was
te D
rop
off
Day
s;
Ad
d a
3rd
dro
p o
ff s
tati
on
fo
r H
ays
Co
un
ty b
y ye
ar 5
CO
SM
, Hay
s C
ou
nty
$500
0;N
ew s
tati
on
-T
BD
37
$15,
000
New
sta
tio
n -
TB
D
Wat
ersh
ed A
war
enes
s W
eek
CO
SM
, Tex
as S
tate
Un
iver
sity
, Hay
s C
ou
nty
, Sta
keh
old
er C
om
mitt
ee,
Wat
ersh
ed C
oo
rd
$7,5
001
in y
ear
37
$7,5
00
Co
mm
un
ity
Cle
anu
ps
CO
SM
, Tex
as S
tate
Un
iver
sity
, TS
T,
GB
RA
, SM
RF,
SM
GA
, Pri
vate
Ind
ust
ry$2
000
6+14
+12
,000
Wat
ersh
ed p
rote
ctio
n a
ctiv
itie
s (s
pea
kers
, fi
lms,
etc
) ad
ded
to
an
nu
al
Mer
mai
d F
esti
val a
nd
eve
nts
CO
SM
, Mer
mai
d S
oci
ety,
Mea
do
ws
Cen
ter
$500
02
7$1
0,00
0
B. P
rin
t M
ater
ials
an
d W
ebsi
te
Web
site
Sta
keh
old
er C
om
mitt
ee, W
ater
shed
C
oo
rd$1
,000
On
go
ing
(3
year
s)O
ng
oin
g$3
,000
New
an
d e
xist
ing
bro
chu
re a
nd
p
rin
ted
mat
eria
ls (
incl
ud
ing
pri
nti
ng
co
sts)
GB
RA
, CO
SM
, Tex
as S
tate
Un
iver
sity
, M
ead
ow
s C
ente
r, Te
xas
A&
M A
gri
Life
E
xten
sio
n S
ervi
ce, T
CE
Q, T
SS
WC
B,
Wat
ersh
ed C
oo
rd
$1,0
006
As
nee
ded
$6,0
00
Bu
mp
er S
tick
ers
Sta
keh
old
ers
Co
mm
ittee
, Wat
ersh
ed
Co
ord
$1,0
003
7$3
,000
Tabl
e 3.2
E&
O Im
plem
enta
tion
Plan
Act
iviti
es

The Upper San Marcos Watershed Protection Plan 68
E&
O To
pic
Res
po
nsi
ble
Par
tyE
stim
ated
C
ost
Nu
mb
er
Imp
lem
ente
d
in Y
ears
1-3
Nu
mb
er
Imp
lem
ente
d
in Y
ears
4-1
0
Tota
l Co
st,
Year
1-3
*Pri
ce fo
r ye
ars
4-10
to
be
det
erm
ined
LID
, gre
en in
fras
rtu
ctu
re a
nd
BM
P
E&
O m
anu
al a
nd
su
pp
ort
ing
mat
eria
ls
(to
be
cust
om
ized
fro
m e
xist
ing
re
sou
rces
)
CO
SM
, Hay
s C
ou
nty
, Th
e M
ead
ow
s C
ente
r, W
ater
shed
Co
ord
, EA
HC
P$1
0,00
01
3 u
pd
ates
$10,
000
Wat
ersh
ed To
urs
an
d s
up
po
rtin
g
mat
eria
ls (
volu
nte
er le
d a
nd
sel
f-g
uid
ed)
Texa
s S
tate
Un
iver
sity
, NG
O, T
he
Mea
do
ws
Cen
ter,
CO
SM
, Hay
s C
ou
nty
$10,
000
1 se
lf-g
uid
ed,
on
go
ing
m
on
thly
on
go
ing
$10,
000
Uti
lity
Bill
Inse
rts
C
OS
M, W
ater
shed
Co
ord
$5,0
003
7$1
5,00
0
Cit
izen
On
line
Trai
nin
g
GB
RA
, Th
e M
ead
ow
s C
ente
r$5
006
14$3
,000
Pub
lic S
ervi
ce A
nn
ou
nce
men
ts (
PS
As)
CO
SM
, Tex
as S
tate
Un
iver
sity
, Th
e M
ead
ow
s C
ente
r, S
MR
F$5
003
7$1
,500
C. P
hysi
cal O
utr
each
Too
ls a
nd
Cam
pai
gn
sTr
ibu
tary
an
d W
ater
shed
Ro
adw
ay
Sig
ns
CO
SM
, Hay
s C
ou
nty
, Sta
keh
old
er
Co
mm
ittee
$200
/sig
n26
Rep
lace
men
t as
n
eed
ed$5
,200
Ban
ner
s an
d s
ign
age
rela
tin
g t
o
no
np
oin
t so
urc
e (t
o b
e in
stal
led
alo
ng
th
e ri
ver,
in t
ow
n, o
n-c
amp
us)
CO
SM
, Tex
as S
tate
Un
iver
sity
, Th
e M
ead
ow
s C
ente
r, W
ater
shed
Co
ord
$3,0
00/y
r3
7$9
,000
Pet W
aste
Sta
tio
ns
(In
stal
lati
on
an
d
mai
nte
nan
ce o
f ad
dit
ion
al)
CO
SM
, Tex
as S
tate
Un
iver
sity
$450
03
Rep
lace
men
t as
n
eed
ed$1
3,50
0
Wat
ersh
ed m
od
el d
emo
nst
rati
on
s E
AH
CP
par
tner
s, T
he
Mea
do
ws
Cen
ter
Volu
nte
ers
usi
ng
exi
stin
g
mo
del
s,
3R
epla
cem
ent
as
nee
ded
$0
New
LID
dem
on
stra
tio
n m
od
elE
AH
CP
par
tner
s, T
he
Mea
do
ws
Cen
ter
LID
mo
del
$7
,500
1R
epla
cem
ent
as
nee
ded
$7,5
00
Kio
sk (
7 ex
isti
ng
wit
h n
ew in
sert
s m
ade,
2 y
ears
)E
AH
CP
par
tner
s, C
OS
M, S
take
ho
lder
C
om
mitt
ee$3
,500
2R
epla
cem
ent
as
nee
ded
$7,0
00
Kio
sk (
7 ex
isti
ng
wit
h n
ew in
sert
s m
ade,
2 y
ears
)E
AH
CP
par
tner
s, C
OS
M, S
take
ho
lder
C
om
mitt
ee$3
,500
2R
epla
cem
ent
as
nee
ded
$7,0
00
Eco
Biz
pro
gra
m f
or
ligh
t in
du
stry
. G
BR
A, C
OS
M, T
he
Mea
do
ws
Cen
ter,
S
take
ho
lder
Co
mm
ittee
$20,
000
in
year
3;
On
go
ing
(af
ter
year
3)
On
go
ing
(a
pp
roxi
mat
ely
$500
0 an
nu
ally
)
$20,
000

69 The Meadows Center for Water and the Environment
E&
O To
pic
Res
po
nsi
ble
Par
tyE
stim
ated
C
ost
Nu
mb
er
Imp
lem
ente
d
in Y
ears
1-3
Nu
mb
er
Imp
lem
ente
d
in Y
ears
4-1
0
Tota
l Co
st,
Year
1-3
*Pri
ce fo
r ye
ars
4-10
to
be
det
erm
ined
Wat
ersh
ed W
ise
Bu
sin
ess
Cam
pai
gn
CO
SM
, Th
e M
ead
ow
s C
ente
r,
Sta
keh
old
er C
om
mitt
ee, C
ham
ber
of
Co
mm
erce
$12,
000
in
year
3O
ng
oin
g (
afte
r ye
ar 3
)O
ng
oin
g
(ap
pro
xim
atel
y $5
000
ann
ual
ly)
$12,
000
Wat
ersh
ed E
du
cati
on
Pro
gra
ms
for
sch
oo
lsG
BR
A, T
he
Mea
do
ws
Cen
ter,
CO
SM
, S
MR
F, M
erm
aid
So
ciet
y, N
GO
s,
com
mu
nit
y g
rou
ps
and
oth
er p
artn
ers
vari
es3+
20+
vari
es
Est
ablis
h W
ater
shed
Lea
rnin
g C
ente
r at
Sp
rin
g L
ake
GB
RA
, Th
e M
ead
ow
s C
ente
r, C
OS
M,
SM
RF,
Mer
mai
d S
oci
ety,
NG
Os,
co
mm
un
ity
gro
up
s an
d o
ther
par
tner
s
TB
D1
n/a
TB
D
TS
T a
nd
th
e S
an M
arco
s R
iver
R
ang
ers
TS
T, T
he
Mea
do
ws
Cen
ter
and
SM
RF
$10,
000+
----
$30,
000+
Loca
l an
d r
egio
nal
wat
er-b
ased
ed
uca
tio
n a
nd
pro
tect
ion
eve
nts
All
stak
eho
lder
s an
d W
ater
shed
C
oo
rdin
ato
rva
ries
37
vari
es
The Upper San Marcos Watershed Protection Plan 70
Description of Activities
Events
WorkshopsHalf to full day workshops will focus on topics such as water quality protection, water conservation, LID, land conservation, and BMPs for stormwater treatment. Examples include:
PXeriscaping, grow green, yard wise, urban prairiesPBMP workshop for homeowner associations and apartment managementPGroundwater protection strategy (land conservation, water well plugging)PTexas Watershed Steward ProgramPLID for homeownersPTexas Well Owner NetworkPTexas Stream and Riparian Education ProgramPWater quality monitoring
Press releases, newspaper notices, and direct mailings will be used to attract interested individuals to the workshops. The workshops will be funded through a variety of sources including the Texas A&M AgriLife Extension Service, the TSSWCB, GBRA, and other grants. Stakeholder MeetingsThe WPP Stakeholder Committee will continue to meet quarterly during implementation. Meetings will be announced via email and through the project website. These meetings will be open to the public and will be an opportunity for collaboration and updates. The meetings will focus on implementation project status updates, issues to resolve, and new ideas for collaboration. They will be hosted by non-profit/NGO entities, using in-kind services.
Smart Growth and Nonpoint Education for Municipal Employees (NEMO) Program Workshops for Elected OfficialsSmart Growth workshops and NEMO for City, University, and County officials will be used to educate community leaders on the effect of rapid urbanization on the watershed including flooding and water quality issues. Watershed tours will be included to raise understanding the role of using LID to reduce runoff, stream bank erosion, and flooding. Additional information and training for municipal employees and elected officials will be created on an as needed basis and will include regular updates regarding WPP, WQPP, and EAHCP efforts. Information and materials will be made available to University employees and, at a future date, a University employee training program will be developed.
Household Hazardous Waste/Bulk and Brushy Waste Drop off DaysThere are existing daily drop off locations in the COSM for household hazardous wastes (HHW) and spent pharmaceuticals and quarterly drop off locations for combined household hazardous waste, brush, and bulky waste. These locations are well advertised in the local newspaper and COSM website. The COSM and Hays County also hold an annual HHW event. The County operates two recycling and solid waste fixed stations on the west side of the county in Wimberley and Driftwood. Additional efforts to encourage proper disposal and additional “drop off days” will be added on an annual basis, depending on funding. Funding will also be sought to open a third station on the east side of the county near Kyle to provide additional recycling and solid waste serviced for rural residents.

71 The Meadows Center for Water and the Environment
Watershed Awareness WeekWatershed Awareness Week is a project envisioned by Texas State University and the COSM for their second cycle of the MS4 permit (2018-2023). Initially the concept was stormwater awareness, but with the combined efforts of the WPP and EAHCP, the event can encompass a watershed theme. The week will include contests, pet waste demonstrations, litter cleanups, and showings of various educational environmental films. Funding for the events will be pursued through donations, in-kind services, and grants.
Community CleanupsAt least two community cleanups will be sponsored by GBRA, the COSM, Texas State University, and Keep San Marcos Beautiful. The Great Texas River Cleanup held the first weekend in March attracts private and NGO funding, hundreds of volunteers, and results in tons of waste and debris recovered from the river and contributing watersheds. The event also develops watershed-aware leaders who return each year to lead and train new volunteers. A second cleanup will be selected to occur in the fall to coincide with Watershed Awareness Week. Other clean up events will be scheduled throughout the year by local NGOs and partners.
Mermaid Festival Watershed Protection Activities Aligned with WPP and MS4 EffortsThe Mermaid Society SMTX is a grassroots community organization committed to strengthening connectivity among like-spirited community partners in support of river guardianship, the arts, historic preservation, and local entrepreneurship. The Mermaid Society, and its many partners and supporters, host several events and outreach programs throughout the year, including a ball, parade, speaker series, educational events, fairs, and symposiums. With assistance from the Meadows Center, SMRF, and other partners, the Mermaid Society will incorporate consistent messaging about watershed protection and nonpoint source pollution into many of their activities and outreach efforts, including, but not limited to hosting speakers, demonstrations, films, and events throughout the watershed. These messages will be coordinated with City and University MS4 efforts and other ongoing watershed protection efforts to ensure that a watershed wide message is shared by all WPP and community partners. This collaborative team also is applying for grants to promote watershed protection and sustainability through the arts and education.
Printed Material and Website
WebsiteThe Meadows Center will keep the WPP website updated and it will link to other local, state and federal stormwater resources. Information on TST activities, LID BMPs, watershed tours, brochures, PSAs, and volunteer outreach events will be included. The website will be funded through a variety of sources including non-profit/NGO entities, implementation funds from City and County resources, and grants.
BrochuresThe WPP stakeholder’s workgroup will personalize the GBRA “Don’t Be Clueless about Water” brochure to reflect the unique features of the Upper San Marcos River and its tributary creeks. It will include information about the springs, watersheds that contribute flow to the San Marcos River, and the connection between the urban and stream settings. Brochures may also reflect stormwater messages developed through the City and University MS4 programs and will be available during the community cleanup events and Watershed Awareness Week. WPP documents and existing reports, information and other sources will be utilized to create additional brochures via a collaboration between local NGOs, City, County, Texas State University, and the Meadows Center. Funding will be obtained from a variety of sources including the

The Upper San Marcos Watershed Protection Plan 72
Texas A&M AgriLife Extension Service, the TSSWCB, GBRA, and other grants.
Bumper StickersBumper stickers will be created with the Upper San Marcos River logo and specific messages such as “a healthy watershed supports a clean, clear, and flowing San Marcos River” developed by the Stakeholders Committee. The bumper stickers will be distributed at community cleanups and events.
LID, Green Infrastructure, and BMP Education Manual and Supporting MaterialsMaterials developed to support the new COSM LDCs and existing documents authored by similar cities and nearby WPPs will be utilized to create resources for developers, home owners, and the public. These resources will be available in print and online and can be combined with workshops, webinar curricula, and projects highlighted in watershed tours. Technical information in the manuals can be used to guide information presented on the website, brochures, and other educational materials. The manual and materials will be developed as a collaborative effort between local NGOs, City, County, Texas State University, and the Meadows Center. Funding will be obtained from a variety of sources including private monies and grants.
Watershed ToursA series of tours will be developed as a collaborative effort between local NGOs (SMRF, Hays County Master Naturalists and the SMGA, City, County, Texas State University, and the Meadows Center) to highlight water quality initiatives in the watershed. Self-guided campus based tours, downtown tours, watershed wide tours, and greenbelt tours will have downloadable information. In addition, tours will periodically be led by volunteers as part of an outreach campaign. Funding will be obtained from a variety of sources including private monies and grants.
Utility Bill InsertsWatershed protection and nonpoint source pollution prevention information will be periodically included as inserts in utility bills and other print informational resources distributed by the City. Similar inserts will be provided to the County for any mass mailings they may have. This information and similar inserts will also be made available in print and electronic form for University communication efforts. Utility inserts using the same images and text as the bumper stickers will be created and may also include specific high priority pollutant messages for pet waste, automobile leakage, and residential use of pesticides/herbicides. Utility inserts will be prepared and included in utility bills during the month of Watershed Awareness Week (Fall).
Online TrainingTraining on the following topics will be posted to the website and made available for interested citizens and professionals needing continuing education hours for professional licenses:
PSeptic system workshopPWastewater treatment facility trainingPStormwater awareness for municipal operationsPFats, oils, and grease and HHW
These trainings were created by GBRA and will be updated as new information becomes available.

73 The Meadows Center for Water and the Environment
PSAsPSA videos for stormwater awareness were made for the COSM and Texas State MS4 programs and are available on the respective websites. Additional videos are currently being developed by the EAHCP and Keep San Marcos Beautiful campaigns targeting good river tubing behavior and anti-littering campaigns for river visitors. Videos also are posted for the Challenge SMTX campaign that challenges everyone to pick up at least one piece of trash a day. All videos are paid for by in-kind services and are posted to Facebook pages, City, and University websites and to the WPP website.
Physical Outreach Tools
Watershed Roadway SignsIf supplemental funding is available, roadway signs will be placed on roads with creek or river access identifying the name of the creek or river and a message of “Inside Watershed Environmentally Sensitive Area”. The estimated number of signs are: Purgatory Creek (6), Willow Springs Creek (7), Sessom Creek (2), Cottonwood Creek (4), Sink Creek (2), and the Upper San Marcos River (5). The Stakeholder Committee will work with the city and county to determine the signage requirements (size, color, style) and placement.
Banners and Trash Can WrapsThis is an initiative of the local MS4 program for the second permit cycle (2018-2023) to hang large banners from bridges at Hopkins and Cheatham streets where the river crosses under during the summer tubing season. The banners would carry the tag line and logo of “What Goes Here Flows Here”. Trash can wraps with the same message are planned (dependent of funding and approval) to further support the campaign. The Stakeholder Committee would be sought for advice and additional support before launching this initiative. Funding for the initiative will be through grants (other than EPA, TCEQ, and TSSWCB) and MS4 funds. Although this initiative is separate from MS4 activities, many of the goals and efforts are related.
Pet Waste Stations The existing pet waste stations in public parks and greenspaces will be expanded to offer rebates for apartment complexes and hotels to establish stations. Education efforts will be directed to those establishments located near a creek or river. Educational materials will be developed by the COSM, Texas State University, GBRA, and the Stakeholder Committee. Funding will be through funds sought out by the COSM and Texas State University stormwater programs with the help of the Meadows Center and NGOs.
Watershed ModelTST and the Spring Lake Education Program provide a mobile watershed model provided by the Meadows Center to teach about water quality and water pollution to youth groups. Students enjoy this hands-on approach and leave with an understanding of watershed science and their role in nonpoint source pollution. The EAHCP also owns a watershed model and can provide similar training at summer camps, parks, outdoor events, and community cleanups. A LID watershed model would also be beneficial to educate the community, developers, and youth about how LID works and how it can be brought into our homes and cities. The LID model could be incorporated into the TST Spring Lake and Watershed Learning Center and school education programs.
KioskKiosks in the city parks are provided by the EAHCP as part of the E&O efforts. The kiosks have

The Upper San Marcos Watershed Protection Plan 74
interchangeable education boards to provide messages and images to support stormwater awareness, watershed awareness, the role of the riparian zone, and land conservation for flood prevention and water quality. Content will be determined collaboratively between the COSM, Texas State University, the Meadows Center, GBRA, and other interested stakeholders. Funding for the design and printing of the boards will be provided through a variety of sources including Texas A&M AgriLife Extension Service, the TSSWCB, GBRA, and other grants.
Educational Programs
EcoBiz or Green Business Bureau CertificationA special certification program recognizing light industrial businesses such as auto mechanic shops, car washes, landscape companies, pesticide applicators, and others will be established in collaboration with the COSM and the Meadows Center. The intent of the program is to promote voluntary good environmental practices that will benefit the river as well as the business through increased recognition. The program will set environmental standards for good housekeeping, pollution prevention, spill response, use of less toxic chemicals, and water and energy conservation. Companies that meet the certification requirements through an inspection process by the COSM or contracted services will be listed on the registry, publicized in local social media and newspapers, and awarded with a prevalent sign that can be posted in the store front. The TCEQ may offer assistance with programs such as the Clean Texas Program and Compliance Commitment offered in the past. This project will take additional research and development.
Watershed Wise Business CampaignAn outreach program targeting local retail and service businesses in the watershed will be designed to complement the Green Business Certification program. Businesses that choose to receive educational information, display information about protecting water quality and participate in nonpoint source pollution prevention audits will receive recognition (store front, online, press and media) as being Watershed Wise. This program will be developed by year three, in conjunction with the EcoBiz or Green Business Bureau Certification.
Watershed Education Programs for Schools and Informal EducatorsMuch like the watershed models described earlier, the Meadows Center and many of its partners utilize educational programming via:
PTexas Stream TeamPTexas Aquatic Science Curriculum PTexas Parks and Wildlife DepartmentPTAMU Water Education Network PUSGS PNatureBridge and the National Park Service PNational Oceanic and Atmospheric Administration (NOAA)
These and other resources will be used to create a comprehensive resource library for providing youth in the watershed with educational modules, lesson plans, activities, and materials. This library will be available to all public and private schools, as well as home school and informal educators. It is anticipated that the online library will be coupled with “portable classrooms” or containers with educational materials that can be checked out by educators. Watershed partners will work with local educators, faith based leaders, and other community education providers to ensure that training and support are available as needed to utilize

75 The Meadows Center for Water and the Environment
these materials. Watershed partners will work together to leverage resources and raise funds to ensure the continuation and success of the program, which will be coupled with the Watershed Learning Center at Spring Lake.
Spring Lake Education ProgramThe Meadows Center hosts the Spring Lake Education Program which provides environmental education to more than 120,000 visitors and community members per year, more than one quarter of which are children and young students. The Center also supports several research, education, service, and stewardship programs, offering environmental research, employment, internships, and other opportunities to many undergraduate and graduate students.
Spring Lake Education Program efforts, in partnership with numerous watershed stakeholders, will utilize Spring Lake and the adjoining 251-acre nature preserve to tailor interactive learning opportunities and offer exploration of the diverse system that is Spring Lake and the Upper San Marcos River. In doing so, attendees and participants will become familiar with species that rely on water, as well as the threats to water quality and what we can do about them, including pollution prevention, and water conservation. Activities will be developed and adapted for school age and university students, as well as industry professionals and the public. On site educational features, structures, and modules from the watershed’s education programs will reflect the needs and interests of the community. Existing LID, green infrastructure, and stormwater management measures will include information tailored to watershed residents, including public and private school curricula and University courses. Continuing education courses for environmental professionals and local planners will also be offered. Partners will work with schools and informal education venues to raise funds to transport students to the Learning Center for field trips, as well as to provide support in the watershed’s classrooms. Examples of Learning Center activities include:
PRWH and rain gardens PWatershed mapping tools and way-finding activitiesPMacroinvertebrate samplingPWater quality monitoringPAquifer and groundwater educationPEndangered species that rely on clean waterPTree and riparian plant identificationPHabitat hikesPLocal water sustainability issuesPArt and naturePWatershed soils, climate, ecozones, and other characteristicsPRain gaugesPEnvironmental and Spatial Technology ProjectsPWater quality research fundamentalsPGreen infrastructure and LID policy, implementation and maintenancePBest practices for recreation
The Spring Lake Education Program is funded in part by the EPA through the Clean Water Act (CWA) §319(h) Nonpoint Source Program administered by the TCEQ.
Texas Stream Team and the San Marcos River RangersTST and its local partner, the San Marcos River Rangers (supported by SMRF) bring together community

The Upper San Marcos Watershed Protection Plan 76
members, students, educators, academic researchers, environmental professionals, and both public and private sector partners to conduct scientific research and promote environmental stewardship. The River Rangers collect monthly water quality data at dozens of points along the river and its tributaries. TST and the River Rangers will expand existing TST programs for monitoring riparian health and macroinvertebrate assemblages (as measures of river and stream health) and will track trash and monofilament removal. This data will be compiled at least annually and shared with watershed stakeholders as an educational tool. TST is funded in part by the EPA through the CWA §319(h) Nonpoint Source Program administered by the TCEQ.
Participation in Local and Regional Water-Based Education and Protection EventsWatershed stakeholders will participate in numerous local and regional water-based education and protection events and will share information and materials about the watershed, current water quality issues associated with the Upper San Marcos River and prevention of nonpoint source pollution. The level of participation and availability of funding will depend on the type and scope of event. Examples of events identified:
PSeventy Two Degrees PTexas Water Safari and Junior Safari PSacred Springs Powwow PPetfest PRainwater Revival PEarth Day EventsPSummer in the Park Concert and Movie Series (COSM)PFarmers and art marketsP1st Saturday birding hikesPHill Country Water SummitPHill Country Alliance Events
Evaluating Effectiveness of Education & Outreach To evaluate the effectiveness of education practices on water quality improvements, a system will be utilized and results will be documented throughout the implementation phase. The Social Indicator Planning & Evaluation System (SIPES) is a seven-step process that uses social indicators to help plan, implement, and evaluate nonpoint source management projects.
This evaluation begins with a review of project plans and then guides projects through a process to collect, analyze, and use social indicator data at the beginning and end of a nonpoint source project (Genskow and Prokopy, 2011). The SIPES Handbook was developed by the Great Lakes Regional Social Indicators Team with collaboration from US EPA Region 5, state water quality agencies, and numerous stakeholders in Region 5. This Handbook outlines the following seven steps:
1. Review project plan;2. Collect and enter pre-project survey data;3. Review data and refine social outcomes;4. Monitor social data throughout project;5. Collect and enter additional post project data;6. Collect and enter post-project survey data; and7. Review data and use results.

77 The Meadows Center for Water and the Environment
Water quality problems have accumulated over many decades and may take decades to amend. Confirming that awareness and attitudes are changing and behaviors are being adopted in a watershed is one way that projects can demonstrate progress toward water quality goals. Monitoring social indicators, like monitoring environmental indicators, will give valuable information about how well management strategies are working.
4. MONITORING PLAN Monitoring and data collection will be undertaken during implementation of the WPP by the COSM, Texas State University, GBRA via the Texas Clean Rivers Program (CRP), TST, and other partners. Flow/discharge and height are captured by gauging stations operated by USGS with support from EAA. Groundwater levels are monitored by EAA and groundwater districts (BSEACD, precincts 1 and 2, HTGDC District 5). Specialized and targeted monitoring including bacterial source tracking, TDS constituent analyses, and biological monitoring are being performed by City, University, EAHCP, and other entities.
Monitoring efforts will be coordinated and used to track water quality conditions with the aim of better understanding nonpoint source pollution contributions to the river over time. Available routine, continuous, and storm event water quality monitoring data will be used to develop a baseline for tracking water quality and WPP progress. Water quality monitoring data will be used to assess efficacy of implemented BMPs and ordinances over time. In addition, EAA and the WPP partners spend considerable effort on monitoring EAHCP progress via water quality and quantity metrics that can be applied to track WPP progress. Potential future monitoring may be used to determine the origins of TDS in source water and river water. Future monitoring may also be used to determine potential effects of stormwater pollution on source water.
Tracking Load Reductions from Management Measures WPP Monitoring Plan (Element I) efforts to measure the effectiveness of BMPs and management measures will utilize the Implementation Schedule (Element F), modeled or calculated outcomes of measures (Element B), and identified management objectives (Element C). To evaluate the effectiveness of Plan activities, the monitoring outlined in Table 4.1. Monitoring will be coordinated by Plan partners, recorded, and reported on the WPP website. Data will be compiled and reviewed at least semi-annually by the Stakeholder Committee. Additional sources of data will be reviewed for quality assurance and can also be considered. Data showing increases in pollutants will be further analyzed and used to trigger adaptive management strategies.
Adaptive management guided by water quality analyses will determine future implementation strategies. By tracking water quality trends and responses to both environmental factors and Plan activities, stakeholders will be able to evaluate whether Plan implementation is successful and can determine the need for additional actions or refocusing of existing efforts. This adaptive approach relies on frequent input of watershed information and the comparison of current conditions to the water quality targets and goals.
The following section provides information related to:
Element I. Water quality monitoring component to evaluate effectiveness
of implementation over time

The Upper San Marcos Watershed Protection Plan 78
Figure 4.1 Texas Stream Team monitoring sites along the Upper San Marcos River
Party Monitoring Activities NotesEAHCP (including COSM and Texas State University)
EAHCP monitoring:- Biological monitoring (habitat and population of covered species, macroinvertebrate rapid bioassessment, and water quality grab samples - CRP collected parameters)- Annual even year sediment sampling (toxics)- Real time monitoring data sonde in Spring Lake (collects DO, conductivity, turbidity, temperature, and pH at 15 min intervals)- Annual stormwater sampling (herbicide and pesticide compounds, atrazine in odd years, and a full suite of parameters in even years)- Annual passive diffusion sampling will include adding a PPCP diffusion sampler at the most downstream sampling site- Annual odd year tissue sampling of pelagic, fish apex predator, a covered benthic fish species, and a sediment dwelling filter feeder (parameters to be established)- Annual stormwater sampling (test only for Integrated Pest Management Plan chemicals in odd years, test full suite in even years, 5 samples/location, priority given to locations at tributary outflows)- Groundwater well sampling conducted through Non-EAHCP programs at EAA
--
COSM - Weekly collection of E. coli samples in key recreation and habitat areas (Spring Lake, City Park, Rio Vista Park, IH-35 Bridge, upstream and downstream from the waste water plant)- Monitoring of private wells upon request
Samples are processed in National Environmental Laboratory Accreditation Program (NELAP) accredited lab.
Bacteria data can be coupled with TST and GBRA data at overlapping sites
COSM MS4 – storm sewer system and BMP/site (ponds, etc) monitoring and inspection
--
Texas State University - Environmental Health, Safety and Risk Management
MS4 – storm sewer system/stormwater pollution prevention plan and BMP/site (ponds, etc) monitoring and inspection; bi-annual dry weather flow inspections on university outfallsMS4 – water quality monitoring may be included in the next permit (December 2018)
--
BSEACD, EAA Well level monitoring and other groundwater monitoring, including water quality.
--
USGS Continuous monitoring of discharge at Spring Lake. Discharge/flow and gauge height on the main stem of the river.
Data is available on website
TPWD Water quality, habitat, and biological monitoring special projects as needed
--

79 The Meadows Center for Water and the Environment
Party Monitoring Activities NotesGBRA CRP Monitoring
Routine (quarterly) monitoring for temperature, conductivity, DO, pH, nitrate/nitrite-nitrogen, TP, TSS, turbidity, SO4 -2 , Cl-1 , chlorophyll-a, total hardness, E. coli, flow, and Texas Surface Water Quality Standards bacteria sampling at one site on the main stem and all parameters except flow on the main stem just below the confluence (lower San Marcos).
Data is quality assured through TCEQ, EPA and available on website
NELAP accredited lab
TST and San Marcos River Rangers
Routine (monthly and bimonthly at select sites) monitoring for temperature, DO, specific conductivity, TDS, pH, and total depth. E. coli, nitrate/nitrogen, and orthophosphate/phosphorous at a portion of the sites. At least 15 sites will be utilized in the monitoring plan.
Existing monitoring plan will be updated as needed to collect additional data/add sites.
Data collected is quality assured through TCEQ, EPA
Data is available on website
City of San Marcos WWTF and Fish Hatchery
Daily monitoring by the WWTF include temperature, conductivity, DO, pH, nitrate/nitrite-nitrogen, TP, TSS, E. coli, and flow
A. E. Wood Fish Hatchery discharge data is recorded as a monthly average, along with daily TSS.
Data available at City
Stakeholder committee/workgroup (City, University, EAA)
Coordination of monitoring activities; compilation and review of results on a regular basis. Identification of trends or issues for further review and triggers for implementation of adaptive management strategies, including additional monitoring activities
All data will be compiled regularly and published on the WPP webpage
For bacteria and nutrients of concern, a 5-year geometric mean will be computed every 6 months. TSS and TDS data will be averaged and compared for individual and quarterly sampling events. Water quality data will be reviewed for each available monitoring site or group of localized sites (against available historical data) and compared to upstream and downstream sites for changes in pollution levels. Assessments will include pre- and post-implementation of management measures, changes in flow and climate conditions and other relevant factors. Water quality will be aggregated for subbasins with identified exceedances or emerging water quality issues (see Appendix C) and analyzed for changes over time and changes in response to management measures.

The Upper San Marcos Watershed Protection Plan 80
Modeled and calculated pollution reductions from implementation of structural BMPs will be compared with available water quality data at the subbasin scale. Figure 1.11 shows that the majority of the subbasins with exceedances are in the more urbanized, Southeastern portion of the watershed and the primary constituents of concern are TSS, nitrogen, and bacteria. For example, Sessom Creek watershed (subbasins 10, 11) has been identified as a very high priority for reduction of TSS and erosion. If possible, data will also be compared at the eleven accumulation points used for assessing current and future water quality conditions in the WPP (see the Groundwater Protection Planning document on the SMWI website under Supporting Documents). The stated goal of the stakeholder committee is to reach and maintain Targets A and B shown in Table 1.1, which in most cases are stricter than state standards and screening levels. These pollutant concentration targets were developed based on incremental implementation of the WPP and assume significant accomplishment of pollutant load reductions by the end 2025 and 2035.
Management measures requiring less resources will be implemented early in the process, while implementation of other measures will require more time, coordination, planning, and funding. Reductions in pollutant loads are likely to be gradual and not equivalent across the watershed. Water quality targets will serve as benchmarks of Plan progress and are a tool to facilitate decision-making for prioritizing future implementation activities.
Subbasins or accumulation points not meeting or trending toward targeted values, “hot spots” identified via MS4 and EAHCP, and other sources will be reviewed and additional measures will be determined to reduce nonpoint source pollution in those areas.
Coordinating Existing and Future Monitoring EffortsContinued monitoring of water quality (and in some cases quantity) is an important aspect of the WPP. Project partners will coordinate all ongoing water quality monitoring in the watershed. All acquired data will be compiled in accordance with best practices. Analyses of compiled data will be utilized to evaluate potential and realized reductions in pollutant loads and concentrations over time from ordinance changes and in situ BMPs (LID and GI). Details of known and potential monitoring activities are provided in Table 4.1.
Baseflow Monitoring
The Texas CRP is a partnership between the TCEQ and regional water authorities to coordinate and conduct water quality monitoring, assessment, and stakeholder participation to improve the quality of surface water within each river basin in Texas. GBRA is the partner responsible for administrating the CRP in the Guadalupe River Basin, to which the Upper San Marcos River belongs. The EAHCP also utilizes CRP data for decision making and milestone tracking.
Water quality data collected as part of the CRP includes: water temperature, specific conductivity, DO, and pH. Samples are collected and brought to GBRA’s NELAP accredited lab where they are analyzed for TSS, nitrates, ammonia, phosphorus, and E. coli.
There is one main stem monitoring site monitored on a quarterly basis. GBRA also monitors one location just below the confluence of the Upper San Marcos River with the Blanco River. Additional sites may be added as funding allows. Flow and water quality data from this site will provide insight regarding potential nonpoint source of pollution in the lower reach of the Upper San Marcos River.

81 The Meadows Center for Water and the Environment
Stormflow Monitoring
In general, ambient monitoring data are collected under baseflow conditions. However, reliable streamflow data following storm events is required for additional hydrologic characterization and to calculate average pollutant loads as the Plan is implemented. In addition, data on streamflow and water quality will characterize the range and temporal variability of water quantity and quality under the full range of natural conditions. Because water quality parameters are highly influenced by flow rates, it is important to understand the hydrologic response of the watershed to environmental conditions to identify causes and sources of nonpoint source pollution, and identify and implement appropriate BMPs. Any updated modeling efforts are also dependent on accurate flow estimates to ensure the greatest possible accuracy when evaluating potential impacts of future development. The EAA will conduct stormflow monitoring and if it is determined that more frequent monitoring is required, the Stakeholder Committee will work with the City and University to schedule events.
EAHCP Monitoring and Analyses
A variety of data will be collected for the EAHCP, including water quality, groundwater, toxic chemicals, metals, biological habitat, and other types of information. This data provides a robust picture of conditions in the river and the aquifer. Information collected is used to make management decisions related to species protection and can be used to supplement WPP efforts, both with supplemental data and EAA completed analyses.
MS4 Monitoring and Analyses
MS4 efforts include monitoring of BMPs which can provide information about improperly functioning measures that may be contributing pollution, as well as environmental conditions that may contribute to stormwater runoff and pollution.
Citizen Science Data – Texas Stream Team and San Marcos River Rangers
TST is a program at The Meadows Center and is primarily funded by a Section 319(h) grant from the EPA through the TCEQ. The San Marcos River Rangers, with funding from the SMRF collect data for TST and collaborate on projects related to improving or protecting water quality.
Citizen scientists who join TST are trained to collect water quality data in accordance with TST Team’s TCEQ approved Quality Assurance Project Plan (QAPP). The parameters collected by TST and River Ranger Citizen Scientists include: water temperature, specific conductivity, pH, DO, water clarity, and field observations. Advanced Citizen Scientists collect nitrates, phosphates, E. coli, turbidity, and stream flow. Sites are sampled bimonthly or monthly. The data is submitted to TST where it undergoes quality assurance review according to TST’s QAPP. The verified data is then uploaded to the Data Viewer, an interactive map/database that stores citizen scientists’ data for public view and reference.
TST can increase stakeholder involvement by training local stakeholders to collect water quality data. The data can then be presented to stakeholders and the public for a better understanding of current water quality conditions. This data also can help supplement other water quality data that is collected in the watershed. In addition to its traditional water quality monitoring programs, TST offers aquatic macroinvertebrate assemblage and riparian system monitoring. TST staff and citizen scientists will collect samples in conjunction with water quality sampling and quality assure data.

The Upper San Marcos Watershed Protection Plan 82
Figure 4.1 Texas Stream Team monitoring sites along the Upper San Marcos River

83 The Meadows Center for Water and the Environment
Well Level Data
Well level and well pressure data collected by the groundwater districts and EAA provides valuable insight to linkages between source water and surface water. This data may help stakeholders better understand and manage recharge features that allow pollutants carried by stormwater that enter the aquifer (later resurfacing as surface water at the headwaters). Some of these features also may contribute significant levels of recharge and should be managed to protect flows. Comparing this data with water quality data may help identify future BMPs to protect flows and water quality. Well and pumping data coupled with water quality data can also strengthen the case for community water conservation efforts.
Supplemental Surface Water Monitoring
Other monitoring activities in the watershed provide useful information and allow for more in depth understanding of surface water quality data, especially at the subbasin or site-specific level. Additional water quality and quantity monitoring efforts are likely to arise throughout the long-term implementation of the Plan and may be of considerable value. Examples include:
Increased Surface Water Quality MonitoringIf it is determined that progress is not being made toward achieving water quality targets or if more data is deemed necessary, additional sites within the watershed may be identified for monitoring (routine, storm, or other) by partners.
Further, stakeholders may determine that there is value in testing for constituents other than those with identified targets. Other pollutants of concern could include emerging contaminants, Pharmaceutical and Personal Care Products (PPCPs), oil, and grease. USGS and select private companies can run analysis for a wide variety of contaminants. GBRA can process samples for oil and grease. Presence of oil and grease is measured as mg/L and is typically only done when there is a sewage/septic spill. Total hydrocarbon tests could also be performed, which would test for oil and grease as well as other pollutants like gasoline. Currently, the oil and grease levels in the watershed are too low to justify testing and sampling expenditures, but as development in the watershed continues, the Stakeholder Committee may choose to implement oil and grease testing.
Groundwater Quantity and Quality MonitoringMost of the water quality data collected for the watershed is focused on surface water quality. Groundwater quantity and quality monitoring is needed to better understand what pollution is contributed via aquifer recharge to surface water flows in Spring Lake and the River, as well as important sources of recharge required to maintain flows. In addition, TDS constituent analysis of groundwater will determine the portion of TDS directly related to physical aquifer conditions and which cannot be managed with BMPs.
More information about stormwater contributions to aquifer pollution (that later emerge in surface water) will allow WPP partners and stakeholders to determine the most appropriate BMPs and which karst features are priorities for protection measures. Current monitoring includes well level and pressure monitoring by groundwater districts and EAA and continued operation of the USGS stream gauges 08170500 (main stem) and 08170000 (at the headwaters/springs). EAA performs additional groundwater monitoring that may be used to provide additional information regarding aquifer levels and water quality of source water.

The Upper San Marcos Watershed Protection Plan 84
Monitoring of BMPsBMPs implemented early in the implementation may be monitored for effectiveness of mitigating pollution entering the River and its tributaries. If it is determined that a BMP may not be operating effectively, the Stakeholder Committee will work with project partners to determine what changes are needed. BMPs that are working effectively will be presented to the community and encouraged for implementation where appropriate across the watershed.
Monitoring of Existing and Implemented BMPsExisting and newly installed BMPs on City, University, Hays County, and private property (and implementation of nonstructural measures) may require monitoring to determine effectiveness. Available data may be coupled with available pollution reduction calculation tools to estimate efficacy, as well as to determine the required size and scope for management measures.
Bacterial Source TrackingMonitoring for bacteria only shows the concentration present at a sample site, and provides no information as to the source of the pollutant. Bacterial source tracking (BST) identifies sources of fecal matter allowing targeted management strategies. Identification and assessment of sources is a key component for effective abatement programs. Additionally, BST can provide information about potential water quality impacts from the permitted discharges in the watershed. A project for BST may be implemented if water quality targets are not being achieved.

85 The Meadows Center for Water and the Environment
5 REFERENCESArmstrong, B., Young, E.L., 2000. White-Tailed Deer Management in the Texas Hill Country. Texas Parks and Wildlife, Austin, TX.
Barrett, M., L. Katz, S. Taylor, J. Sansalone, and M. Stevenson. Figure 6-1. In NCHRP Report 767: Measuring and Removing Dissolved Metals from Stormwater in Highly Urbanized Areas. Transportation Research Board of the National Academies, Washington, D.C., 2014, p. 86.
Boulder County - accessed March 02, 2017 https://assets.bouldercounty.org/wp-content/uploads/2017 /02/source-water-protection.pdf
Barra, Rocardo, Roberto Quiroz, Katia Saez, Alberto Araneda, Roberto Urrutia, Peter Popp. 2009. Sources of polycyclic aromatic hydrocarbons (PAHs) in sediments of the Biobio River in S=south central Chile. Environ Chem Lett 7: 133-139.
Barrett, Michael E., 2010, Evaluation of Sand Filter Performance, University of Texas at Austin Center for Research in Water Resources Online Report 10-07.
Bass, R and Burger, D. 2013. “Nine Elements of a Watershed Plan,” Upper Cibolo Creek Watershed Protection Plan. http://www.ci.boerne.tx.us/DocumentCenter/View/3690 - Accessed March, 31, 2014.
Bury (Bury and Partners). 20Table 3.413. Campus Storm Water Drainage Study and Plan. Texas State University. San Marcos, TX.
CDM Smith 2016. CDM Smith. December 2016. Report prepared for EPA. Planning a Green Infrastructure Incentives Program for Target Neighborhoods in the City of Cincinnati. http://www.oki.o rg/wp-content/uploads/2017/02/Cincinnati-GI-Incentive-Project-Final-Report_2016_508 Compliant_12292016.pdf
City of San Marcos. 2013. Vision San Marcos: A River Runs Through Us. San Marcos, TX.
COSM, 2007. San Marcos Flood Protection Plan Volume I of II http://www.sanmarcostx.gov/modules/showdocument.aspx?documentid=4228
Creacy, Greg. 2006. Deer Management within Suburban Areas. Texas Parks and Wildlife Department. Austin, TX.
Baird, C., M. Jennings, D. Ockerman, and T. Dybala. 1996. Characterization of nonpoint sources and loadings to the Corpus Christi Bay National Estuary Program study area. Texas Natural Resource Conservation Commission CCBNEP-05. Austin, TX.
Cox, WD, L Meng, CP Khedun, A Nordfelt, and SM Quiring. 2009. Discharge variability for an artesian spring of the Edwards Aquifer. International Journal of Climatology. 29:2324-2336.

The Upper San Marcos Watershed Protection Plan 86
Edwards Aquifer Authority, 2016 (a) - accessed Dec 1, 2016 http://www.eahcp.org/index.php/about _eahcp/
Edwards Aquifer Authority, 2016 (b) - accessed Dec 1, 2016 http://www.eahcp.org/index.php/documents _publications/habitat_conservation_plan_and_appendices
Edwards Aquifer Authority - accessed June 01, 2017 http://www.eahcp.org/files/admin-records/NEPA-and-HCP/TRIGGERS.pdf
Edwards Aquifer Habitat Conservation Plan. 2013. Attachment 8 – Expanded Water Quality Monitoring Report. Appendix P/Attachment 8 to the EAHCP 2013 Annual Report (SWCA Environmental Consultants, 2014).
Environmental Protection Agency (EPA). 2008. Handbook for Developing Watershed Pans to Restore and Protect Our Waters.
Environmental Protection Agency (EPA). No date [a]. 5.8 Total Solids: What are total solids and why are they important? http://water.epa.gov/type/rsl/monitoring/vms58.cfm. Last Accessed January, 2014.
Environmental Protection Agency (EPA). No date [b]. What is Nonpoint Source Pollution? https://www.epa.gov/nps/what-nonpoint-source Accessed June 3, 2013
Environmental Protection Agency (EPA). No date [c].Water: Monitoring and Assessment- Nitrates. https://water.epa.gov/type/rsl/monitoring/vms57.cfm Accessed December 13, 2013.
Fowler, N. L. 2005. Edwards Plateau ecology, An Introduction to the Vegetation and Ecology of the Eastern Edwards Plateau (Hill Country) of Texas. Section of Integrative Biology, University of Texas. http://www.sbs.utexas.edu/fowler/index.htm. https://www.researchgate.net/publication/255621459_ An_Introduction_to_the_Vegetation_and_Ecology_of_the_Eastern_Edwards_Plateau_Hill _Country_of_Texas Accessed May 30, 2016.
GBRA, 2010. Evaluation of Hydrologic Connection between San Marcos Springs and Barton Springs through the Edwards Aquifer http://www.edwardsaquifer.net/pdf/San_Marcos_and_Barton _Springs_connectivity.pdf
Geosyntec Consultants, Inc. and Wright Water Engineers, Inc., 2010, International Stormwater Best Management Practices (BMP) Database Pollutant Category Summary: Nutrients, International Stormwater BMP Database.
Gregg Eckhardt, 2016. http://www.edwardsaquifer.net/index.html Accessed May 1, 2016.
Genskow, K. and Prokopy, L. (eds). 2011. The Social Indicator Planning & Evaluation System (SIPES) for Nonpoint Source Management; A Handbook for Watershed Projects: 3rd edition. Available from: http://greatlakeswater.uwex.edu/social-indicators Last Accessed November, 2013.

87 The Meadows Center for Water and the Environment
Guadalupe Blanco River Authority (GBRA). 2012. GBRA Basins Highlight 2012 Report. http://www. gbra.org/documents/publications/basinhighlights/2012.pdf.
Hrdinka et al, 2012. Possible impacts of floods and droughts on water quality. Journal of Hydro-environment Research. Volume 6, Issue 2, May 2012, Pages 145–150 http://www.sciencedirect.com/science/ article/pii/S15706443120000932014
Hunt, B, BA Smith, J Beery, D Johns, and N Hauwert. 2006. Summary of 2005 groundwater dye tracing, Barton Springs segment of the Edwards Aquifer, Hays and Travis counties, central Texas. Barton Springs/Edwards Aquifer Conservation District, BSEACD Report of Investigations 2006-0530.
Maclay, R.W. and L.F. Land (1988) Simulation of flow in the Edwards Aquifer, San Antonio Region, Texas, and refinement of storage flow concepts. U.S. Geological Survey Water-Supply Paper 2336.
Naismith Engineering, Inc., June 2005, Regional Water Quality Protection Plan for the Barton Springs Segment of the Edwards Aquifer and Its Contributing Zone.
NOAA/EAA NEXRAD data, 2014 http://www.edwardsaquifer.org/scientific-research-and-data/aquifer -data-and-maps/monthly-calibrated-rain-maps
Nowlin, Weston, Benjamin Schwartz. 2012. Spring Lake Characterization and Management Recommendations Final Report. Texas State University. Nonpoint Source Protection Program CWA §319 (h).
NPAT, 2015: Accessed July 1, 2015 http://texasprairie.org/index.php/learn/about_prairies_entry/what _are_the_ecoregions_of_texas/
Ogden, A. E., Quick, R. A., Rothermel, S. R., Lunsford, D. L., and Snider, C. C. (1986) Hydrogeological and hydrochemical investigation of the Edwards aquifer in the San Marcos area. Texas: Edwards Aquifer Research and Data Center Report R1-86.
Ogden, A. E., Quick, R. A., Rothermel (1986). Hydrochemistry of the Comal, Hueco, and San Marcos Springs, Edwards Aquifer, Texas. In The Balcones Escarpment, Abbott, Patrick L, and Woodruff, C.M., eds. San Antonio: Geological Society of America, pp. 51-54.
Riskind, D, and DD Diamond. 1986. Plant communities of the Edwards Plateau of Texas: An overview emphasizing the Balcones Escarpment zone between San Antonio an Austin, with special attention to landscape contrasts and natural diversity. pp. 20-32. In: The Balcones Escarpment, PL Abbot and CM Woodruff, Jr. (eds.). Geological Society of America Publication.
San Marcos Daily Record. 2017. “How San Marcos is growing ‘by the numbers’ https://www. sanmarcosrecord.com/news/how-san-marcos-growing-%E2%80%98-numbers%E2%80%99
Saunders, Kenneth. 2001. “Segment Description,” An Evaluation of Spring Flows to Support the Upper

The Upper San Marcos Watershed Protection Plan 88
San Marcos River Spring Ecosystem, Hays County (2001): 12-13.
Schueler, T. 1994. The Importance of Imperviousness: Watershed Protection Techniques 1(3):100-111.
Shaver, E., R.Horner, J.Skupien, C.May,G.Ridley. 2007. Fundamentals of Urban Runoff Management – Technical and Institutional Issues. NALMS. http://www.ilma-lakes.org/PDF/Fundamentals_full _manual_lowres.pdf
Taylor, Richard B. and Hellgren, Eric C. 1997. Diet of Feral Hogs in the Western South Texas Plains. The Southwestern Naturalist. Vol 42, No. 1. Pp 33-39.
Texas Commission on Environmental Quality (TCEQ). 2010. Chapter 307 - Texas Surface Water Quality Standards. Retrieved from http://www.tceq.state.tx.us/assets/public/legal/rules/rules/ pdflib/307%60.pdf
Texas Commission on Environmental Quality (TCEQ). Implementation Procedures: RG-194, dated June 2010, Chap 1 https://www.tceq.texas.gov/assets/public/permitting/waterquality/standards/ docs/june_2010_ip.pdf
Texas Commission on Environmental Quality (TCEQ). 2012. 2012 Texas Integrated Report – Texas 303 (d) List (Category 5).
Texas Commission on Environmental Quality (TCEQ). 2012b. Procedures to Implement the Texas Surface Water Quality Standards. Retrieved from https://www.tceq.texas.gov/assets/public/ permitting/waterquality/standards/docs/draft_jan_2012_ip.pdf
Texas Commission on Environmental Quality (TCEQ). 2012. 2012 Texas Integrated Report – Texas 303(d) List (Category 5). Texas Parks and Wildlife Department (TPWD). 1974. An Analysis of Texas Waterways - A Report on the Physical Characteristics of Rivers, Streams and Bayous in Texas. tpwd.texas.gov/publications/pwdpubs/pwd_rp_t3200_1047/index.phtml. Last Assessed July 1, 2015.
Texas State University. No date. Stormwater. Environmental Health, Safety and Risk Management Webpage. http://www.fss.txstate.edu/ehsrm/programs/storm.html. Last accessed March, 2014.
Thompson GM, and JM Hayes. 1979. Trichlorofluoromethane in groundwater – a possible tracer and indicator of groundwater age. Water Resources Research 15:546-554.
TPWD, 2015 https://tpwd.texas.gov/education/hunter-education/online-course/wildlife-conservation/ texas-ecoregions
TWDB, 2016 http://www.twdb.texas.gov/waterplanning/data/projections/2017/popproj.asp
United States Geological Survey (USGS). 2011, Water science glossary of terms: U.S. Geological Survey , Last Accessed July 1, 2015.
89 The Meadows Center for Water and the Environment
United States Geological Survey (USGS). 2014. Water Science Glossary of Terms. http://water.usgs.gov/ edu/dictionary.html#W. Last Accessed March, 2014.
U.S. Climate Data. 2015. http://www.usclimatedata.com/climate/san-marcos/texas/united-states/ ustx1210
U.S. Drought Monitor, accessed June 01, 2017 http://droughtmonitor.unl.edu/aboutusdm.aspx
USCB, 2014 change to 2016 http://www.census.gov/quickfacts/table/PST045215/4865600
USGS, 2012. Origin and Characteristics of Discharge at San Marcos Springs Based on Hydrologic and Geochemical Data (2008–10), Bexar, Comal, and Hays Counties, Texas http://www.edwardsaquifer. net/pdf/San_Marcos_USGS_2012.pdf
You, Helen and Lloyd Potter, 2106 Estimates of the Total Populations of Counties and Places in Texas for July 1, 2014 and January 1, 2015 http://demographics.texas.gov/Resources/TPEPP /Estimates/2014/2014_txpopest_county.pdf

The Upper San Marcos Watershed Protection Plan 90
APPENDIX A: WATERSHED CHARACTERISTICS
View online at SMWIAppendixA.MeadowsWater.org

91 The Meadows Center for Water and the Environment
APPENDIX B: MODELING METHODOLOGY
View online at SMWIAppendixB.MeadowsWater.org

The Upper San Marcos Watershed Protection Plan 92
APPENDIX C: SUBBASIN SCALE WATER QUALITY ANALYSIS
View online at SMWIAppendixC.MeadowsWater.org

93 The Meadows Center for Water and the Environment
APPENDIX D: COMPREHENSIVE WATERSHED BEST MANAGEMENT PRACTICES
View online at SMWIAppendixD.MeadowsWater.org

The Upper San Marcos Watershed Protection Plan 94
601 University Drive, San Marcos TX 78666512.245.9200 | [email protected] | www.MeadowsWater.org