the up-dateof the large quasar astrometric catalogue (lqac) · the up-dateof the large quasar...
TRANSCRIPT
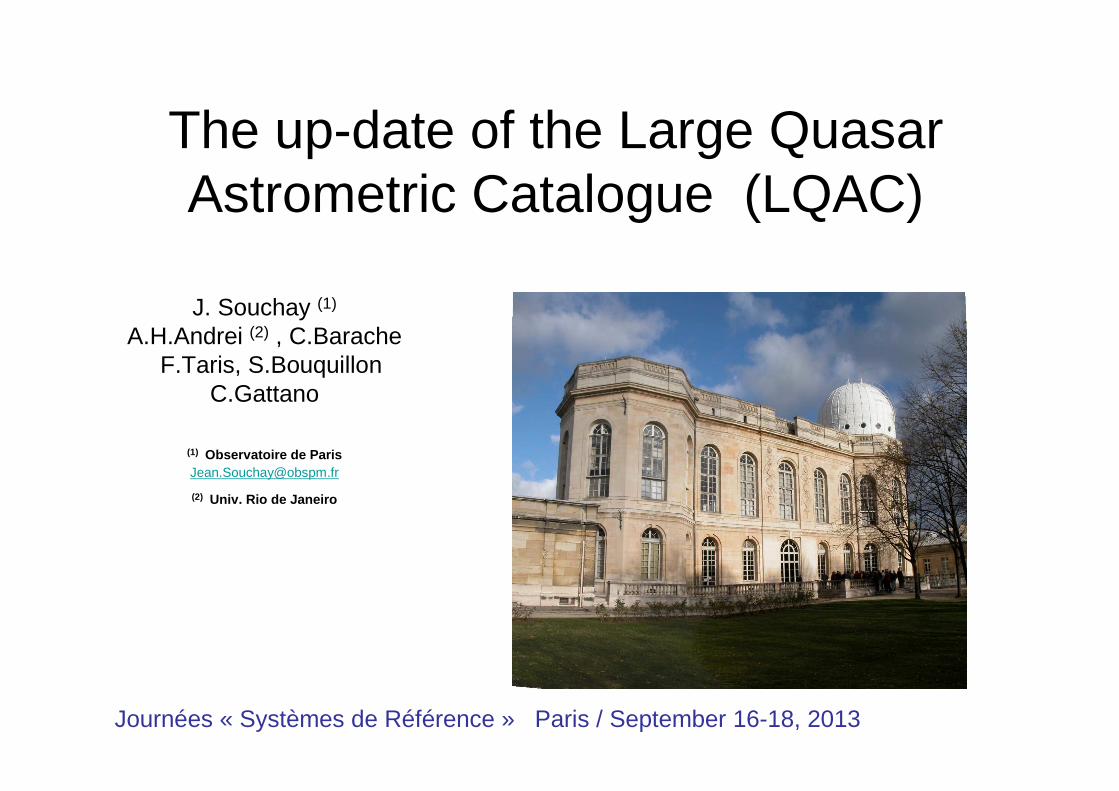
The up-date of the Large Quasar Astrometric Catalogue (LQAC)
J. Souchay (1)
A.H.Andrei (2) , C.BaracheF.Taris, S.Bouquillon
C.Gattano
(1) Observatoire de [email protected]
(2) Univ. Rio de Janeiro
Journées « Systèmes de Référence » Paris / September 16-18, 2013
The up-date of the Large Quasar Astrometric Catalogue (LQAC)
Journées « Systèmes de Référence » Paris / September 16-18, 2013
I. Principle of the LQACII. Characteristics of the LQAC-2III. Distribution and « double quasars »IV. How many quasars detected by GAIA ?V. Conclusion

I. Principle of the LQAC
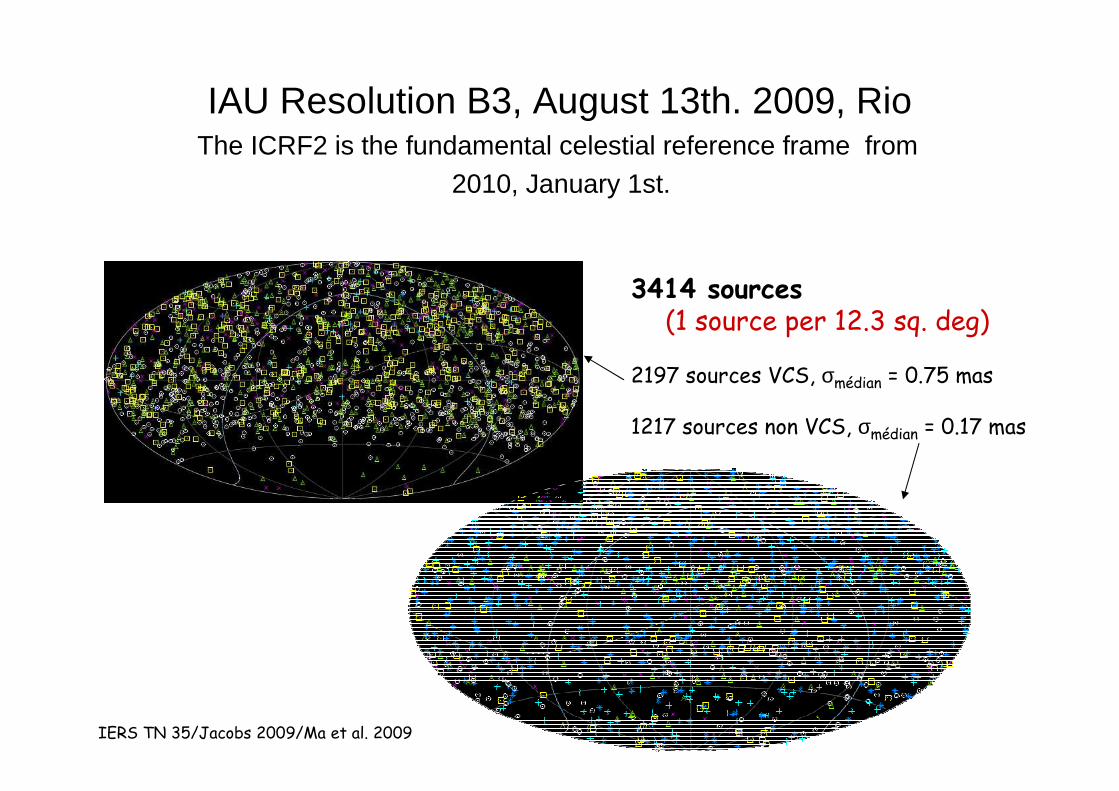
IAU Resolution B3, August 13th. 2009, RioThe ICRF2 is the fundamental celestial reference frame from
2010, January 1st.
3414 sources
(1 source per 12.3 sq. deg)
2197 sources VCS, σmédian = 0.75 mas
1217 sources non VCS, σmédian = 0.17 mas
IERS TN 35/Jacobs 2009/Ma et al. 2009

Densification of the ICRS : quasars catalogues & compilations

A drastic increase of recordedquasars
QSO’s
BL Lac
AGNVéron-Cetty & Véron (2003)
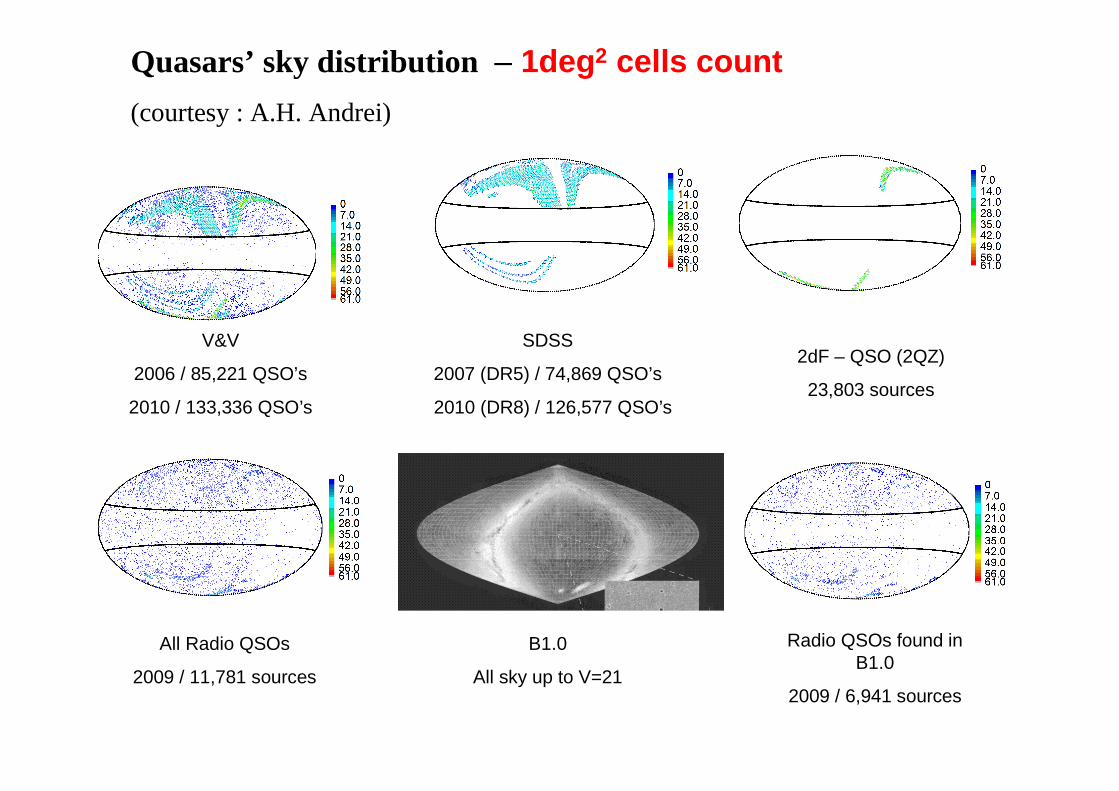
Quasars’ sky distribution – 1deg2 cells count
(courtesy : A.H. Andrei)
A
V&V
2006 / 85,221 QSO’s
2010 / 133,336 QSO’s
SDSS
2007 (DR5) / 74,869 QSO’s
2010 (DR8) / 126,577 QSO’s
2dF – QSO (2QZ)
23,803 sources
All Radio QSOs
2009 / 11,781 sources
B1.0
All sky up to V=21
Radio QSOs found in B1.0
2009 / 6,941 sources

Construction of the LQAC (Large Quasars Astrometric Catalogue)
Objectives
- Compilation of all the recorded quasars- Strategy insisting on astrometric quality
- Catalogue flag (A=>M) for cross-identifications- Extended photometry & redshift
- Calculation of absolute magnitudes MI & MB
- Basis for regular up-dates (=> GAIA)
- Final ASCII file with V.O. tools in parallel- Comparisons / statistics / coherence

PRESENT QSO’S CATALOGUES Radio
• ICRF 2 (Ma, et al., 2009) 3,414 radio-loud QSOs and AGNs.
• VLBA Calibrators (Beasley, et al., 2007) accurate VLBI position for 5,198 radio-stable QSOs and AGNs.
• VLA Calibrators (Benson et al., 2006; www.vla.nrao.edu/astro/calib/)
radio interferometry astrometry and map information for 1860 QSOs and AGNs.
• JVAS Calibrators (Patnaik et al.,1992; Wilkinson et al., 1998
radio interferometry astrometry for 2,118 compact QSOs and AGNs.
Etc …….
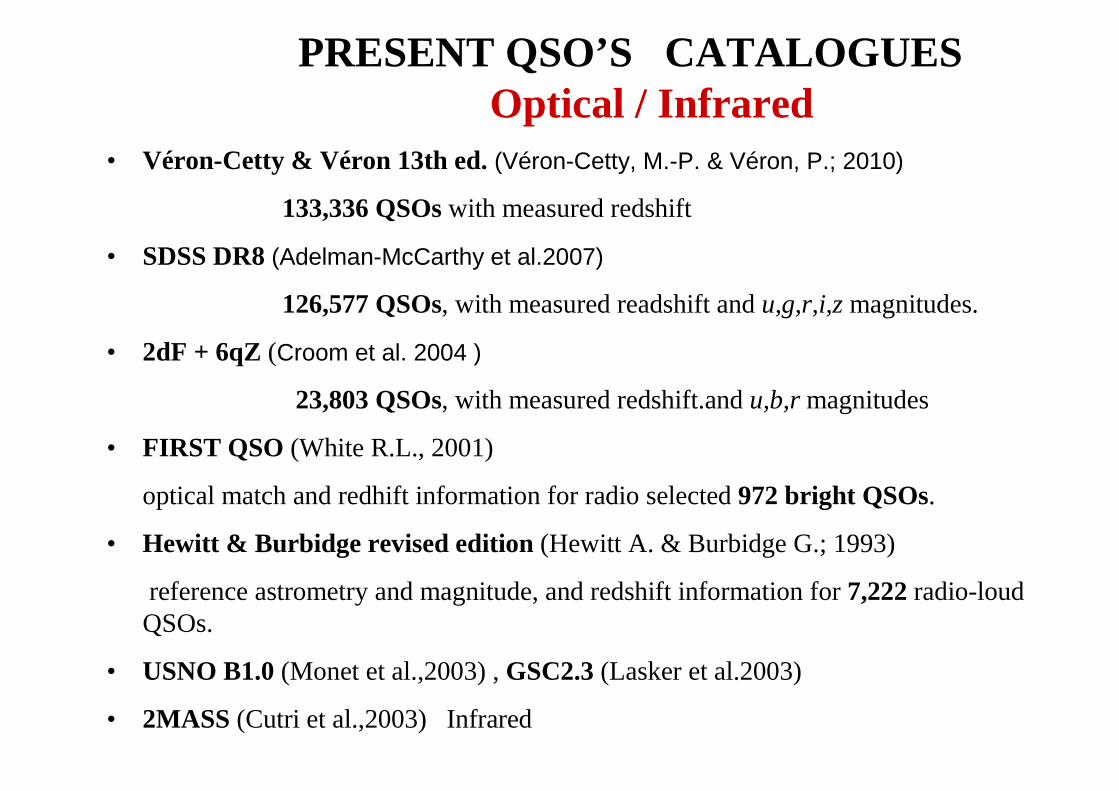
PRESENT QSO’S CATALOGUES Optical / Infrared
• Véron-Cetty & Véron 13th ed. (Véron-Cetty, M.-P. & Véron, P.; 2010)
133,336 QSOswith measured redshift
• SDSS DR8 (Adelman-McCarthy et al.2007)
126,577 QSOs, with measured readshift and u,g,r,i,z magnitudes.
• 2dF + 6qZ (Croom et al. 2004 )
23,803 QSOs, with measured redshift.andu,b,r magnitudes
• FIRST QSO (White R.L., 2001)
optical match and redhift information for radio selected 972 bright QSOs.
• Hewitt & Burbidge revised edition (Hewitt A. & Burbidge G.; 1993)
reference astrometry and magnitude, and redshift information for 7,222 radio-loud QSOs.
• USNO B1.0(Monet et al.,2003) , GSC2.3(Lasker et al.2003)
• 2MASS (Cutri et al.,2003) Infrared
II. Characteristics of the LQAC-2(Souchay et al., 2012)

Improvements of the LQAC-2 (2012) % LQAC (2009)
• More quasars 187,504 vs. 113,666 (+64%)
• More cross-identifications• LQAC identification number for each QSO
• New astrometry => LQRF coordinates(Andrei et al.,2009)
• Addition of morphological indexes- normalness- skewness- roundness

Optimized astrometry• LQRF coordinates (Andrei et al.,2009)
- Identification in very large surveys
(B1.0,GSC2.3,SDSS)
- Astrometric reduction w.r.t. the UCAC-2
- Use of spherical harmonics to fit with the ICRF2
(αααα,δδδδ) off-set w.r.t. V magnitude ( αααα,δδδδ) off-set w.r.t. g magnitude
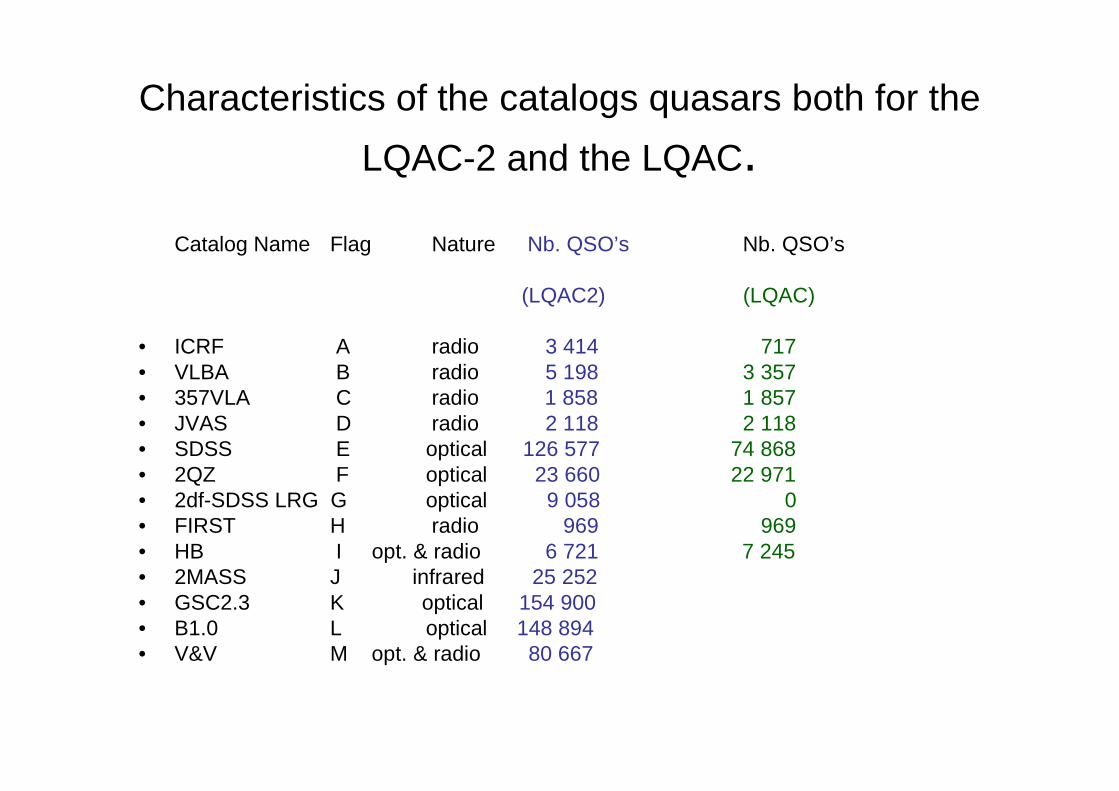
Characteristics of the catalogs quasars both for the
LQAC-2 and the LQAC.
Catalog Name Flag Nature Nb. QSO’s Nb. QSO’s
(LQAC2) (LQAC)
• ICRF A radio 3 414 717• VLBA B radio 5 198 3 357• 357VLA C radio 1 858 1 857• JVAS D radio 2 118 2 118• SDSS E optical 126 577 74 868• 2QZ F optical 23 660 22 971• 2df-SDSS LRG G optical 9 058 0• FIRST H radio 969 969• HB I opt. & radio 6 721 7 245• 2MASS J infrared 25 252• GSC2.3 K optical 154 900• B1.0 L optical 148 894• V&V M opt. & radio 80 667
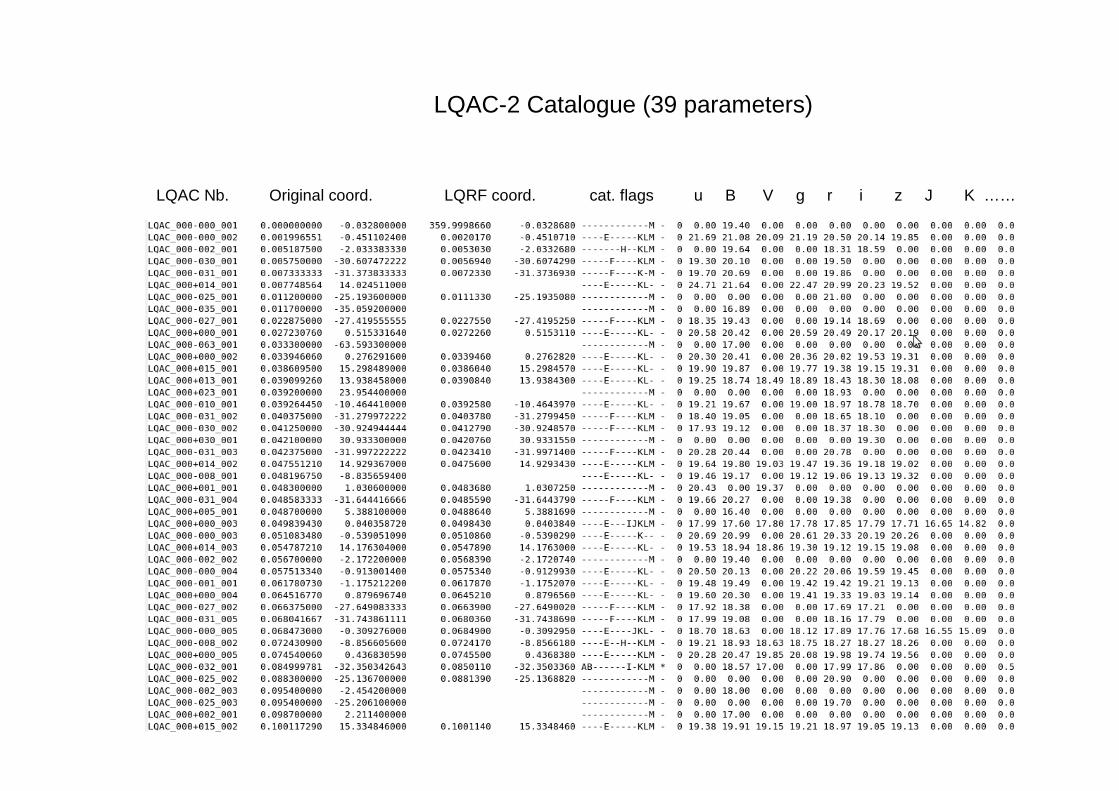
LQAC Nb. Original coord. LQRF coord. cat. flags u B V g r i z J K ……
LQAC-2 Catalogue (39 parameters)
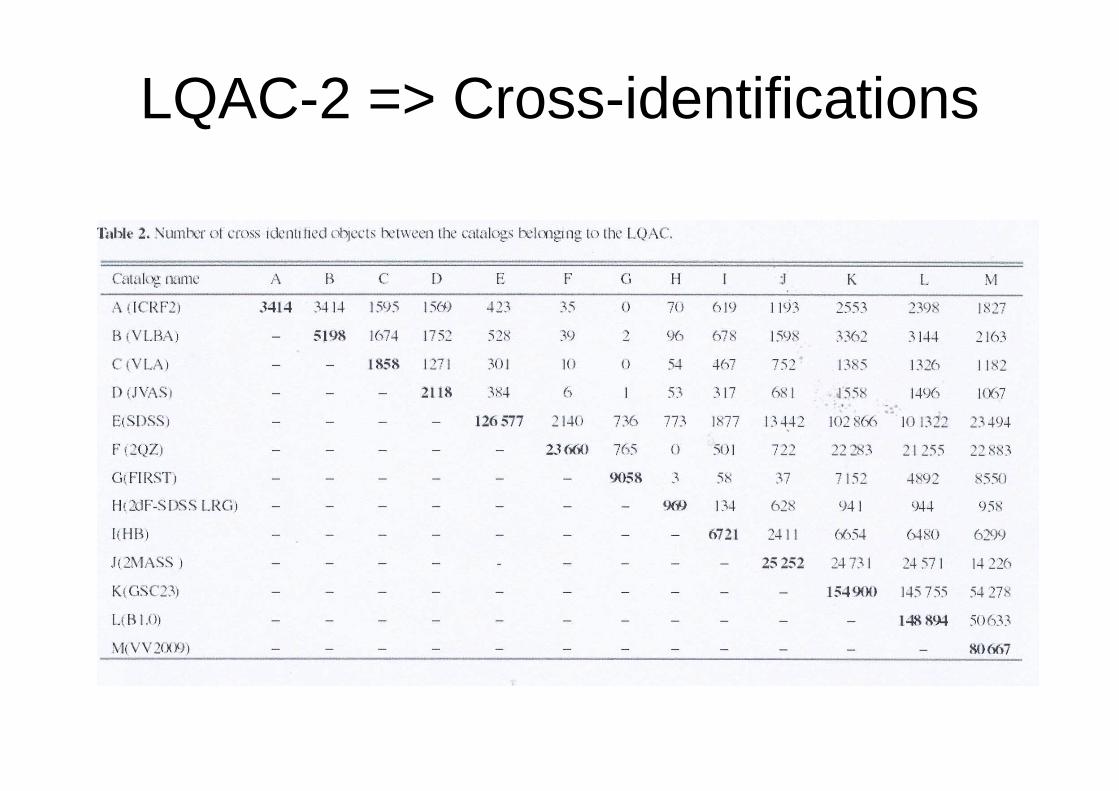
LQAC-2 => Cross-identifications

LQAC => items completness
III. Distribution and « double quasars »
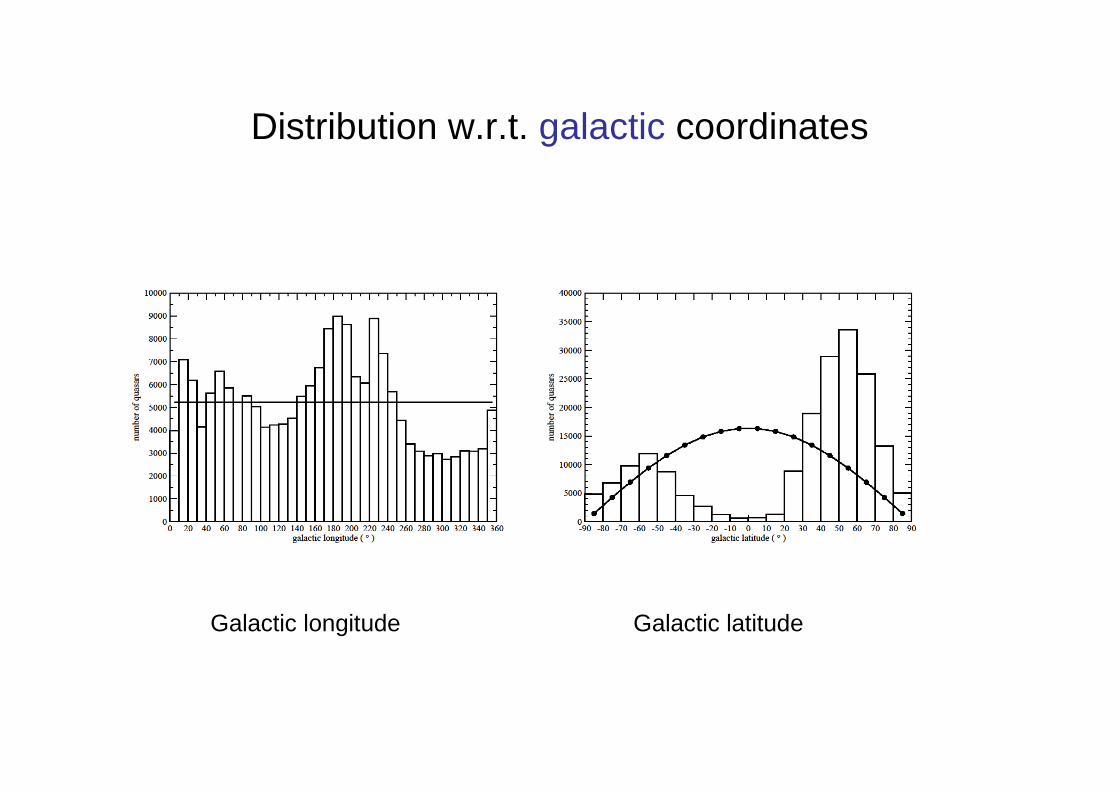
Distribution w.r.t. galactic coordinates
Galactic longitude Galactic latitude
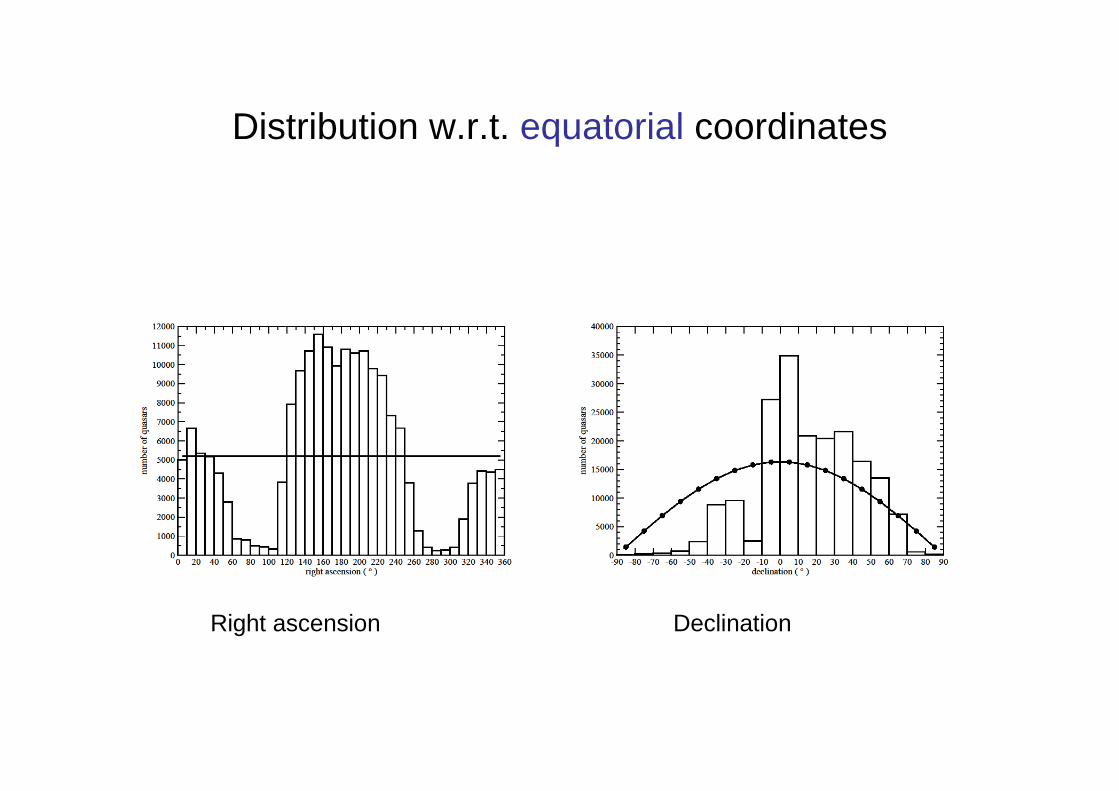
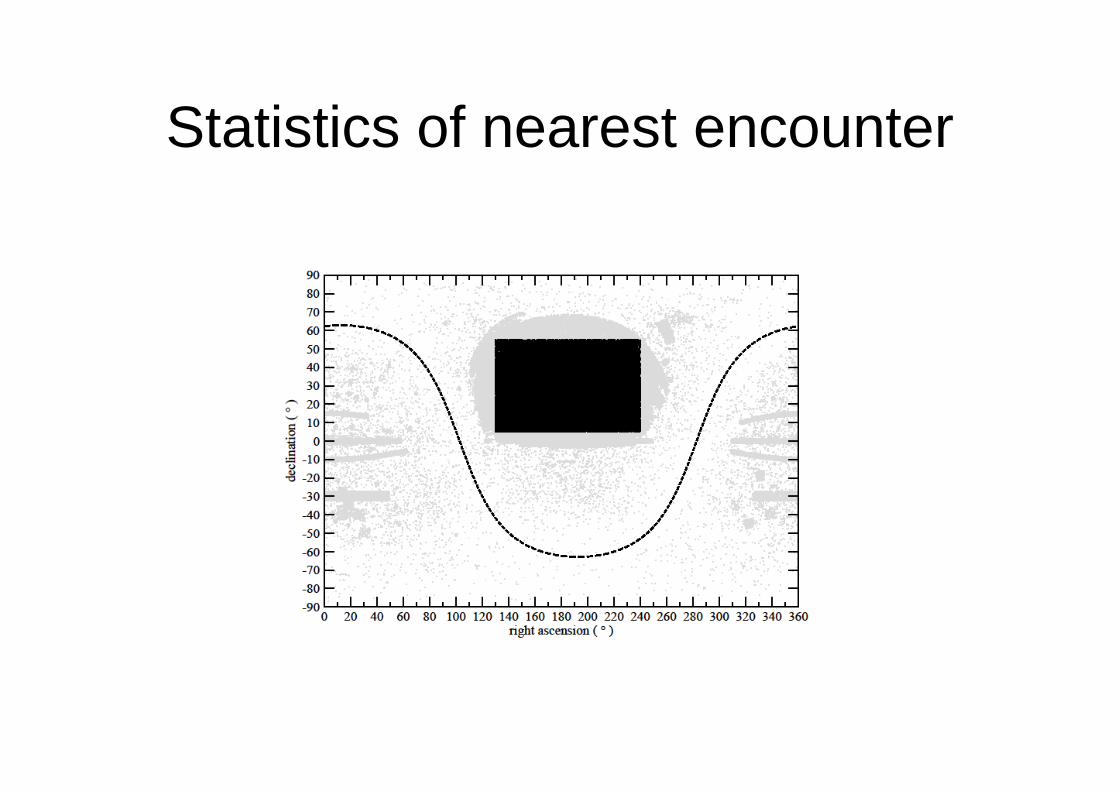
Distribution w.r.t. equatorial coordinates
Right ascension Declination

Statistics of k th- nearest encounter
fk(r) = [ 1 / 2k-1 (k-1)! σ ] (r/σ)2k-1 x exp(-r2 / 2σ2) ( Mignard,2004)
Statistics of nearest encounter
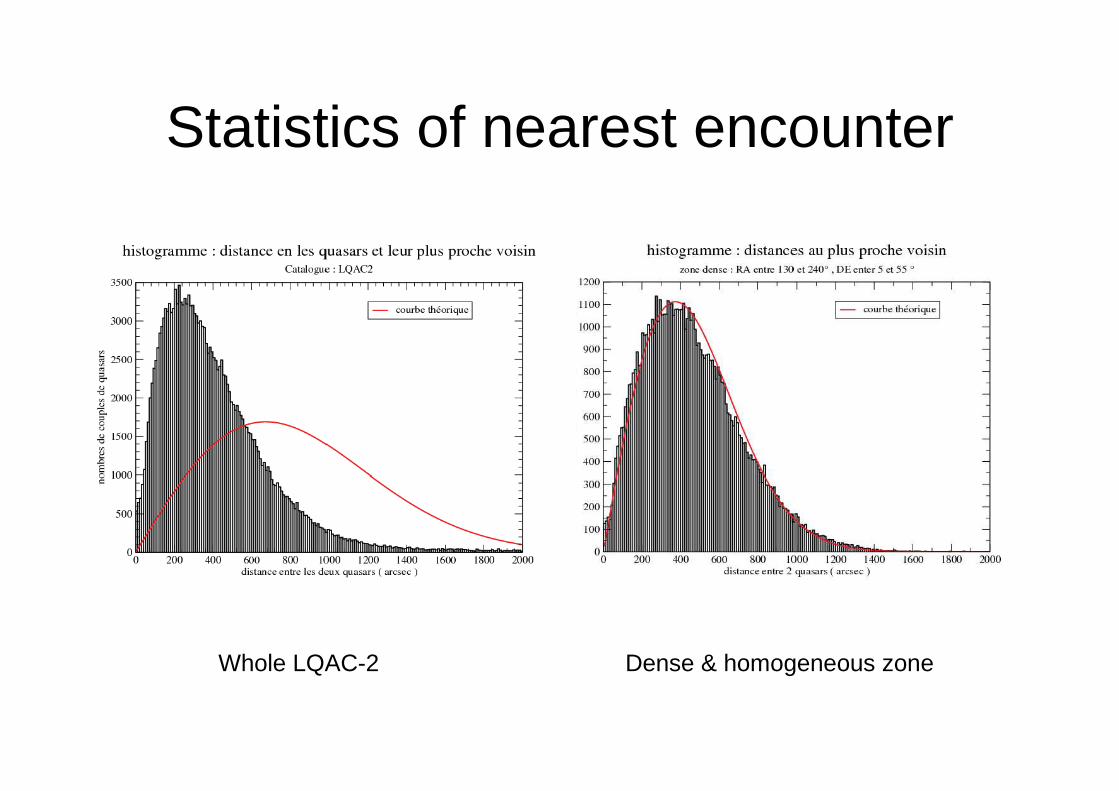
Statistics of nearest encounter
Whole LQAC-2 Dense & homogeneous zone

Statistics of nearest encounter
?
- hazardous coïncident quasars ?- false double identification ?- true double quasars ?DSS images
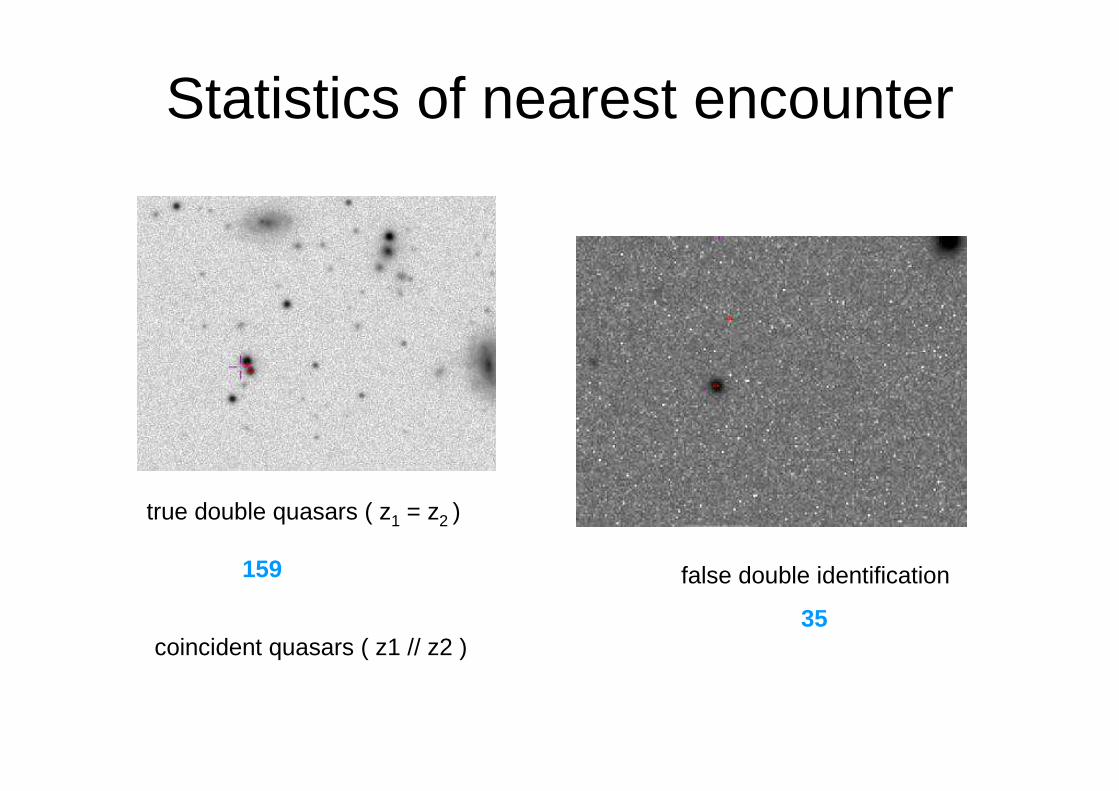
Statistics of nearest encounter
true double quasars ( z1 = z2 )
159 false double identification
35coincident quasars ( z1 // z2 )
IV. How many quasars detected by GAIA ?

How many quasars detected by GAIA ?
Methodology
(1) Isolate a sky zone ZZ of surface SS already surveyed with the highest density
(2) Estimate inside ZZ the number of quasars with GAIA threshold (V < 20)
(3) Extrapolate the number of quasars for the whole sky
(4) Take into account a ratio for galactic extinction
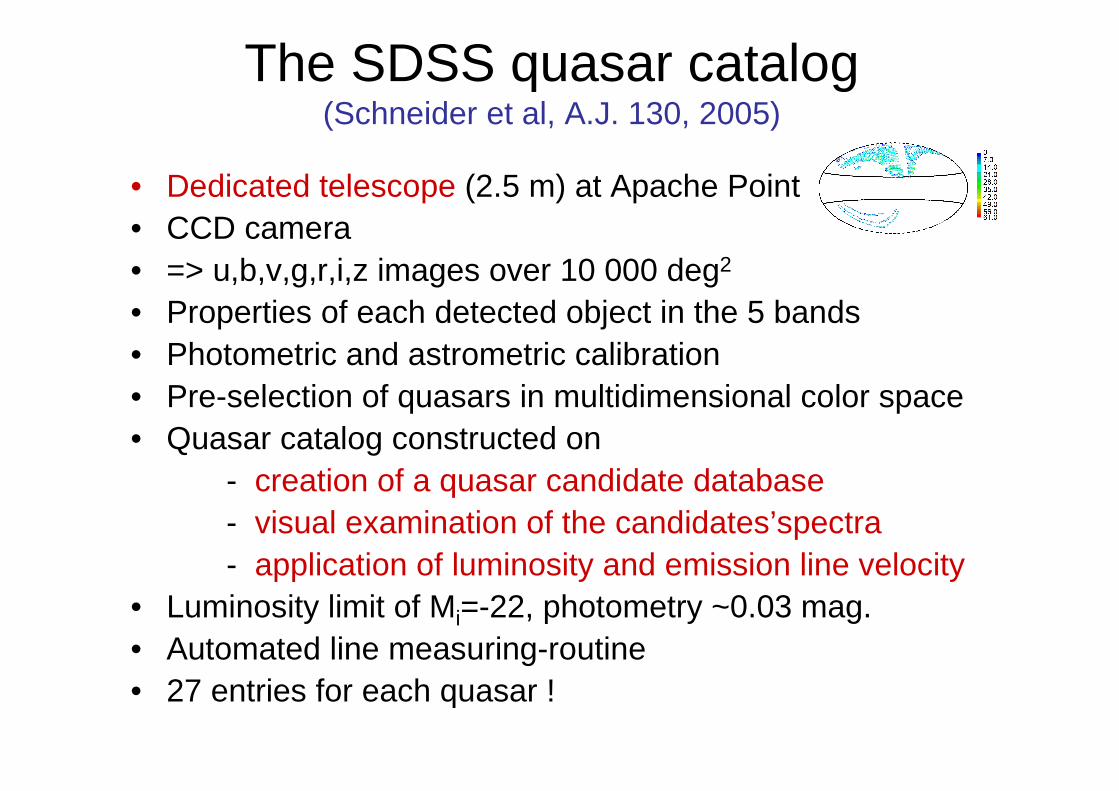
The SDSS quasar catalog(Schneider et al, A.J. 130, 2005)
• Dedicated telescope (2.5 m) at Apache Point• CCD camera • => u,b,v,g,r,i,z images over 10 000 deg2
• Properties of each detected object in the 5 bands• Photometric and astrometric calibration• Pre-selection of quasars in multidimensional color space• Quasar catalog constructed on
- creation of a quasar candidate database- visual examination of the candidates’spectra- application of luminosity and emission line velocity
• Luminosity limit of Mi=-22, photometry ~0.03 mag.• Automated line measuring-routine• 27 entries for each quasar !
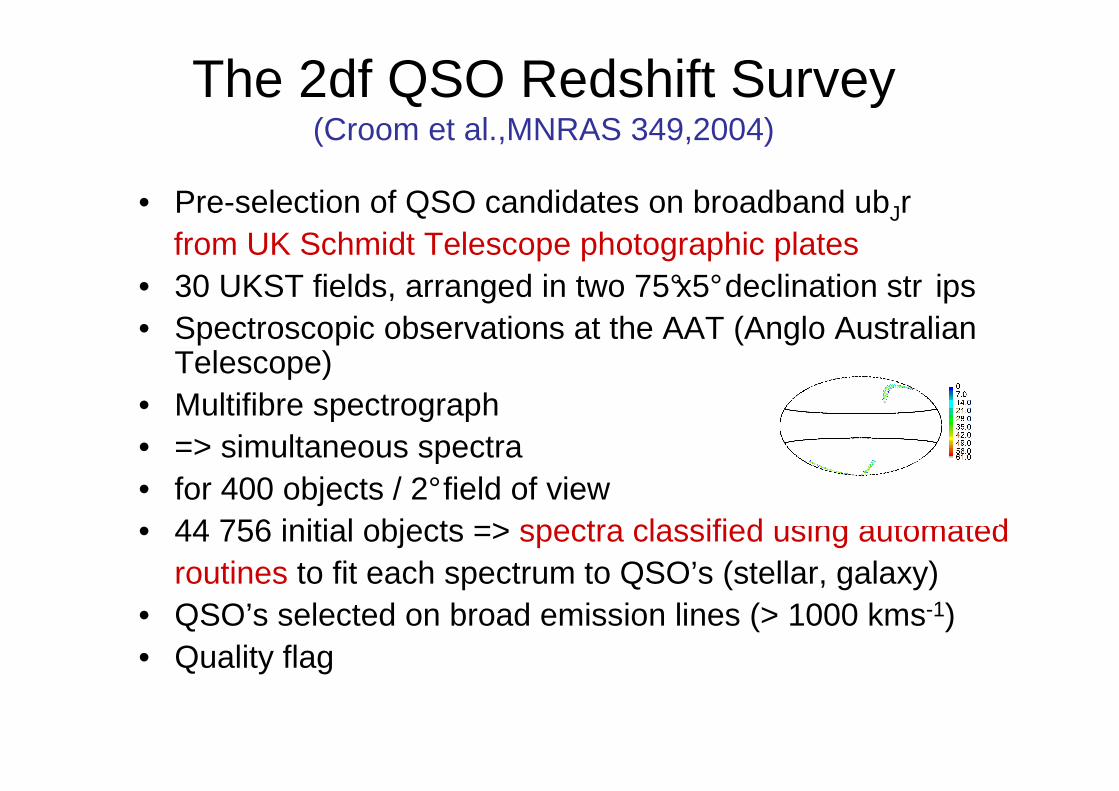
The 2df QSO Redshift Survey(Croom et al.,MNRAS 349,2004)
• Pre-selection of QSO candidates on broadband ubJrfrom UK Schmidt Telescope photographic plates
• 30 UKST fields, arranged in two 75°x5°declination str ips• Spectroscopic observations at the AAT (Anglo Australian
Telescope)• Multifibre spectrograph• => simultaneous spectra• for 400 objects / 2°field of view• 44 756 initial objects => spectra classified using automated
routines to fit each spectrum to QSO’s (stellar, galaxy)• QSO’s selected on broad emission lines (> 1000 kms-1)• Quality flag
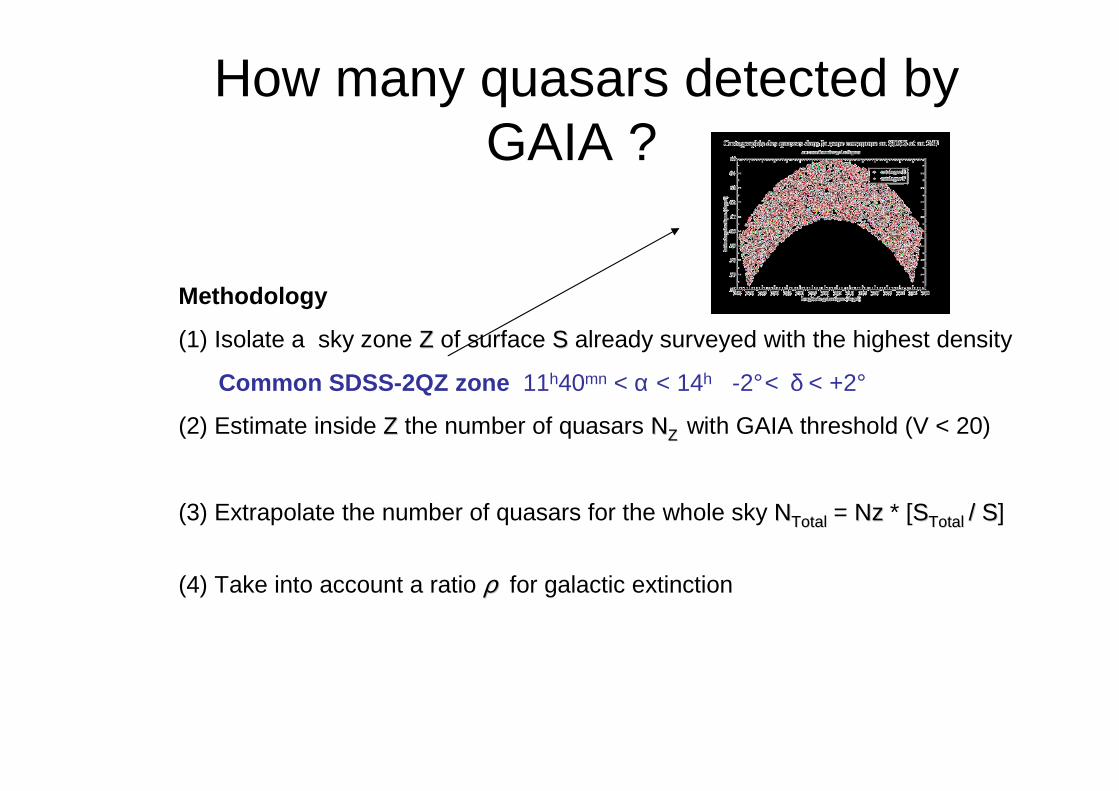
How many quasars detected by GAIA ?
Methodology
(1) Isolate a sky zone ZZ of surface SS already surveyed with the highest density
Common SDSS-2QZ zone 11h40mn < α < 14h -2°< δ < +2°
(2) Estimate inside ZZ the number of quasars NNZZ with GAIA threshold (V < 20)
(3) Extrapolate the number of quasars for the whole sky NNTotalTotal = NzNz * [SSTotalTotal / S/ S]
(4) Take into account a ratio ρρ for galactic extinction

How many quasars detected by GAIA ?
Methodology
(1) Isolate a sky zone ZZ of surface SS already surveyed with the highest density
Common SDSS-2QZ zone 11h40mn < α < 14h -2°< δ < +2°
(2) Estimate inside ZZ the number of quasars NNZZ with GAIA threshold (V < 20)
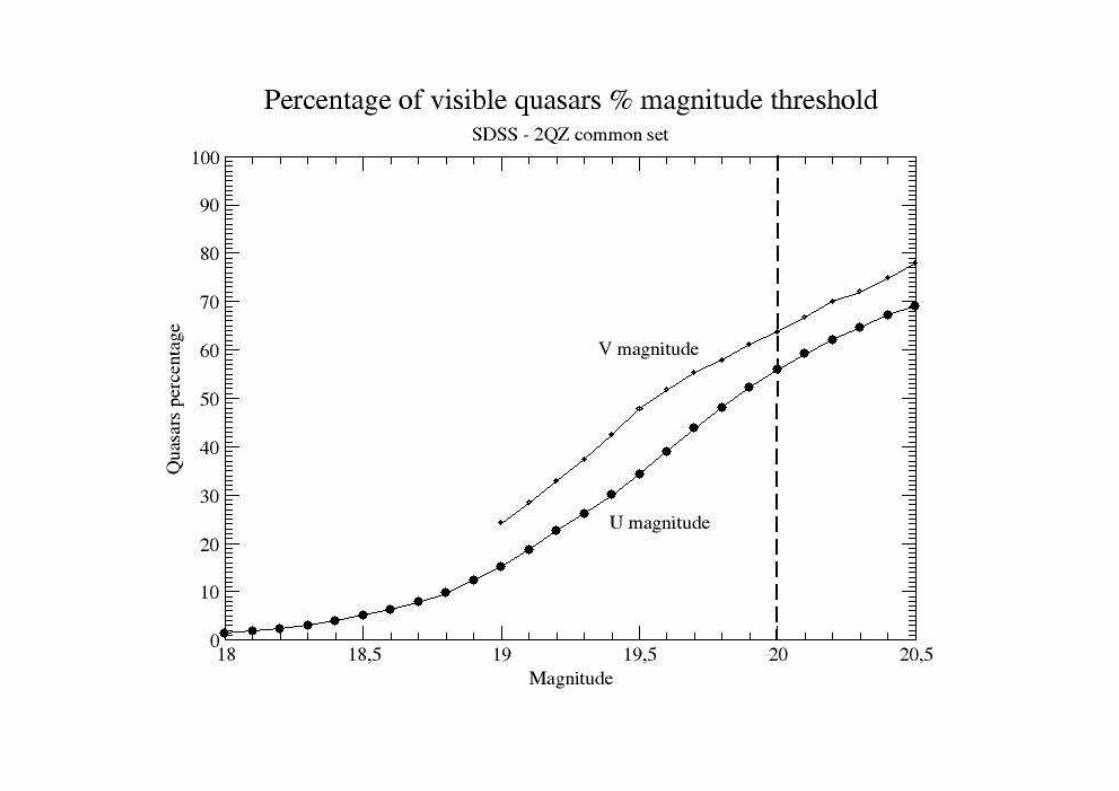
Problem : V data uncomplete => use of V vs. u relationship
(3) Extrapolate the number of quasars for the whole sky
(4) Take into account a ratio ρρ for galactic extinction

How many quasars detected by GAIA ?
Methodology
(1) Isolate a sky zone ZZ of surface SS already surveyed with the highest density
Common SDSS-2QZ zone 11h40mn < α < 14h -2°< δ < +2°
(2) Estimate inside ZZ the number of quasars NNZZ with GAIA threshold (V < 20)
Problem : V data uncomplete => use of V vs. u relationship
(3) Extrapolate the number of quasars for the whole sky
NNTotalTotal = NzNz * [SSTotalTotal / S/ S]
(4) Take into account a ratio ρρ for galactic extinction
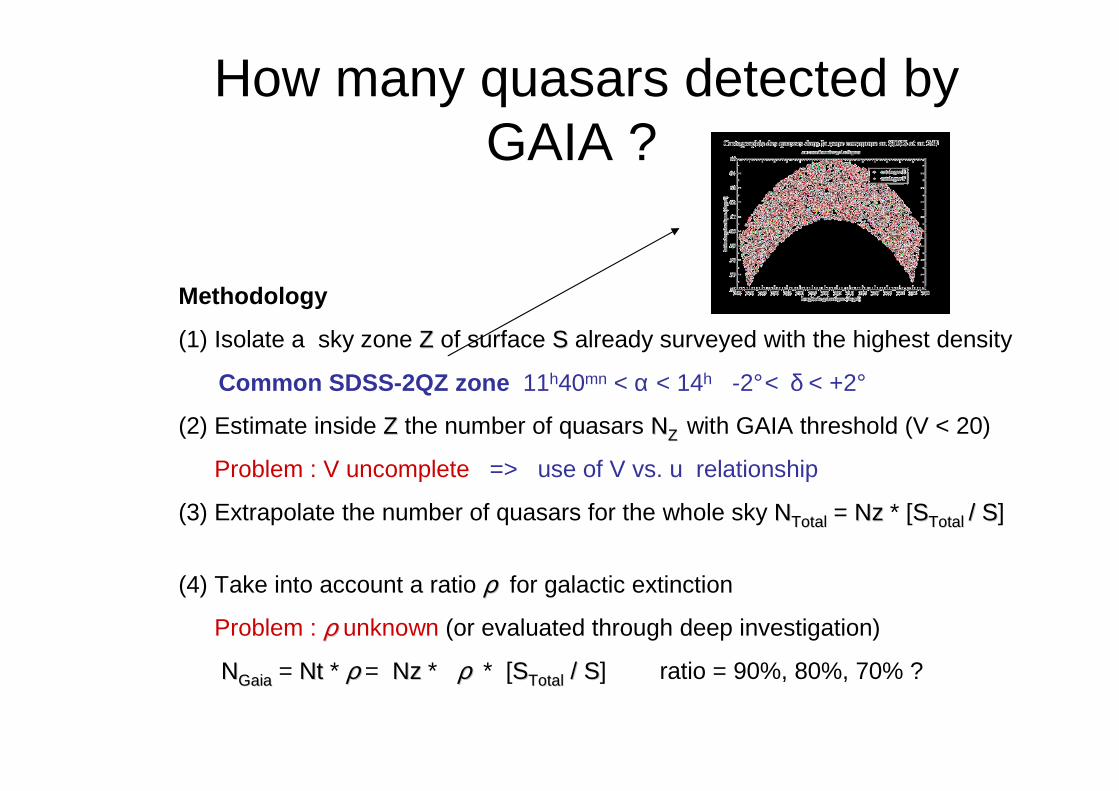
How many quasars detected by GAIA ?
Methodology
(1) Isolate a sky zone ZZ of surface SS already surveyed with the highest density
Common SDSS-2QZ zone 11h40mn < α < 14h -2°< δ < +2°
(2) Estimate inside ZZ the number of quasars NNZZ with GAIA threshold (V < 20)
Problem : V uncomplete => use of V vs. u relationship
(3) Extrapolate the number of quasars for the whole sky NNTotalTotal = NzNz * [SSTotalTotal / S/ S]
(4) Take into account a ratio ρρ for galactic extinction
Problem : ρρ unknown (or evaluated through deep investigation)
NNGaiaGaia = NtNt * ρρ = NzNz * ρ ρ * [SSTotalTotal / S/ S] ratio = 90%, 80%, 70% ?

Redshift accuracy
0 0.5 1 1.5 2 2.5 3z (SDSS)
−0.05
−0.03
−0.01
0.01
0.03
0.05
Del
ta z
(S
DS
S −
2dF
)

How many quasars detected by GAIA ?
Methodology
(1) Isolate a sky zone ZZ of surface SS already surveyed with the highest density
Common SDSS-2QZ zone 11h40mn < α < 14h -2°< δ < +2°
=> ~ 140 square deg. (% 42 150)
Surprise !!!! 5 127 quasars SDSS - 2QZ
- 900 in common
- 831 in SDSS not in 2QZ
- 3426 in 2QZ not in SDSS
+ 2 563 quasars not in SDSS – 2QZ
_____________________________________
7 690 quasars at all.

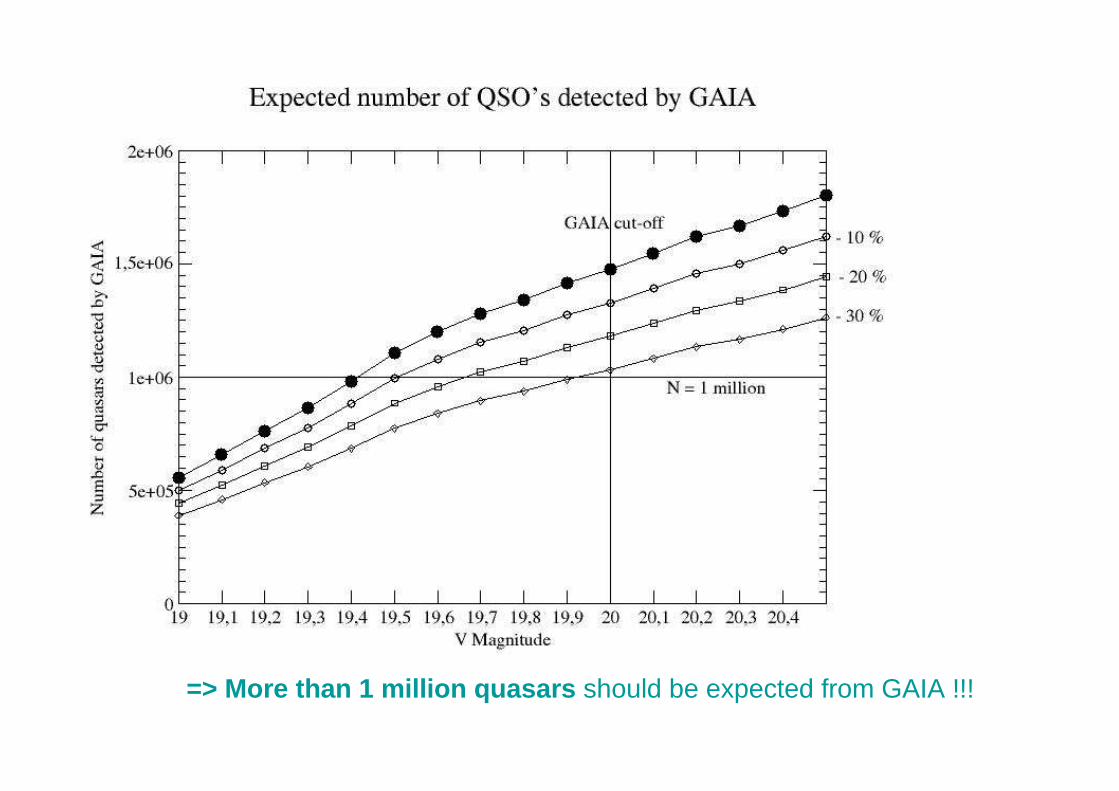
=> More than 1 million quasars should be expected from GAIA !!!

V. Conclusion
http://cias.obspm.fr/fr/activities/details.php?id=97
Atelier EGSG (Extragalactic Science with GAIA)
Meudon , December 2-4, 2013
Org.J.Souchay, B.Rocca,E.Slezak
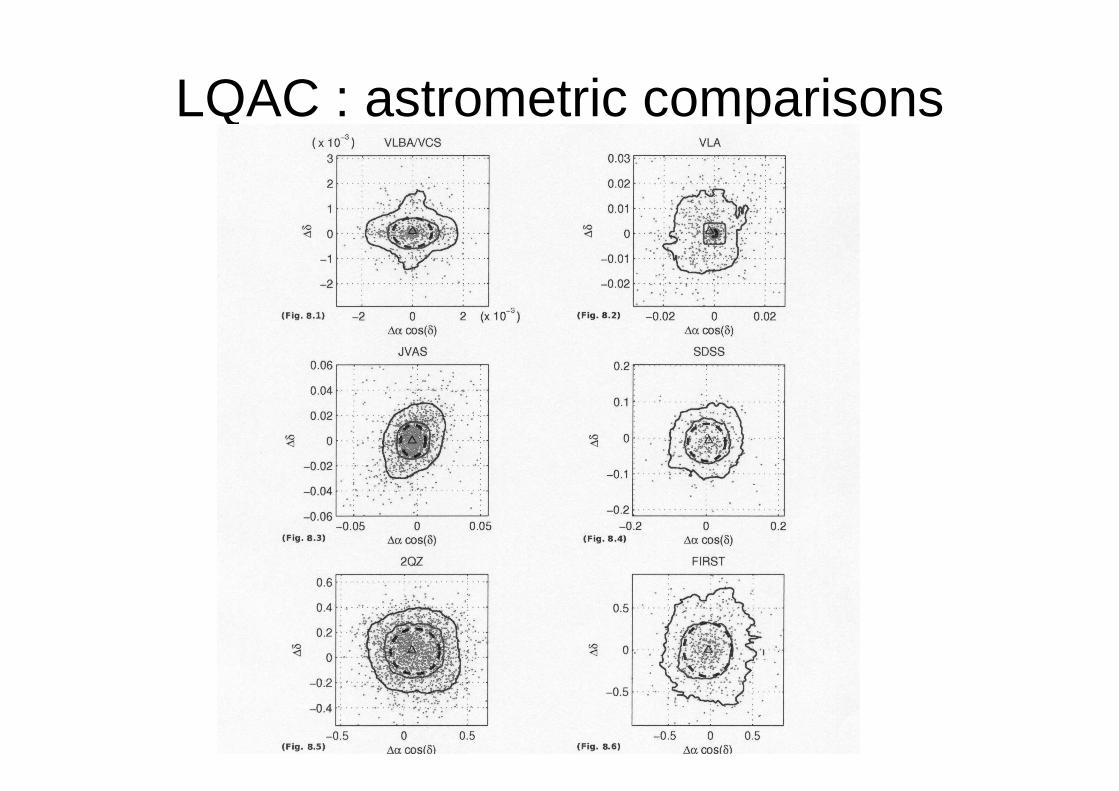
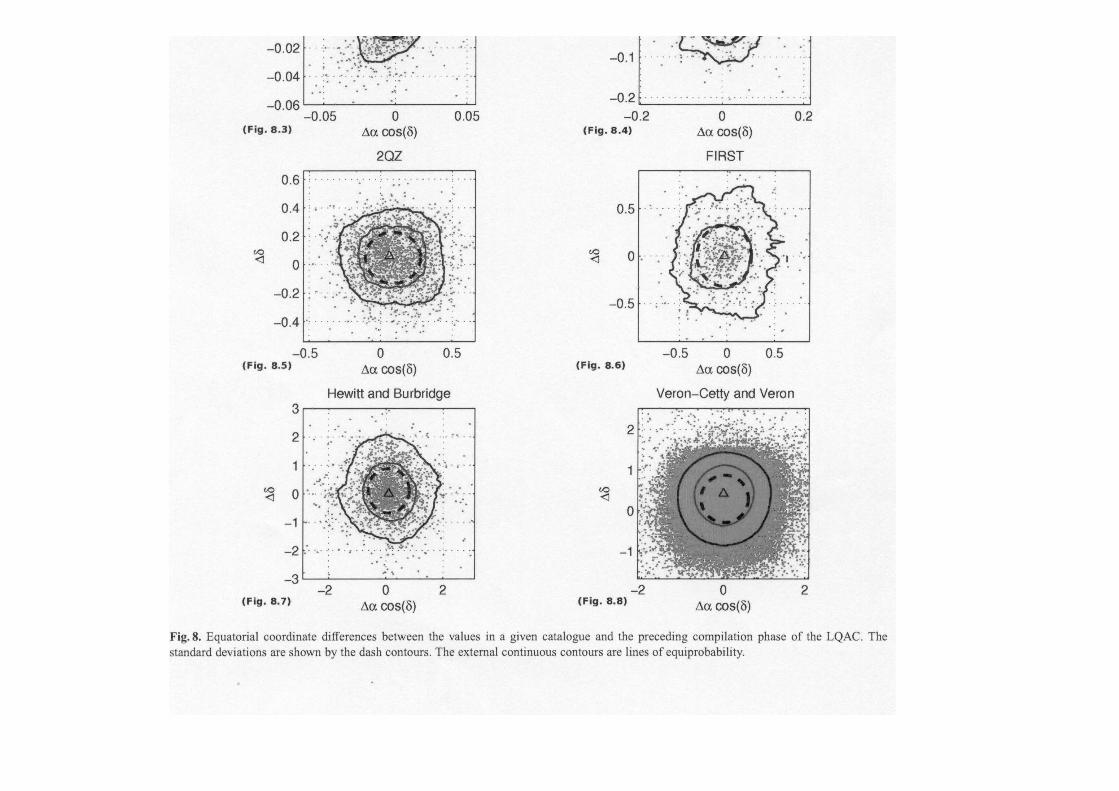
LQAC : astrometric comparisons

Absolute magnitudes
Cosmological parameters and hypothesisFriedmann-Lemaître-Robertson-Walker metrics
Ωk=0, q0=-0.58, H0=72 km/s/Mpc
Use of HST and WMAP experiments for constraints
Ad hoc expression for the luminosity distance DL(z)
M – m = 5 – 5 log DL – A – K
A => galactic extinctionK => K- term related to the effect of redshift at given bandwidth

Luminosity distance & K-correction
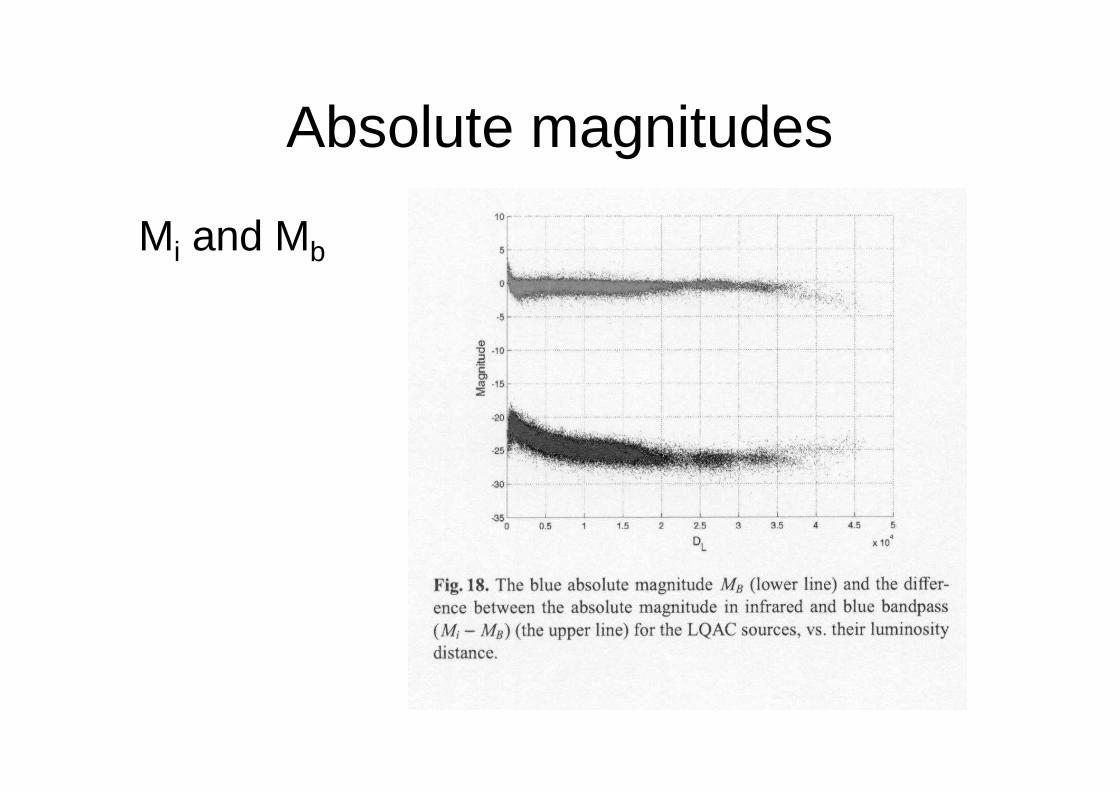
Absolute magnitudes
Mi and Mb
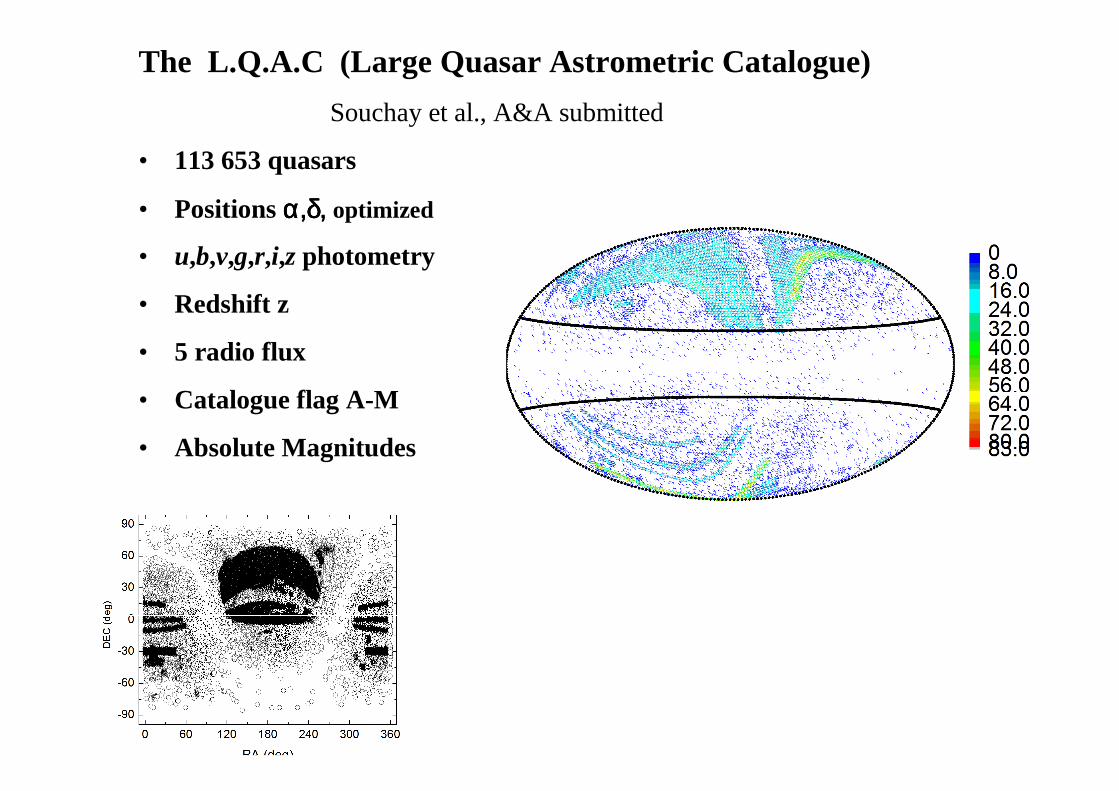
The L.Q.A.C (Large Quasar Astrometric Catalogue)
Souchay et al., A&A submitted
• 113 653 quasars
• Positions α,δα,δα,δα,δ, , , , optimized
• u,b,v,g,r,i,z photometry
• Redshift z
• 5 radio flux
• Catalogue flag A-M
• Absolute Magnitudes
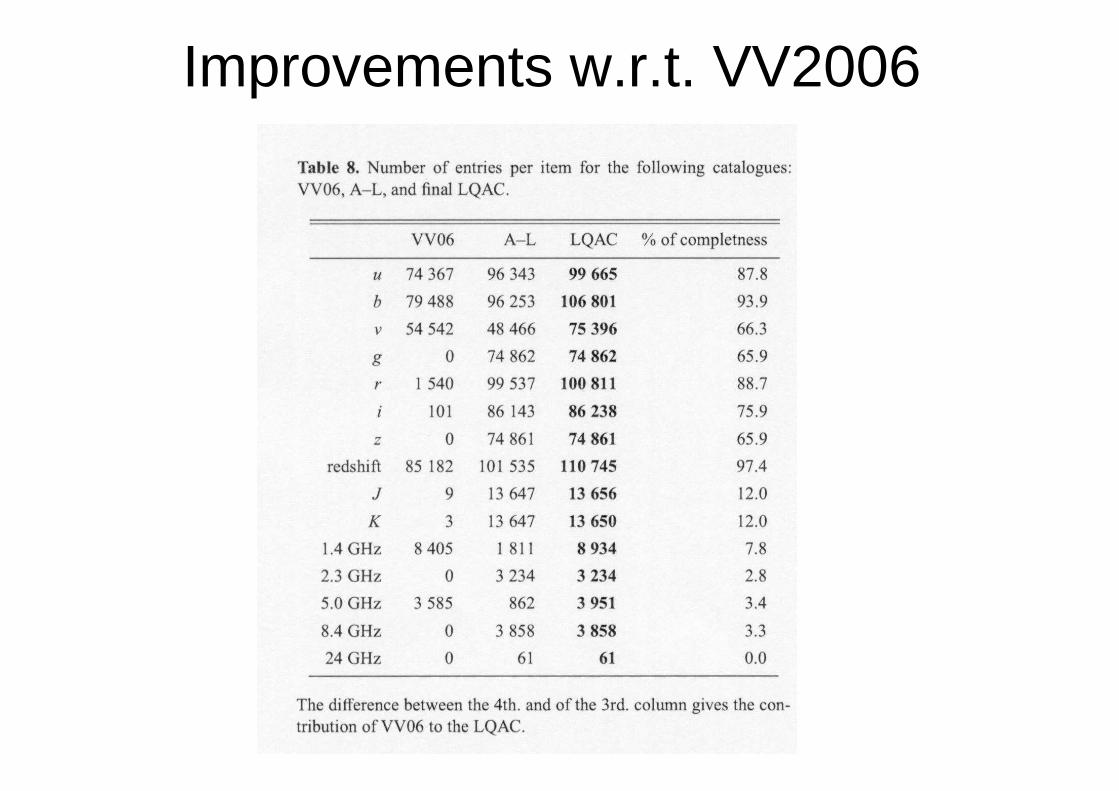
Improvements w.r.t. VV2006

The LQAC-2 (A&A, in prep.)
• Nomenclature
ex. α = +124,567894°, δ = +56,785643°=> 124+56 xx
• ~ 60% more quasars (DR7) (187 504 instead of 113 653)
• Improved celestial coordinates
(LQRF, Andrei et al.,2010)
• Compacity and morphological indexes
(point-like or extended, ellipse, gaussian profile …)
• Statistical tests (density, nearest neighbour etc…)
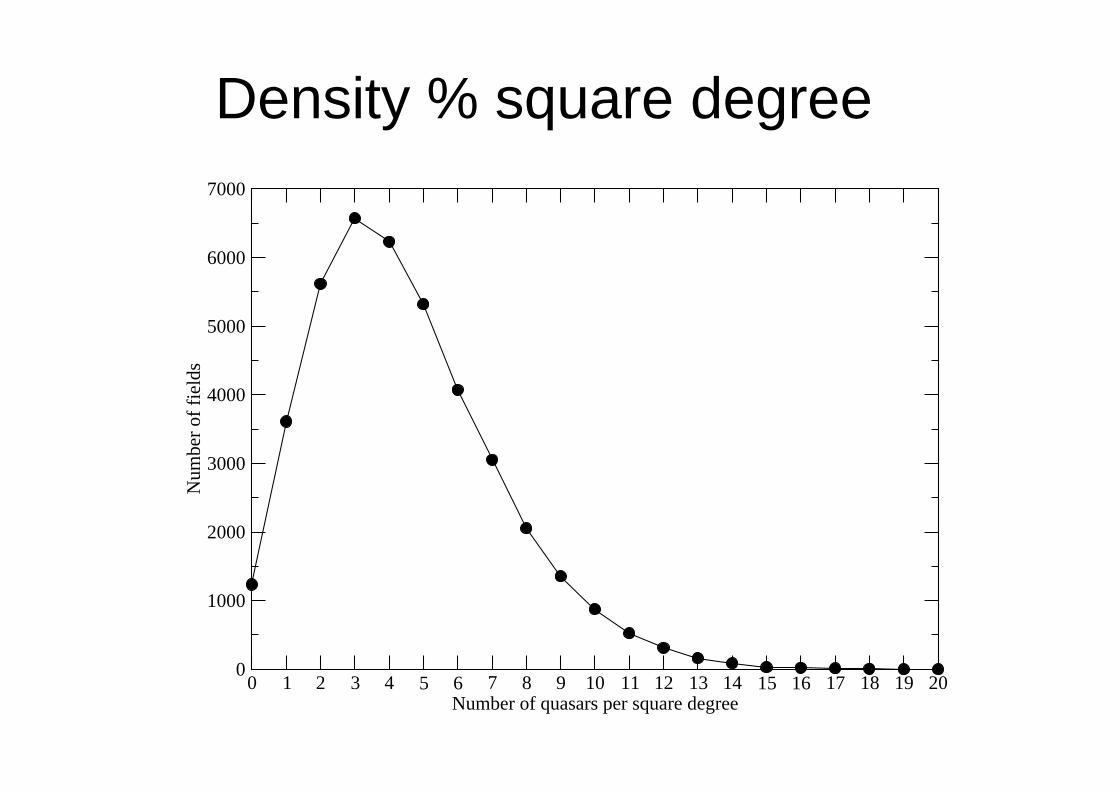
Density % square degree
0 1 2 3 4 5 6 7 8 9 10 11 12 13 1415 16 17 18 19 20Number of quasars per square degree
0
1000
2000
3000
4000
5000
6000
7000N
umbe
r of
fiel
ds
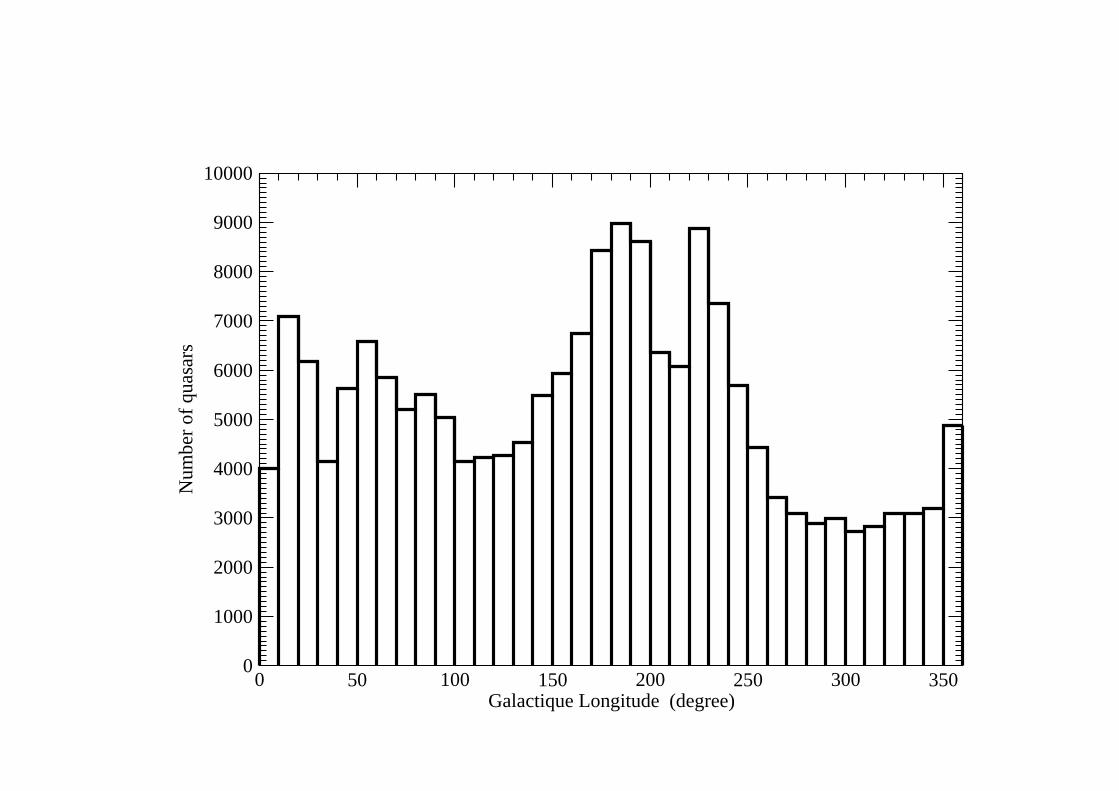
Density % galactic longitude
0 50 100 150 200 250 300 350Galactique Longitude (degree)
0
1000
2000
3000
4000
5000
6000
7000
8000
9000
10000N
umbe
r of
qua
sars
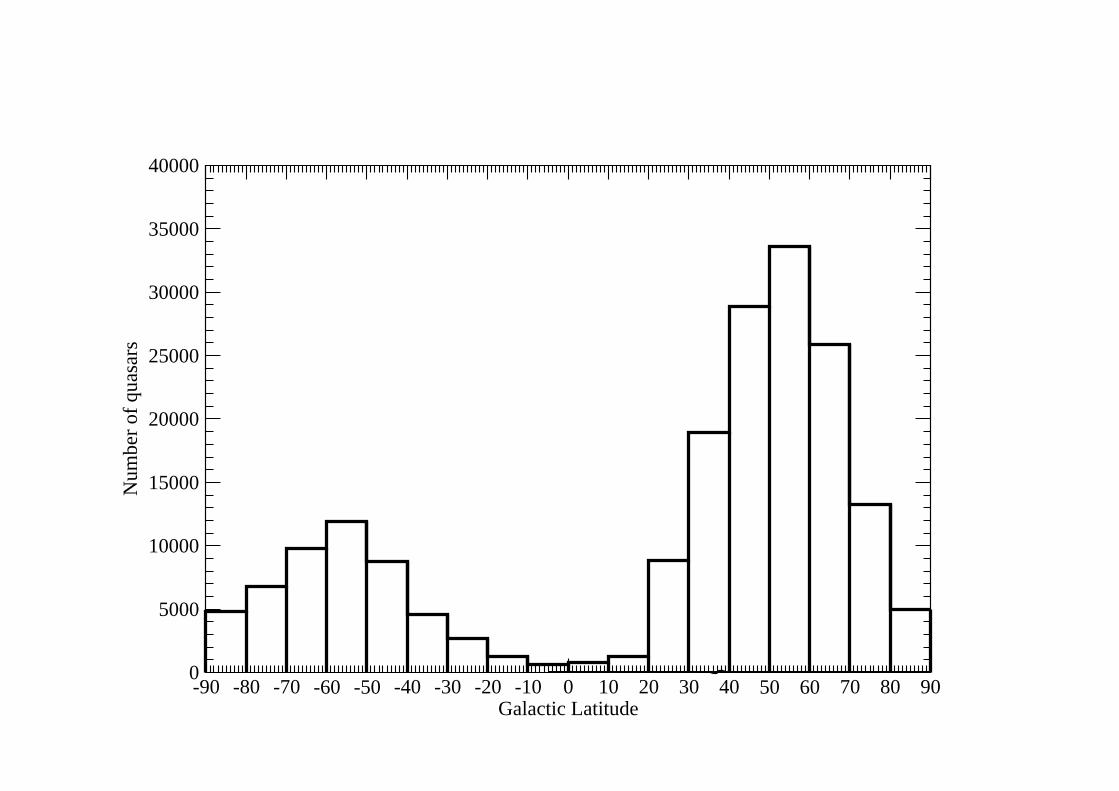
Density % galactic latitude
-90 -80 -70 -60 -50 -40 -30 -20 -10 0 10 20 30 4050 60 70 80 90Galactic Latitude
0
5000
10000
15000
20000
25000
30000
35000
40000
Num
ber
of q
uasa
rs

LQAC quasars, right ascension
0 50 100 150 200 250 300 350Right Ascension (degree)
0
5000
10000
15000N
umbe
r of
qua
sars
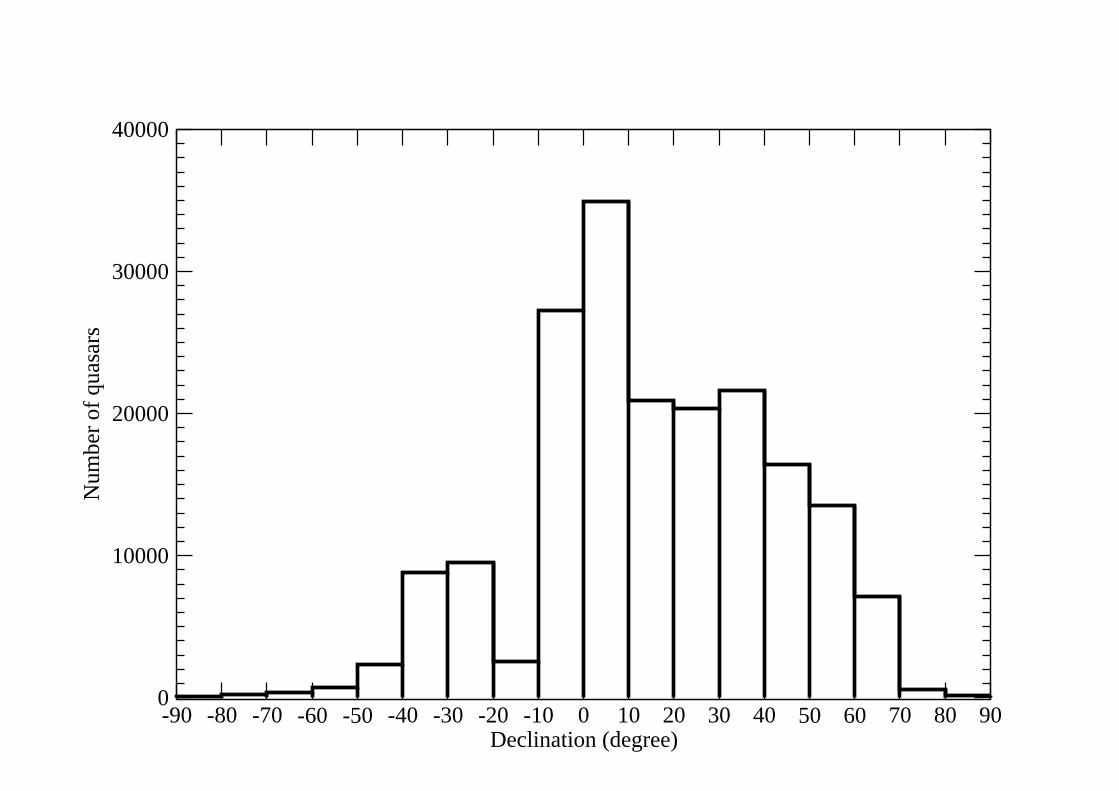
LQAC quasars, declination
-90 -80 -70 -60 -50 -40 -30 -20 -10 0 10 20 30 4050 60 70 80 90Declination (degree)
0
10000
20000
30000
40000
Num
ber
of q
uasa
rs
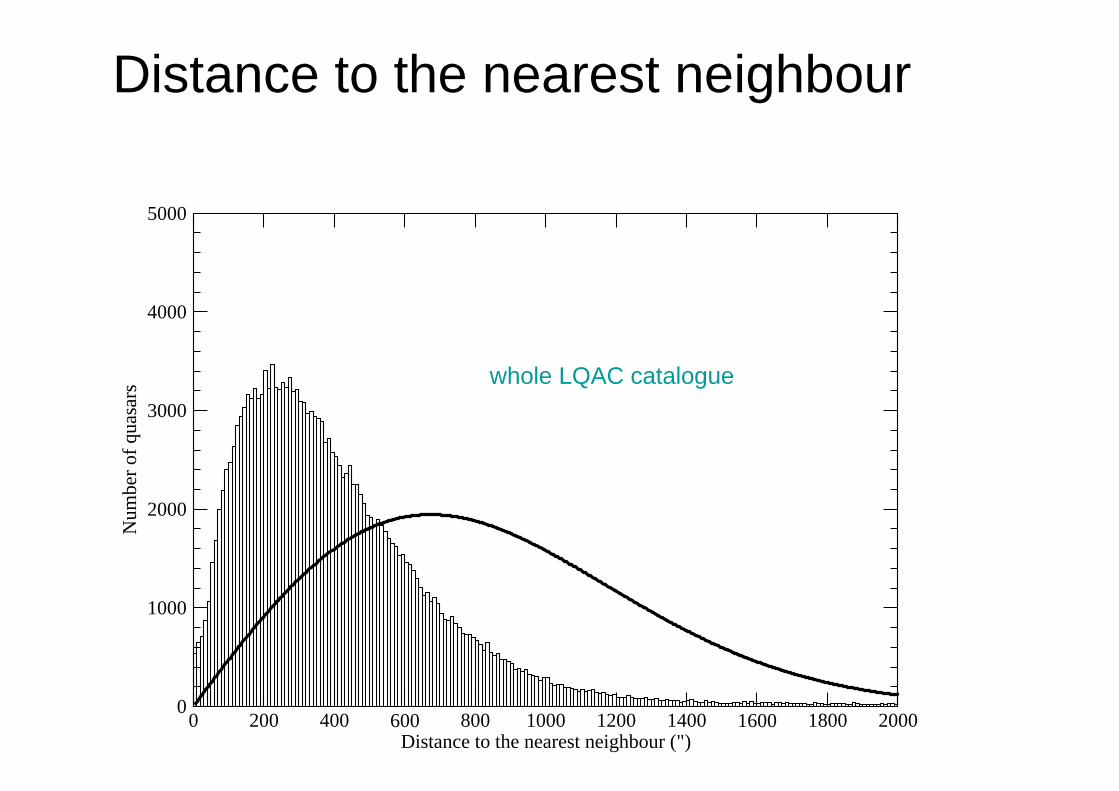
Distance to the nearest neighbour
0 200 400 600 800 1000 1200 1400 1600 1800 2000Distance to the nearest neighbour (")
0
1000
2000
3000
4000
5000
Num
ber
of q
uasa
rs whole LQAC catalogue

Distance to the nearest neighbour
0 200 400 600 800 1000 1200 1400 1600 1800 2000Distance to the nearest neighbour (")
0
500
1000
1500N
umbe
r of
qua
sars
homogeneous selected zone (SDSS)
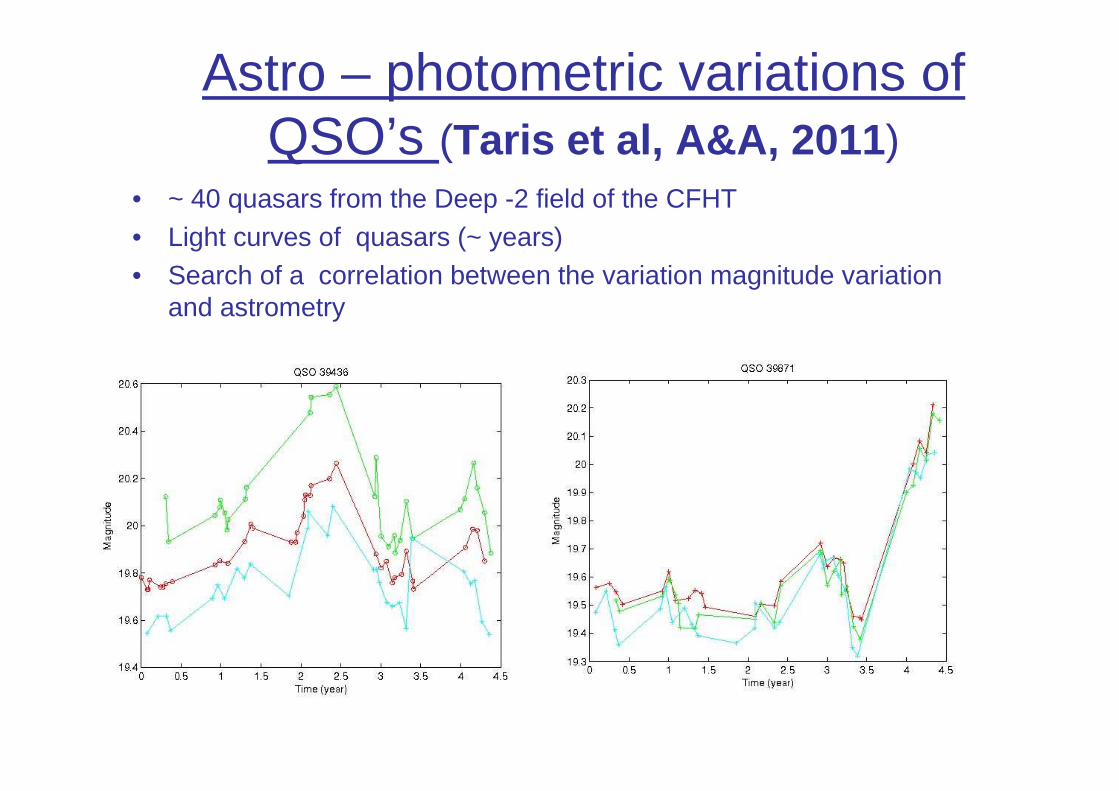
Astro – photometric variations of QSO’s (Taris et al, A&A, 2011 )
• ~ 40 quasars from the Deep -2 field of the CFHT• Light curves of quasars (~ years)• Search of a correlation between the variation magnitude variation
and astrometry

Variations astro-photométriques des QSO’s (suite)
- Chercher une corrélation pour d’autres QSOs du Deep2- Idem pour les champs Deep3/Deep4- Statistique sur un grand nombre de QSOs
Taris et al., A&A, 2011

Search for rapid optical variability in RQQSO’s
• Rabbett et al. (1998) 23 objects=> no evidence for short term variability
• Webb et al. (2000) 23 QSO’s and Seyfert 1 galaxies in various timescales (mn, hr, day, week,month)
=> No evidence for significant optical variablity(> 0.03 mag) for the 77 intranight comparisons
=> fastest significant variations (~ days) consistent withdynamical timescales of black hole accretiion disk
• Gupta and Joshi (2005) 7 RQQSO’s => 3 INOV , 1 doubtful
=> some RQAGN’s INOV ~ 10%=> blazars INOV 100%
• Gayal et al. (2007) 11 RQQSO’s / 19 nights => 2 clear INOV, 2 possible
• Etc….

OV Tools (Topcat) C.Barache

Cross-identification of SDSS/2dF
⇒ Comparison of common data (astrometry, redshifts, photometry)
⇒ Complementarity (photometry)
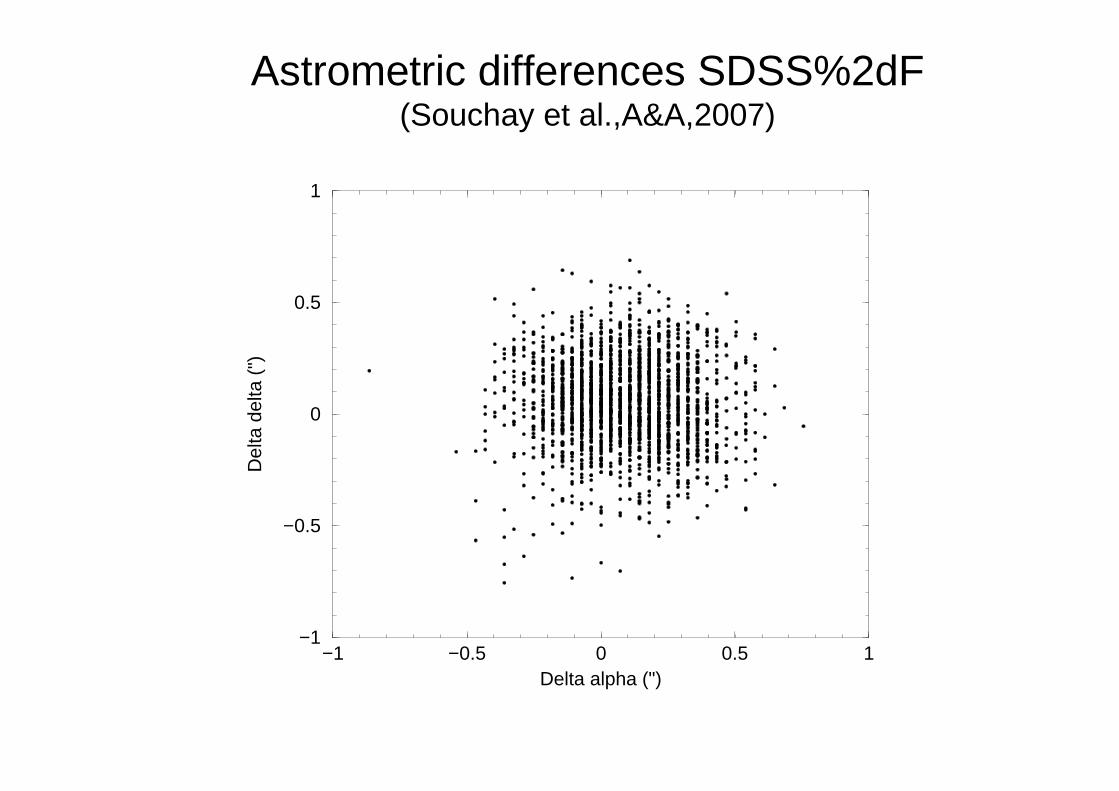
Astrometric differences SDSS%2dF(Souchay et al.,A&A,2007)
−1 −0.5 0 0.5 1Delta alpha (")
−1
−0.5
0
0.5
1
Del
ta d
elta
(")
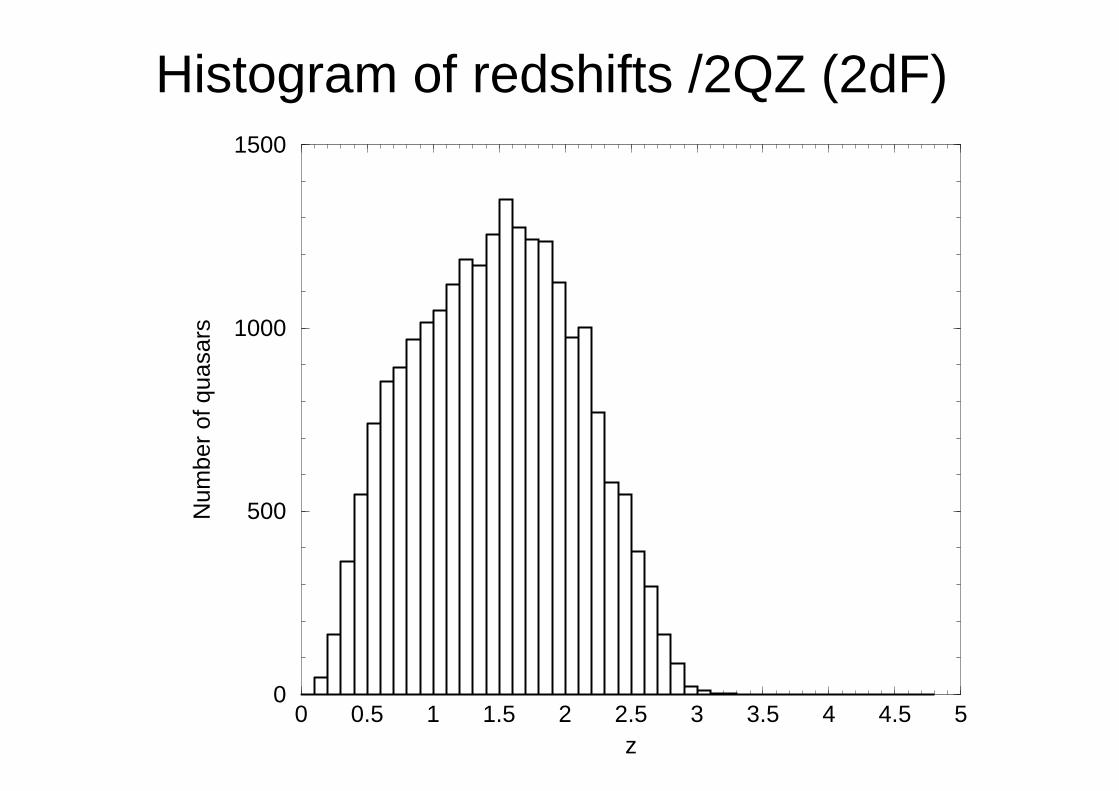
Histogram of redshifts /2QZ (2dF)
0 0.5 1 1.5 2 2.5 3 3.5 4 4.5 5z
0
500
1000
1500
Num
ber
of q
uasa
rs
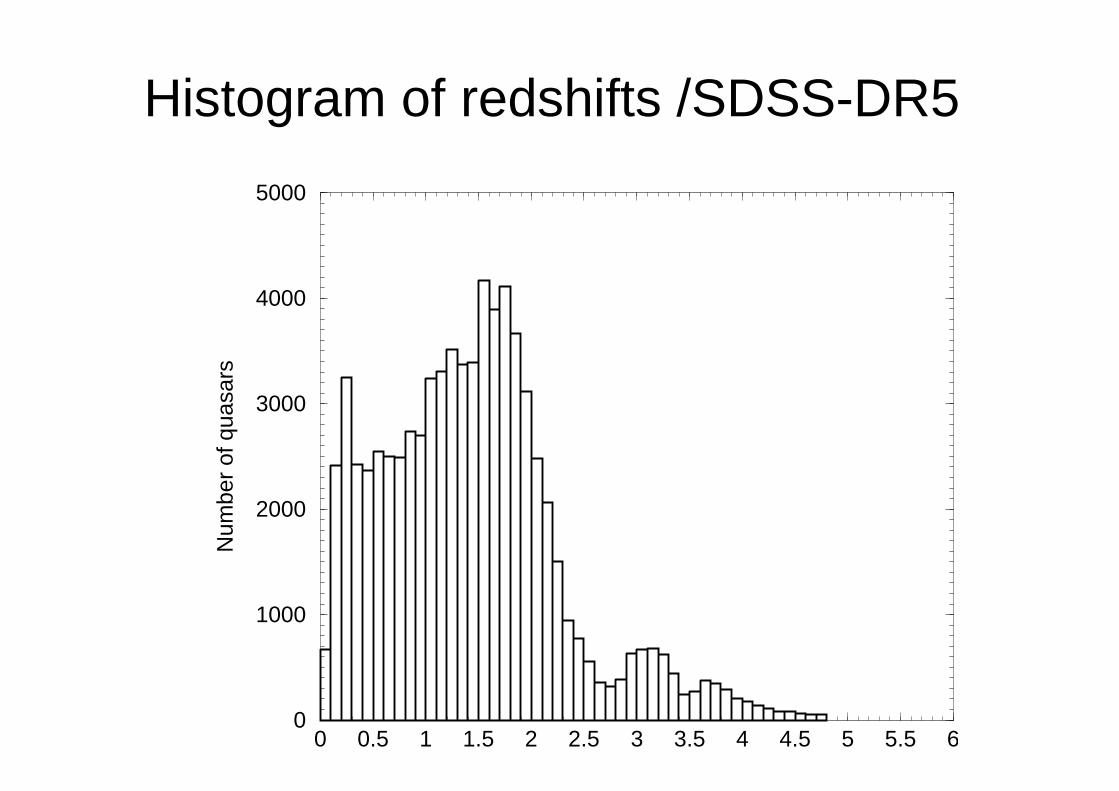
Histogram of redshifts /SDSS-DR5
0 0.5 1 1.5 2 2.5 3 3.5 4 4.5 5 5.5 60
1000
2000
3000
4000
5000N
umbe
r of
qua
sars