the united states after the great recession · where next for the united states after the great...
TRANSCRIPT

Global Economyand Developmentat BROOKINGS
THE UNITED STATES AFTER THE GREAT RECESSION: THE CHALLENGE OF SUSTAINABLE GROWTH
Joshua MeltzerDavid StevenClaire Langley
GLOBAL ECONOMY & DEVELOPMENT
WORKING PAPER 60 | FEBRUARY 2013
Global Economyand Developmentat BROOKINGS

Joshua Meltzer is a fellow in the Global Economy and
Development program at the Brookings Institution and
adjunct professor at The Johns Hopkins University’s
School of Advanced International Studies.
David Steven is a nonresident senior fellow for the
Managing Global Order project in the Foreign Policy
program at the Brookings Institution and a nonresident
senior fellow and associate director of the Center on
International Cooperation at New York University.
Claire Langley is a research analyst in the Global
Economy and Development program at the Brookings
Institution.
Acknowledgments and Author’s Note:
The authors would like to thank Sean Cleary, founder and executive vice-chair of the FutureWorld Foundation.
This paper is a deliverable for the Trilogue Salzburg conference held in August 2012 and is part of a multi-year pro-
gram called Norms for Global Governance. It is also a contribution to the “Geopolitics of Scarcity” project, which is
supported by the John D. and Catherine T. MacArthur Foundation. The authors would also like to thank Katherine
Sierra of the Global Economy and Development program at the Brookings Institution, Charles Roxburgh of the
McKinsey Global Institute, Charles Kenny of the Center for Global Development, Jennifer Morgan of the World
Resources Institute, Elliot Diringer of the Center for Climate and Energy Solutions (C2ES), Homi Kharas of the Global
Economy and Development program at the Brookings Institution, Adele Morris of Climate and Energy Economics at
the Brookings Institution, Bruce Jones of the Managing Global Order project at the Foreign Policy program at the
Brookings Institution, Matthew Kent of River Path Associates and Jane Frewer of River Path Associates.

CONTENTS
Executive Summary . . . . . . . . . . . . . . . . . . . . . . . . . . . . . . . . . . . . . . . . . . . . . . . . . . . . . . . . . . . . . . . . . . . . .1
Introduction: The United States in Turbulent Times . . . . . . . . . . . . . . . . . . . . . . . . . . . . . . . . . . . . . . . . 3
1 . The U .S . Economy: How It Works and What It Delivers . . . . . . . . . . . . . . . . . . . . . . . . . . . . . . . . . . . . 6
Economic Outcomes . . . . . . . . . . . . . . . . . . . . . . . . . . . . . . . . . . . . . . . . . . . . . . . . . . . . . . . . . . . . . . . . 6
Social Outcomes . . . . . . . . . . . . . . . . . . . . . . . . . . . . . . . . . . . . . . . . . . . . . . . . . . . . . . . . . . . . . . . . . . . 9
Environmental Outcomes . . . . . . . . . . . . . . . . . . . . . . . . . . . . . . . . . . . . . . . . . . . . . . . . . . . . . . . . . . . 11
The American Growth Model Under Threat . . . . . . . . . . . . . . . . . . . . . . . . . . . . . . . . . . . . . . . . . . . 14
2 . Where Next for the United States after the Great Recession? . . . . . . . . . . . . . . . . . . . . . . . . . . . . 15
America’s Dynamic Demography . . . . . . . . . . . . . . . . . . . . . . . . . . . . . . . . . . . . . . . . . . . . . . . . . . . . 15
Deepening Political Distrust . . . . . . . . . . . . . . . . . . . . . . . . . . . . . . . . . . . . . . . . . . . . . . . . . . . . . . . . 18
A New Era of Global Leadership . . . . . . . . . . . . . . . . . . . . . . . . . . . . . . . . . . . . . . . . . . . . . . . . . . . . . 20
Scenarios for the Future . . . . . . . . . . . . . . . . . . . . . . . . . . . . . . . . . . . . . . . . . . . . . . . . . . . . . . . . . . . 21
Determining the Future . . . . . . . . . . . . . . . . . . . . . . . . . . . . . . . . . . . . . . . . . . . . . . . . . . . . . . . . . . . . 24
3 . America’s Future Direction . . . . . . . . . . . . . . . . . . . . . . . . . . . . . . . . . . . . . . . . . . . . . . . . . . . . . . . . . . 27
Tackling the Jobs Crisis . . . . . . . . . . . . . . . . . . . . . . . . . . . . . . . . . . . . . . . . . . . . . . . . . . . . . . . . . . . . 27
Investing for Tomorrow . . . . . . . . . . . . . . . . . . . . . . . . . . . . . . . . . . . . . . . . . . . . . . . . . . . . . . . . . . . . 29
Fueling the Future . . . . . . . . . . . . . . . . . . . . . . . . . . . . . . . . . . . . . . . . . . . . . . . . . . . . . . . . . . . . . . . . . 31
Fiscal Rebalancing . . . . . . . . . . . . . . . . . . . . . . . . . . . . . . . . . . . . . . . . . . . . . . . . . . . . . . . . . . . . . . . . 32
Conclusion: Renewing America’s Global Leadership . . . . . . . . . . . . . . . . . . . . . . . . . . . . . . . . . . . . . . . 34
Endnotes . . . . . . . . . . . . . . . . . . . . . . . . . . . . . . . . . . . . . . . . . . . . . . . . . . . . . . . . . . . . . . . . . . . . . . . . . . . . 36
LIST OF FIGURES
Figure 1: GDP Rises, Income Falls, 1975–2011 . . . . . . . . . . . . . . . . . . . . . . . . . . . . . . . . . . . . . . . . . . . . . . . 6
Figure 2: Rapid Growth in Government Debt: Income of the Top 10 Percent, 1940–2012 . . . . . . . . . 8
Figure 3: Wealth Gains Have Been Concentrated among the Richest Families, 2001–10 . . . . . . . . 10
Figure 4: Populations of the Largest Countries: Winners and Losers, 2010–50 . . . . . . . . . . . . . . . . 16
Figure 5: Median Age Projections for Selected Large Countries for the Next 40 Years . . . . . . . . . .17
Figure 6: Confidence in U .S . Institutions Is Declining, 1973–2012 . . . . . . . . . . . . . . . . . . . . . . . . . . . . 19
THE UNITED STATES AFTER THE GREAT RECESSION 1
THE UNITED STATES AFTER THE GREAT RECESSION: THE CHALLENGE OF SUSTAINABLE GROWTH
Joshua MeltzerDavid StevenClaire Langley
EXECUTIVE SUMMARY
“Never before has our nation enjoyed, at once, so
much prosperity and social progress with so little in-
ternal crisis and so few external threats,” President
Clinton argued in January 2000 in his final State of the
Union address.
Despite this optimistic prognostication, the millen-
nial decade was one of profound crisis, with serious
consequences for the United States’ economy and
society, and for the environmental sustainability of the
American dream.
This paper starts from the following assumptions:
• First, though the United States’ economic model has
many strengths, its resilience has been weakened.
Acute economic, social and environmental chal-
lenges will need to be addressed in either the short
or long term.
• Second, the United States’ response to this era of
crisis will be an important factor influencing how
other countries react, given the size of its econ-
omy, its position as a “necessary but not sufficient”
actor on most global issues and its potential for
innovation.
• Third, it is necessary to gain an understanding of the
drivers of and obstacles to change in American soci-
ety to draw conclusions about its response to crisis.
We identify four trajectories (scenarios) the U.S. could
take over the coming decades:
• The United States could continue to try and muddle
through, reacting to the external environment, rather
than trying to shape it.
• It might aggressively focus on going for growth in order
to meet the aspirations of its growing population, with
only limited regard for environmental consequences.
• Alternatively, intelligent design would lead the U.S.
to place greater value on sustainability at national
and global levels, adopting reforms that begin to
push its economy onto a new trajectory.
• Finally, shocks could drive an emergency re-
sponse, as renewed breakdown in global financial
systems, serious conflict or state failure, or a se-
2 GLOBAL ECONOMY AND DEVELOPMENT PROGRAM
ries of extreme weather events dominate the gov-
ernment’s agenda.
All trajectories are plausible, but the intelligent design
scenario is most desirable. This paper makes recom-
mendations that, although challenging to implement,
are politically feasible and if implemented would place
the U.S. growth model on a new sustainable trajec-
tory at an acceptable cost.
To reach this goal this paper focuses on four areas
for action:
• Increasing employment, which is the most ur-
gent priority to accelerate recovery from the Great
Recession, while addressing underlying structural
issues that have led to a decade of poor economic
outcomes for most citizens.
• Investing in the future, as the key marker of whether
the United States is prepared to make farsighted
decisions to improve education, build new infrastruc-
ture and increase innovation.
• Maximizing an increased energy endowment in a way
that grows the economy, while reinforcing the trend
towards reducing resource demand and reducing
greenhouse gas emissions.
• Fiscal rebalancing, where the United States must
insulate economic recovery from the process of fis-
cal reform while reducing and stabilizing debt over
the long term.
Finally, we argue that President Obama can re-en-
ergize America’s global leadership if he builds on a
platform of domestic actions that enhance the sustain-
ability of America’s society and economy.
THE UNITED STATES AFTER THE GREAT RECESSION 3
INTRODUCTION: THE UNITED STATES IN TURBULENT TIMES
In January 2000, President Bill Clinton argued that the
United States had entered the new century from a po-
sition of unparalleled strength. “Never before has our
nation enjoyed, at once, so much prosperity and social
progress with so little internal crisis and so few external
threats,” he said in his final State of the Union address.
“We will make America the safest big country on Earth.
We will pay off our national debt for the first time since
1835. We will bring prosperity to every American com-
munity. We will reverse the course of climate change
and leave a safer, cleaner planet. America will lead the
world toward shared peace and prosperity, and the far
frontiers of science and technology.”1
Despite this optimistic prognostication, the millen-
nial decade was one of profound crisis, with serious
consequences for the United States’ security and
prosperity, and for the sustainability of the American
dream. The dot-com market crashed in March 2000,
the latest in a chain of asset price bubbles that burst
in Japan in 1991 and East Asia in 1997.2 The attacks
of 9/11 drew the United States into expensive and in-
conclusive wars that caused significant damage to its
international reputation.3 In 2007, the property market
collapsed, triggering near-meltdown in the financial
sector, and then a brutal recession saw the median
American family lose 40 percent of its wealth.4
At the end of what he described as “a difficult de-
cade,” President Barack Obama’s State of the Union
address was very different in tone from that given
by President Clinton 10 years earlier.5 He painted
a picture of the economic “devastation” that had
hit ordinary people and their resulting loss of faith
in America’s government, business and media. It
was time, he argued, to start anew and rebuild the
American dream, drawing on the country’s history of
“stubborn resilience in the face of adversity” and the
core ideals and values that had made it strong.
Despite the result of the 2012 election, however,
Americans remain deeply divided over the country’s
future direction. According to a survey of political
values across the past quarter century, partisan di-
vision was fairly stable until 2002, after which it in-
creased rapidly.6 The public is especially split on the
scope and performance of government, the role the
state should play in helping the poor and the need
for regulation to protect the environment.7 These
divisions have shaped the United States’ response
to the financial crisis. In September 2008, the initial
phases of the banking bailout became enmeshed in
the American election, and in the summer of 2011,
fundamental disagreements about government debt
brought the country close to a deliberate default.8 In
recent years, fiscal battles have brought the coun-
try’s politics close to gridlock.9
America is not alone in its lack of direction, of course.
The European Union remains incapable of solving
the euro crisis, leading to expectations that a suppos-
edly “irrevocable” currency union will shrink or could
even disintegrate.10 China and India face significant
headwinds over the coming years, as China is con-
fronted by its own asset bubble and by demographic
decline and India by a combination of political gridlock
and economic slowdown.11 Their recent success has
also brought new challenges, as their middle classes
become increasingly demanding and assertive. At a
global level, globalization’s “long crisis” has exposed
the fragility of the international system.12 The Group
of Twenty (G-20) has failed to emerge as a steering
committee for the global economy, while Rio+20 has
once again demonstrated how little the set piece sum-
mit has to offer.13

4 GLOBAL ECONOMY AND DEVELOPMENT PROGRAM
As governments devote an increasing proportion of
their energy to firefighting short-term crises, longer-
term challenges have been left largely unaddressed.
In 2008, an energy and food price shock coincided
with and contributed to the acute phase of the finan-
cial crisis.14 Commodity markets then crashed before
rebounding sharply and now remain in a volatile state
that is challenging both for producers and consumers
of natural resources. High energy prices have been an
obstacle to recovery in America and Europe, with an
increase in the oil price of $10 per barrel thought to cut
growth in the countries belonging to the Organization
for Economic Cooperation and Development (OECD)
by 0.2 percent.15 Conversely, many energy exporters
are vulnerable to falling prices, with their “fiscal break-
even point” having increased dramatically as they use
subsidies and other transfers to try and dampen politi-
cal unrest. In 2012, due to adverse weather resulting
in drought conditions in the United States, another
food crisis is intensifying, with 60 percent of American
farms experiencing drought in August 2012 and “major
impacts on the production of many field crops this year,
particularly corn, soybeans, sorghum, and hay.”16
Climate change impacts are already being felt in the U.S.
The most recent decade was the nation’s hottest on re-
cord, and temperatures will continue to rise with the next
few decades projected to see another 3.6°C to 7.2°C of
warming in most areas.17 Certain types of weather events
have become more frequent and/or intense, including
heat waves, heavy downpours and, in some regions,
floods and droughts. Sea levels are rising, oceans are
becoming more acidic, and glaciers and Arctic sea ice are
melting. These changes and others yet to come will affect
human health, water supply, agriculture, transportation,
energy and other aspects of society.18
Climate change may have slipped down the interna-
tional agenda, but global greenhouse gas emissions
rebounded much more sharply than expected after the
financial crisis.19 They have now reached the level at
which they would need to peak if the world is to have a
50 percent chance of limiting warming to below 2°C.20
Although many countries now have voluntary commit-
ments to reduce their greenhouse gas emissions, imple-
mentation of a binding agreement to reduce emissions
has been delayed until at least 2020. Other “planetary
boundaries” are also being threatened, with some scien-
tists warning that global ecosystems are on the verge of a
“state change that will be extremely disruptive to civiliza-
tion.”21 A substantial shift is needed in patterns of global
growth if the world is to avoid irreversible environmental
damage, as its urban population grows by another billion
in just 15 years, and, if economies are robust, a further
4 billion people will join the global middle class.22 The
world remains far from any consensus on how to achieve
this shift, despite attempts to focus attention on “green
growth” at the Rio+20 Summit.
Although Americans on both sides of the political di-
vide believe their country should continue to play an
active role in responding to global problems, the na-
ture and direction of American leadership remain con-
troversial. About two-thirds of Americans believe the
country benefits from globalization, but this is below
the average for 25 countries.23 The American public
is also relatively skeptical about international financial
regulation, with a slight majority fearing that a new
regulatory body would make the American economy
less productive (compared with an average of a third in
other countries). Although there is widespread concern
about high commodity prices (especially as they feed
through to the gas pump), improving energy indepen-
dence, principally due to exploitation of shale gas, has
persuaded some policymakers that the United States
can now insulate itself from turbulence in the Gulf and
other energy-producing hotspots.
Support for robust action at a global level to tackle climate
change and other environmental problems is weak, with

THE UNITED STATES AFTER THE GREAT RECESSION 5
only a minority of Republicans believing there is solid evi-
dence that the Earth is getting warmer.24 In the run-up to
the 2012 presidential election, post-tropical storm Sandy
is estimated to have caused $20 billion in damage to New
York, New Jersey and surrounding areas,25 with scientists
arguing that climate change has already increased the
likely frequency and ferocity of extreme weather events
of this sort.26 Although this has increased pressure on
American politicians—a fact acknowledged by President
Obama as he won re-election—it is far from certain that
this will translate into increased international engagement
by the United States.27
The current impasse may be temporary, however.
Whether domestically or internationally, the process of
political change is probably only beginning to gather mo-
mentum. President Obama’s re-election is an anomaly
in a period when incumbent governments have had a
miserable time at the polls, and populist movements and
fringe parties have thrived.28 In the United States, the
Tea Party has attacked the political establishment from
the right, and the Occupy movement has had a similar, if
less far-reaching, impact from the left. The Arab Spring,
itself a reaction to economic stagnation, will continue to
reshape multiple countries, with highly unpredictable
results. Across the world, many countries will experi-
ence further political disruptions, with the next 10 years
likely to be a fertile period for policy innovation. Elites
find themselves broadly discredited, and outsiders will
continue to have unusual opportunities to bring new
ideas—both good and bad—into the mainstream, if they
can make effective and entrepreneurial use of popular
frustration with the status quo.29
This paper represents an initial attempt to understand
the directions this change is likely to take. It is written
with three assumptions:
• First, though the United States’ economic model has
many strengths, its resilience has been weakened.
Acute economic, social and environmental chal-
lenges will need to be addressed in either the short
or the long term. It is currently unclear whether this
will lead to only minor changes to the American eco-
nomic model or to a more significant transformation.
• Second, the United States’ response to this era of
crisis will be an important factor influencing how
other countries react, given the size and influence
of the U.S. economy, its position as a “necessary
but not sufficient” actor on most global issues, and
its potential for technological and social innovation.
• Third, there is little point in expecting the United
States to adopt or advocate policies that run counter
to its interests and values. It is therefore necessary
to understand the drivers of and obstacles to change
in the United States and use them to draw conclu-
sions about the types of solutions that are most likely
to emerge—after an era of crisis.
The paper is divided into three sections. In the first, we
review the evolution of the United States’ economy in
recent decades and the positive and negative effects of
the growth it has provided, with a focus on economic,
social and environmental outcomes.
In the second section, we set out an analysis of the
shifting interests of different groups in American soci-
ety and the structural, institutional and cultural factors
that will inform the process of change. This allows us
to identify four broad scenarios for the evolution of the
United States’ economy, each of which represents a
plausible pathway from the current crisis toward a new
growth model and political settlement.
In the third and final section, we set out policy recom-
mendations that cover the areas of employment, in-
vestment in the future, energy, fiscal rebalancing and
American opportunities for global leadership during
President Obama’s second term.

6 GLOBAL ECONOMY AND DEVELOPMENT PROGRAM
1. THE U.S. ECONOMY: HOW IT WORKS AND WHAT IT DELIVERS
Economic Outcomes
The United States is the world’s foremost economic
power. Since the end of World War II, its economy
has achieved relatively steady growth, low unemploy-
ment and inflation, and rapid advances in technology.
This prosperity underpins American global leadership,
supporting a military that dwarfs its rivals, maintaining
America’s place at the heart of the international sys-
tem, and influencing other countries through trade, in-
vestment, the diffusion of technologies, and the spread
of scientific, economic and legal models.30
In the postwar period, gross domestic product (GDP)
has grown in real terms by an average of 2.9 percent
a year, or 1.7 percent on a per capita basis, with the
economy more than six times larger in 2012 than it was
in 1945 (figure 1).31 Over the long term, the economy
has been highly successful in creating employment,
with an average of 1.3 million new jobs created each
year and an unemployment rate of below 6 percent.32
The average worker is also much better paid, with
mean annual earnings for males having doubled in the
postwar period.33
During this time, the United States has placed a pre-
mium on the role of the private sector as the main driver
of innovation and productivity while constraining the
role of the government in the economy. The American
economy consistently ranks highly when compared with
its competitors and is currently seventh in the World
Economic Forum’s Global Competitiveness Index.34 Its
Figure 1: GDP Rises, Income Falls, 1975-2011
14,000
13,000
12,000
11,000
10,000
9,000
8,000
7,000
6,000
5,000
4,000
60,000
55,000
50,000
45,000
40,000
35,000
30,000
25,000
20,000
1975
1980
1985
1990
1995
2000
2005
2010
1980 recession
1981-82 recession
1990-91 recession
2001 recession
2007-09 recession
Household income
Male income
US GDP
1999 peak: $54,932
2000 peak: $37,017G
DP
2005
$U
S (b
illio
ns)
Median incom
e 2011 $US
Sources: U.S. Bureau of Economic Analysis, U.S. Census Bureau and the National Bureau of Economic Research.

THE UNITED STATES AFTER THE GREAT RECESSION 7
other key strengths are the size of its domestic market,
the flexibility of its labor market, its commitment to in-
novation and the sophistication of its business sector.
Labor productivity, which has grown at an average an-
nual rate of 2.4 percent since World War II, has been un-
derpinned by high levels of research and development.
The United States spends about 3 percent of GDP on
research and development (R&D), about average for
the OECD.35 However, it is home to the world’s best uni-
versities and research institutions, with seven American
universities ranked among the top 10 in 2011, and with
the United States accounting for more than a third of
citations in the world’s science and engineering journals
and registering more than half the world’s patents.36 The
public sector, meanwhile, has invested in breakthrough
R&D, such as through the Defense Advanced Research
Projects Agency, which created the Internet.37 This has
allowed the country to remain at the forefront of sectors
with high growth potential, such as information technol-
ogy, biotechnology, pharmaceuticals, personal services
and renewable energy.38
The economy is highly entrepreneurial, with Americans
more likely to set up new businesses than the citizens
of comparable countries, and workers prepared to re-
locate to seek work.39 The depth and sophistication of
the United States’ financial markets, including its capital
venture sector, provides funding for startups with high
growth potential, where firms that are less than five years
old accounted for almost two-thirds of net jobs created
in 2007.40 Established American companies tend to be
more decentralized than their competitors and more open
to innovation.41 American consumers also appear to be
unusually willing to try new products and services.42
The Great Recession, however, has heightened con-
cerns that the United States’ economic model is failing
to deliver to its full potential. The recession, which be-
gan in December 2007, was the longest and deepest of
the 11 experienced since the war.43 Recovery has been
anemic, with the economy only returning to its prereces-
sion size in the third quarter of 2011.44 Moreover, the
economy faces the following longer-term threats:
• Competitiveness is being eroded. Since 2005, the
United States has experienced the largest drop in
its score on the World Economic Forum’s Global
Competitiveness Index of any country.45 Business
leaders have low levels of trust in the ability of
politicians, government and other institutions to
support growth; believe that regulation places too
great a burden on the private sector; and are con-
cerned about a lack of macroeconomic stability.46
A majority expect American competitiveness to
continue its decline.47
• The economy is struggling to generate sufficient
new jobs. Before 1990, the United States returned
to prerecession levels of employment in an average
of just six months after the recovery was complete.
Since then, however, it has experienced two “jobless
recoveries” (1990, 2001), and it is now in the midst
of a third, with it expected to take up to five years for
employment to recover.48 As a result, long-term un-
employment has been an increasing problem. Only
4 percent of the unemployed had been out of work
for more than a year in 1980. This number had risen
to about 10 percent of total unemployed before the
financial crisis and had reached nearly 30 percent of
the total by 2010.49
• Many workers are not seeing an increase in their earn-
ings. Until 1970, male workers saw their wages in-
crease by about 25 percent per decade.50 Since then,
however, they have done much less well, with real
median earnings now lower than they were 40 years
ago (see Figure 1), a period when the proportion of
men in full-time work shrunk significantly. Poorly edu-
8 GLOBAL ECONOMY AND DEVELOPMENT PROGRAM
cated men have performed especially badly, with men
who failed to complete high school seeing their earn-
ings eroded by 66 percent. Women are more likely to
work and have seen their earnings grow, but this has
not been sufficient to compensate families for the loss
of male earning power. As a result, most households
have become poorer (see below).
• Investment in infrastructure and human capital is
not world class. The United States is ranked 25th
in the world in the World Economic Forum’s index
of quality of overall infrastructure investment.51 The
country needs $2.2 trillion worth of investment in
infrastructure over the next five years, $1.18 tril-
lion of which has not been budgeted.52 School-level
education is at or below the average standards for
the OECD, despite relatively high levels of expen-
ditures per student.53 Publicly funded higher educa-
tion is under pressure, with cuts from both federal
and state budgets. Student debt is a growing prob-
lem, with $956 billion in loans now outstanding.54
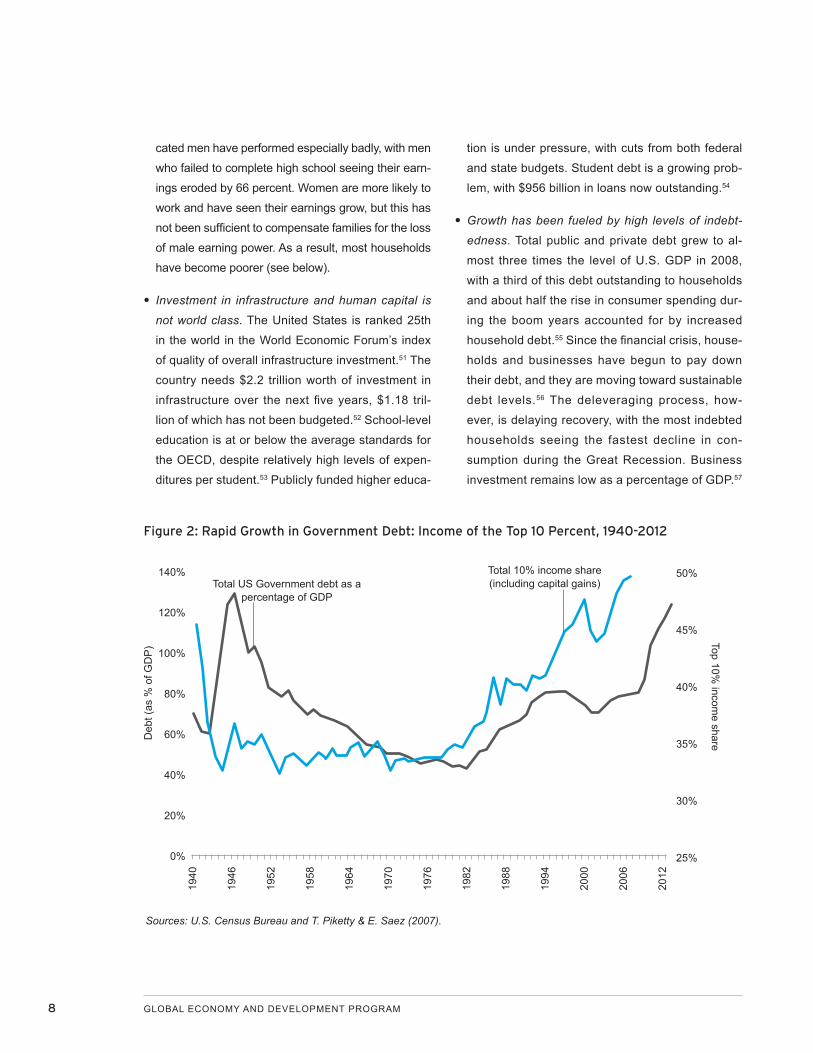
• Growth has been fueled by high levels of indebt-
edness. Total public and private debt grew to al-
most three times the level of U.S. GDP in 2008,
with a third of this debt outstanding to households
and about half the rise in consumer spending dur-
ing the boom years accounted for by increased
household debt.55 Since the financial crisis, house-
holds and businesses have begun to pay down
their debt, and they are moving toward sustainable
debt levels.56 The deleveraging process, how-
ever, is delaying recovery, with the most indebted
households seeing the fastest decline in con-
sumption during the Great Recession. Business
investment remains low as a percentage of GDP.57
Figure 2: Rapid Growth in Government Debt: Income of the Top 10 Percent, 1940-2012
140%
120%
100%
80%
60%
40%
20%
0%
50%
45%
40%
35%
30%
25%
1940
1946
1952
1958
1964
1970
1976
1982
1988
1994
2000
2006
2012
Total US Government debt as a percentage of GDP
Total 10% income share (including capital gains)
Deb
t (as
% o
f GD
P) Top 10%
income share
Sources: U.S. Census Bureau and T. Piketty & E. Saez (2007).

THE UNITED STATES AFTER THE GREAT RECESSION 9
• The United States faces growing fiscal pressures. The
national debt fell throughout the postwar period, before
rising dramatically in two waves (1981–95; 2001–12),
reaching 123 percent of GDP in 2012 (Figure 2).58
Tax cuts and spending increases fueled the debt after
2001, whereas during the recession, this long-term
trend was exacerbated by a loss of tax revenue, an
increase in entitlement spending, and the stimulus
package and bailout, with the debt held by the public
expected to reach 75 percent of GDP in 2013 from 40
percent of GDP in 2007.59 The January 1, 2013 fiscal
agreement included raising income taxes on individu-
als earning over $400,000 and made the rest of the
Bush-era tax cuts permanent. A decision on sequestra-
tion—the mandated cuts in defense and non-defense
spending of $1.2 trillion over ten years—was pushed
back from January 1 to March 1, 2013. These cuts, if
implemented in full, are predicted to cause a contrac-
tion of 0.5 percent of GDP and raise unemployment to
over 9 percent.60
• The United States’ economy is affected by broader
global imbalances. The current account deficit rose
steadily from 1991, peaking at 6 percent of GDP in
2006, but has now fallen to slightly more than 3 percent
of GDP. With Americans saving less than the country’s
investment needs, the counterpoint is trade surpluses
run by countries such as Germany and China, where
consumption levels are low and whose economies
are highly reliant on exports to debtor countries. Ben
Bernanke, chairman of the Federal Reserve, has ar-
gued that a “global savings glut” is an important source
of global financial instability and that, in the medium
term, it can be effectively addressed if countries with
“unsustainable trade surpluses” export less and con-
sume more, whereas countries such as the United
States with “large, persistent trade deficits must find
ways to increase national saving, including putting fis-
cal policies on a more sustainable trajectory.”61 The
sustainability of the trade deficit will depend on ongoing
foreign appetite for American assets.
Social Outcomes
Since World War II, economic growth has delivered
substantial benefits for the American people, who are
richer, healthier and better educated than they were
60 years ago. The average American born today can
expect to live 10 years longer than one born in 1950.62
Literacy levels have reached 99 percent, and 70
percent of Americans who completed high school in
2009 went on to enroll in higher education.63 American
average income is now nearly 8.5 times higher than
postwar levels.64 Moreover, basic needs account for a
decreasing share of the consumption basket, with food
nearly halving its share of disposable income, while
money spent on recreation has more than quadru-
pled.65 In comparative terms, the United States ranks
at the top of the OECD for income and for the quality
and affordability of its housing provision. Americans
also rate their quality of life more highly than the aver-
age for the OECD.66
Not all trends have been positive, however, especially
in recent decades. Median family income shrank for
most Americans between 2001 and 2007, and then
fell significantly between 2007 and 2010.67 Poorer
American families (below the 40th income percentile)
saw their net worth fall consistently throughout the de-
cade, while all but the richest 10 percent saw pre-crisis
gains wiped out by the fall in house prices, leaving
them poorer than at the beginning of the decade.68 For
more than half of American families, in other words,
economic growth is no longer translating into improve-
ments of living standards.
Inequality has risen steeply and is now one of the high-
est in the OECD, second only to Mexico. After taking into
account the redistributive impact of government taxes
and transfer payments, the Gini coefficient for American
disposable income rose from 0.37 in 1979 to 0.49 in
2007.69 Though poor and middle-class Americans have
seen their living standards stagnate in recent years, the

10 GLOBAL ECONOMY AND DEVELOPMENT PROGRAM
top 1 percent earned 20 percent of income in 2010, and
the top 10 percent almost half of all income (Figures 2
and 3).70 Household income is increasingly derived from
capital, rather than from labor (although there were sig-
nificant capital losses during the recession), and capital
income has become steadily more concentrated among
the richest households.
At the same time, economic mobility has been declin-
ing, with fewer people able to move through income
brackets due to ability and hard work.71 By some mea-
sures, the United States is now less mobile than many
countries in Europe. Parental socio-economic status,
for example, is moderately correlated with children’s
educational attainment and income in the United
States.72 Although 84 percent of Americans earn more
than their parents did, Germany and Canada both per-
form better on this indicator.73 Intergenerational mobil-
ity, which appears to have increased until the 1970s,
also fell significantly in the 1980s and has remained
unchanged since then.74
The drivers of inequality and a lack of mobility are
complex.75 Increased competition from trade has
created incentives on businesses to increase their
efficiency and use technology that reduces the need
for low-skilled labor. However, this effect is tem-
pered by the fact that approximately 70 percent of
American imports come from developed countries
with similar wage costs.76 Foreign direct investment
(FDI) and the offshoring of jobs might also have
contributed to inequality, with the OECD finding that
outward foreign direct investment has had some
impact, although mainly on the upper half of the dis-
Figure 3: Wealth Gains Have Been Concentrated among the Richest Families, 2001–10
$1,200
$1,000
$800
$600
$400
$200
$0
Fam
ily n
et w
orth
, 201
0 $U
S (t
hous
ands
)
Less than 20 20-39.9 40-59.9 60-79.9 80-89.9 90-100
■ 2001 ■ 2004 ■ 2007 ■ 2010
Source: Federal Reserve.
THE UNITED STATES AFTER THE GREAT RECESSION 11
tribution.77 Technology has also replaced low-skilled
work and increased the demand for high-skilled
work, driving wage differentials, while immigration
may have also depressed wage costs.
Although these global drivers have an impact on the
U.S. economy’s ability to deliver broad-based social
outcomes, other factors are under national control:
• Poor education outcomes at primary and second-
ary school levels, especially in the worst schools,
have contributed to the decline in mobility, as have
the increasing costs of the university system and
those of elite universities in particular. Students
from wealthier families are much more likely to
attend a four-year college program than their less-
wealthy counterparts, whereas fewer than 10 per-
cent of students at Harvard, Yale and Princeton
receive Pell Grants, a federal scholarship for low-
income students. Education has become less of a
government priority, accounting for 14 percent of
government expenditures in 2008, compared with
23 percent in 1970.78
• Tax and transfer payments have had less of a re-
distributive impact over time.79 The United States is
below the OECD average for the progressivity of its
tax system, and its transfers are relatively modest
and not well targeted.80 Though effective federal
tax rates have fallen for all income groups, richer
Americans now pay a small proportion of a much
larger income in tax.81
• Deregulation of the labor market has also had a
negative impact on the distribution of income, with
the rise in inequality since the 1980s occurring in
tandem with a near halving of the rate of union mem-
bership.82 Deregulation, however, has had a broader
impact on the market, increasing competition, ex-
panding economic activity and creating employment,
which has partially offset the downward pressure on
wages from less-regulated labor markets.83
• The rising cost of housing (34.4 percent of aver-
age household expenditures), especially during
the property bubble, the need to spend more on
personal insurance and pensions (11.2 percent),
and more expensive health care have all placed
pressure on living standards.84 Health care is an
especially pressing problem, with the United States
already spending more than any other OECD
country on health—17.6 percent of GDP in 2010,
as compared with below 12 percent in Canada,
Germany, Australia and the United Kingdom.85
Notwithstanding the recent health care reforms,
health costs as a percentage of GDP are expected
to increase to 34 percent by 2040.86
Unsurprisingly, there are signs of popular discontent
with the American economic system, with only a third
now believing that it delivers fair outcomes for middle-
and working-class citizens.87 Although 68 percent of
Americans say that they have achieved or will achieve
the American dream, the proportion that believes they
are richer than their parents were at a similar age has
fallen 13 percentage points over the past 30 years.88
Fewer than half of parents now expect their children to
enjoy a better standard of living than they did.
Environmental Outcomes
Over the past half century, the United States has made
important progress in its domestic environmental qual-
ity and has led on international environmental chal-
lenges such as depletion of the ozone layer. In the
1960s and 1970s, American progress on the environ-
ment was underpinned by the rise of environmental
movements, which increased awareness about the ef-
fects of economic growth on the environment. Many of
the key American environmental advocacy groups were

12 GLOBAL ECONOMY AND DEVELOPMENT PROGRAM
created then, such as the World Wildlife Fund (1961),
the Environmental Defense Fund (1967) and Friends
of the Earth (1969). In 1969, the president created the
White House Council for Environmental Quality (CEQ)
and, in 1970, the Environmental Protection Agency.89
The Clean Air Act and Clean Water Act were passed in
1970 and 1972, respectively.90
Broadly speaking, American environmental laws and
regulations are guided by the twin goals of protecting
the environment for future generations while interfering
as little as possible with the efficiency and growth of the
economy. All U.S. environmental regulation is subject to
rigorous cost/benefit analysis, where environmental and
human health benefits are quantified and considered
alongside the costs to industry and the broader economy.
The United States pioneered market-based approaches
to delivering environmental improvements, through a se-
ries of experiments that date back to the 1960s.91 A full
cap-and-trade system for regulating sulfur dioxide was
launched in 1990 and has delivered significant reductions
in emissions at a lower cost than a regulatory option and
a quarter of the original government cost estimates.92
Over recent decades:
• Air quality has improved significantly, with reduc-
tions in levels of six common pollutants ranging from
7 percent for 8-hour ozone to 75 percent for annual
SO2 from 1990 to 2010.93
• The Clean Water Act has led to significant increases
in the quality of the water received by households
and has triggered a rapid recovery of heavily pol-
luted urban waterways.94
• The efficiency with which the economy uses re-
sources has also improved steadily. The amount of
energy needed to produce a dollar of GDP (after ad-
justment for inflation) has almost halved since 1980,
although the United States still only ranks 61st in the
world on this measure.95
Internationally, the United States has played an im-
portant role in agreeing to international environmental
treaties such as the 1973 Convention on International
Trade in Endangered Species, the 1987 Montreal
Protocol on Substances that Deplete the Ozone Layer
and the 1989 Basel Convention on the Control of
Transboundary Movements of Hazardous Wastes and
Their Disposal. The basis for American engagement
on these issues reflected a number of drivers, includ-
ing concentrated advocacy by American environmen-
tal organizations and a calculation that the economic
costs of addressing these environmental challenges
would be minimal for the United States and overshad-
owed by the environmental benefits. The benefits of
the Montreal Protocol, for example, were expected to
exceed the costs by a factor of 65, even if the United
States implemented it unilaterally.96 Implementation by
other countries made an already attractive proposition
even more compelling.
Over time, however, the environment has become an
increasingly contentious political issue. In 1992, envi-
ronmental issues were a relatively minor source of par-
tisan division, with large majorities of both Republicans
and Democrats agreeing that stricter laws and regu-
lations were needed to protect the environment.97
Today, the environment is more divisive that any is-
sue apart from the social security net, with Democrats
now twice as likely to favor environmental controls as
Republicans.98
Similar divisions have opened up between the United
States and other countries on global environmental
issues, especially over climate change. In the nego-
tiation of the United Nations Framework Convention
on Climate Change, which was agreed to in 1992 and
entered into force in 1994, the United States stressed

THE UNITED STATES AFTER THE GREAT RECESSION 13
scientific uncertainty and was an early advocate of
taking action on the basis of cost/benefit analysis.99 In
1997, President Bill Clinton signed the Kyoto Protocol
but resolved not to submit it for ratification “until key de-
veloping countries [also] commit to binding targets.”100
President George W. Bush definitively ruled out rati-
fication in 2001, promising instead to “develop tech-
nologies, market incentives and other creative ways to
address global climate change.”101
These divisions complicated American efforts to respond
to future environmental challenges, which include:
• Securing access to resources. The United States
consumes about a quarter of the world’s energy and,
until recently, had experienced a steady erosion of
its energy security.102 All but one of the postwar re-
cessions in the United States has been preceded
by a pronounced increase in the price of crude oil,
and all but one oil market disruption has been fol-
lowed by a recession.103 The Great Recession was
no exception, with food and energy prices peaking
in the summer of 2008 after a long period of de-
cline.104 Recovery has also been hampered by the
resurgence of prices after 2010105 and by uncertainty
about future oil prices.106 Rapid growth in demand
from emerging markets has been the primary driver
of higher and more volatile commodity prices, in-
dicating the potential for increased competition for
resources in both the short and long terms.107
• Tackling climate change. During the past 20 years,
the United States has experienced intense inter-
national pressure to reduce its carbon emissions,
which in 2010 were more than double those of the
European Union on a per capita basis and almost
three times those of China.108 U.S. emissions rose
strongly before the recession but have since fallen,
due to a combination of higher prices, lower growth,
increased use of natural gas and tighter regulations
reducing the competitiveness of coal. Emissions
in 2010 were 6.4 percent lower than in 2005, put-
ting the United States on a trajectory that would
allow it to meet its voluntary commitment under the
Copenhagen Accord (a 17 percent reduction in emis-
sions by 2020, from the same baseline).109 However,
even if all countries meet their Copenhagen com-
mitments, the world will still be on track for warming
at levels well above 2°C, ensuring ongoing interna-
tional pressure on the United States to move toward,
or beyond, its long-term target (an 83 percent reduc-
tion by 2050).110
• Responding to extreme weather events. The United
States has proven relatively vulnerable to extreme
weather events, although China and India face
greater risks (ranking 19 and 22 places, respec-
tively, above the United States on an index based
on fatalities and economic impacts from 1990 to
2009).111 Hurricane Katrina was America’s costliest
natural disaster, and post–tropical storm Sandy has
again shown the vulnerability of coastal cities. The
economic loss from a storm of the same intensity
is estimated to double every 10 years. If the 1926
Great Miami hurricane was to hit again in the 2020s,
it could be expected to cause $500 billion worth of
damage (more than six times the cost of Hurricane
Katrina), or about 3 percent of GDP.112 Drought is
also a significant threat, as was seen during the 2012
heat wave, which has had a global impact on food
security.113 Even before Sandy, more than two-thirds
of the American public believed that global warming
is already affecting weather patterns in the country.114
This anxiety is now likely to have intensified.
• Coping with water stress. The United States is
ranked as “high risk” on the Water Stress Index, al-
though, again, the threats facing China and India are
greater.115 The U.S. Southwest, Southeast and West
all experience chronic water scarcity, due to unsus-

14 GLOBAL ECONOMY AND DEVELOPMENT PROGRAM
tainable patterns of building and economic growth,116
and more than 1,100 counties (one-third of all coun-
ties in the lower 48 U.S. states) will experience a
future high risk of water shortages by midcentury,
with more than 400 of these facing an extremely high
risk of water shortages.117 Temperatures for 2012
through June were the warmest since records began
in 1895, and the drought is the worst in more than 50
years.118 It seems certain to have a significant impact
on world food markets, with the United States’ corn
crop forecast to be the lowest in 14 years and the
U.S. Department of Agriculture predicting cascad-
ing price rises for soybeans, animal feed, meat and
dairy products.119
The American Growth Model Under Threat
As this review has demonstrated, in the postwar period
the United States has had an impressive track record
in delivering economic growth, boosting the living
standards of its citizens, and improving environmental
standards. America now appears to have reached an
inflection point, however, with a significant majority of
its residents believing that the country is heading in the
wrong direction.120
The reasons for their concern are clear. The resilience
of the economy has been challenged by a series of
financial shocks, some starting in the United States
(the dot-com crash and the housing crisis) and some
originating internationally (the East Asian financial cri-
sis and euro crisis), but with an impact on growth in the
United States. Though the U.S. economy has a good
track record in bouncing back from shocks, deleverag-
ing in the wake of the Great Recession has hindered its
most recent recovery.
The failure to deliver rising living standards to the
majority of Americans is not a recent phenomenon,
but until recently it was masked by rising debt and as-
set prices (both mostly tied to residential property).
Americans are currently experiencing an uncharac-
teristic loss of optimism about their country’s ability to
provide opportunities and social mobility for the middle
and working classes, and this has led to anxiety about
the sustainability of the American dream.
Environmental threats, finally, pose a serious threat to
the United States. It currently has a dominant share of
global resource markets, but it will face growing com-
petition from emerging markets and possibly also from
the next wave of developing countries. Climate change
remains the greatest environmental challenge, with the
United States certain to face continued pressure to ac-
celerate the rate at which it lowers its extremely high
per capita greenhouse gas emissions.
There is, moreover, a lack of consensus about how
to address these problems, with intense partisan
divisions over how to respond to the financial cri-
sis, whether and how to tackle economic stagnation
among the middle and working classes, and the role
government should play in tackling environmental
problems. This uncertainty makes the future highly
unpredictable. In section two of this paper, therefore,
we explore the interests, norms and values that will
inform the future evolution of American society, and
the balance it needs to strike between economic
growth, social values and environmental constraints.

THE UNITED STATES AFTER THE GREAT RECESSION 15
2. WHERE NEXT FOR THE UNITED STATES AFTER THE GREAT RECESSION?
“We have involved ourselves in a colossal muddle,
having blundered in the control of a delicate machine,
the working of which we don’t understand,” wrote John
Maynard Keynes in 1930 as the Great Depression
deepened.121 Despite the crisis, however, the human
race had not lost its ingenuity, he believed, nor the
capacity for its members to work together to provide
themselves with higher living standards. The turmoil
of the present would soon pass, Keynes argued, but
only if policymakers avoided mistakes that would drive
them deeper into trouble.
Keynes would find much to recognize in the modern
predicament. The Great Recession has been de-
scribed as the greatest economic challenge the world
has faced since the 1930s.122 More than three years
since the leaders of the G-20 countries met in London
and promised to “restore confidence, growth, and
jobs,” the global economy remains extremely fragile,
with the International Monetary Fund warning that
recovery in the United States remains vulnerable to
“fiscal uncertainty, weakness in the housing market,
and potential spillovers from Europe.”123 The American
economy continues to add jobs, but only at roughly the
same rate as the increase in its labor force, leaving un-
employment rates stubbornly high.124
A crisis often creates a window in which change is pos-
sible. There are, however contrasting visions for the
direction the United States should take.125 Republicans
and Democrats remain divided on the role of govern-
ment, the speed of fiscal retrenchment, the distribu-
tional impact of taxation and transfers, and policies on
energy and the environment. What, then, can be said
about the course the United States will set over the
next 20 years? What impact will it have on patterns of
growth and the quality of life of the American people?
And how will decisions made by the world’s largest
economy have an effect on people from other coun-
tries and on the global environment? This section sets
out some of the drivers that will determine the United
States’ options, based on the norms, interests and val-
ues that ensure its choices are likely to be distinctive
from those made by other countries.
America’s Dynamic Demography
A country’s demography offers a window to its future.
In coming decades, the United States faces a surpris-
ingly positive demographic picture, one that will set
it apart from other developed countries, while posing
fresh challenges to global sustainability.
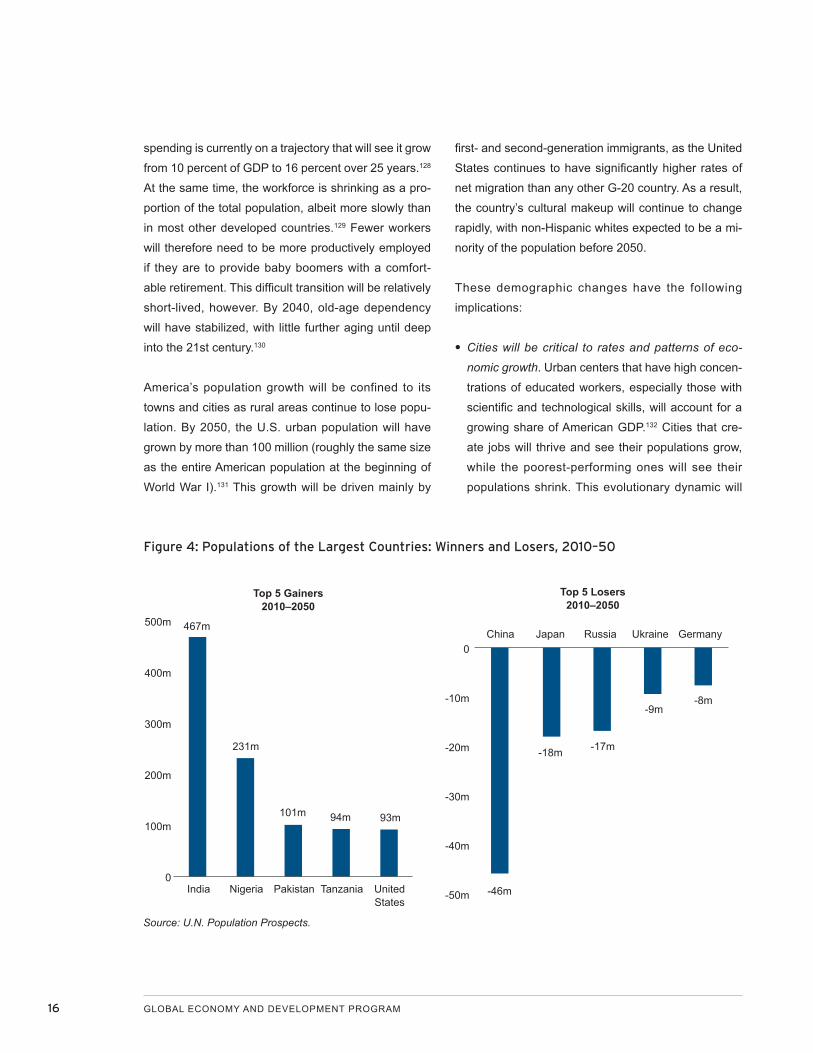
The most striking factor is the continued speed of
American population growth. There are projected to
be more than 400 million Americans by midcentury,
about 90 million above the current level.126 Only India,
Nigeria, Pakistan and Tanzania will gain more people
by 2050 (Figure 4). In contrast, other major powers
(China, Russia, Japan and the European Union) will
see their populations decline. As a result, the United
States will age much less rapidly than many expect
(Figure 5). America’s median age is increasing only
slowly and is expected to be at about 40 years for
much of the century. In contrast, Japan’s median age
will exceed 50 years in 2025, as will Germany’s in
2040. Extraordinarily, on this measure China will be an
older country than the United States before the end of
this decade.
The United States will not be immune to the chal-
lenges of an aging society, of course, especially as
its disproportionately large baby boom generation
(born 1946–64) enters retirement.127 According to
the Congressional Budget Office, health and security
16 GLOBAL ECONOMY AND DEVELOPMENT PROGRAM
spending is currently on a trajectory that will see it grow
from 10 percent of GDP to 16 percent over 25 years.128
At the same time, the workforce is shrinking as a pro-
portion of the total population, albeit more slowly than
in most other developed countries.129 Fewer workers
will therefore need to be more productively employed
if they are to provide baby boomers with a comfort-
able retirement. This difficult transition will be relatively
short-lived, however. By 2040, old-age dependency
will have stabilized, with little further aging until deep
into the 21st century.130
America’s population growth will be confined to its
towns and cities as rural areas continue to lose popu-
lation. By 2050, the U.S. urban population will have
grown by more than 100 million (roughly the same size
as the entire American population at the beginning of
World War I).131 This growth will be driven mainly by
first- and second-generation immigrants, as the United
States continues to have significantly higher rates of
net migration than any other G-20 country. As a result,
the country’s cultural makeup will continue to change
rapidly, with non-Hispanic whites expected to be a mi-
nority of the population before 2050.
These demographic changes have the following
implications:
• Cities will be critical to rates and patterns of eco-
nomic growth. Urban centers that have high concen-
trations of educated workers, especially those with
scientific and technological skills, will account for a
growing share of American GDP.132 Cities that cre-
ate jobs will thrive and see their populations grow,
while the poorest-performing ones will see their
populations shrink. This evolutionary dynamic will
Figure 4: Populations of the Largest Countries: Winners and Losers, 2010–50
500m
400m
300m
200m
100m
0
467m
231m
94m 93m101m
India Nigeria Pakistan Tanzania United States
Source: U.N. Population Prospects.
Top 5 Gainers 2010–2050
Top 5 Losers 2010–2050
-46m
-18m -17m
-9m-8m
0
-10m
-20m
-30m
-40m
-50m
China Japan Russia Ukraine Germany

THE UNITED STATES AFTER THE GREAT RECESSION 17
enhance the ability of the United States to adapt to
new economic forces and to make a smoother exit
from legacy industrial sectors.
• A growing population will consume more. Developed
countries with stable populations can expect demand for
resources to fall, possibly significantly, if efficiency gains
also accelerate. The United States, however, is emphati-
cally not in this group. The U.S. government will be under
significant pressure to provide tens of millions more peo-
ple with high standards of living. Such a large number of
additional American consumers will inevitably have a sig-
nificant impact on the global economy and environment.
• Consumptions patterns may shift. Changes in the con-
figuration of American cities and in the preferences of
city dwellers could have a pronounced impact on con-
sumption patterns. Will American cities become more
densely populated over time and therefore efficient
in their use of resources?133 Will the United States’
long love affair with the automobile begin to dwindle
with the trend continuing whereby young Americans
drive less than previous generations did at the same
age?134 And will there be an ongoing dematerialization
of the economy as consumers switch from physical
goods to virtual services?
Demographic trends will also fuel broader social and
cultural changes. At present, younger generations are
likely to be significantly more progressive than other
voters, although how this translates into political pref-
erences will shift as they age.135 As intergenerational
transfers grow, political friction may increase between
the young and the old, especially as high participation
rates continue to give older voters disproportionate elec-
toral power.136 Climate change could also emerge as a
Figure 5: Median Age Projections for Selected Large Countries for the Next 40 Years
55
50
45
40
35
30
25
202010 2015 2020 2025 2030 2035 2040 2045 2050
Germany
US
China
India
Brazil
Source: U.N. Population Prospects.

18 GLOBAL ECONOMY AND DEVELOPMENT PROGRAM
source of political division, especially as cities continue
to be hit by extreme weather events, or if a growing
proportion of the young become convinced they will see
dangerous levels of climate change within their lifetimes.
A changing ethnic balance will also lead to a political
realignment. Nonwhite ethnic groups are much poorer
than whites, with more than a quarter of Hispanics and
African Americans living in poverty.137 Both groups are
highly aspirational. Although they are much less likely
than whites to believe they have already achieved the
American dream, they are correspondingly more likely to
think they will achieve it in the future.138 They will therefore
continue to value growth, given their wish to secure bet-
ter lifestyles, but only if it delivers broad income gains. At
the same time, however, nonwhites are significantly less
conservative than whites and more likely to support direct
government action to tackle poverty.139 They will also be-
come an increasingly powerful lobby for change if their
aspirations continue to be frustrated.
Deepening Political Distrust
Although demography will drive change in American
society, the country’s political system is likely to con-
tinue to frustrate those who wish to see decisive gov-
ernment action. Polarization in the United States has
been increasing since the 1970s as political extremes
increase their representation in Congress, parties
become more ideologically homogenous, and the dif-
ferences between them become more stark.140 In a
parliamentary system, this might translate into deci-
sive implementation of policy platforms, but the United
States’ separation of powers and the recent dramati-
cally increased use of the filibuster in the Senate make
it much harder for any party to impose its will.141
Polarization may prove especially problematic during
turbulent times, limiting the United States’ ability to re-
spond to unfamiliar challenges. An international review
of the political response to past financial crises shows
that they are more likely to lead to “greater ideologi-
cal polarization in society, greater fractionalization of
the legislative body, and a decrease in the size of the
working majority of the ruling coalition.”142 Coalitions
become smaller, governments weaker, and the op-
position stronger. This pattern seems to be repeating
itself in the wake of the Great Recession, not just in the
United States but also across the Western world.
At the same time, a broader loss of trust in elites is
making it harder to build the consensus needed to
tackle complex challenges. In the run-up to and in
the aftermath of the Great Recession, policymakers,
regulators and financial institutions have been widely
perceived as having failed to protect the public good.
Alan Greenspan, chairman of the Federal Reserve
under four presidents, was lauded as “the maestro”
for his control of the U.S. economy.143 After the finan-
cial crisis, however, he admitted to being reduced to a
“shocked state of disbelief” by the failure of the mar-
ket adequately to manage risk. The Financial Inquiry
Commission, meanwhile, catalogued a series of “dra-
matic failures” in government regulation and corporate
governance.144 It found that government agencies were
“always behind the curve,” both before and during the
crisis. They had allowed the financial system “to race
ahead of our ability to protect it.”
The discrediting of elites is more than a short-term
trend. Confidence has been falling in most major
institutions, often over many decades (Figure 6).
The military is the only institution that a majority
of Americans trust, commanding greater respect
than in the 1970s. Even organized religion is now
trusted by fewer than half of Americans. Confidence
in business is low and has fallen significantly since
the turn of the century, while faith in banks has col-
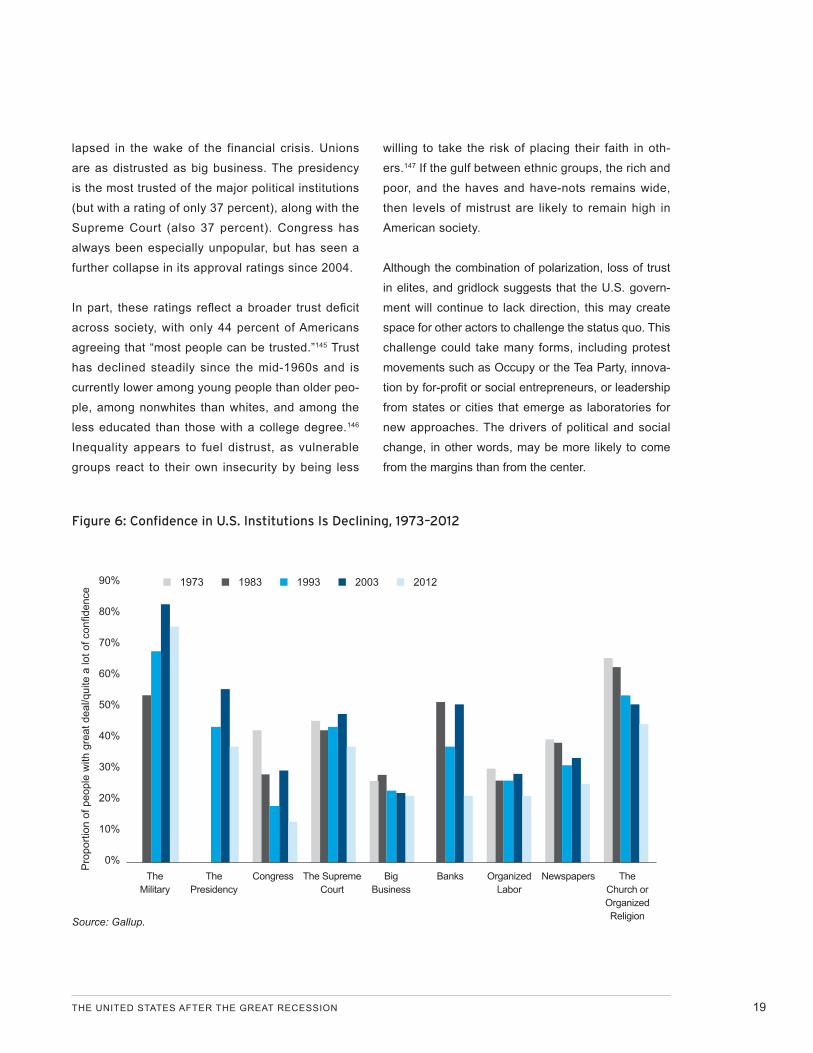
THE UNITED STATES AFTER THE GREAT RECESSION 19
lapsed in the wake of the financial crisis. Unions
are as distrusted as big business. The presidency
is the most trusted of the major political institutions
(but with a rating of only 37 percent), along with the
Supreme Court (also 37 percent). Congress has
always been especially unpopular, but has seen a
further collapse in its approval ratings since 2004.
In part, these ratings reflect a broader trust deficit
across society, with only 44 percent of Americans
agreeing that “most people can be trusted.”145 Trust
has declined steadily since the mid-1960s and is
currently lower among young people than older peo-
ple, among nonwhites than whites, and among the
less educated than those with a college degree.146
Inequality appears to fuel distrust, as vulnerable
groups react to their own insecurity by being less
willing to take the risk of placing their faith in oth-
ers.147 If the gulf between ethnic groups, the rich and
poor, and the haves and have-nots remains wide,
then levels of mistrust are likely to remain high in
American society.
Although the combination of polarization, loss of trust
in elites, and gridlock suggests that the U.S. govern-
ment will continue to lack direction, this may create
space for other actors to challenge the status quo. This
challenge could take many forms, including protest
movements such as Occupy or the Tea Party, innova-
tion by for-profit or social entrepreneurs, or leadership
from states or cities that emerge as laboratories for
new approaches. The drivers of political and social
change, in other words, may be more likely to come
from the margins than from the center.
Figure 6: Confidence in U .S . Institutions Is Declining, 1973–2012
The Military
The Presidency
Congress The Supreme Court
Big Business
Banks Organized Labor
Newspapers The Church or Organized Religion
90%
80%
70%
60%
50%
40%
30%
20%
10%
0%Pro
porti
on o
f peo
ple
with
gre
at d
eal/q
uite
a lo
t of c
onfid
ence
■ 1973 ■ 1983 ■ 1993 ■ 2003 ■ 2012
Source: Gallup.

20 GLOBAL ECONOMY AND DEVELOPMENT PROGRAM
A New Era of Global Leadership
Although the United States is certain to face head-
winds in the coming decades, this does not mean that
its stance will be a pessimistic one. Though fears of
American decline will continue to surface, a more con-
fident narrative is likely to predominate at most times.
Even during the crisis, a slim majority of Americans
remained optimistic about the country’s future over
the next 50 years.148 At the ballot box, meanwhile, they
consistently reward optimistic politicians over negative
ones.149 A blind analysis of the speeches of presidential
candidates between 1900 and 1984* showed that the
candidate who sounded least pessimistic was elected
on 80 percent of occasions, creating strong incentives
for politicians to emphasize the potential for renewed
American leadership.
At the same time, the United States will be able to
draw on enduring absolute geopolitical strengths, even
if its relative power continues to diminish due to the
economic success of rising powers. It will continue to
benefit from:
• Its position as a dominant security actor, which it
seems certain to maintain for at least another gen-
eration, and its privileged position in most global
institutions.150
• Its internal security, which is more robust than that of
countries such as India (currently tackling a Naxalite
insurgency in 125 of its 640 districts)151 or China (re-
ported to be spending as much on domestic security
as it does on defense).152
• Its growth potential, especially when compared with
the EU, but more generally if it manages to use its
leadership in key export sectors to exploit the pur-
chasing power of a growing global middle class153 or
if one or more of the emerging economies suffers an
interruption to its growth.
Energy is set to become an additional source of
American leadership. High prices send powerful mar-
ket signals, as was last seen during the energy crisis of
the 1970s, which led to both rapid increases in energy
efficiency and a substantial growth in supply.154 On
the demand side, a similar shift in American demand
is under way today in response to the price shocks of
the past five years155 and to government-mandated im-
provements in vehicle fuel efficiency standards that are
expected to reduce U.S. CO2 emissions by 4.7 billion
metric tons by 2025.156 As a result, despite population
growth, the U.S. Energy Information Administration
expects growth in energy use to slow to 0.3 percent
per year between 2010 and 2035, with per capita con-
sumption falling 0.6 percent in that period.157
The supply response has been even stronger. As prices
have risen, global investment in development has grown
sharply. According to Barclays Capital, oil and gas com-
panies are expected to spend nearly $600 billion on ex-
ploration and production in 2012, a 10 percent increase
on 2011 and more than double the level of six years
previously, with investment increasingly directed toward
unconventional and deep water oil and gas.158 This in-
vestment is expected to bring significant new production
on stream, with the United States one of five countries
that account for slightly under two-thirds of the new devel-
opment. American unconventional oil is now estimated to
be profitable when the West Texas Intermediate bench-
mark for oil is at $55 to $65 per barrel (it has been above
this level for most of the past five years).159
The prospects for natural gas have been funda-
mentally transformed, in what has been described
by one analyst as the “the greatest revolution in the
United States energy landscape since the Second
* Zullow, H. M. & Seligman, M. E. P. (1990). Pessimistic rumination predicts defeat of presidential candidates, 1900–1984. Psychological Inquiry, 1(1), 52-61.

THE UNITED STATES AFTER THE GREAT RECESSION 21
World War.”160 Until recently, the United States was
expecting to become increasingly dependent on im-
ported gas, with Alan Greenspan warning the House
of Representative’s Committee on Energy and
Commerce that “earlier periods of relative [gas] abun-
dance and low prices” were probably over, and that
the United States should increase liquefied natural gas
imports in order to reduce domestic price volatility.161
As late as 2006, the International Energy Agency (IEA)
predicted that growth in production in the gas sec-
tor would be driven by the Middle East and Africa.162
However, U.S. reserves have grown by about 70 per-
cent during the past decade.163 Production increased
by a factor of four between 2007 and 2010, with a gas
glut leading to a substantial reduction in prices and to a
growing gap between the cost of gas in North America
and the price paid in Europe or Asia.164
Although energy will provide a geopolitical boost for
the United States, the environmental consequences
of these rapid changes to the energy sector remain
hard to predict. Global demand for energy is still
expected to grow rapidly, despite gains in energy
efficiency, whereas the diffusion of new techniques
for extracting unconventional oil and gas will see a
growth in estimates of remaining reserves of fos-
sil fuels. The trajectory of emissions will depend on
the quantity of “new carbon” that is successfully ex-
tracted, its price, and whether the energy source it
replaces has higher (coal) or lower (nuclear, renew-
ables) emissions. Pressure on United States’ emis-
sions is likely to be downward, especially if combined
with regulation (limiting coal, supporting renewables)
and a carbon price.165 At a global level, however, this
could be offset by increased exports of American
coal and by lower than expected energy prices. The
IEA has modeled a “golden age of gas” and finds a
marginal impact on emissions, leaving the world on
a trajectory toward a 3.5°C increase in temperatures,
even before additional supplies of unconventional oil
are factored into the mix.
Overall, it seems highly likely that the United States will
continue to play an assertive global role, supported by
a public that overwhelmingly believes that it is best for
the United States to be active in global affairs.166 This,
however, is equally unlikely to translate into a willing-
ness to see American sovereignty constrained by inter-
national agreements, especially in contentious areas
such as the environment. Formal treaties, meanwhile,
will prove almost impossible to ratify, as can be seen
by the fate of the relatively anodyne United Nations
Convention on the Law of the Sea, which remains far
from Senate ratification even after 20 years,167 and the
recent failure in the Senate of a United Nations treaty
banning discrimination against people with disabili-
ties.168 In a partisan age and where appeals to sover-
eignty still have political salience, gaining the support
of two-thirds of the Senate to pass a treaty poses an
almost insurmountable obstacle. If the United States
is to contribute to international action on global chal-
lenges, it will seldom be via this formal route.
Moreover, the United States is likely to use its leader-
ship to enhance its growth prospects, given the speed
with which its population continues to grow. This is
likely to bring it into conflict with those who believe that
it needs to shift to a much less resource-intensive eco-
nomic trajectory. Given the choice between fast growth
and green growth, the United States remains likely to
favor the former over the latter.
Scenarios for the Future
In the run-up to Rio+20, the High-Level Panel on
Global Sustainability set out a plan of “global action …
to enable people, markets and governments to make
sustainable choices.”169 The priorities for the future,
22 GLOBAL ECONOMY AND DEVELOPMENT PROGRAM
the panel argued, were “to eradicate poverty, reduce
inequality and make growth inclusive, and production
and consumption more sustainable, while combating
climate change and respecting a range of other plan-
etary boundaries.” It called on all countries to adopt a
strategy for sustainable development and to measure
the implementation of this strategy through a set of
goals that would reflect equally “the economic, social
and environmental dimensions of sustainable develop-
ment and the interconnections between them.”
A vision of this kind has no chance of adoption in the
United States. In this paper, we have argued that there
are powerful reasons for the United States to address
threats to its current growth model, given the vulner-
ability of the current model to shocks, the failure of the
American dream to deliver for a growing proportion of
citizens, and the seriousness of climate change and
other environmental challenges. However, we have also
demonstrated that change will not be easy to achieve
and will almost certainly not follow the pathway sug-
gested by those who wish to see a substantial shift
from growth to equity and environmental protection.
American leaders are elected by a growing population
that places a high value on prosperity. They are unlikely
to be returned to office if they fail to deliver economic
success, nor will they be rewarded at the ballot box if
they are seen as being insufficiently assertive in ad-
vancing American interests on the international stage.
Change to the American system may be needed, but
the approach recommended by the United Nations
and endorsed at Rio+20 has little appeal to either the
American public or its elite. Many Americans remain
strongly resistant to any role for the international sys-
tem in regulating or restraining American growth. If
anything, this hostility is growing. Agenda 21, a vol-
untary action plan agreed to at the first Rio summit
in 1992, was denounced at the Republican National
Committee in 2012 in a resolution that condemned
“extreme environmentalism, social engineering, and
global political control” that was inherently hostile to
the American way of life.170
American policymakers therefore face a paradox. On
the one hand, the need for—and perhaps also the
demand for—a new growth model is strong. On the
other hand, the obstacles to its creation are daunting.
Although predicting the future is an invidious task, es-
pecially when levels of global uncertainty are so high
and American politics is so finely divided, we see four
broad scenarios that could result from the interplay of
these contrasting forces.
• Scenario 1: Muddle Through. This scenario sees a
continuation of business-as-usual, with a slight re-
balancing of growth from the richest Americans to
the middle classes, as a result of a combination of
recovery, growth in high-value exports and an in-
crease in income taxes for higher earners. A period
of high energy prices stimulates significant gains in
energy efficiency, but also sees the United States
emerge as a major producer of unconventional
oil as well as unconventional gas. This increases
American energy security, but carbon emissions are
only reduced slowly, as cheaper energy prices stim-
ulate demand and reduce the competitiveness of re-
newables. Pressure is placed on China and India to
discover and develop their own unconventional car-
bon reserves, with an inevitable impact on climate
trajectories. Policymakers increasingly focus on ad-
aptation to climate impacts and on geo-engineering
as a potential route to reducing atmospheric con-
centrations of greenhouse gases.171 Internationally,
levels of trust and cooperation between major pow-
ers is low, while a growing number of countries face
powerful protest movements from both ends of the
political spectrum.
THE UNITED STATES AFTER THE GREAT RECESSION 23
• Scenario 2: Going for Growth. This scenario builds on
scenario 1 but assumes a singular focus on growing
the economy. Unconventional oil and shale gas are
rapidly exploited and often exported, with lower energy
prices boosting the economy. Domestic coal demand
continues to fall, but low-cost coal is sold aggressively
to emerging markets. Consumption remains a key
driver of economic growth, which is rapid but unevenly
distributed, with some metropolitan areas prospering
and others experiencing a steep decline in their wealth
and population. The labor market performs strongly,
but it does not generate the jobs needed to reduce
income inequality. Economic mobility also remains low,
but, on the whole, urban voters continue to support
“growth first” politics. American greenhouse gas emis-
sions fall, but only slowly, while its coal exports boost
emissions in other countries. Declining federal govern-
ment support for renewable energy means that gas
does not become a bridging fuel to zero-carbon energy
sources. American resilience to risk is strengthened by
an improved fiscal position, but increased resources—
diplomatic, military and economic—are used to react
to, rather than manage, crises, both overseas and at
home. America leads still, but in a highly competitive
and often fractious world.
• Scenario 3: Intelligent Design. This scenario is also
consistent with strong levels of economic growth
but includes a more deliberate attempt to reinforce
positive trends, restrain negative ones and increase
American resilience to a range of risks. Successive
presidents focus on employment through renewed
public investment in education and training, addi-
tional support for sectors with high export potential,
and innovative approaches to regulation, especially
in the financial sector. The Federal Reserve places
greater emphasis on its mandate to maximize em-
ployment, alongside its current focus on interest
rates and price stability.172 In the energy sector, the
government takes a strategic approach to maximiz-
ing the country’s new opportunities, with policies to
maximize the potential of gas to reduce emissions
(e.g., use in transportation) and some contribu-
tion from the energy sector to fiscal consolidation
(through reduced fossil fuel subsidies and an in-
creased use of taxation or market instruments).173
None of these measures are especially dramatic,
but taken together they have a measurable impact
on sustainability and allow the United States to
provide somewhat increased levels of leadership
internationally. As a result, geopolitical outcomes are
more cooperative, with some innovations in global
governance, even though important stresses remain
unaddressed.174
• Scenario 4: Emergency Response. Policy is driven
in unpredictable directions by a series of shocks,
such as a further breakdown in global financial sys-
tems, serious conflict or state failure, or a series of
extreme weather events or clear evidence of disrup-
tive climate change. In response to one or more of
these shocks, the United States becomes a highly
directive actor as it mobilizes what it perceives to
be an urgent threat to its security. At a global level,
net economic impact is negative, possibly strongly
so, as growth slows in a number of countries. The
impact on sustainability is hard to predict. It is most
likely to be positive if an environmental shock trig-
gers the crisis, although even then outcomes will
be highly dependent on the timing of the event and
the extent to which appropriate technologies are
primed for rapid diffusion. The impact on geopolitics
will also be mixed, especially if the world divides
into victims and villains (with the United States on
either side) and if coercive measures (e.g., trade
sanctions) are used to deliver change. This sce-
nario becomes an increasingly likely successor to
the previous scenarios, assuming that patterns of
growth take the world further outside the “safe op-
erating space for humanity.”175

24 GLOBAL ECONOMY AND DEVELOPMENT PROGRAM
Determining the Future
These scenarios have very different probabilities of be-
ing realized. In the short term, muddle through is the
most plausible course of action for the United States
at the national level at least. Pockets of innovation
will be found at state and metropolitan levels, and in
the private sector, of course, but they are unlikely to
have a decisive impact, given opposing trends in other
states and business sectors. Fiscal tightening is likely
to reduce space for the adoption of new policies, while
any restriction on growth in existing industries will be
strongly resisted while unemployment levels remain
high. In his second term, President Obama may find
that the rewards for United States’ leadership are likely
to be low, a product of an unsettled and often chaotic
international environment. Increased strategic compe-
tition between the United States and China would be
highly likely under this scenario.176
The prospects of a resurgent American economy
should not be discounted, however. Growth is cur-
rently quite strong,177 and new housing construction
has increased substantially.178 Assuming some stabi-
lization in the eurozone and no significant weakening
in the emerging economies, the U.S. could now see a
rapid recovery after a number of false starts. Going for
growth is a plausible scenario in this case, especially if
a growing number of metropolitan areas aggressively
pursue growth strategies. Internationally, under this
scenario, the United States will sit somewhere in be-
tween the rest of the West and the rising powers, with
the wealth and established institutions of the former,
but population growth, rapid urbanization and appetite
for resources of the latter.
Shocks have the potential to make it impossible for
the United States to continue to follow the muddle
through scenario. In the short term, a returning finan-
cial crisis is the greatest risk, either in the eurozone or
in one or more emerging markets. Conflict—in Iran,
for example—cannot be ruled out, and political dis-
turbance in a major oil producer (Iran, Saudi Arabia,
Russia, Venezuela) would have a dramatic impact on
energy markets. Environmental shocks are inherently
unpredictable, but they are expected to become more
frequent as climate change intensifies. In the emer-
gency response scenario, much will depend on the
resilience of American society (defined as the capacity
to absorb disturbance and reorganize while undergo-
ing change) and on policies that aim to reinforce that
resilience.179 As was seen during the early phase of the
Great Recession, the window in which reforms can be
implemented is only a brief one. It is therefore critical
that potential responses have already been developed
and are ready for rapid deployment.
Intelligent design is the preferred scenario for those
who are convinced of the importance of sustainable
development. This scenario does not require a sud-
den and unrealistic change of political and economic
direction. Instead, a set of disparate policies will have
the cumulative effect of pushing the United States onto
a growth trajectory that is somewhat more sustain-
able than the current one. Over time, a new economic
model emerges as political and economic incentives
shift and the new direction becomes self-reinforcing.
This scenario is far from being an easy option, how-
ever. On the one hand, even in the best case, envi-
ronmental sustainability would still be some way off.
Climate stabilization, in particular, is likely to remain
a distant goal, with the chance of global warming re-
maining below 2ºC now remote. On the other hand,
most of the policies that might underpin this scenario
face daunting obstacles. Significant political skill will be
needed to shift American society onto this path.
So what reforms or policy innovations are both con-
sistent with the intelligent design scenario and likely

THE UNITED STATES AFTER THE GREAT RECESSION 25
to gain traction within contemporary America, given
the country’s history, current preferences and fu-
ture opportunities and risks? First, a future direction
cannot rely too heavily on the federal government.
Until the 1970s, postwar U.S. economic policy was
underpinned by a form of Keynesian economics that
relied on the market but also the government for dis-
tributional issues, and used fiscal policy to smooth
economic cycles and achieve key social and envi-
ronmental goals. Keynesian policies came under
sustained pressure, however, as economic growth
began to slow, the oil crisis fueled inflation, and a
combination of the Vietnam War and the cost of social
programs increased budgetary pressure.180 The result
was a shift to a monetarist economic underpinning for
economic policy, based on a view that government
intervention in the market was a source of instability,
and with policy prescriptions that increased the role of
the private sector through deregulation and the priva-
tization of government-owned assets.
Today, the role of government appears to have hit
another inflection point, but its future direction is hotly
contested. There is strong support for a substantial
further reduction in the size of government. The Path
to Prosperity, a Republican budget proposal for 2012,
envisaged reducing the size of government to 20 per-
cent of GDP while placing a renewed emphasis on
“the timeless principles of the American idea: free en-
terprise and economic liberty; limited government and
spending restraint; traditional family and community
values; and a strong national defense.”181 The pro-
posed budget argues for a reversal of a “shortsighted
financial regulatory overhaul [that] failed to fix what
was broken on Wall Street” and attacks the “environ-
mental activism” of the federal government.
An alternative vision is more supportive of a return to a
mixed model that delivers new approaches to service
delivery and regulation, while imposing more mod-
est spending cuts. During its first term, the Obama
administration created fewer regulations than its pre-
decessors, but it has been more prepared to impose
regulations in “economically significant” areas, where
costs are above $100 million.182 It has also established
a new Consumer Financial Protection Bureau that is
expected to take an aggressive approach to its mis-
sion, making “markets for consumer financial products
and services work for Americans.”183 But even if these
latter trends continue, the role of government will still
remain constrained, given traditionally low levels of
government expenditures, the need to tackle the defi-
cit, and low levels of public confidence in the govern-
ment’s ability to deliver change.
Second, a new growth model is only likely to prosper
if it generates wealth for all segments of society. U.S.
citizens have a relatively high tolerance for inequality.
Only a slim majority believe that it is the government’s
responsibility to take care of people who cannot take
care of themselves, with support for a social safety net
declining over the past 20 years.184 It is highly unlikely
that any political party will win support if it sets the re-
duction of inequality as a primary policy goal. However,
it is equally unlikely that patterns of growth that fail to
deliver benefits to the middle classes can be sustained
indefinitely. The politically salient yardstick, therefore,
is an absolute one (most Americans are seeing im-
provements in their living standards), not relative (the
gap between rich and poor is closing), though the latter
may follow from or be required to deliver the former.
Governments are therefore likely to place consider-
able emphasis on the ability to generate more and
better employment, with 21 million new jobs needed
by 2020 for unemployment to sink below 5 percent.185
In addition, productivity gains must also support
higher wages if household incomes are once again to
26 GLOBAL ECONOMY AND DEVELOPMENT PROGRAM
continue to increase. In part, this is likely to depend
on the United States’ ability to exploit emerging inter-
national export opportunities in societies with growing
numbers of consumers. President Obama has set a
target of doubling American export growth by 2014,
with his National Export Initiative claiming that an ad-
ditional 1.2 million jobs were supported by exports
between 2009 and 2011.186
Finally, policies will need to fulfill at least a narrow vision
of environmental sustainability, based on two key areas:
• Greater resilience in the face of crisis. Federal,
state and city governments will see their credibility
undermined if they fail to manage risks effectively.
The economic crisis is far from over, with the euro
remaining under serious threat. The world also faces
a number of significant geopolitical risks, including
the aftermath of the Arab Spring and potential con-
flict with Iran, either of which could have a dramatic
impact on energy markets. This suggests that the
United States is highly unlikely to be able to avoid fu-
ture shocks but will prosper to the extent it is adapt-
able in the face of them.
• Protection from immediate environmental impacts.
American public opinion on climate change is
influenced by short-term weather trends, with ab-
normal shifts in local temperature associated with
a strengthened belief in global warming.187 Natural
and environmental disasters—such as Sandy and
Katrina—also increase concern about climate
change, with more than 80 percent of Americans
saying that they experience an extreme weather
event or natural disaster each year.188 Action that
explicitly aims to address these threats, either di-
rectly or indirectly, is therefore more likely to be
supported than more general appeals to protect
the planet, especially as weather extremes con-
tinue to increase.189
On the basis of these criteria, we have developed a se-
ries of policy recommendations that are most likely to
push the United States toward the more proactive ap-
proach outlined in the intelligent design scenario. Many of
these policies would also push the United States toward
the going for growth scenario, but without the social and
environmental benefits of the preferred scenario.
We do not expect all these policies to be implemented
in the short term, but even a handful of them would
begin nudging the United States toward a more sus-
tainable trajectory. This would, in turn, provide a foun-
dation for a new era of leadership from the United
States on issues that will have a decisive impact on
global prosperity and security in the 21st century.

THE UNITED STATES AFTER THE GREAT RECESSION 27
3. AMERICA’S FUTURE DIRECTION
In this paper, we have argued that the United States
faces economic, social and environmental challenges
that cannot be effectively managed given existing poli-
cies. There are, however, significant social and political
factors that block many options for a future direction. In
this section, we therefore set out policies that, though
challenging to implement, are within the realm of the
politically possible. Our expectation is that demand
for new policies will grow as globalization continues
to be gripped by its long crisis, and that the United
States remains relatively well placed to pioneer new
approaches, given its geopolitical position, wealth and
appetite for innovation. We therefore expect opportu-
nities to break the gridlock, although the windows for
reform will often be fleeting.
We group recommendations into four areas, focusing on:
• Employment, which is the most urgent priority
to accelerate American recovery from the Great
Recession, while addressing underlying structural
issues that have led to a decade of poor economic
outcomes for most citizens.
• Investment in the future, as the key marker of
whether the United States is prepared to make far-
sighted decisions, or whether its resources and po-
litical attention are increasingly absorbed by current
consumption and immediate crises.
• Energy, where there are new opportunities to make
strategic use of an increased energy endowment,
while reinforcing the trend towards reduced resource
demand, with a significant resultant impact on the
sustainability of the United States’ growth model.
• Fiscal rebalancing, where the United States must in-
sulate economic recovery from the process of fiscal
reform while also reducing and stabilizing the debt.
Finally, we explore the implications of these policies for
renewed American leadership internationally, arguing
that President Obama and his successors after 2016
have the opportunity to re-energize the country’s for-
eign policy if they build on a platform of domestic ac-
tions that enhance the sustainability of both America’s
society and economy.
Tackling the Jobs Crisis
Nearly 9 million jobs were lost in the Great Recession
and its immediate aftermath.190 During the recovery,
policy has had a modest impact on increasing employ-
ment, with the Congressional Budget Office estimating
that the Recovery and Reinvestment Act has led to
between 0.2 and 1.2 million additional people in cur-
rent employment, with a peak impact on employment
at the end of 2010.191 At the state level, labor markets
were strongest in those states that increased govern-
ment expenditures fastest between 2007 and 2010.192
But the federal stimulus spending created jobs at an
estimated cost of $125,000 per job.193
As noted by Ben Bernanke, chairman of the Federal
Reserve, “the rate of improvement in the labor market
has been painfully slow.”194 At the rate of job creation in
the 2000s, it would take until 2020 to fill the current jobs
gap, with Bernanke blaming the troubled housing sector,
fiscal contraction at the federal and state levels, and fi-
nancial stresses in the eurozone. The Federal Reserve,
tired of waiting for Congress to act, launched a new
round of quantitative easing (QE3) based on its expec-
tation that economic growth will not otherwise “be strong
enough to generate sustained improvement in labor
market conditions.”195 This new commitment does not
have a fixed end date but is tied to clear evidence that
the labor market is improving. This marks an increased
commitment from the Federal Reserve to “forward guid-
ance,” signaling that it is prepared to boost aggregate

28 GLOBAL ECONOMY AND DEVELOPMENT PROGRAM
demand (and, as a result, tolerate a higher inflation),
until the economy has fully recovered.196
Prospects for the United States’ growth have improved
though are still highly vulnerable to shocks. The hous-
ing market appears to have stabilized, deleveraging is
advanced, and companies are sitting on large reserves
of cash. The immediate priority, therefore, is to maintain
QE3 and strengthen the signal sent to the market by
underlining the importance of the dual mandate (in con-
trast to current legislative attempts to remove the Fed’s
goal of maximizing employment),197 while maintaining
the current consensus on the Federal Open Market
Committee behind a “highly accommodative stance of
monetary policy” until employment has increased sub-
stantially.198 The key domestic threat to employment
growth derives from the prospect of premature fiscal
tightening (discussed below). Internationally, U.S. lead-
ership is needed, especially within the G-20, for a more
aggressive attempt to manage contagion within and
from the eurozone and to respond to signs of economic
fragility in the emerging powers.
Beyond the immediate economic crisis, the focus
needs to shift to structural factors, through efforts to
tackle long-term unemployment and geographical and
skills mismatches between the labor market and labor
force. During the recession, there was a substantial in-
crease in the mismatch between available jobs and the
skills of the workers available to fill them, with industrial
mismatch accounting for about a third of the increase
in unemployment (geographical mismatch did not play
a significant role).199 Although this was primarily a
cyclical phenomenon with levels of mismatch quickly
returning to prerecession levels—mostly as a result
of more rapid recovery in sectors such as construc-
tion, manufacturing and retail that were fastest to shed
jobs during the downturn—workers with obsolete skills
are disproportionately likely to lose their jobs during a
recession.200 Large numbers of workers have been un-
employed for more than six months or have exited the
labor force entirely.201 Most of these potential workers
will lose skills and motivation the longer they are out of
work, leading to what Ben Bernanke has warned of as
“modest increase in the sustainable, long-run rate of
unemployment,”202 with the natural rate of unemploy-
ment now estimated to have increased to between 5.2
and 6 percent.203
A related problem is the long-term failure to generate
sufficient jobs that support a middle-class income. At
least in its early stages, the recovery has seen a further
shift toward low-wage jobs, with mid-wage jobs ac-
counting for 60 percent of the jobs lost in the downturn,
but only 22 percent of those added in its aftermath.204
Looking forward, the workforce faces significant struc-
tural challenges. During the next decade, it will con-
tinue to age, increasing the importance of participation
rates of older workers. The skills gap is also likely to
increase, with the McKinsey Global Institute project-
ing that in 2020 there will be about 6 million too few
jobs for those who have not completed a high school
education, though there is likely to be a shortage of
workers able to fill jobs that require advanced technical
degrees.205 The major priority is to address the skills
gap (discussed below) while also:
• Implementing an emergency package for the long-
term unemployed to increase their chances of find-
ing work as the recovery proceeds, with the aim
of bringing the natural rate of unemployment back
down to about 5 percent.206 Options include targeted
retraining schemes for the long-term unemployed
or wage subsidies for employers who provide them
with jobs, drawing on the more successful elements
of Germany’s Hartz Reforms.207
• Supporting the rebound of manufacturing after the
recession, with the aim of creating middle-class jobs
THE UNITED STATES AFTER THE GREAT RECESSION 29
and supporting robust local economies.208 The future
for United States manufacturing is in high-end indus-
tries, which are likely to prosper as manufacturing
becomes increasingly reliant on technology, less
centered on mass production and less determined
by access to cheap labor.209 This will require greater
support for innovation (discussed further below).
• Capitalizing on the opportunities for growth that
can be found in America’s cities, especially as they
continue to experience rapid population growth.
They have the greatest ability to escape partisan
gridlock at federal levels, offering what Bruce Katz
calls a “historic opportunity to usher in a new era
of pragmatic, collaborative federalism that capital-
izes on the economic power of metropolitan areas
and the policy creativity of state and local lead-
ers.”210 Katz proposes that the federal government
fund state and metropolitan development strate-
gies on a competitive basis and based on their
contribution to national objectives, such as the
goal of doubling exports.
Investing for Tomorrow
A willingness to invest in future generations is critical
to the long-term success of any society. In recent de-
cades, however, the United States has seen a rise in
consumption, an increase in debt and a failure to invest
adequately in education, infrastructure and the innova-
tion needed to sustain prosperity.
The American education system has important
strengths, including its elite higher education sec-
tor. Its schools, however, are failing large numbers of
students, with the American students ranking below
average for science and only average for mathemat-
ics when compared with other OECD countries.211
The failure to provide a decent education to black and
Latino students is especially consequential, given that
they lag two to three years behind their white counter-
parts.212 This will have an intensifying economic impact
as the workforce becomes increasingly populated by
these groups. Creating better and more affordable
education opportunities means reducing costs, improv-
ing quality and ensuring that the education system is
equipping graduates with the skills needed for the 21st
century, with a particular focus on poorly performing
groups of students. Challenges include high costs of
elite institutions and higher education, lower access to
scholarships and grants, mounting student debt and
inequitable payback schemes.
Priorities include:
• Making higher education more affordable and ac-
cessible for a greater number of students, thus nar-
rowing the educational opportunity gap. This can
be done through an increase in state-sponsored
financial aid and granting programs (i.e., further in-
vestment in Pell Grant scholarships), providing pay-
ments options for students at different income levels,
or by freezing or cutting tuition rates.213 Reform of
the student loan payback system is especially im-
portant, enabling student loan borrowers to cap their
payments at a percentage of income (i.e., at 10 per-
cent of what they make every month).214
• Improving educational outcomes by reviewing cur-
ricula and assessment systems to match outcomes
relevant to future economic opportunities and social
challenges. All the world’s top-performing and rap-
idly improving systems have curriculum standards
that set clear and high expectations for what stu-
dents should achieve.215
• Addressing the skills gap among adult workers
through increased partnerships between businesses
and educational institutions and focusing on work-
force development. Investment could be increased

30 GLOBAL ECONOMY AND DEVELOPMENT PROGRAM
in the federal program Skills for America’s Future,
an industry-led initiative that improves industry
partnerships with community colleges and builds a
nationwide network to maximize workforce develop-
ment strategies, job training programs and job place-
ment.216 There is also potential to focus federal and
state assistance for training on firms and sectors that
have the greatest potential to produce high-paid jobs
(with randomized trials to measure what works).217
Infrastructure is another area where the United States
is falling behind, with a pronounced impact on future
competitiveness.218 According to the American Society
of Civil Engineers, the United States should spend
$1.7 trillion by 2020 to upgrade infrastructure, and cur-
rent investments are falling short of what is needed
by $94 billion a year.219 It currently spends only 2.4
percent of GDP on infrastructure,220 compared with 5
percent in Europe and 9 percent in China.221 As well
as improving competitiveness, smart investment in
infrastructure could put the U.S. economy on a lower
carbon path.
The United States should develop a national infrastruc-
ture plan or strategy that strengthens federal support
and improves cooperation between all levels of gov-
ernment and the private sector. For example, Obama
has proposed a partnership to rebuild America that will
leverage private capital to upgrade infrastructure. In
order to increase the sustainability of America’s infra-
structure, specific priorities include:
• Increased investment in low-carbon mass transpor-
tation, thereby reducing fuel use, air pollution and
greenhouse gas emissions, while improving the
quality of urban life.222 Moreover, by one estimate
the economic gains are significant, with every $1
spent on public transportation increasing GDP by
up to $3.50.223
• Promotion of innovative financial mechanisms to
support green infrastructure investments, through
entities such as Connecticut’s Clean Energy Finance
and Investment Authority, which helps to reduce
pressure on public budgets,224 and the state of New
York’s proposed $1 billion Green Bank to help fund
clean energy investments.225
• Investment to make infrastructure more resilient to
extreme weather events and other natural disasters,
given the heightened vulnerability of many U.S. ur-
ban areas to a range of threats.226
Finally, policies are needed to increase innovation, es-
pecially in areas that will equip the United States to com-
pete in industries with high growth potential. President
Obama in his 2013 State of the Union address said that
“now is the time to reach a level of research and devel-
opment not seen since the height of the Space Race.”**
Since the 1960s, the U.S federal rate of investment in
R&D as a percentage of GDP has declined from nearly
1.3 percent to 0.9 percent, damaging the global com-
petitiveness of the United States’ industries.227 The gov-
ernment therefore should increase federal funding for
R&D, especially in clean energy and other low-carbon
areas, but also in sectors where the United States holds
significant research capacities, including biotechnology,
genetics and nanotechnology. Priorities include:
• Enhancing the United States’ attractiveness as a
place for investment by removing barriers in the
tax code, creating new financial mechanisms that
combine public and private funding streams, and
increasing investment in seed capital and technol-
ogy funding programs, such as the Small Business
Innovative Research Program, which provides about
$1 billion a year to U.S. small businesses for early-
stage R&D projects.228
** White House, Office of the Press Secretary, 2013. Remarks by the President in State of the Union Address, February 12, 2013. Available at http://www.whitehouse.gov/the-press-office/2013/02/12/remarks-president-state-union-address.

THE UNITED STATES AFTER THE GREAT RECESSION 31
• Supporting entrepreneurship through effective im-
migration policies that attract a highly skilled labor
force. H1-B visas are strongly associated with in-
novation in science, technology and engineering.229
The cap on these visas should therefore be raised to
address skilled labor shortages.
• Supporting innovation in clean energy and low car-
bon technologies through a cohesive set of federal,
state and local low-carbon economic growth strate-
gies that will help increase the United States’ leader-
ship in these sectors.230
Fueling the Future
America’s energy prospects have changed radi-
cally in recent years, as higher energy prices have
combined with modest technological innovation
to increase reserves of unconventional gas and,
more recently, unconventional oil. This is already
having an economic impact, with energy prices
lower in the United States than in Europe or Asia.
In his 2012 State of the Union address, President
Obama claimed that shale gas alone will lead to
the creation of 600,000 new jobs by 2020.231 Gas
production is likely to exceed consumption within a
decade, though prices are already low (indicating a
gas glut).232 This creates the potential for exports,
supporting the development of stronger and more
resilient global liquefied natural gas markets.233
However, the extent of the long-term benefits from
gas and in particular their impact on climate change
are uncertain. Natural gas has been presented by
the American Gas Association as a “bridge” to re-
newable energy technologies since the early 1980s,
but it is unclear whether it remains a bridge to no-
where.234 Much will depend on the extent to which
coal is displaced, whether investment in renewables
is crowded out, how quickly tight oil production in-
creases and the boost to demand from lower prices.
Policies are therefore needed to direct demand for gas,
especially through faster switching from coal to gas for
power generation. Coal is still projected to provide 38
percent of United States electricity in 2035, compared
with 45 percent in 2010.235 Earlier decommissioning of
inefficient coal plants should be encouraged through
ongoing tightening of regulations.236 There is a real
danger, however, that the decline in coal production
will be limited by an increase in exports, displacing car-
bon emissions overseas. Exports in 2011 were almost
double those of two years earlier and have continued
to rise rapidly.237 New coal terminals are planned, with
the Environmental Protection Agency calling for a
study of the climate change effects of exporting coal
from the United States to Asia.238 Europe—suffering
comparative energy scarcity—is also a growing market
for American coal.239
There is also potential for displacing oil in trans-
portation, especially in heavy vehicle fleets (using
compressed natural gas) or through greater use of
electric cars (assuming the electricity comes from
gas-powered generation). In the medium term, there
may be potential for increased use of natural gas light
vehicles, which are already made and sold abroad by
most major manufacturers, including Ford and General
Motors.240 Again, however, the net effect on emissions
will be reduced if prices are lower than would otherwise
have been expected.
As a zero-carbon base load source of electricity,
there is renewed debate on the role nuclear energy
should play in reducing U.S. greenhouse gas emis-
sions. Nuclear energy is currently the fourth-largest
source of energy production and provides more than
19 percent of the United States’ electricity. However,
since the Three Mile Island nuclear incident, build-
ing nuclear power plants has become increasingly
costly, and no reactor has been built in the United
32 GLOBAL ECONOMY AND DEVELOPMENT PROGRAM
States since 1977. In addition, the nuclear meltdown
at Fukushima Daiichi in 2011 again highlighted the
costs of nuclear energy. The Obama administration
has offered loan guarantees to support the con-
struction of four new reactors, although it has faced
difficulties finalizing terms with private sector part-
ners.241 The Nuclear Regulatory Commission has
also received active applications for a total of 28 new
reactors, though many are unlikely to ever be built.242
President Obama’s goal of generating 80 percent of
future electricity from clean energy sources by 2035
probably cannot be met without at least some in-
creased role for nuclear energy.
Carbon pricing (discussed below) remains a key
priority for a more sustainable energy policy. It has
the potential to ensure that recent shifts in patterns
of energy demand are reinforced, while favoring the
supply of low-carbon fuels.243 A carbon price, by in-
creasing the costs for carbon-intensive industries,
would be an incentive for innovation into green tech-
nologies that reduce CO2 emissions, complement-
ing other government policies supporting R&D in
clean energy.244 However, a carbon price should be
supplemented by:
• Better regulation of the shale gas industry, in particu-
lar to reduce methane leakage, which is essential if
gas is to deliver the expected environmental benefits
over coal.
• Promotion of investment in gas infrastructure (pipe-
lines, refueling infrastructure/standards, etc.) and of
standards for the use of gas in transportation.245
• A clean energy standard in the power sector equiva-
lent to a target of 80 percent clean energy by 2035,
which would reduce the sector’s emissions by 60
percent by 2035.246
• Policies to promote higher-density urbanization,
more energy efficient buildings, better public
transportation links and a reduction of the reliance
on automobiles.247
• Continued use of regulation to promote more
efficient energy use and ensure rapid improve-
ments in the efficient use of resources by energy-
intensive sectors, where the government is able to
demonstrate substantial environmental benefits at
an acceptable cost.
Fiscal Rebalancing
In the medium term, the United States needs fiscal
reform that puts the country on a pathway to sustain-
able economic growth. However, it must also avoid a
sharp near-term fiscal contraction that could endan-
ger the recovery.248
The first priority is to manage continued fiscal stale-
mate in the wake of the compromise deal struck on
January 1, 2013, when Congress passed the American
Taxpayer Relief Act. This made permanent the Bush-
era income-tax cuts for those earning under $400,000,
while the Alternative Minimum Tax was permanently
patched; emergency unemployment insurance ben-
efits were extended for a year; scheduled cuts to
Medicare payments to doctors were averted; and the
large automatic cuts in discretionary spending were
delayed by two months.249 The measures in this bill will
not be enough to resolve the country’s long-term bud-
get problem, and $1.4 trillion in additional savings are
required to stabilize the public debt over this decade.250
The short-term nature of the deal on the debt ceil-
ing, the need to set a new budget and the need to
deal with the spending cuts under the sequester all
ensure that fiscal issues will continue to dominate

THE UNITED STATES AFTER THE GREAT RECESSION 33
American politics in 2013. Despite intense partisan
differences on this issue, policymakers need to send
a clear signal that expenditures will not be signifi-
cantly cut until the recovery has become entrenched
and the labor market has shown significant further
signs of recovery. Medium- and long-term fiscal re-
trenchment should then be used as a “reverse stimu-
lus” when growth is strong, restraining inflation and
allowing interest rates to rise more slowly than would
otherwise be the case.
A related priority is to address the fiscal crisis at the
state and city levels, with 31 states facing a $55 bil-
lion shortfall in the current fiscal year and a growing
number of municipalities filing for bankruptcy.251 As
the State Budget Crisis Task Force has demon-
strated, state budgets have become procyclical,
while their deficits are now structural and will not
necessarily be closed as the economy recovers.252
Without action, fiscal pressures are likely to be a se-
rious impact on regional and local labor markets and
on education, health and social sector expenditures.
In Alabama, for example, the Jefferson County bank-
ruptcy has seen residents in some of the poorest
districts cut off from water mains and sanitation.253
Beyond the overall aim of reducing public debt and
putting the federal budget on a sustainable trajectory,
a fiscal reform package should also aim to:
• Reform the tax code in ways that tackle income in-
equality by restructuring provisions for lower- and
middle-income taxpayers. Allowing the Bush tax
cuts to expire for incomes above $400,000 was a
first step toward addressing this challenge.
• Cut inefficient subsidies, especially those for fossil
fuels, in line with the commitment made by leaders
at the G-20 in Pittsburgh in 2009. The removal of
these subsidies may be feasible as part of a broader
fiscal package, raising up to $52 billion in additional
revenue at a time when the oil and gas sector is per-
forming strongly and does not need public support.254
• Shift taxation from labor to carbon. Although a car-
bon tax is currently politically difficult, it may win
support if it is revenue neutral or is used to prevent
income taxes from rising. At $15 per metric ton of
CO2 and rising 4 percent in real terms to 2050, it
could raise revenues of $80 billion initially and $310
billion by 2050 while also reducing U.S. CO2 emis-
sions by 2.5 metric tons (34 percent) by 2050.255

34 GLOBAL ECONOMY AND DEVELOPMENT PROGRAM
CONCLUSION: RENEWING AMERICA’S GLOBAL LEADERSHIP
We live in an era of rapid change and great uncertainty.
This crisis of globalization can best be understood as
a crisis of unsustainability as the world struggles to
provide a decent standard of living to more than 7 bil-
lion people at a time when resources are constrained,
natural systems are under threat, and international and
national institutions are ill equipped to manage con-
temporary risks.
This is not an easy world in which to lead. Trust is
low within and between countries. Levels of uncer-
tainty are high, complicating geopolitical calculations
and hampering investment decisions. Governments
spend much of their time firefighting and have little
time to actively shape new policies, approaches and
solutions. The United States’ effectiveness in act-
ing alone is diminished, particularly in non-defense-
related areas such as economic and environmental
challenges, where the rising powers have not yet
been prepared to invest in global leadership. The re-
sult is a leadership deficit on the defining challenges
of our age: building a more resilient economic system,
productive employment for the world’s young people,
stable markets for food, energy and other natural re-
sources, and climate stabilization.
Is America equipped to renew its leadership on these
issues? It has huge potential for technological and so-
cial innovation. Its economy has global reach, and its
policies and actions shape markets. Favorable demo-
graphics, a strengthening economy, growing energy
reserves, and a robust and durable geopolitical posi-
tion all provide the basis for it to take a more confident
and assertive stance.
However, American global leadership needs to be un-
derpinned by a robust economy that delivers outcomes
for a wider range of its population and at an acceptable
environmental cost. Policies that address the key eco-
nomic, environmental and social challenges outlined
in this paper will ultimately be the main drivers and
determinants of the scope and effectiveness of United
States’ global leadership.
These policies would provide a robust foundation for
a new era of American leadership, helping President
Obama and his successors to strengthen major al-
liances and to become a more effective actor in key
international forums such as the G-20 and the United
Nations. In particular, there are opportunities for inter-
national cooperation in the following areas:
• Building the knowledge base needed to underpin
international action. Many of the world’s leading
scientists are American, and the United States’
research centers have comparative advantage
across multiple fields. New approaches to both
“big” and “open” data have been pioneered in the
United States, offering new opportunities to ana-
lyze complex crosscutting global issues. The U.S.
should do more to deploy these resources inter-
nationally, establishing analytical resources that
build consensus on the scope of problems and the
nature of potential solutions.
• Pivoting to the global jobs crisis. It is not just America
and Europe that lack jobs. The job crisis is a global
one. It is most pressing in regions that have the larg-
est proportion of young people in their populations
and have the potential to collect a demographic divi-
dend if they can expand their workforce at sufficient
speed, but risk a destabilizing demographic disaster
if they fail.256 For example, in Africa millions of youth
are flooding into the workforce each year, while 60
percent of the continent’s unemployed are between
15 to 24 years of age.257 American leadership on
global employment and on the education and skills
THE UNITED STATES AFTER THE GREAT RECESSION 35
needed to underpin it is essential, especially when
the G-20 finally is able to turn its attention from the
fallout of the 2008 financial crisis.
• Strengthening the global trade system. The United
States continues to benefit significantly from global
trade, and, as 95 percent of consumers reside out-
side the United States, access to the markets of large
emerging economies such as China, India and Brazil
will be increasingly important sources of growth for
United States businesses. The U.S. should reinvigo-
rate the World Trade Organization (WTO) as the key
venue for trade liberalization, which first will require
finishing enough of the WTO Doha Round to declare
the round over, thus creating political space for the
WTO to focus on new trade priorities such as green
energy, food security and electronic commerce.
• Demonstrating leadership on energy, food and
other resources. Resource markets are likely to
remain volatile for some years, complicating rela-
tionships between major powers, weakening stra-
tegically significant fragile states and discouraging
investors from making long-term commitments.
The U.S., which is enjoying increasing resource
security, has new potential to work with China and
India, countries that are increasingly exposed to
global resource markets. In particular, by export-
ing the technological and regulatory know-how
that has underpinned its shale gas revolution, it
can diversify global energy production while pro-
moting a relatively clean energy source. It should
also lead on extractive transparency, helping
ensure that supplier countries are more likely to
escape from the resource curse. Domestic ac-
tion on energy subsidies, meanwhile, will make
credible the G-20’s commitment to global subsidy
reduction, while the Obama administration should
deepen its support for efforts to provide universal
access to modern energy sources by 2030.258
• Reframing action on climate change. Concerted in-
ternational action on climate change has no prospect
of success without U.S. leadership. In his second
term, President Obama will find his position on climate
substantially strengthened by the fact that American
emissions are falling and are projected to continue to
do so. Countries are committed to once again trying to
negotiate a new treaty on climate, this time by 2015.
The Obama administration should provide an early
signal of its level of ambition for this treaty and what it
expects other large economies to contribute in terms
of timelines and targets for reducing greenhouse gas
emissions. It also has the opportunity to open up new
space on issues such as black carbon, the Arctic and
noncarbon greenhouse gases such as methane.
President Obama is likely to spend a growing propor-
tion of his second term on foreign policy, especially
after the midterm elections in 2014, when attention
will begin to focus on electing his successor. He will
find that many of America’s partners face sustainabil-
ity challenges that are often more pressing and far-
reaching than those experienced by American citizens,
sheltered as they are by prosperity, abundant natural
resources and distance from most of the world’s trou-
ble spots. This will provide him with an opportunity to
begin to forge a new consensus on tackling the most
pressing global risks
As a second-term president, Barack Obama will ben-
efit from the authority that accrues to leaders the lon-
ger they spend on the world stage. In his first speech
to the United Nations, he told world leaders that they
could be remembered for putting off hard choices and
failing to adjust to the challenges of the 21st century,
or they could be remembered for their willingness “to
see the shoreline beyond the rough waters ahead.” He
now has an opportunity to help the world strike out for
that shoreline, but like any American president after an
election, his time is already running out.259
36 GLOBAL ECONOMY AND DEVELOPMENT PROGRAM
ENDNOTES1 William J. Clinton, “Address Before a Joint
Session of the Congress on the State of the Union,” American Presidency Project, 2000, http://www.presidency.ucsb.edu/ws/index.php?pid=58708#axzz1xmaikXTb.
2 Charles P. Kindleberger, Manias, Panics and Crashes: A History of Financial Crises (New York: John Wiley & Sons, 2001).
3 Amy Belasco, The Cost of Iraq, Afghanistan, and Other Global War on Terror Operations since 9/11 (Washington: Congressional Research Service, 2011).
4 Federal Reserve, “Changes in U.S. Family Fi-nances from 2007 to 2010: Evidence from the Survey of Consumer Finances,” Federal Reserve Bulletin 98, no. 2 (June 2012), http://www.federal-reserve.gov/pubs/bulletin/2012/PDF/scf12.pdf.
5 White House, “Remarks by the President in State of the Union Address,” January 27, 2010, http://www.whitehouse.gov/the-press-office/remarks-president-state-union-address.
6 Pew Research Center, Partisan Polarization Surges in Bush, Obama Years: Trends in Ameri-can Values, 1987–2012 (Washington: Pew Re-search Center for the People and the Press, 2012), http://www.people-press.org/2012/06/04/section-1-understanding-the-partisan-divide-over-american-values/.
7 Ibid; Council on Foreign Relations, “U.S. Opin-ion on the Global Economy,” in Public Opinion on Global Issues: A New Digest of U.S. and In-ternational Attitudes (New York: Program on In-ternational Policy Attitudes, Council on Foreign Relations, 2009), http://www.cfr.org/world/us-opinion-global-economy/p20137.
8 Coleen Murray, “Treasury Notes: As U.S. Reaches Debt Limit, Geithner Implements Additional Ex-traordinary Measures to Allow Continued Fund-ing of Government Obligations,” U.S. Department of the Treasury, Washington, 2011, http://www.treasury.gov/connect/blog/Pages/Geithner-Im-plements-Additional-Extraordinary-Measures-to-Allow-Continued-Funding-of-Government-Obli-gations.aspx.
9 Congressional Budget Office, “Economic Effects of Reducing the Fiscal Restraint That Is Sched-uled to Occur in 2013,” 2012, http://www.cbo.gov/publication/43262.
10 Martin Wolf, “A Permanent Precedent,” Financial Times, May 17, 2012.
11 Michael Pettis, “The Contentious Debate over China’s Economic Transition,” Policy Outlook (Carnegie Endowment for International Peace), March 25, 2011, http://www.carnegieendowment.org/files/china_econ_transition.pdf.
12 Alex Evans, Bruce Jones and David Steven, Con-fronting the Long Crisis of Globalization: Risk, Resilience and International Order (Washington: Brookings Institution, 2010).
13 BBC, “Rio Summit: Little Progress, 20 Years On,” 2012, http://www.bbc.co.uk/news/science-envi-ronment-18546583.
14 Derek Headey, Sangeetha Malaiyandi and Shenggen Fan, Navigating the Perfect Storm: Reflections on the Food, Energy, and Financial Crises” IFPRI Discussion Paper 00889 (Washing-ton: International Food Policy Research Institute, 2009), http://www.ifpri.org/sites/default/files/pub-lications/ifpridp00889.pdf.
15 Organization for Economic Cooperation and De-velopment (OECD), OECD Economic Outlook 2012 (Paris: OECD, 2012) table 1.3, http://www.oecd.org/eco/economicoutlookanalysisandfore-casts/economicoutlook.htm.

THE UNITED STATES AFTER THE GREAT RECESSION 37
16 U.S. Department of Agriculture, “U.S. Drought 2012: Farm and Food Impacts,” November 9, 2012, http://www.ers.usda.gov/topics/in-the-news/us-drought-2012-farm-and-food-impacts.aspx.
17 United States Environmental Protection Agency (EPA), Future Temperature Changes (Wash-ington DC: EPA), http://www.epa.gov/climat-echange/science/future.html
18 Federal Advisory Committee, 2013, Draft Climate Assessment Report, National Climate Assessment and Development Advisory Committee, United States Global Change Research Program (Wash-ington: Federal Advisory Committee January 2013), http://ncadac.globalchange.gov/download/NCAJan11-2013-publicreviewdraft-fulldraft.pdf
19 Carbon Dioxide Information Analysis Center, 2012, “Fossil-Fuel CO2 Emissions,” http://cdiac.ornl.gov/trends/emis/meth_reg.html; Oakridge National Laboratory, “Carbon Dioxide Emissions Rebound Quickly after Global Financial Crisis,” December 5, 2011, http://www.ornl.gov/info/press_releases/get_press_release.cfm?ReleaseNumber=mr20111205-00.
20 International Environment Agency, Global Car-bon-Dioxide Emissions Increase by 1.0 Gt in 2011 to Record High,” May 24, 2012, http://www.iea.org/newsroomandevents/news/2012/may/name,27216,en.html.
21 Anthony D. Barnosky, Elizabeth A. Hadly, Jordi Bascompte, Eric L. Berlow, James H. Brown, Mi-kael Fortelius, Wayne M. Getz, John Harte, Alan Hastings, Pablo A. Marquet, Neo D. Martinez, Arne Mooers, Peter Roopnarine, Geerat Vermeij, John W. Williams, Rosemary Gillespie, Justin Kitzes, Charles Marshall, Nicholas Matzke, Da-vid P. Mindell, Eloy Revilla and Adam B. Smith, “Approaching a State Shift in Earth’s Biosphere,” Nature 486 (June 7, 2012): 52–58.
22 Homi Kharas, The Emerging Middle Class in De-veloping Countries, OECD Working Paper 285 (Paris: OECD Development Center, 2010), http://www.oecd.org/social/povertyreductionandso-cialdevelopment/44457738.pdf.
23 Council on Foreign Relations, “U.S. Opinion on the Global Economy,” in Public Opinion on Global Issues: A New Digest of U.S. and International Attitudes (New York: Program on International Policy Attitudes, Council on Foreign Relations, 2009), http://www.cfr.org/world/us-opinion-global-economy/p20137.
24 Chris Borick and Rabe Barry, Continued Rebound in American Belief in Climate Change: Spring 2012 NSAPOCC Findings, Brookings Institution, Washington, June 11, 2012, http://www.brook-ings.edu/research/papers/2012/06/~/media/Re-search/Files/Papers/2012/6/11%20climate%20rabe%20borick/NSAPOCC_Belief_Spring%20Formatted.pdf.
25 “Eqecat Sees Sandy-Insured Losses Up to $20 Billion in U.S.,” Reuters, November 1, 2012, http://www.reuters.com/article/2012/11/01/us-storm-sandy-losses-idUSBRE8A00V620121101.
26 M. Fischetti, “Did climate change cause Hurricane Sandy?” Scientific American, October 30, 2012. http://blogs.scientificamerican.com/observa-tions/2012/10/30/did-climate-change-cause-hur-ricane-sandy/. See also C. H. Greene, “An Arctic Wildcard in the Weather,” Oceanography 25, no. 2 (2012), http://www.tos.org/oceanography/ar-chive/25-2_greene.html.
27 White House, “Remarks by the President on Elec-tion Night,” November 7, 2012, http://www.white-house.gov/the-press-office/2012/11/07/remarks-president-election-night.
28 Jordi Vaquer, “Reclaiming Democratic Demands from the Populists,” openDemocracy, July 10, 2012, http://www.opendemocracy.net/jordi-vaquer/reclaiming-democratic-demands-from-populists.

38 GLOBAL ECONOMY AND DEVELOPMENT PROGRAM
29 Conor Friedersdorf, “The Cult of Smartness: How Meritocracy Is Failing America,” The Atlantic, June 14, 2012.
30 White House, National Security Strategy, 2010, http://www.whitehouse.gov/sites/default/files/rss_viewer/national_security_strategy.pdf.
31 “National Economic Accounts: Gross Domestic Product,” Bureau of Economic Analysis, U.S. De-partment of Commerce, 2012, http://www.bea.gov/national/index.htm; “Historical National Pop-ulation Estimates: July 1, 1900, to July 1, 1999,” Population Estimates Program, Population Divi-sion, U.S. Census Bureau, http://www.census.gov/popest/data/national/totals/pre-1980/tables/popclockest.txt.
32 These data are for 1948–2011; U.S. Bureau of Labor Statistics, 2012, http://data.bls.gov/cgi-bin/surveymost?bls.
33 Michael Greenstone and Adam Looney, “Trends,” Milken Institute Review, Third Quarter 2011, 11.
34 World Economic Forum, The Global Competitive-ness Report 2012–2013 (Geneva: World Eco-nomic Forum, 2012).
35 European Commission, “Eurostat: R&D Expendi-ture,” data compiled using OECD figures, 2011, http://epp.eurostat.ec.europa.eu/statistics_ex-plained/index.php/R_%26_D_expenditure ; OECD, OECD Economic Outlook 2012; World Bank, World DataBank: World Development In-dicators (Washington: World Bank, 2012), http://databank.worldbank.org/ddp/home.do.
36 Times Higher Education, World University Rank-ings 2011–12, 2011, http://www.timeshigh-ereducat ion.co.uk/wor ld-universi ty-rank-ings/2011-2012/top-400.html; National Science Foundation, Science and Engineering Indicators 2012 (Washington: National Science Founda-tion, 2012), “Chapter 5: Academic Research and Development,” http://www.nsf.gov/statistics/seind12/c5/c5h.htm; U.S. Patent and Trademark Office, “Extended Year Set: Patents by Country, State and Year—All Patent Types,” 2011, http://www.uspto.gov/web/offices/ac/ido/oeip/taf/cst_allh.htm.
37 Mitch Waldrop, DARPA and the Internet Revolu-tion: 50 Years of Bridging the Gap, (Washington: Defense Advanced Research Projects Agency, U.S. Department of Defense, 2008).
38 Lauren Setar and Matthew MacFarland, “Top 10 Fastest-Growing Industries,” IBISWorld, Special Report, April 2012, http://www.ibisworld.com/Common/MediaCenter/Fastest%20Growing%20Industries.pdf.
39 Abdul Ali, Candida Brush, Julio De Castro, Julian Lange, Thomas Lyons, Moriah Meyskens, Jo-seph Onochie, Ivory Phinisee, Edward Rogoff, Al Suhu and John Whitman, National Entrepreneur-ial Assessment for the United States of America: 2010 United States Report (Babson Park, Mass.: Global Entrepreneurship Monitor, 2010); Kelly Services, Talent Mobility: The Evolving Work-force, KellyOCG, 2011, http://www.kellyocg.com/Knowledge/Kelly_Global_Workforce_Index/Tal-ent_Mobility_-_The_Evolving_Workforce/.
40 Dane Stangler and Robert E. Litan, “Where Will the Jobs Come From?” Kauffman Foundation Research Series: Firm Foundation and Economic Growth. 2009; Ewing Marion Kauffman Founda-tion, Kansas City.
THE UNITED STATES AFTER THE GREAT RECESSION 39
41 Amar Bhide, The Venturesome Economy: How In-novation Sustains Prosperity in a More Connect-ed World (Princeton, N.J.: Princeton University Press, 2008).
42 Ibid.
43 National Bureau of Economic Research, U.S. Business Cycle Expansions and Contractions, 2010, http://www.nber.org/cycles.html.
44 C. K. Elwell, Economic Recovery: Sustaining U.S. Economic Growth in a Post-Crisis Economy ((Washington: Congressional Research Service, 2012), http://www.fas.org/sgp/crs/misc/R41332.pdf.
45 World Economic Forum, The Global Competitive-ness Report 2012–2013 (Geneva: Klaus Schwab for the World Economic Forum, 2012), http://www3.weforum.org/docs/WEF_GlobalCompeti-tivenessReport_2012-13.pdf
46 Ibid.
47 Michael E. Porter and Jan W. Rivkin, Prosperity at Risk: Findings of Harvard Business School’s Sur-vey on U.S. Competitiveness (Cambridge, Mass.: Harvard Business School, 2012).
48 James Manyika, Susan Lund, Byron Auguste, Lenny Mendonca, Tim Welsh and Sreenivas Ra-maswamy, An Economy That Works: Job Cre-ation and America’s Future (San Francisco: McK-insey Global Institute, 2011).
49 World Bank, World DataBank.
50 Greenstone and Looney, “Trends.”
51 World Economic Forum, Global Competitiveness Report 2012–2013.
52 American Society of Civil Engineers, Report Card for America’s Infrastructure (Reston, Va.: Ameri-can Society of Civil Engineers, 2009), 7, http://infrastructurereportcard.org/sites/default/files/RC2009_full_report.pdf.
53 OECD, Lessons from PISA for the United States: Strong Performers and Successful Reformers in Education (Paris: OECD, 2011).
54 Federal Reserve Bank of New York, Quarterly Report on Household Debt and Credit, Novem-ber 2012, http://www.newyorkfed.org/research/national_economy/householdcredit/DistrictRe-port_Q32012.pdf
55 Charles Roxburgh, Susan Lund, Tony Wimmer, Eric Amar, Charles Atkins, Ju-Hon Kwek, Richard Dobbs and James Manyika, Debt and Deleverag-ing: The Global Credit Bubble and Its Economic Consequences: Updated Analysis (San Francis-co: McKinsey Global Institute, 2011).
56 Ibid.
57 Karen Dynan, Is A Household Debt Overhang Holding Back Consumption? (Washington: Brook-ings Institution, 2012; U.S. Department of Com-merce, National Data: GDP & Personal Income, 2012, http://www.bea.gov/iTable/index_nipa.cfm.
58 USGovernmentSpending.com, U.S. To-tal Government Debt, 2012, http://www.usgovernmentspend ing .com/spend ing_chart_1940_2016USp_13s1li011lcn_H0t_US_Total_Government_Debt.
59 Congressional Budget Office, The Budget and Economic Outlook: Fiscal Years 2012 to 2022, 2012, http://www.cbo.gov/sites/default/files/cbo-files/attachments/01-31-2012_Outlook.pdf.
60 Congressional Budget Office, Economic Effects of Policies Contributing to Fiscal Tightening in 2013, November 2012.
61 Federal Reserve,” Chairman Ben S. Bernanke at the Banque de France Financial Stability Review Launch Event, Paris,” February 18, 2011, http://www.federalreserve.gov/newsevents/speech/bernanke20110218a.htm.
40 GLOBAL ECONOMY AND DEVELOPMENT PROGRAM
62 Department of Economics and Social Affairs (UN-DESA), United Nations, World Population Pros-pects, the 2010 Revision, 2010, http://esa.un.org/unpd/wpp/index.htm.
63 Ibid.; U.S. National Center for Education Statis-tics, “Digest of Education Statistics: Table 276, College Enrollment of Recent High School Com-pleters,” 2011, http://www.census.gov/compen-dia/statab/2012/tables/12s0276.xls.
64 Bureau of Economic Analysis, “National Income and Product Accounts Tables,” 2012, http://www.bea.gov/iTable/iTable.cfm?ReqID=9&step=1; Anthony B. Atkinson, Thomas Piketty and Em-manual Saez, “Top Incomes in the Long Run of History,” Journal of Economic Literature 49, no. 1 (2011): 3–71, http://elsa.berkeley.edu/~saez/atkinson-piketty-saezJEL10.pdf.
65 Atkinson, Thomas and Saez, “Top Incomes,” table 2.3.5.
66 OECD, “Better Life Index,” 2012, http://www.oecd-betterlifeindex.org.
67 Federal Reserve Bank of New York, Quarterly Report on Household Debt and Credit, May 2012, http://www.newyorkfed.org/research/na-tional_economy/householdcredit/DistrictReport_Q12012.pdf.
68 Ibid.
69 OECD, “Income Distribution: Inequal-ity Measure,” http://stats.oecd.org/Index.aspx?DatasetCode=INEQUALITY. Congressio-nal Budget Office data are based on market in-come, before taxes and government transfers.
70 Uri Dadush, Kemal Dervis, Sarah Puritz Milsom and Bennett Stancil, Inequality in America: Facts, Trends, and International Perspectives (Washing-ton: Brookings Institution Press, 2012), 14.
71 U.S. Department of the Treasury, Income Mobility in the U.S. from 1996 to 2005 (Washington: U.S. Government Printing Office, 2007), http://www.treasury.gov/resource-center/tax-policy/Docu-ments/incomemobilitystudy03-08revise.pdf.
72 OECD, “A Family Affair: Intergenerational Social Mobility across OECD Countries,” chap. 5 in Eco-nomic Policy Reforms: Going for Growth 2010 (Paris: OECD, 2010).
73 OECD, “Growing Income Inequality in OECD Countries: What Drives It and How Can Policy Tackle It?” paper presented at Forum on Tackling Inequality, Paris, May 2, 2011; Pew Research Center, Partisan Polarization Surges.
74 Linda Levine, The U.S. Income Distribution and Mobility: Trends and International Comparisons (Washington: Congressional Research Ser-vice, 2012), http://www.fas.org/sgp/crs/misc/R42400.pdf.
75 OECD, Divided We Stand: Why Inequality Keeps Rising (Paris: OECD, 2011).
76 International Monetary Fund, “IMF e-Library Data,” 2011, http://elibrary-data.imf.org/. This fig-ure represents imports in goods to the U.S. from developing countries, excluding the BRICS. The figure is substantially higher for emerging and de-veloping countries, at 55 percent, which includes the BRICS.
77 Paul Krugman, Trade and Inequality Re-visited, 2007, http://www.voxeu.org/index.php?q=node/261; OECD, Divided We Stand.
78 World Bank, World DataBank.
79 OECD, Divided We Stand.
80 Levine, U.S. Income Distribution.
81 Tax Policy Center, “Historical Effective Federal Tax Rates for All Households, April 4, 2011, http://www.taxpolicycenter.org/taxfacts/displayafact.cfm?Docid=456.

THE UNITED STATES AFTER THE GREAT RECESSION 41
82 U.S. Bureau of Labor Statistics, Economic News Release: Union Membership (Annual), 2012, http://www.bls.gov/news.release/union2.toc.htm.
83 OECD, Divided We Stand.
84 Bureau of Transportation Statistics, Research and Innovative Technology Administration, “4-2 Aver-age Household Expenditures by Major Spending Category: 2010,” http://www.bts.gov/publications/pocket_guide_to_transportation/2012/html/fig-ure_04_02_table.html.
85 OECD, “OECD Health Data: How Does Germany Compare?” 2012, http://www.oecd.org/health/healthpoliciesanddata/BriefingNoteGERMA-NY2012.pdf.
86 Council of Economic Advisers, Executive Office of the President, “The Economic Effects of Health Care Reform on Small Business and Their Em-ployees,” July 25, 2009, http://www.whitehouse.gov/assets/documents/CEA-smallbusiness-ju-ly24.pdf.
87 Atlantic/Aspen Institute, “The Atlantic/Aspen Insti-tute American Values Survey,” 2012, http://www.slideshare.net/BMGlobalNews/the-atlanticaspen-institute-american-values-survey.
88 Pew Charitable Trusts, Economic Mobility and the American Dream: Where Do We Stand in the Wake of the Great Recession? (Washington: Pew Charitable Trusts, 2011), http://www.pewtrusts.org/uploadedFiles/wwwpewtrustsorg/Reports/Economic_Mobility/Economic_Mobility_Post_Recession_Poll.pdf.
89 White House, The Council on Environmental Quality: About, 2012, http://www.whitehouse.gov/administration/eop/ceq/about; U.S. Environmen-tal Protection Agency, “EPA History,” 2012, http://www.epa.gov/history/.
90 U.S. Environmental Protection Agency, “Clean Air Act,” 2012, http://www.epa.gov/air/caa/; U.S. Environmental Protection Agency, “Clean Wa-ter Act,” 2012, http://cfpub.epa.gov/npdes/cwa.cfm?program_id=45.
91 Jan-Peter Voss, “Innovation Processes in Gover-nance: The Development of Emissions Trading as a New Policy Instrument,” Science and Public Policy (Ingentaconnect) 5, no. 34 (2007–6): 329–43.
92 Gabriel Chan, Robert Stavins, Robert Stowe and Richard Sweeney, “The SO2 Allowance Trading System and the Clean Air Act Amendments of 1990: Reflections on Twenty Years of Policy In-novation,” Harvard Kennedy School, Cambridge, Mass., 2012, http://www.hks.harvard.edu/m-rcbg/heep/papers/SO2-Brief_digital_final.pdf; Clean Air Market Programs, “Cap and Trade: Acid Rain Program Results,” n.d., www.epa.gov/ca-pandtrade/documents/ctresults.pdf.
93 U.S. Environmental Protection Agency, “Six Common Pollutants,” in Our Nation’s Air: Sta-tus and Trends through 2010, Report EPA-454/R-12-001, 2012.
94 U.S. Environmental Protection Agency, “Progress in Water Quality: An Evaluation of the National Investment in Municipal Wastewater Treatment,” 2000, http://water.epa.gov/polwaste/wastewater/treatment/benefits.cfm.
95 U.S. Energy Information Administration, Country Analysis Brief: Total Primary Energy (Quadrillion Btu), 2012, http://www.eia.gov/countries/country-data.cfm?fips=US&trk=m#tpe.
96 Scott Barrett, Why Cooperate? The Incentive to Supply Global Public Goods (Oxford: Oxford Uni-versity Press, 2007).
97 Pew Research Center, Partisan Polarization Surges.
98 Ibid.
42 GLOBAL ECONOMY AND DEVELOPMENT PROGRAM
99 Joint Economic Committee, U.S. Congress, The 1990 Economic Report of the President: Hear-ings Before the Joint Economic Committee, Con-gress of the United States, One Hundred First Congress, Second Session, January 24 and 30, February 2 and 8, and March 15, 1990, 212, http://openlibrary.org/b/OL1986428M/1990_Eco-nomic_report_of_the_President; Intergovern-mental Negotiating Committee for a Framework Convention on Climate Change, “Preparation of a Framework Convention on Climate Change: Set of Informal Papers Provided by Delegations, Related to the Preparation of a Framework Con-vention on Climate Change, Note by the Secre-tariat,” Second Session, June 19–28, 1991, ref A/AC.237/Misc.1, 13, 94, http://unfccc.int/documen-tation/documents/advanced_search/items/6911.php?priref=600000014.
100 Ibid., 2.
101 White House, “Text of a Letter from the President to Senators Hagel, Helms, Craig, and Roberts, March 13, 2001,” http://georgewbush-whitehouse.archives.gov/news/releases/2001/03/20010314.html.
102 Worldwatch Institute, The State of Consump-tion Today, 2011, http://www.worldwatch.org/node/810.
103 James D. Hamilton, “Oil Prices, Exhaustible Re-sources and Economic Growth,” October 18, 2011, http://dss.ucsd.edu/~jhamilto/handbook_climate.pdf.
104 Joachim von Braun, “High and Rising Food Pric-es: Why Are They Rising, Who Is Affected, How Are They Affected, and What Should Be Done?” paper presented at U.S. Agency for International Development (USAID) conference on “Address-ing the Challenges of a Changing World Food Sit-uation: Preventing Crisis and Leveraging Oppor-tunity,” April 11, 2008, http://www.ifpri.org/sites/default/files/pubs/presentations/20080411jvbfoodprices.pdf; U.S. Energy Information Administra-tion, “Short-Term Energy Outlook, “July 10, 2012, http://www.eia.gov/forecasts/steo/index.cfm.
105 Muriel Boselli, “Oil Price Still Serious Risk to Glob-al Recovery: IEA.” Reuters, May 16, 2012.
106 John Elder and A. Serletis, “Oil Price Uncer-tainty,” Journal of Money, Credit and Bank-ing, 2010, http://papers.ssrn.com/sol3/papers.cfm?abstract_id=908675.
107 International Monetary Fund, World Economic Outlook: Tensions from the Two Speed Recov-ery—Unemployment, Commodities, and Capi-tal Flows (Washington: International Monetary Fund, 2011), http://www.imf.org/external/pubs/ft/weo/2011/01/index.htm.
108 U.S. Energy Information Administration, “Interna-tional Energy Statistics: Per Capita Carbon Diox-ide Emissions from the Consumption of Energy (Metric Tons of Carbon Dioxide per Person),” 2012, http://www.eia.gov/cfapps/ipdbproject/iedindex3.cfm?tid=90&pid=45&aid=8&cid=regions&syid=2006&eyid=2010&unit=MMTCD.

THE UNITED STATES AFTER THE GREAT RECESSION 43
109 U.S. Energy Information Administration, “Total Carbon Dioxide Emissions from the Consump-tion of Energy (Million Metric Tons), 1980 to 2010, 2012, http://www.eia.gov/cfapps/ipdbproject/iedindex3.cfm?tid=90&pid=44&aid=8&cid=US,&syid=1980&eyid=2010&unit=MMTCD; Office of the Special Envoy for Climate Change, U.S. Department of State, “Letter to Mr Yvo de Boer regarding the Copenhagen Accord,” January 28, 2010, http://unfccc.int/files/meetings/cop_15/co-penhagen_accord/application/pdf/unitedstatesc-phaccord_app.1.pdf.
110 United Nations Environment Program, The Emis-sions Gap Report: Are the Copenhagen Accord Pledges Sufficient to Limit Global Warming to 2°C or 1.5°C? A Preliminary Assessment (Nairobi United Nations Environment Program, 2010).
111 Sven Harmeling, Global Climate Index 2011: Who Suffers Most from Extreme Weather Events? Weather-Related Loss Events in 2009 and 1990 to 2009 (Bonn: Germanwatch, 2011).
112 Roger A.Pielke Jr., Joel Gratz, Christopher W. Landsea, Douglas Collins, Mark A. Saunders and Rade Musulin, “Normalized Hurricane Damage in the United States: 1900–2005,” Natural Haz-ards Review 9, no. 1 (2008): 29–42. For GDP Projections, see Congressional Budget Office, “Budget and Economic Outlook: Fiscal Years 2011 to 2021,” 2011, http://www.cbo.gov/publica-tion/21999.
113 James Hansen, Makiko Sato and Reto Ruedy, “Perceptions of Climate Change: The New Climate Dice,” 2012, http://www.columbia.edu/~jeh1/mailings/2012/20120105_Perception-sAndDice.pdf.
114 Yale Project on Climate Change Communication and George Mason University Center for Climate Change Communication, Extreme Weather, Cli-mate & Preparedness In the American Mind (New Haven, Conn.: Yale University, 2012).
115 Maplecroft, ” Maplecroft Index Identifies Bahrain, Qatar, Kuwait and Saudi Arabia as World’s Most Water-Stressed Countries,” May 25, 2011, http://maplecroft.com/about/news/water_stress_index.html.
116 Office of the Director of National Intelligence, “Global Water Security, 2012, http://www.dni.gov/files/documents/Newsroom/Press%20Releases/ICA_Global%20Water%20Security.pdf.
117 Natural Resources Defense Council, “Climate Change, Water and Risk: Current Water De-mands Are Not Sustainable,” NRDC Factsheet, 2010, http://www.nrdc.org/globalWarming/water-sustainability/files/WaterRisk.pdf.
118 National Climatic Data Center, National Oceanic and Atmospheric Administration, “State of the Cli-mate: National Overview, June 2012,” http://www.ncdc.noaa.gov/sotc/national/2012/6.
119 “GRAINS-U.S. Corn Firm, Soybeans Slip on Rain Forecasts,” Reuters, August 2, 2012; Economic Research Service, U.S. Department of Agriculture, “U.S. Drought 2012: Farm and Food Impacts,” 2012, http://www.ers.usda.gov/newsroom/us-drought-2012-farm-and-food-impacts.aspx.
120 Answers to this question vary from 53 to 74 per-cent saying the wrong track; 26 to 43 percent say the right track in various polls conducted this year. See Marist College Institute for Public Opinion, “McClatchy-Marist Poll National Survey, March 26, 2012,” http://s3.documentcloud.org/docu-ments/328329/mcclatchy-marist-poll-politics.pdf; Ramussen Reports, “Right Direction or Wrong Track: 29% say U.S. Heading in Right Direction,” August 1, 2012, http://www.rasmussenreports.com/public_content/politics/mood_of_america/right_direction_or_wrong_track/; and Naftali Ben-david, “Country Is Headed in Wrong Direction, 74% Say,” Wall Street Journal, October 13, 2011, http://online.wsj.com/article/SB10001424052970204774604576627180456112672.html.

44 GLOBAL ECONOMY AND DEVELOPMENT PROGRAM
121 John Maynard Keynes, The Great Slump of 1930 (London: Nation & Athenæum, 1930).
122 Group of Twenty, “London Summit: Leaders’ Statement,” April 3, 2009, http://www.canadain-ternational.gc.ca/g20/summit-sommet/g20/decla-ration_010209.aspx?view=d.
123 Ibid.; International Monetary Fund, World Eco-nomic Outlook: Growth Resuming, Dangers Re-main (Washington: International Monetary Fund, 2012).
124 Gary Burtless, “Employment Gains Keep Pace with Population Growth, but Leave Job Deficit Unchanged,” August 3, 2012, Brookings Insti-tution, Washington, http://www.brookings.edu/blogs/jobs/posts/2012/08/03-jobs-burtless.
125 White House, “Blueprint for An America Built to Last,” January 24, 2012, http://www.whitehouse.gov/sites/default/files/blueprint_for_an_ameri-ca_built_to_last.pdf; Mitt Romney, “Mitt Romney Delivers Remarks: Freedom and Opportunity,” March 30, 2012, http://www.mittromney.com/blogs/mitts-view/2012/03/mitt-romney-delivers-remarks-wisconsin-freedom-and-opportunity.
126 UNDESA, World Population Prospects.
127 U.S. Census Bureau, “The Older Population: 2010,” November 2011, http://www.census.gov/prod/cen2010/briefs/c2010br-09.pdf.
128 Congressional Budget Office, “The 2012 Long-Term Budget Outlook: Federal Debt Held by the Public, 1912 to 2037, June 2012, http://www.cbo.gov/sites/default/files/cbofiles/attachments/06-05-Long-Term_Budget_Outlook.pdf.
129 UNDESA, World Population Prospects.
130 Congressional Budget Office, “2012 Long-Term Budget Outlook.”
131 UNDESA, World Urbanization Prospects, the 2011 Revision, http://esa.un.org/unpd/wup/index.htm; Negative Population Growth, “Historical U.S.
Population Growth by Year 1900–1998,” 2012, http://www.npg.org/facts/us_historical_pops.htm.
132 Michele Hoyman and Christopher Faricy, “It Takes a Village: A Test of the Creative Class, Social Capi-tal and Human Capital Theories,” Urban Affairs Review, January 2009, http://papers.ssrn.com/sol3/papers.cfm?abstract_id=1313563; S. Kratke, “‘Creative Cities’ and the Rise of the Dealer Class: A Critique of Richard Florida’s Approach to Urban Theory,” International Journal of Urban and Region-al Research 34 (2010): 835–53, http://onlinelibrary.wiley.com/doi/10.1111/j.1468-2427.2010.00939.x/abstracthttp://onlinelibrary.wiley.com/doi/10.1111/j.1468-2427.2010.00939.x/abstract.
133 Edward L. Glaeser and Matthew E. Kahn, Sprawl and Urban Growth, NBER Working Paper 9733 (Cambridge, Mass.: National Bureau of Econom-ic Research, 2003), http://people.missouristate.edu/davidmitchell/Urban/Sprawl%20and%20Urban%20Growth.pdf.
134 Federal Highway Administration, U.S. Depart-ment of Transportation, “Highway Statistics 2008: Licensed Drivers, Vehicle Registrations and Resi-dent Population,” 2008, http://www.fhwa.dot.gov/policyinformation/statistics/2008/dv1c.cfm.
135 David Leonhardt, “Old vs. Young,” New York Times, June 22, 2012, http://www.nytimes.com/2012/06/24/opinion/sunday/the-generation-gap-is-back.html?_r=1.
136 U.S. Census Bureau, U.S. Department of Com-merce, “Voting and Registration: Historical Time Series Tables,” 2012, http://www.census.gov/hhes/www/socdemo/voting/publications/histori-cal/index.html.
137 Mark Hugo Lopez and D’Vera Cohn, “Hispanic Poverty Rate Highest in New Supplemental Cen-sus Data,” Pew Hispanic Center, November 8, 2011, http://www.pewhispanic.org/2011/11/08/hispanic-poverty-rate-highest-in-new-supple-mental-census-measure/.

THE UNITED STATES AFTER THE GREAT RECESSION 45
138 Pew Charitable Trusts, “Economic Mobility and the American Dream: Examining Racial and Eth-nic Differences,” Fact Sheet, March 2012, http://www.pewtrusts.org/uploadedFiles/wwwpewtrust-sorg/Reports/Economic_Mobility/Pew-Economic-Mobility-Race.pdf.
139 Frank Newport, Jeffrey M. Jones and Lydia Saad, “Democrats More Liberal, Less White Than in 2008: Party Generally Looks Demographi-cally Similar to 2008,” November 7, 2011, Gal-lup Politics, http://www.gallup.com/poll/150611/democrats-liberal-less-white-2008.aspx; Pew Research Center, “American Values Survey: Question Database—40e: It Is the Responsibility of the Government to Take Care of People Who Can’t Take Care of Themselves, 2012, http://www.people-press.org/values-questions/q40e/government-should-care-for-people-who-cant-care-for-themselves/#race.
140 Nolan McCarty, Keith T. Poole and Howard Rosen-thal, Polarized America: The Dance of Ideology and Unequal Riches (Walras-Pareto Lectures) (Cambridge, Mass.: MIT Press, 2006).
141 Brookings Institution, “The Negative Impact of the Use of Filibusters and Holds,” June 23, 2010, http://www.brookings.edu/research/testimony/2010/06/23-filibuster-mann.
142 Atif Mian, Amir Sufi and Francesco Trebbi, “Re-solving Debt Overhang: Political Constraints in the Aftermath of Financial Crisis,” June 2012, http://faculty.arts.ubc.ca/ftrebbi/research/mst4.pdf.
143 Bob Woodward, Maestro: Greenspan’s Fed and the American Boom (New York: Simon & Schus-ter, 2000).
144 Financial Crisis Inquiry Commission, “The Finan-cial Crisis Inquiry Report: Final Report of the Na-tional Commission on the Causes of the Financial and Economic Crisis in the United States,” January 2011, http://www.gpo.gov/fdsys/pkg/GPO-FCIC.
145 Harvard Kennedy School, “2006 Social Capi-tal Community Survey, National Sample,” 2006, http://www.hks.harvard.edu/saguaro/pdfs/2006SCCSbanner.pdf.
146 Ibid; Robert D. Putnam, Bowling Alone: The Col-lapse and Revival of American Community (New York: Simon & Schuster, 2000).
147 Paul Taylor, Cary Funk and April Clark, Americans and Social Trust: Who, Where and Why (Wash-ington: Pew Research Center, 2006), http://pe-wresearch.org/assets/social/pdf/SocialTrust.pdf.
148 Pew Research Center, “Economy Dominates Public’s Agenda, Dims Hopes for Future: Less Optimism about America’s Long-Term Pros-pects,” January 20, 2011, http://www.people-press.org/2011/01/20/section-2-views-of-long-term-future-past/.
149 Pew Research Center for the People & the Press, “The Generation Gap and the 2012 Election: An-gry Silents, Disengaged Millennials,” November 3, 2011, http://pewresearch.org/pubs/2122/gen-eration-gap-barack-obama-mitt-romney-repub-licans-democrats-silent-generation-millenials-genxers-baby-boomers.
150 White House, National Security Strategy.
151 Shrey Verma, Far-Reaching Consequences of the Naxalite Problem in India: Understanding the Maoist Problem (Santa Clara, Calif.: Rakshak Foundation, 2011), http://www.rakshakfounda-tion.org/wp-content/uploads/2011/08/White-Pa-per-on-Naxalite-Movement-in-India.pdf.
152 “Spending Shows Focus on Internal Threats,” Wall Street Journal, March 5, 2012, http://blogs.wsj.com/chinarealtime/2012/03/05/china-spend-ing-shows-focus-on-internal-threats/.

46 GLOBAL ECONOMY AND DEVELOPMENT PROGRAM
153 Uri Dadush and William Shaw, Juggernaut: How Emerging Markets are Reshaping Globalization (Washington: Carnegie Endowment for Interna-tional Peace, 2011), http://carnegieendowment.org/2011/05/31/juggernaut-how-emerging-mar-kets-are-reshaping-globalization/10a2.
154 International Energy Agency, Worldwide Trends in Energy Use and Efficiency (Paris: International Energy Agency, 2008).
155 U.S. Energy Information Administration, “Total Carbon Dioxide Emissions.”
156 National Highway Traffic Safety Administration, U.S. Department of Transportation, “Corporate Average Fuel Economy for MY 2017–MY 2025 Passenger Cars and Light Trucks,” Final Regula-tory Impact Analysis, August 2012, 55.
157 U.S. Energy Information Administration, Annual Energy Outlook 2012 with Projections to 2035 (Washington: U.S. Government Printing Of-fice, 2012), http://www.eia.gov/forecasts/aeo/pdf/0383(2012).pdf..
158 Barclays Capital, Global 2012 E&P Spend-ing Outlook: Spending to Reach Record Lev-els, December 5, 2011, http://www.scribd.com/doc/75004809/Global-2012-E-P-Spending-Out-look-BarCap-12052011.
159 Leonardo Maugeri, Oil: The Next Revolution—The Unprecedented Upsurge of Oil Production Ca-pacity and What It Means for the World, Discus-sion Paper 2012-10 (Cambridge, Mass.: Belfer Center for Science and International Affairs, Har-vard Kennedy School, 2012), http://belfercenter.ksg.harvard.edu/publication/22144/oil.html.
160 Florence Gény, “Can Unconventional Gas Be a Game Changer in European Gas Markets?” De-cember 2010, Oxford Institute for Energy Stud-ies, Oxford, http://www.sbc.slb.com/SBCInsti-tute/Publications/~/media/Files/Point%20of%20View%20Docs/Can%20Unconventional%20Gas%20be%20a%20Game%20Changer%20in%20European%20Gas%20Markets.ashx.
161 Federal Reserve Board, “Testimony of Chairman Alan Greenspan: Natural Gas Supply—Before the Committee on Energy and Natural Resources, U.S. Senate, July 10, 2003,” http://www.federalre-serve.gov/boarddocs/testimony/2003/20030710/default.htm.
162 International Energy Agency, World Energy Out-look 2006 (Paris: OECD and International Energy Agency, 2006).
163 U.S. Energy Information Administration, “U.S. Proved Reserves Increased Sharply in 2010,” August 2, 2012, http://www.eia.gov/todayinen-ergy/detail.cfm?id=7370.
164 U.S. Energy Information Administration, “Natural Gas–Shale Gas Production (Billion Cubic Feet),” 2012, http://www.eia.gov/dnav/ng/ng_prod_shalegas_s1_a.htm; U.S. Energy Information Administration, “Global Natural Gas Prices Vary Considerably,” September 30, 2011, http://www.eia.gov/todayinenergy/detail.cfm?id=3310.
165 Henry D Jacoby, Francis O’Sullivan and Sergey Paltsev, The Influence of Shale Gas on U.S. En-ergy and Environmental Policy. Report 207 (Cam-bridge, Mass.: MIT Joint Program on the Science and Policy of Global Change, 2011), http://glo-balchange.mit.edu/files/document/MITJPSPGC_Rpt207.pdf.
166 Pew Research Center, Partisan Polarization Surges.

THE UNITED STATES AFTER THE GREAT RECESSION 47
167 Andrew Hart, Bruce Jones and David Steven, Chill Out: Why Cooperation Is Balancing Conflict among Major Powers in the New Arctic (Washing-ton: Brookings Institution Press, 2012).
168 Jennifer Steinhauer. “Dole Appears, but G.O.P Rejects a Disabilities Treaty”. New York Times, December 4, 2012. http://www.nytimes.com/2012/12/05/us/despite-doles-wish-gop-re-jects-disabilities-treaty.html?_r=0
169 United Nations Secretary-General’s High-Level Panel on Global Sustainability, “Resilient People, Resilient Planet—A Future Worth Choosing,” 2012, http://www.un.org/gsp/sites/default/files/at-tachments/GSP_Report_web_final.pdf.
170 National Federation of Republican Assemblies, “RNC Adopts Resolution Exposing Agenda 21,” January 18, 2012, http://www.republicanassem-blies.org/rnc-adopts-resolution-exposing-agen-da-21/.
171 Jason Blackstock, “Researchers Can’t Regulate Climate Engineering Alone,” Nature 486 (June 14, 2012).
172 Marc Labonte, Changing the Federal Reserve’s Mandate: An Economic Analysis (Washington: Congressional Research Service, 2012), http://www.fas.org/sgp/crs/misc/R41656.pdf.
173 U.S. Senate Committee on Energy and Natural Resources, “Natural Gas for Transportation,” July 24, 2012, http://www.energy.senate.gov/public/index.cfm/democratic-news?ContentRecord_id=123ecf9c-af80-4dbb-b6d4-e328cd0a53ab; Alternative Fuels Data Center, U.S. Department of Energy, “Federal Incentives and Laws for Natu-ral Gas,” 2012, http://www.afdc.energy.gov/laws/laws/US/tech/3253.
174 Warwick J. McKibbin, Adele Morris and Peter J. Wilcoxen, “The Potential Role of a Carbon Tax in U.S. Fiscal Reform,” Brookings Institution, Wash-ington, July 24, 2012, http://www.brookings.edu/research/papers/2012/07/carbon-tax-mckibbin-morris-wilcoxen.
175 Barnosky et al., “Approaching a State Shift in Earth’s Biosphere.”
176 Kenneth Lieberthal and Wang Jisi, Addressing U.S.-China Strategic Distrust, John L. Thornton China Center Monograph 4 (Washington: Brook-ings Institution, 2012).
177 Bureau of Economic Analysis, “National Income and Product Accounts GDP: Third Quarter 2012,” http://www.bea.gov/newsreleases/national/gdp/gdpnewsrelease.htm.
178 A. Kowalski and P. Gopal, “Housing Starts Jump 15% to Four-Year U.S. High,” Bloomberg, Oc-tober 17, 2012, http://www.bloomberg.com/news/2012-10-17/housing-starts-in-u-s-surged-in-september-to-four-year-high.html.
179 Evans, Jones and Steven, Confronting the Long Crisis.
180 Labonte, Changing the Federal Reserve’s Man-date.
181 House Committee on the Budget, “The Path to Prosperity: Restoring America’s Promise: Fiscal Year 2012 Budget Resolution,” 2012, http://www.gop.gov/resources/library/documents/budget/path-to-prosperity.pdf.
182 John M. Broder, “Powerful Shaper of U.S. Rules Quits, with Critics in Wake,” New York Times, August 3, 2012, http://www.nytimes.com/2012/08/04/science/earth/cass-sunstein-to-leave-top-regulatory-post.html?_r=1.
183 Consumer Financial Protection Bureau, “Learn about the Bureau,” 2012, http://www.consumerfi-nance.gov/the-bureau/.
48 GLOBAL ECONOMY AND DEVELOPMENT PROGRAM
184 Pew Research Center, Partisan Polarization Surges.
185 Manyika et al., An Economy That Works.
186 International Trade Administration, “Jobs Sup-ported by Exports: An Update,” March 12, 2012, http://www.trade.gov/press/press-releases/2012/jobs-supported-by-exports-031212.pdf.
187 P. J. Egan and M. Mullin, “Turning Personal Expe-rience into Political Attitudes: The Effect of Local Weather on Americans’ Perceptions about Glob-al Warming,” Journal of Politics 74, no. 3 (July 2012): 796–809.
188 Yale Project on Climate Change Communication and George Mason University Center for Climate Change Communication, Extreme Weather.
189 Hansen, Sato and Ruedy, “Perceptions of Climate Change.”
190 Center on Budgets and Policy Priorities, “Chart Book: The Legacy of the Great Recession,” Sep-tember 11, 2012, http://www.cbpp.org/cms/index.cfm?fa=view&id=3252.
191 Congressional Budget Office,. “Estimated Impact of the American Recovery and Reinvestment Act on Employment and Economic Output from April 2012 through June 2012,” 2012, http://cbo.gov/sites/default/files/cbofiles/attachments/08-23-2012-RecoveryAct.pdf.
192 Michael Greenstone and Adam Looney, “The Role on of Fiscal Stimulus in the Ongoing Re-covery,” Brookings Institution, Washington, 2012, http://www.brookings.edu/blogs/jobs/posts/2012/07/06-jobs-greenstone-looney.
193 Daniel J. Wilson, Fiscal Spending Jobs Multipli-ers: Evidence from the 2009 American Recovery and Reinvestment Act, Working Paper 2010-17 (San Francisco: Federal Reserve Bank of San Francisco, 2011), http://www.frbsf.org/publica-tions/economics/papers/2010/wp10-17bk.pdf.
194 “Speech by Chairman Ben S. Bernanke at the Federal Reserve Bank of Kansas City Economic Symposium, Jackson Hole, Wyoming,” August 31, 2012, http://www.federalreserve.gov/newsev-ents/speech/bernanke20120831a.htm.
195 Federal Reserve Bank, “Press Release,” Septem-ber 13, 2012, http://www.federalreserve.gov/new-sevents/press/monetary/20120913a.htm.
196 Scott Sumner, “e-Targeting the Fed,” National Af-fairs, issue no. 9 (Fall 2011), http://www.nationalaf-fairs.com/publications/detail/re-targeting-the-fed.
197 Robin Harding and James Politi, “Fed Risks Po-litical Fallout from QE3,” Financial Times, Sep-tember 14, 2012, http://www.ft.com/intl/cms/s/0/b7de9070-fe77-11e1-8028-00144feabdc0.html#axzz26TJAxKZu.
198 Federal Reserve Bank, “Press Release.”
199 Ayşegül Şahin, Joseph Song, Giorgio Topa and Giovanni L. Violante, “Mismatch Unemployment,” 2012, http://www.newyorkfed.org/research/econ-omists/sahin/USmismatch.pdf.
200 Nir Jaimovich and Henry E. Siu, “The Trend Is the Cycle: Job Polarization and Jobless Recoveries,” March 31, 2012, http://faculty.arts.ubc.ca/hsiu/re-search/polar20120331.pdf.
201 Bureau of Labor Statistics, U.S. Department of Labor, “Economics News Release: Table A-15. Alternative Measures of Labor Underutilization,” September 7, 2012, http://www.bls.gov/news.re-lease/empsit.t15.htm.
202 Federal Reserve Bank, “Testimony of Chairman Ben S. Bernanke at the Committee on the Bud-get, U.S. House of Representatives, Washington, D.C.—The Economic Outlook and the Federal Budget Situation,” February 2, 2012, http://www.federalreserve.gov/newsevents/testimony/ber-nanke20120202a.htm. Chairman Bernanke pre-sented identical remarks before the Committee on the Budget, U.S. Senate, on February 7, 2012.
THE UNITED STATES AFTER THE GREAT RECESSION 49
203 Ibid.
204 National Employment Law Project, The Low-Wage Recovery and Growing Inequality, Data Brief, Au-gust 2012, http://www.nelp.org/page/-/Job_Cre-ation/LowWageRecovery2012.pdf?nocdn=1.
205 Manyika et al., An Economy That Works.
206 Justin Weidner and John C. Williams, “What Is the New Normal Unemployment Rate?” FRBSF Eco-nomic Letter, February 14, 2011, http://www.frbsf.org/publications/economics/letter/2011/el2011-05.html.
207 Lena Jacobi and Jochen Kluve, “Before and After the Hartz Reforms: The Performance of Active Labour Market Policy in Germany,” 2007, http://doku.iab.de/zaf/2007/2007_1_zaf_jacobi_kluve.pdf.
208 Martin Neil Baily, U.S. Manufacturing Makes a Comeback, Brookings Institution, Washing-ton, 2012, http://www.brookings.edu/research/opinions/2012/05/18-manufacturing-comeback-katz-baily.
209 “A Third Industrial Revolution,” The Economist, April 21, 2012, http://www.economist.com/node/21552901.
210 Bruce Katz, “Will the Next President Remake Federalism?” Brookings Institution, Washington, March 18, 2012, http://www.brookings.edu/re-search/articles/2012/03/18-federalism-katz.
211 OECD, Pisa 2009 Results: Executive Summary (Paris: OECD, 2010), figure 1, http://www.oecd.org/pisa/46643496.pdf.
212 McKinsey & Company, The Economic Impact of the Achievement Gap in America’s School (New York: McKinsey & Company, 2009, http://mckin-seyonsociety.com/downloads/reports/Education/achievement_gap_report.pdf.
213 Meghan Brenneman, Patrick Callan, Peter Ewell, Joni Finney, Dennis Jones and Stacey Zis, Good Policy, Good Practice II: Improving Outcomes and Productivity in Higher Education: A Guide for Policymakers, Joint Report from National Center for Public Policy and Higher Education and Na-tional Center for Higher Education Management Systems, November 2010.
214 Democratic National Committee, “2012 Demo-cratic National Platform: Moving America For-ward,” http://www.democrats.org/democratic-na-tional-platform.
215 McKinsey & Company, How the World’s Best-Per-forming School Systems Come Out on Top (New York: McKinsey & Company, 2007), http://mckin-seyonsociety.com/downloads/reports/Education/Worlds_School_Systems_Final.pdf.
216 Office of the Press Secretary, White House, “Pres-ident Obama to Announce Launch of Skills for America’s Future,” October 2010.
217 Harry J. Holzer, Raising Job Quality and Skills for American Workers: Creating More-Effective Edu-cation and Workforce Development Systems in the States, Discussion Paper 2011-10 (Washing-ton: Hamilton Project, 2011), http://www.hamilton-project.org/files/downloads_and_links/11_work-force_holzer_paper.pdf.
218 World Economic Forum, Global Competitiveness Report 2011–2012.
219 American Society of Civil Engineers, Report Card for America’s Infrastructure.
220 Congressional Budget Office, Public Spending on Transportation and Water Infrastructure, Con-gressional Budget Office Study (Washington: Congressional Budget Office, 2010), http://www.cbo.gov/sites/default/files/cbofiles/ftpdocs/119xx/doc11940/11-17-infrastructure.pdf.
50 GLOBAL ECONOMY AND DEVELOPMENT PROGRAM
221 Pinaki Chakraborty and Yan Zhang, Economic Reforms and Infrastructure Spending: Evidence from China and India, United Nations University Research Paper 2009/43 (Tokyo: United Nations University, 2009), http://www.wider.unu.edu/pub-lications/working-papers/research-papers/2009/en_GB/rp2009-43/.
222 World Resources Institute, “EMBARQ: The WRI Center for Sustainable Transport,” 2012, http://www.wri.org/project/embarq.
223 Glen Weisbrod and Arlee Reno,, Economic Impacts of Public Transportation Investment, prepared for the American Public Transportation Association, October 2009.
224 Ken Berlin, Reed Hundt, Mark Muro and Devan-shree Saha, State Clean Energy Finance Banks: New Investment Facilities for Clean Energy De-ployment. Report by the Brookings-Rockefeller Project on State and Metropolitan Innovation (Washington: Brookings Institution, 2012).
225 “Governor Cuomo Proposes $1 billion New York Green Bank”. Environment News Ser-vice, January 10, 2013. http://ens-newswire.com/2013/01/10/governor-cuomo-proposes-1-billion-new-york-green-bank/.
226 Stephanie Chang, “Infrastructure Resilience to Disasters,” The Bridge (National Academy of En-gineering), Winter 2009, http://www.nae.edu/File.aspx?id=17673.
227 Ibid.
228 Michael Rambert and Sidney Wigfall, “Leverag-ing Private Equity with Government Business In-centive Programs,” American Venture Magazine, July 2002.
229 William Kerr and William Lincoln, The Supply Side of Innovation: H-1B Visa Reforms and U.S. Eth-nic Invention, NBER Working Paper 15768 (Cam-bridge, Mass.: National Bureau of Economic Re-search, 2010).
230 Hendricks, Bracken, Sean Pool and Lisbeth Kaufman, Low-Carbon Innovation: A Uniquely American Strategy for Industrial Renewal, Report for the Center for American Progress and Global Climate Network, May 2011.
231 White House, 2012 State of the Union Address, http://www.whitehouse.gov/photos-and-video/video/2012/01/25/2012-state-union-address-en-hanced-version#transcript.
232 U.S. Energy Information Administration, Annual Energy Outlook 2012.
233 Michael Levi, A Strategy for U.S. Natural Gas Ex-ports, Discussion Paper 2012-04 (Washington: Hamilton Project, 2012), http://www.brookings.edu/~/media/research/files/papers/2012/6/13%20exports%20levi/06_exports_levi.pdf.
234 Joe Romm, “Natural Gas Is a Bridge to Nowhere—Absent a Serious Price for Global Warming Pol-lution,” Think Progress, January 24, 2012, http://thinkprogress.org/climate/2012/01/24/407765/natural-gas-is-a-bridge-to-nowhere-price-for-global-warming-pollution/.
235 U.S. Energy Information Administration, “Pro-jected Retirements of Coal-Fired Power Plants,” July 31, 2012, http://www.eia.gov/todayinenergy/detail.cfm?id=7330.
236 Ibid. U.S. Energy Information Administration, “27 Gigawatts of Coal-Fired Capacity to Retire over Next Five Years,” July 27, 2012, http://www.eia.gov/todayinenergy/detail.cfm?id=7290.
237 U.S. Energy Information Administration, Quarterly Coal Report, October 2012, http://www.eia.gov/coal/production/quarterly/.
238 Ben Jervey, “Coal Train to Boardman: EPA Warns of ‘Significant’ Public Health Threats in North-west Coal Export Proposal,” Desmogblog.com, April 26, 2012, http://desmogblog.com/coal-train-boardman-epa-warns-significant-public-health-threats-northwest-coal-export-proposal.

THE UNITED STATES AFTER THE GREAT RECESSION 51
239 Ed Crooks and Sylvia Pfeifer, “U.S. Coal Ex-ports to Europe Soar,” Financial Times, Oc-tober 3, 2012, http://www.ft.com/cms/s/0/fbf0b9fa-0d63-11e2-97a1-00144feabdc0.html#axzz291Mf1lxR.
240 Natural Gas Vehicles for America, “United States Senate Energy and Natural Resources Commit-tee—Opportunities for Current Level of investment in, and Barriers to, the Expanded Usage of Natural Gas as a Fuel for Transportation,” July 24, 2012, NGV America, Washington, http://www.ngvc.org/pdfs/Statement_of_NGVA_SperawFinal.pdf.
241 White House, “Obama Administration Announces Loan Guarantees to Construct New Nuclear Pow-er Reactors in Georgia,” February 16, 2010, http://www.whitehouse.gov/the-press-office/obama-administration-announces-loan-guarantees-con-struct-new-nuclear-power-reactors; J. Snyder and K. Klimasinska, “Constellation Nuclear Loan Pullout Tests Obama Resolve to Revive Indus-try,” Bloomberg, October 12, 2010, http://www.bloomberg.com/news/2010-10-12/constellation-nuclear-loan-guarantee-pullout-tests-obama-s-taste-for-risk.html.
242 U.S. Energy Information Administration, “Energy in Brief,” 2012, http://www.eia.gov/energy_in_brief/nuclear_industry.cfm.
243 Some useful sources are given by Brad Plumer, “The U.S. Is Getting More Oil-Efficient—but Not Quickly Enough,” Washington Post, February 24, 2012, http://www.washingtonpost.com/blogs/ezra-klein/post/americas-getting-more-oil-effi-cient--but-not-quickly-enough/2012/02/24/gIQAv-V6lXR_blog.html.
244 Richard G. Newell, Adam B. Jaffe and Robert N. Stavins, “The Induced Innovation Hypothesis and Energy-Savings Technological Change,” in Tech-nological Change and the Environment, edited by Arnulf Grubler, Nebojsa Nakicenovic and William D. Nordhaus (Washington: Resources for the Future, 2002), 97.
245 Christopher R. Knittel, Leveling the Playing Field for Natural Gas in Transportation, Discussion Paper 2012-03 (Washington: Hamilton Project, 2012), http://www.hamiltonproject.org/files/down-loads_and_links/06_transportation_knittel.pdf.
246 Promoting Clean Energy in the American Power Sector, Policy Brief 2011-04 (Washington: Ham-ilton Project, 2011), http://www.hamiltonproject.org/files/downloads_and_links/05_clean_ener-gy_aldy_brief.pdf.
247 William E. Rees, “Building More Sustainable Cities,” Scientific American, March 12, 2009, http://www.scientif icamerican.com/article.cfm?id=building-more-sustainable-cities.
248 “Speech by Chairman Ben S. Bernanke at the Federal Reserve Bank of Kansas City Economic Symposium.”
249 Greenston, Michael and Adam Looney, 2013, The Fiscal Cliff and Our Long-Run Budget Chal-lenge (Washington, Brookings Institution) Janu-ary 4, 2013 http://www.brookings.edu/blogs/jobs/posts/2013/01/04-fiscal-cliff-budget-greenstone-looney
250 Richard Kogan, To Stabilize the Debt, Policymak-ers Should Seek Another $1.4 trillion in Deficit Savings, Center on Budget and Policy Priorities, January 9th, 2013
251 Phil Oliff, Chris Mai and Vincent Palacios, “States Continue to Feel Recession’s Impact,” Center on Budget and Policy Priorities, Washington, 2012, http://www.cbpp.org/files/2-8-08sfp.pdf.
252 State Budget Crisis Task Force, Report of the State Budget Crisis Task Force (New York. State Budget Crisis Task Force, 2012), http://www.statebudgetcrisis.org/wpcms/report-1.
253 Brian Wheeler, “The Scandal of the Alabama Poor Cut Off from Water,” BBC News, Decem-ber 14, 2011, http://www.bbc.co.uk/news/maga-zine-16037798.

52 GLOBAL ECONOMY AND DEVELOPMENT PROGRAM
254 Oil Change International, “The Price of Oil,” 2012, http://priceofoil.org/fossil-fuel-subsidies/.
255 McKibbin, Morris and Wilcoxen, “Potential Role of a Carbon Tax.” An additional estimate of possible tax revenues from a carbon tax was presented by the Congressional Research Service in Septem-ber 2012. See Ramseur et al. and this paper’s international policy recommendations for further information (Ramseur, Jonathan, Jane Leggett and Molly Sherlock, 2012. Carbon Tax: Deficit Reduction and Other Considerations. Congres-sional Research Service (CRS) Report for Con-gress, September 17 2012.)
256 David Bloom and David Canning, 2000. “The Health and Wealth of Nations”. In Science, 18 February 2000. Available at http://www.sci-encemag.org/content/287/5456/1207.short
257 African Development Bank, OECD, United Na-tions Development Program and United Na-tions Economic Commission for Africa, African Economic Outlook 2012: Promoting Youth Em-ployment. (Abidjan: African Development Bank, 2012), http://www.iza.org/conference_files/worldb2012/rielaender_j8363.pdf.
258 U.S. Department of State, 2012. Energy Diploma-cy in the 21st Century. Speech by the Secretary of State Hilary Clinton at Georgetown University, October 18 2012. Available at http://www.state.gov/secretary/rm/2012/10/199330.htm
259 “Obama’s Speech to the United Nations Gen-eral Assembly,” New York Times, September 24, 2009, http://www.nytimes.com/2009/09/24/us/politics/24prexy.text.html?pagewanted=all.

The views expressed in this working paper do not necessarily reflect the official position of Brookings, its board or the advisory council members.
© 2013 The Brookings Institution
ISSN: 1939-9383
1775 Massachusetts Avenue, NW Washington, DC 20036 202-797-6000 www.brookings.edu/global