the united kingdom is widely recognized as possessing the
TRANSCRIPT

The author(s) shown below used Federal funds provided by the U.S.Department of Justice and prepared the following final report:
Document Title: The Application of DNA Technology in Englandand Wales
Author(s): Christopher H. Asplen
Document No.: 203971
Date Received: January 2004
Award Number: 2002-LT-BX-K003
This report has not been published by the U.S. Department of Justice.To provide better customer service, NCJRS has made this Federally-funded grant final report available electronically in addition totraditional paper copies.
Opinions or points of view expressed are thoseof the author(s) and do not necessarily reflect
the official position or policies of the U.S.Department of Justice.

Smith Alling Lane A Professional Services Corporation Governmental Affairs Attorneys at Law
12 Vicarage Gate, #5 London W8 4AG Telephone: (011) 44 (0) 798 953 8386 Facsimile: (011) 44 (0) 797 677 5263
The Application of DNA Technology in England and Wales
By Christopher H. Asplen, J.D.
Executive Summary England is widely recognized as having the most effective and efficient approach to the use forensic DNA technology in the world. With a forensic database that currently contains the DNA profiles of over two million individuals, the National DNA Database of England and Walesi: • Delivers over 1,700 crime scene to crime scene or suspect to crime scene hits per
weekii • Maintains a 40 percent chance of obtaining a match between a crime scene
profile and a “criminal justice” (arrestee or suspect) profile loaded into the database
• Adds between 8,000–10,000 arrestee or suspect profiles to the database per week
• Adds between 1,000 to 1,500 crime scene profiles to the database per week • Increases the suspect identification rate for domestic burglary from 14 to 44
percent when DNA is available at the crime scene • Solves 0.8 other crimes for each crime solved with DNA • Prevents 7.8 other crimes for each custodial sentence resulting from a DNA
based conviction • Will contain profiles of the entire “criminally active population” by March
2004iii
1

This paper identifies those factors which contribute to the successful application of DNA technology and DNA databasing as an investigative tool, fully integrated into the criminal justice system. LEGISLATIVE FOUNDATION 1. The foundation of the Database system’s success is the series of Parliamentary
Acts establishing the right of law enforcement to collect and profile individuals arrested for or suspected of committing a crime. Empowering police to obtain DNA from arrestees and to use the database during the investigative process, rather than subsequent to any possible conviction, provides numerous advantages. It allows them to:
• solve cases faster, • consolidate cases (and thus valuable resources) before trial, • detain dangerous individuals arrested on a minor charge but identified
as having committed a much more serious offense, • exonerate innocent suspects more quickly.
2. Legislation also establishes the ability of law enforcement to obtain DNA profiles
for individuals arrested for or suspected of “any recordable offense.” With this legal authority, the Home Office has established the goal of DNA databasing the “entire active criminal population.”iv Currently, the database population stands at approximately two million individual profiles. By nature of its size, the database matching potential increases. However, it is the ability to profile individuals arrested for relatively minor offenses which provides police the ability to solve more serious crimes.
FUNDING 3. The National DNA Database (NDNAD) is well funded. In April 2000 the Home
Office instituted the DNA Expansion Program calling for an investment of £182 million ($270 million). With a population of approximately 52 million (England & Wales), that equals approximately $5 per citizen invested in DNA databasing. With a population of approximately 291,000,000 the US would have to invest over one billion dollars to achieve a similar ratio.
4. In England and Wales, the DNA expansion funds are provided directly to police departments. While allowing investigating agencies the flexibility to apply grant monies for DNA testing as they see appropriate, direct funding also forces departments to make better decisions about which samples are forwarded to the laboratories for analysis. Smarter submission decisions result in better resource management.
2
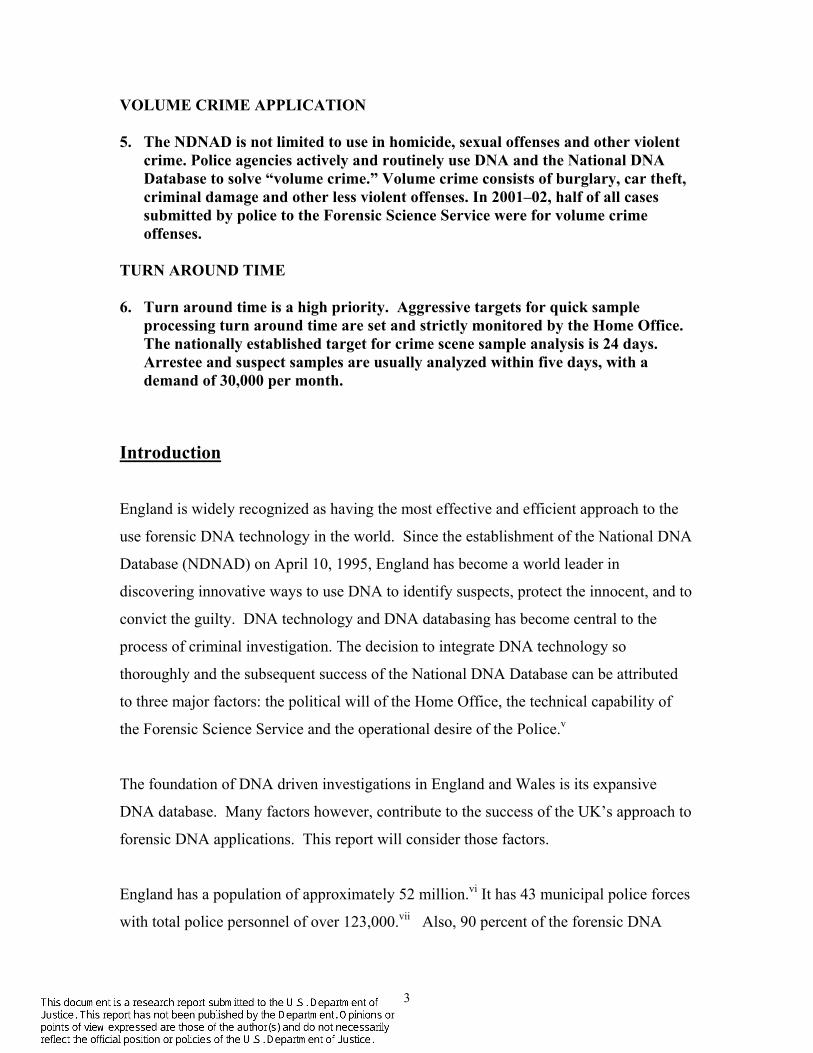
VOLUME CRIME APPLICATION 5. The NDNAD is not limited to use in homicide, sexual offenses and other violent
crime. Police agencies actively and routinely use DNA and the National DNA Database to solve “volume crime.” Volume crime consists of burglary, car theft, criminal damage and other less violent offenses. In 2001–02, half of all cases submitted by police to the Forensic Science Service were for volume crime offenses.
TURN AROUND TIME 6. Turn around time is a high priority. Aggressive targets for quick sample
processing turn around time are set and strictly monitored by the Home Office. The nationally established target for crime scene sample analysis is 24 days. Arrestee and suspect samples are usually analyzed within five days, with a demand of 30,000 per month.
Introduction England is widely recognized as having the most effective and efficient approach to the
use forensic DNA technology in the world. Since the establishment of the National DNA
Database (NDNAD) on April 10, 1995, England has become a world leader in
discovering innovative ways to use DNA to identify suspects, protect the innocent, and to
convict the guilty. DNA technology and DNA databasing has become central to the
process of criminal investigation. The decision to integrate DNA technology so
thoroughly and the subsequent success of the National DNA Database can be attributed
to three major factors: the political will of the Home Office, the technical capability of
the Forensic Science Service and the operational desire of the Police.v
The foundation of DNA driven investigations in England and Wales is its expansive
DNA database. Many factors however, contribute to the success of the UK’s approach to
forensic DNA applications. This report will consider those factors.
England has a population of approximately 52 million.vi It has 43 municipal police forces
with total police personnel of over 123,000.vii Also, 90 percent of the forensic DNA
3

analysis performed in the England is performed by one, quasi-governmental agency, the
Forensic Science Service (FSS). Further, not only does the Forensic Science Service
retain the vast majority of the country’s forensic DNA analysis, it is also the official
custodian of the DNA database, an authority granted by the Association of Chief Police
Officers (ACPO).
The United Kingdom averages two million arrests per year. However, statistics show
that less than one quarter of these arrests are of first time offenders.viii Further, it has
been shown that 85 percent of offenders receive their first conviction between the ages of
14 and 19 with the likelihood of a 14 year-old re-offending at 77 percent.ix Government
statistics also show that 20 percent of the criminals commit 80 percent of crime and 60
percent of court appearances deal with only 21 percent of offenders.x
The Progression of Database Laws in England and Wales The Progression of Database Laws in England and Wales
Since its establishment in 1995, the National DNA Database has received consistent
legislative expansion and financial support from the UK Government. Through a series of
Parliamentary Acts from 1993 through 2003, police have seen their ability to reap the
benefits of DNA technology steadily enhanced.
In 1991, the Royal Commission on Criminal Justice was
established as a result of concern about public confidence in
the criminal justice system. One example of that concern was
the quashed conviction of the “Birmingham Six,”xi the
exonerations of whom were handed down the same day that
the Commission was announced. When the Commission
published its recommendations in 1993, it stated that “there shou
provision for the more extensive storage of DNA samples or data
identifying offenders…” xii Given the Commission’s genesis, the
4
Given the Commission’s genesis, the Government endorsed view of DNA came in the context of its ability to exonerate the innocent as much as its ability to convict the guilty.
ld be clear legislative
both for the purpose of
Government endorsed

view of DNA came in the context of its ability to exonerate the innocent as much as its
ability to convict the guilty.
Also in 1993, the House of Lords’ Select Committee on Science and Technology
recommended that, given a lack of legislative authority for the collection, retention and
use of biological samples, the government clarify the laws empowering police to use such
evidence. In 1994, the Home Office commissioned the Metropolitan Police Forensic
Science Laboratory to perform a pilot study to examine the use of DNA in the context a
forensic database. As a result of the Met study, the Home Office decided to pursue the
creation of a forensic DNA database.
Thus, from its inception, the NDNAD was a database driven, not by the use of convicted offender profiles, but rather by the use of profiles developed from individuals merely suspected of crimes.
The first Parliamentary Act establishing the authority to
create a criminal DNA database is the 1994 Criminal
Justice and Public Order Act (CJPOA).xiii “The central
and most far reaching, aspect of the CJPOA was the
framework it created for the police administration of
DNA sample collection necessary for profiling.xiv The
CJPOA broadened the scope of suspects from who samples could be taken to those
charged with any “recordable offense.” This represented
significant expansion beyond the “serious arrestable offence”
scope of offenders that was established by the 1984 Police
and Criminal Evidence Act (PACE).xv Thus, from its
inception, the NDNAD was a database driven, not by the use
of convicted offender profiles, but rather by the use of
profiles developed from individuals merely arrested for or
suspected of crimes. However, according to the CJPOA,
only those cases in which the suspect was convicted would
the individual’s profile be maintained on the database.
Importantly though, the CJPOA also amended the types of biolo
be collected from suspects. “Through a reclassification of the sa
5
“Through a reclassification of the sample types defined as ‘intimate’ and ‘non-intimate,’ the CJPOA redefined PACE to incorporate saliva and mouth samples in that category of non-intimate body samples which can be taken without consent and, crucially, by the police themselves ”
gical samples that could
mple types defined as

‘intimate’ and ‘non-intimate,’ the CJPOA redefined PACE to incorporate saliva and
mouth samples in that category of non-intimate body samples which can be taken without
consent and, crucially, by the police themselves.”xvi In other words, while the 1984
PACE Act allowed for the collection of evidence from suspects, that evidence was
limited to non-intimate samples, i.e.: fingerprints. DNA sample collection, absent the
change of language to include saliva and mouth samples as “non-intimate” would have
left DNA, for all practical purposes, un-collectable. Further, by facilitating the use of
buccal swabs for sample collection, the CJPOA simplified sample collection and reduced
cost significantly.
While the CJPOA called for the expungement of profiles if individuals who were not
ultimately convicted, periodic problems with database administration ultimately led to a
number of cases in which suspects were identified by samples which were retained in the
system but should have been removed. This led to a number of court cases and a decision
from the House of Lords addressing the legality of such identifications. Ultimately, the
issue became one of discretion for the court.xvii
Thus, the 2001 CJPA allows for the collection and retention of DNA samples and profiles for anyone who becomes a suspect during the course of an investigation.
To address these public policy and legal issues, the
House of Lords passed the 2001 Criminal Justice and
Police Act (CJPA) which “…can be seen as a direct
outcome of the problems of admissibility and
retention.”xviii The Act provides for the indefinite
retention of DNA profiles on the NDNAD even if suspects are not convicted or
“cautioned” for a crime.xix It also allows for the indefinite retention of profiles and
biological samples given voluntarily with written consent, such as through mass
screenings. Thus, the 2001 CJPA allows for the collection and retention of biological
samples and DNA profiles for anyone who becomes a suspect during the course of a
police investigation.xx
6

As for the impact of the legislation on the success of the NDNAD, the Chief Executive
Officer of the Forensic Science Service says, “It simply could not have been as successful
without the ability to profile suspects and to do so for all recordable offenses.”xxi
Pending legislation, expected to pass Parliament, would allow the routine sampling of all
arrestees. This will have the effect of eliminating the requirement of police supervisory
approval to take a DNA sample. DNA sampling will essentially become an
administrative function.
The Forensic Science Service Given the 90 percent share of DNA analysis performed by the Forensic Science Service,
the fact that it is the one DNA laboratory officially associated with the government and
the fact that the FSS is the DNA Database custodian, it is important to understand the
structure of the FSS to understand how DNA technology is used so effectively.
The Forensic Science Service was established as an Executive Agency, part of the Home
Office, in April 1991. In April 1996, the FSS merged with the Metropolitan Police
Forensic Science Laboratory, London’s Police Laboratory, and as a result, the FSS is now
the largest supplier of forensic science services in the UK. Similar to the Federal Bureau
of Investigation’s Laboratory, the FSS is responsible for various kinds of forensic testing,
not just DNA. Its specialists respond to crime scenes both for the identification,
preservation and collection of evidence as well as for the advice and support of police
investigators. FSS experts provide testimony in criminal trials and significantly, it is the
custodian of the National DNA Database. The FSS also maintains a research facility
which is responsible for developing forensic science breakthroughs and innovations -
particularly in the application of DNA technology.
While the FSS currently operates as a non-profit organization, it is a fee-for-service
agency. On April 1, 1999, the FSS was given “Trading Fund” status which allows it to
7

Exhibit 1
Services Provided by the Forensic Science Service
Scientific analysis
to support criminal
investigations
Expert scientific
Analysis of DNA
testimony for inclusion In the
NDNAD 43 Police Agencies;
Crown Prosecution
& Courts; HM Customs &
Excise
Conduct research
Custodian & Maintenance
of on advancing
Forensic Technologies The NDNAD
retain surplus cash at the end of each financial year and carry it over to the next. This
allows for surplus finances to be spent on research and improving customer service.xxii
Today, the FSS maintains seven working laboratories with 2,700 staff and provides
forensic analysis services to private, public and overseas customers as well as the 43
police forces in England and Wales and other police forces such as the Ministry of
Defence Police, British Transport Police, the Crown Prosecution Service and Her
Majesty’s Customs and Excise Service (Exhibit 1). Between 2001-02,xxiii the FSS
analyzed forensic evidence in approximately 130,000 cases as well as 555,000 samples of
DNA, of which 480,000 were added as profiles to the National DNA Database. That
8

means that approximately one half of all cases were submitted for DNA testing,
compared to one quarter in 1997-98. Since 1996-97, the total number of cases received
from law enforcement has increased 52 percent.xxiv
The FSS operates in a commercial market valued at £160 million. And while the agency
maintains over 90 percent of the overall forensic market in the UK, it competes with
other forensic service providers which hold the remainder of the market. Given the
market share maintained by the FSS and its role as database custodian, this report focuses
largely on the role of the Forensic Science Service.
With annual operating costs of £122 million the FSS is required to cover its costs through
its fee-for-service structure. In 2001-02, the FSS had an operating income of £128
million, over 90 percent of which came from the 43 police forces of England and Wales.
Charges for forensic analysis are based either on an hourly (for example, £110 per hour
for crime scene attendance) or per item basis (for example, £195 to search an item for
body fluids). xxv
Direct Funding to Police Agencies
As mentioned previously, the FSS is a “fee-for-
service” agency. Therefore, funding programs such as
the DNA Expansion project (discussed in greater
detail later) allocate their funding directly to the law
enforcement agencies rather than to the forensic
laboratories conducting the analysis. This direct funding
departments to request DNA testing in a more thoughtful
simply sending every conceivable biological sample to th
DNA funding made directly to the police requires that the
considered. Since the number and quality of samples sen
police department’s budget, (rather than the laboratory’s)
9
Rather than simply sending
every conceivable biological
sample to the laboratory for
testing, national DNA funding
made directly to the police
requires that their submissions
are well considered.
encourages individual police
and judicious way. Rather than
e laboratory for testing, national
ir submissions are well
t to the laboratory affects the
departments benefit from better

training and better evidence submission policies. The better trained their own scientific
support personnel are at identifying evidence which might provide a relevant DNA
profile, the less departmental funding gets wasted on unsuccessful DNA tests.
A consistent problem in those United States forensic systems is the tendency for law
enforcement (or prosecutors) to simply send “everything” to the laboratory for testing.
Often this is possible from the police perspective because the cost of the analysis doesn’t
come out of their budget rather; it is expensed through the laboratory system. The system
in England and Wales however, provides incentives for the police to be better trained at
identifying quality evidence.
The National DNA Database
The FSS pioneered the use of DNA profiling in forensic science and set up the world's
first national criminal intelligence DNA Database - launched in April 1995. The
structure and use of the National DNA Database however differs significantly from the
structure and use of the local, state and National DNA databases of the United States.
While in the United States, the National DNA Indexing System (NDIS) is based on a
system in which only convicted offender profiles can be entered and searched against
crime scene profiles, the UK National DNA Database is driven by the use of suspect
profiles. In England and Wales, police have powers to take and retain biological samples
from those:
• charged with or informed they will be reported for any recordable offence,xxvi
• where an Inspector has reasonable grounds to suspect the involvement of the
individual in a recordable offence and,
• the DNA sample will tend to confirm or disprove his involvement in the
offence.xxvii
10

Further, legislation is currently pending which would allow police automatically to take a
biological sample from anyone arrested for a recordable offense. This would, in arrest
cases, eliminate the requirement of an Inspector’s assessment and approval. Such
approval would then be necessary only in cases in which the suspect was not yet arrested.
The National DNA Database currently contains 2,017,020 profiles from individuals
suspected of, and/or arrested for “any recordable offense.”xxviii These DNA profiles are
referred to as Criminal Justice or “CJ” profiles. By contrast, the NDNAD contains 200,
614 unsolved crime scene profiles. And while 268,278 suspect profiles and 43,214 crime
scene profiles have been removed pursuant to previous PACE requirements, those
removal requirements no longer exist.
Exhibit 2 How the National DNA Database can be used to aid criminal investigations
If Database generates a match and NO name, Police know that the individual from which the sample came committed an unsolved
crime Suspect Sample (suspect-case cold hit)
Uploaded to Database If Database generates a match and name, Police know that the individual from whom the sample came was previously charged
with another offence
If Database generates a match and a name, Police may know from whom the crime scene evidence came from
(case - suspect cold hit)
No-Suspect Casework If Database generates a match and NO name, Police know Sample that the individual from which the sample came
committed another unsolved crime Uploaded to Database (case - case cold hit)
If Database doe NOT Generate a match, Police do not know from whom the biological evidence came, nor do they know if the individual who left the biological material committed other crimes
On a weekly basis, between 8,000 to 10,000 new CJ profiles and 1,000 to 1,500 new
crime scene samples are added to the National DNA database system.xxix Partial profiles
11

can be entered into the database and currently make up 11 percent (22,849) of the
unsolved crime scene profiles.
The success of the NDNAD can be seen not only in the number of matches made but also
in the varied nature of the crimes matched. From April 1995 to the end of January 2002,
the majority of matches were not made in rape, other sexual offenses or murder. Instead,
the largest numbers of matched crimes were commercial and residential burglaries.
Exhibit 3
Number of crime scenes matching one or more individual(s) by offense & year
Offence code 2000-01 2001-02 2002-03 2003-04 Total
Abduction And Kidnapping 8 42 43 24 117 Aggravated Burglary 0 6 7 6 19 Aggravated Burglary 16 183 251 93 543 Alc Tech Defence 0 1 1 1 3 Alcohol Technical Defences 0 2 1 1 4 Arson/Fire 1 3 13 3 20 Arson/Fire Investigations 13 84 134 54 285 Attempted Murder 8 68 107 40 223 Auto-Crime 382 1315 724 165 2586 Blackmail 1 5 9 3 18 Break In Offences 6 56 38 6 106 Burglary In A Dwelling 1033 7585 9567 2463 20648 C&E Export 1 1 0 0 2 C&E Fraud 0 0 0 1 1 C&E Import Drugs 0 2 1 0 3 C&E Import Other 1 0 0 0 1 C&E Projects 1 0 1 0 2 Corporate General Services 2 15 2 1 20 Criminal Damage 0 3 1 0 4 Driving After Consuming Drugs 1 3 4 2 10 Drugs Services – Other 0 2 13 6 21 Explosives 5 13 29 4 51 Gbh Assault 0 1 1 0 2 High Value Fraud 1 4 6 1 12 Import/Export Controlled Drugs 0 3 11 4 18 Less Serious Assault 29 242 495 111 877 Low Value Fraud And Forgery 5 60 77 31 173 Murder/Manslaughter 22 120 157 48 347 Other Serious 20 116 166 69 371
12
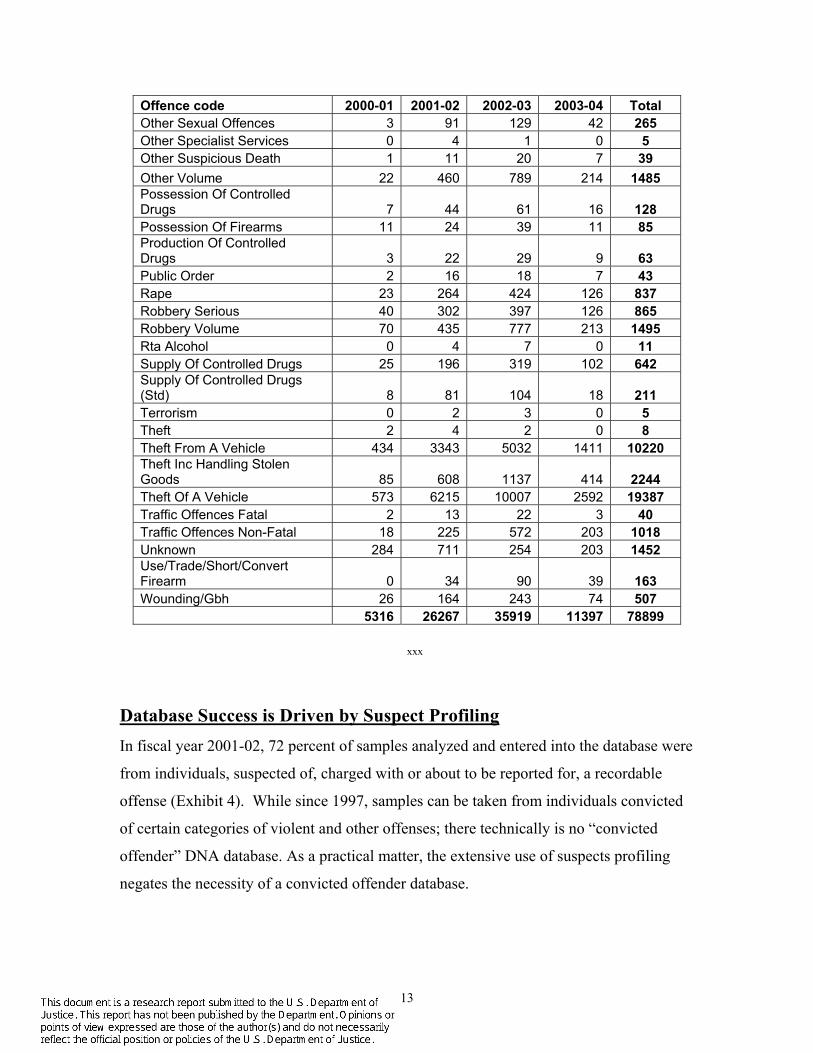
Offence code 2000-01 2001-02 2002-03 2003-04 Total Other Sexual Offences 3 91 129 42 265 Other Specialist Services 0 4 1 0 5 Other Suspicious Death 1 11 20 7 39 Other Volume 22 460 789 214 1485 Possession Of Controlled Drugs 7 44 61 16 128 Possession Of Firearms 11 24 39 11 85 Production Of Controlled Drugs 3 22 29 9 63 Public Order 2 16 18 7 43 Rape 23 264 424 126 837 Robbery Serious 40 302 397 126 865 Robbery Volume 70 435 777 213 1495 Rta Alcohol 0 4 7 0 11 Supply Of Controlled Drugs 25 196 319 102 642 Supply Of Controlled Drugs (Std) 8 81 104 18 211 Terrorism 0 2 3 0 5 Theft 2 4 2 0 8 Theft From A Vehicle 434 3343 5032 1411 10220 Theft Inc Handling Stolen Goods 85 608 1137 414 2244 Theft Of A Vehicle 573 6215 10007 2592 19387 Traffic Offences Fatal 2 13 22 3 40 Traffic Offences Non-Fatal 18 225 572 203 1018 Unknown 284 711 254 203 1452 Use/Trade/Short/Convert Firearm 0 34 90 39 163 Wounding/Gbh 26 164 243 74 507 5316 26267 35919 11397 78899
xxx Database Success is Driven by Suspect Profiling In fiscal year 2001-02, 72 percent of samples analyzed and entered into the database were
from individuals, suspected of, charged with or about to be reported for, a recordable
offense (Exhibit 4). While since 1997, samples can be taken from individuals convicted
of certain categories of violent and other offenses; there technically is no “convicted
offender” DNA database. As a practical matter, the extensive use of suspects profiling
negates the necessity of a convicted offender database.
13

Exhibit 4
DNA Analysis Performed by the FSS in 2001-02
11,21965,071 2%12%
77,814 Arrestee or Suspect Samples14%
Scene Samples Casework Samples Mass Screen Samples
401,04072%
*Arrestee or Suspect Samples include non-intimate biological material collected from individuals suspected of, charged for, or about
to be reported for any recordable offense
**Scene samples include biological material collected from unsolved crime scenes
***Casework samples are those which are submitted for analysis as part of a criminal investigation to establish a link to a known
suspect in a crime
****Mass screen samples are those collected from volunteers in order to be compared with samples left at the crime scene under
investigation.xxxi
The effectiveness of suspect databasing can be
demonstrated by comparing the number of crime
scene to crime scene hits with the number of suspect
to crime scene hits which have been made since
1996. In 1996, the National Database made 976
crime scene to crime scene hits. That same year, the database made 2,531 suspect to
crime scene hits. Over the next five years, crime scene to crime scene hits went as high as
3,357 per year, but stayed in that range and numbered only 2,508 in 2001-02. Suspect to
crime scene, or ‘cold hits’ however, increased every year to 58,176 in 2001-02.
Over the next five years, crime scene to crime scene hits went as high as 3,357, but stayed in that range and numbered only 2,508 in 2001-2002. Suspect to crime scene hits however, increased every year to 58,176 in 2001-2002.
14

By searching suspect profiles against the database, links to other crimes can be
established. Depending on the case, evidence from other cases can be aggregated to
possibly strengthen the original arrest. Also, cases themselves can be consolidated to
promote a more expeditious resolution to all crimes in which the defendant is implicated
through the database. This conservation of resources can be accomplished either through
the consolidation of trials or through negotiated pleas bargains. Thus the savings
generated by solving crimes through the database extends beyond the benefits to the
investigative process to the prosecutorial process.
By searching suspect profiles against the database, links to other crimes can be
established. Depending on the case, evidence from other cases can be aggregated to
possibly strengthen the original arrest. Also, cases themselves can be consolidated to
promote a more expeditious resolution to all crimes in which the defendant is implicated
through the database. This conservation of resources can be accomplished either through
the consolidation of trials or through negotiated pleas bargains. Thus the savings
generated by solving crimes through the database extends beyond the benefits to the
investigative process to the prosecutorial process. Today, the average
time for analyzing suspect DNA for inclusion in the database is five days, with a demand of around 30,000 samples per mper m
The Critical Importance of Turn Around TimeThe Critical Importance of Turn Around Time
onth. onth.
A fundamental and overriding concern of the FSS and of the
Home Office is the turnaround time of analysis of both
casework and suspect samples. The Home office sets targets and
strictly monitors the extent to which the FSS adheres to those targets. In fiscal year
1991-92 an average turnaround time of 45 days was found not only to be an unacceptable
level of service, but more importantly, a danger to the criminal investigation procedure.
By 1999-00, the FSS had reduced the average turnaround time to 26 days for casework,
only two days above the nationally established target of 24 days.xxxii Today, the average
time for analyzing suspect DNA for inclusion in the database is 5 days, with a demand of
around 30,000 samples per month.
Exhibit 5, Average Turn Around Time (in Days) by Type of Case
05
1015202530354045
Burglary Drugs Assault Murder Sexual Offence
199920002001
xxxiii
15

However, the rise of average case work turnaround time to 35 days in 2001-02 was again
deemed unacceptable by a 2003 report of the Comptroller and Auditor General even
though the FSS realized a 14 percent increase in case work volume. The report cited the
reduction of time as the first of five major recommendations. To reduce turn around
time, the report stressed: 1) the need to ensure adequate staff with the appropriate skill
level; 2) the need to ensure police understand how forensic evidence should be submitted
to ensure quality; 3) ensure equal distribution of cases between its seven labs; and 4)
ensure evidence is sent to the most appropriate laboratory.
The Role of Law Enforcement Leadership The Association of Chief Police Officers is the primary law enforcement leadership
organization in England, Wales and Northern Ireland. It is not a staff association. Rather,
its work is on behalf of the police Service instead of individual members.xxxiv Its role is to
set and maintain policy standards, ensure training for and compliance with those
standards and to identify and promote good police practices. Representing only 44
forces, it has a greater ability and likelihood to speak with one voice than law
enforcement in the United States. In many respects, its ability to act as a single, powerful
force has helped to establish the NDNAD. However, even as effective as the use of DNA
technology is in England and Wales, the government sees that police executives need to
do more to ensure the full and proper application of the technology as a routine crime
fighting tool.
In his June 2002 report and evaluation of the investigative use of DNA and fingerprints in
the UK, Her Majesty’s Inspector, David Blakey CBE, QPM, DL, MBA, identified Police
leadership to be critical to the successful use of DNA to solve volume crime. Citing a
previous 2000 Government evaluation, “ Under the Microscope,” which identified Police
leadership to be a weak link in the chain of the technology’s successful implementation,
Blakey’s subsequent report indicated that, in spite of some improvements, the UK police
leadership has to take an even stronger role. The Inspector’s first recommendation of the
2002 report was:
16

The ACPO and Chief Officers ensure that their strategy and supporting policies on the use of Forensic science to tackle volume crime are up to date, known and understood by operational officers.xxxv
The recommendation is particularly illustrative in the context of efforts in the United
States to integrate DNA more effectively into the criminal justice system. First, while the
UK is the most effective country at implementing DNA technology to solve crimes, there
is still much to be done to maximize its potential. In fact, according to the report’s
research, only 30 percent of the forces examined had a ranking officer championing the
scientific support function and thus the routine use of DNA analysis. Further, the report
was clear that the responsibility to maximize that potential falls squarely on the shoulders
of law enforcement’s leadership.
The second point of the recommendation that is relevant to US efforts is its specific
reference to “volume crime.” This emphasis can also be found in the report’s
recommendation on managing DNA evidence. It states:
That Chief Officers urgently review their SOCO (Scenes of Crime Officers) attendance policy for volume crime and their DNA submission criteria. xxxvi
What is absolutely clear about the UK government’s investment of money into DNA technology is that it expects the technology to be applied to more than just serious felonies.
Significantly, the report assumes the full
implementation of DNA investigatory resources for
serious crimes such as homicide, sexual offenses and
other violent crime. Those crimes need not even be
mentioned because DNA is already used
systematically in those cases. Rather, the UK police forces need to move to the
standardization of DNA’s application to burglary, criminal damage, car theft, etc. What
is absolutely clear about that the UK government’s investment of money into DNA
technology is that it expects the technology to be applied to more than just serious
felonies. The expectation is that DNA and the DNA database will be used to solve every
crime in which the discovery and analysis of a biological sample could lead to the
identification of a suspect.
17

The DNA Database Application to “Volume Crime” In the United Kingdom, the term “volume crime” refers to crimes such as burglary, car
theft and criminal damage. Generally, violent crimes such as homicide, sexual offenses
and other assault offenses are not considered volume crime. However, while DNA has
traditionally been a tool applied to the investigation of assault-based or violent crimes,
the NDNAD has been successfully applied not only to these, but also to less violent
volume crimes. In 2001-02, over one half of the 130,000 cases submitted by police were
related to volume crime. Only 14 percent related to violent crime, 17 percent for drug
crimes (including possession) and 18 percent for traffic crime (Exhibit 6).
Exhibit 6
Number of Cases Received From Police
for DNA Analysis in 2001-02
18,240 14%
22,647 Volume Crime17% Traffic Crime
Drug Crime65,717 Violent Crime51%
23,690 18%
xxxvii
18
Counting Matches
The FSS uses two different methods of counting matches (hits) on the NDNAD,
“pairwise matches” and “scene focused subject matches.” Pairwise match counting has
been employed since 1995 and tracks all newly linked profiles. However, this approach
fails to identify the actual number of cases in which a suspect was identified through the
database. That often led to criticism that the success rate of the NDNAD was overstated.
Scene focused matching has been employed since May, 2001. This method counts new
matches and additional matches to unsolved crime scenes separately, which more
accurately reflects the number of suspects identified and is more valuable for police
forces determining the success of the NDNAD.
DNA Expansion Program
In April of 2000, the Home Office instituted the DNA Expansion Program. This program
called for the investment of £182 million ($289.8 million) through March, 2004. The
primary goal of the program is to have all DNA profiles from the entire “criminally
active” population on the database by March 31, 2004. It is estimated that the
“criminally active” population in the UK is approximately 2.4 million individuals. As of
July 21, 2003, the database passed the two million mark.xxxviii
In fiscal 2002-03 police attended 998,000 crime scenes and recovered biological material
from approximately 100,000 of these. Of the 100,000 cases in which biological were
recovered, approximately 57,000 DNA profiles were subsequently developed and loaded
onto the database.xxxix By contrast, during the same time period, police loaded DNA
profiles from 405,000 suspects and/or arrestees onto the database. As a result of the
combined number of profiles entered onto the database, 21,000 detections, or cold hits,
were made.
19

Law Enforcement Training and Education Through the DNA
Expansion Project
Two years ago, as part of the DNA Expansion Project, £3 million was allocated
specifically to the education and training of every police officer in England and Wales.
The training was developed with the FSS and was administered as an in-service program
as officers came on shift.xl Every officer received a lecture and CD-ROM. Given the
extent to which DNA technology will only increase in its application to investigative
work and given the turn over rates of officers, efforts are underway to repeat a similar
program.
Results of the DNA Database Expansion Program
While their analysis is not yet completed, the Home Office has been able to identify a
number of trends and statistics that demonstrate the effectiveness of using the DNA
Database as an investigative tool for police. These include:
• In the National DNA Database, there is a 40 percent chance of obtaining a
match between a crime scene profile and a Criminal Justice (suspect or
arrestee) profile loaded on the database.
• 80 percent of the matches for criminal justice (arrestee or suspect) profiles,
involved offenses different from the initial arrest or suspected offense.
• A growing number of matches involving serious crimes follow initial
sampling for minor offenses.
• The detection or hit rate for domestic burglary increased from 14 to 44 percent
when DNA was available at the crime scene.
• Each crime detected with DNA led to 0.8 other crimes being detected.
• The Home Office estimates that approximately 50 percent of the DNA
database made detections led to convictions; 25 percent of those convictions
led to custodial sentences.
20

• Each of the DNA based custodial sentences led to the prevention of 7.8
crimes.xli
While in 1998-99, 41 percent of the cases analyzed by the FSS resulted in conclusive
evidence to either associate or disassociate suspects with or from crimes, by 2001-02 that
percentage increased to almost 50 percent (Exhibit 7). And for cases in which no suspect
was known, 72 percent of forensic analysis demonstrated evidence of “some intelligence
value.”xlii However, the FSS suffers from the same problem identified in the United
States in that the FSS does not normally receive feedback from the police and Crown
Prosecution Service regarding the outcome of cases to which it has contributed (i.e.;
convictions or acquittals). Thus, a significant portion of forensic analysis is not assessed
as to its effectiveness on the outcome of criminal prosecutions.
Exhibit 7
Percentage of Cases Analyzed by the FSS in 2001 Where There Was No Suspect
47%
28%
25%
Good IntelligenceNo IntelligenceSlight Intelligence
xliii
21

Exhibit 8
Percentage of Cases That Were Analyzed by the FSS in 2001 Where there Was a Suspect
40%
22%
13%
10%
7% 5% 3%Conclusive Evidence toAssociate a SuspectStrong Evidence to Associatea SuspectInconclusive Evidence
Strong Evidence to Eliminatea SuspectConclusive Evidence toEliminate a SuspectSome Evidence to Eliminatea SuspectSome Evidence to Associatea Suspect
xliv
Technology - Low Copy Number The Forensic Science Service has pioneered a “super sensitive” form of DNA analysis
called Low Copy Number or LCN. Using this technique, profiles can be developed
“from very degraded material, very small stains and items that may contain skin cells
such as jewelry or may have simply been touched by an offender.”xlv Its foundational
methods are based upon the AmpFLSTR® SGM Plus® PCR amplification kit but the
added sensitivity of the technique is achieved by increasing the number of amplification
cycles from 28 to 34 in the PCR reaction.
The significance of LCN is that it takes the advantages of PCR technology and the ability
to develop profiles from small or degraded samples to another level. The technology
enables profiles to be obtained from older crime scene evidence, smaller stains of blood
and other body fluids as well as skins cells invisible to naked eye. As such, profiles can
be developed from items which the offender has merely touched. This eliminates the
necessity that he leave behind bodily fluids for DNA technology to be effective.
22

Therefore, the technology has the potential to open new offenses to the use of DNA as
the primary investigation tool. Such cases might include auto thefts, which typically do
not contain traditional forms of biological evidence such as hair or bodily fluid.
The first significant field trial for LCN technology was a pilot run through the West
Midlands Police Department in 1999. The focus of the trial was the application of LCN
to auto theft. Forensic Science Service “Intelligence Officers” were deployed to swab
the areas of a stolen vehicle where minute biological samples, capable of LCN testing
could be retrieved. It was found that areas such as the steering column and ignition box
(areas most likely to be broken in an attempt to steal a vehicle) yielded the highest results
in the analysis phase.
Low Copy Number technology however brings with it several concerns and is not
currently being used in the United States. Two problematic issues arise when using the
LCN technology: Secondary transfer and variable shedding.
• Secondary transfer refers to the fact that, through physical contact with other people,
individuals can inadvertently carry and deposit other people’s DNA onto objects of
evidence. For example, two people shaking hands will transfer their own DNA to each
others’ hands. If each then goes on to touch another object such as a coffee mug,
baseball bat, knife etc., they could transfer the other’s skin cells to the object. If that
object is a murder weapon, the identification of DNA through LCN could prove
problematic and misleading.
• Variable shedding refers to the extent to which different people shed their skin cells
in different quantities under different circumstances. Some people are more likely than
others to leave behind their DNA in the form of skin cells. Through research at the
FSS, it has been found that there are, for example, “heavy shedders,” “medium
shedders,” and “light shedders.” Thus, the last person to touch a particular object may
not leave the most DNA or strongest profile.
23

• The amount of DNA deposited can also be affected by certain actions taken by the
individual. Washing of one’s hands will, for a period of time, decrease the amount of
skin cells a person deposits on other objects. Additionally, the amount of perspiration
exerted at the time the object is being held may also affect the amount of skin cells that
are deposited. Both of these scenarios could adversely affect results upon LCN-DNA
analysis.
• Given the nature of variable shedding and secondary transfer, the risk of obtaining a
mixture is increased when applying a technology with increased sensitivity such as
LCN. It is impossible to amplify the “right” DNA profile because all of the DNA that
is contained in a biological evidence sample will be amplified.
The concerns associated with Low Copy Number DNA testing require a perceptive
approach to crime scene processing and evidence collection. Where possible, objects
most likely belonging to the perpetrator, (for example, tools left behind by a burglar),
receive priority. Thus, in a burglary scene in which a screwdriver and a home owner’s
mug are found, both believed to be used by the offender, the screwdriver would take
priority for testing. Similarly, when examining stolen vehicles, priority items for
swabbing would include the steering column and ignition box because they are not often
handled by the owner/driver, but often necessary to manipulate in order to steal a car.
Police Elimination Samples Given the extensive use of DNA technology for all levels of criminal investigation, as
well as the use of particularly sensitive LCN technology, police are now required to
contribute a DNA sample for loading onto the database. While police officers employed
prior to the sampling requirement could participate voluntarily, new recruits to the forces
are mandated to contribute samples. To date, the NDNAD contains about 70,000 police
elimination samples.xlvi
24

Special Project
BRIL (Burglary Reduction Initiative in Leeds)
The BRL project targeted property crime, car theft and burglary in West Yorkshire. It
was the largest crime reduction initiative in the UK between the years 2001 and 2002 and
was funded through Home Office’s Crime Reduction Program (£2.6 million). The
program was designed specifically to reduce the incidence of burglary in the six Leeds
Divisions of the West Yorkshire Police. While there were other components to the
program such as crime prevention efforts, the DNA portion combined increased crime
scene collection efforts by the police with rapid turn around time by the FSS. As a result
of these efforts, suspect crime scene samples were processed, loaded onto the NDNAD,
and matches reported to the police within 7 days or less. Importantly, police also agreed
to act on the matches quickly.
The results to March 2002 showed:
• An almost four fold increase in the number of submissions to the FSS compared to
the same period of time the previous year.
• 76 percent of crime scene submissions resulted in a profile being loaded onto the
database.
• 69 percent of the profiles loaded onto the database produced a scene-to-scene or
scene-to-suspect match.
• 79 arrests were made with 30 convictions made by March, 2002 (the remaining 49
cases are pending).
• Taking into account the offending patterns of some of those convicted, and based on
the average value of goods stolen and property damage caused, just 16 of the rapid
intelligence matches have lead to a savings of over 120,000.xlvii
25

The Pathfinder Project The Pathfinder Project was a partnership between the Forensic Science Service, the
Lancashire Constabulary and Greater Manchester Police. It is also part of a broader
Home Office Crime Reduction Program. Initiated February 2000 with a grant of
£645,000 from the Home Office Targeted Policing Initiative, an additional £364,000 was
awarded to continue the project for an entire year. The project’s aim was to assess the
value of forensic science in solving, prosecuting and ultimately reducing burglary and
vehicle crime. DNA as well as fingerprints, footwear and tool marks were to be applied
to volume crime as opposed to limiting the technology to the more familiar applications
in violent crime scenes.
One of the specific goals of the project was to assess the effectiveness of Low Copy
Number DNA analysis in improving the scope and quality of evidence recovered at crime
scenes. Part of this assessment was the collection of LCN DNA swabs from burglary and
vehicle crime scenes and trialing various potential areas for LCN DNA recovery. The
project was also designed to assess the value of combining different forensic databases
such as DNA, footwear, fingerprints and tool marks.
The first phase of the project, crime scene examinations, commenced in June 2000 and
continued until May 2001. The intelligence linking aspect of the project continued until
August 2001, with the evaluation and assessment phase being completed in December
2001. A training element was incorporated into the project to ensure a better
understanding of forensic science and its potential to identify suspects. To assist in the
identification of persistent and serial offenders, the FLINTs system from West Midlands
Police was used. FLINTS is basically a computer system developed by West Midlands
Police used to maximize the value of information collected by officers on a daily basis.
26

Contributions of LCN to the project
During the first 6 months of the project all LCN sampling was performed by FSS
Examiners. During this period LCN samples were recovered from 51% of the crime
scenes attended. In the second phase of the project crime scene examiners in Lancashire
and GMP were trained to take samples. The recovery rate dropped to 12%. Thus, an
overall recovery rate of 19% was achieved in LCN sampling. While more study would
be required, the difference in recovery rates is a clear indicator of the value of crime
scene specialists and/or the value of training to crime scene evidence recovery.
Tools were most commonly sampled from burglary scenes, while the most often sampled
evidence from vehicles were ignition boxes and cowlings. Useable DNA profiles
developed through the LCN process varied between 23% for screwdrivers and 8% for
cowlings. It was noted however that the poor success rate for cowlings was influenced by
the fact that the area of the cowling available for LCN sampling was minimized so as to
ensure no loss of fingerprint detail. On average an overall success rate of 15% was
achieved for all sample types.
Project results
While the evaluation of the project was designed to analyze the cost effectiveness of
increased forensic activity (IE: the applications to burglary and vehicle crime) evaluators
found it difficult to draw such conclusions. This difficulty arose from the fact that while
Pathfinder was in operation, so were other programs such as the overall DNA expansion
program. Thus it was difficult to distinguish between the ultimate effects of the two
different initiatives.
One example of this issue can be seen in the fact that within the Pathfinder project
divisions, 6% of the crime scenes examined yielded DNA (Not including LCN type
samples). This represented a 73% increase in the number of samples recovered within the
Pathfinder divisions during the project. However, within the non-Pathfinder divisions an
increase of 45% was also observed over the same period.
27

A second example of this evaluation difficulty can be seen in the percentages of DNA
samples leading to the identification of a suspect. In Pathfinder divisions, 44% of the
DNA samples collected from the crime scenes identified a suspect. This represented a
57% increase in the number of DNA matches in those divisions. However, in the non-
Pathfinder divisions a greater increase of 59% was observed. This seemly incongruous
result may be due to the number of arrestees sampled during the project. Data from
Lancashire demonstrates that the CJ sampling rate was 30% higher in the non-Pathfinder
divisions.
Overall, the forensic identifications within Pathfinder were predominately in the form of
fingerprints at 61%. DNA accounted for 23%, LCN 12%, footwear 3% and tool marks
1%. Importantly though, it was found that the forensic identification was the first link to
a suspect in 45% of cases. In a further 11% of identifications the suspect had already
been identified but the evidence was weak. This suggests that forensic science was
necessary in approximately 55% of cases. According to police, of the 55% of cases
where forensic science was necessary to arrest and charge, officers considered that DNA
(including LCN) evidence was essential in 90% of cases, fingerprints were essential in
77% of cases, footwear in 66% of cases and tool marks in 40% of cases.
Following the cases through to the courts, 88% of cases resulted in a conviction. Only
4% of cases went to trial and of these the outcome was a 50:50 split between a guilty
verdict and acquittal.
(Note: Because there are no published evaluations of the Pathfinder Project, the
information on Pathfinder was obtained through direct communication with officials at
the Forensic Science Service)
28

29
Conclusion DNA technology is used more effectively in England and Wales than elsewhere because
it is no longer considered simply another forensic tool available to law enforcement.
Rather, it is considered to be an integrated and routine part of the investigative process. It
is not a technology to be used in special or particularly serious cases. It is a process
invested in so as to become a routine part of every investigation in which biological
material may be left by the perpetrator. Commitment to the use of DNA to solve volume
crime and to the rapid analysis of crime scene evidence is key to this effort.
The progression of DNA databasing laws has helped that process by allowing police to
utilize the profiles of individuals arrested or suspected of less serious crimes. Realizing
that serious offenders commit less serious offenses too, the UK database laws take
advantage of offender’s likelihood to commit minor offenses. And realizing that
offenders often commit more than one crime, allowing the use of suspect profiles
empowers law enforcement to identify perpetrators sooner and to consolidate evidence
and cases more effectively.
The Government has also followed up its expectations of the technology with the
appropriate amount of funding. Not only is the technology funded well, but that funding
is distributed wisely. By allocating the money directly to the law enforcement agencies
themselves, they encourage the police to be thoughtful about their evidence collection
and submission policies.
i Because of the way statistics are generated by the Forensic Science Service, this report focuses on the use of DNA technology in England and Wales. Statistics published and analyzed by the FSS include both countries. The statistics do not however, apply to the “United Kingdom” (England, Scotland, Wales and Northern Ireland) or to “Great Britain” (England, Scotland and Wales). ii Home Office Science Policy Unit, An Overview of the United Kingdom DNA Database, United Kingdom, Home Office, 2002. iii Forensic Science Service. iv The Home Office is the government department responsible for internal affairs in England and Wales. It is analogous to the United States Department of Justice. v Werrett, David, Chief Executive, Forensic Science Service, interview, July 17, 2003. vi A population approximately equal to the states of Texas and California combined.

30
vii United Nations Office on Drugs and Crime Center for International Crime Prevention, Seventh United Nations Survey of Crime Trends and Operations of Criminal Justice Systems, 1998 – 2002: 117. viii Busher, Lesley, “The Use of the UK National DNA Database to Support an Intelligence Led Approach to the Investigation of Crime,” Journal of Forensic Medicine, 2002: 21 – 25. ix Ibid., 21-25. x Ibid., 21-25. xi The six were arrested in 1974. They had left Birmingham shortly before the bombs exploded in two city centre pubs in the bloodiest ever IRA attack. Twenty-one people were killed, more than 160 injured. The men claimed in court they had confessed only after being beaten by police. A new inquiry by Devon and Cornwall Police into the original inquiry uncovered irregularities in the police case against the Six. New scientific tests show statements made by the Birmingham Six were altered at a later date. Scientists also admitted in court that forensic tests which were originally said to confirm two of the six had been handling explosives could have produced the same results from handling cigarettes. xii Roberts, Paul and Chris Willmore, The Royal Commission on Criminal Justice: The Role of Forensic Science Evidence in Criminal Proceedings, London: Crown Copyright 1993. xiii There is no law actually establishing the National DNA Database. Rather the law allows for the collection and retention of the samples for police use. The model for the sample collection was the collection of fingerprints. This fact, more than any other contributed to the creation of the database as being populated by suspects rather than convicted offenders. xiv Johnson, Paul, Paul Martin and Robin Williams, “Genetics and Forensics: Making the National DNA Database,” submitted for publication to Science Studies, 2003. xv Police and Criminal Evidence Act. xvi Johnson, Paul, et al, “Genetics and Forensics: Making the National DNA Database,” submitted for publication to Science Studies, 2003:12. xvii Ibid., 12. xviiiIbid., 12. xix A Caution is the formal disposal of a criminal case without the intervention of prosecutors or the courts. About a third of all criminal cases resulting in a criminal record are disposed of by a police caution rather than by conviction. Cautions are kept on record and can influence future prosecution and court decisions. xx It should be noted that the changes were challenged as contravening the European Convention on Human Rights right to privacy. Ultimately, under a balancing test weighing public benefit against individual privacy, the European Convention issues were resolved in favor of benefits to public interest. xxi Werrett, David, Chief Executive, Forensic Science Service, interview, July 17, 2003. xxii On July 17, 2003 the Home Office issued, on its website, the Executive Summary of an Inspector’s report recommending the privatization of the Forensic Science Service as well as the creation of an independent governing board for the National DNA Database. If accepted, such changes would occur in approximately 18 months to two years. The Home Office has not yet stated whether or not it will implement the recommendations. xxiii Represents one fiscal year, from April 2001 through March 2002. Unless otherwise indicated, similar yearly references will represent one fiscal year. xxiv Comptroller and Auditor General HC 523 session 2002-2003, “Improving Service Delivery: The Forensic Science Service,” Comptroller and Auditor General, March, 28, 2003: 5. xxv NAO report March 2003 xxvi A “recordable offence” is any offense which carries the possibility of a prison sentence. xxviiCriminal Justice & Public Order Act 1994 and Criminal Justice & Police Act 2001. xxviiiForensic Science Service, July 2003. xxix Forensic Science Service. xxx Forensic Science Service. xxxi Comptroller and Auditor General HC 523 session 2002-2003, “Improving Service Delivery: The Forensic Science Service,” Comptroller and Auditor General, March, 28, 2003: 15. xxxii Forensic Science Service, Annual Report, 2001-02, Forensic Science Service, 2002. xxxiii Comptroller and Auditor General HC 523 session 2002-2003, “Improving Service Delivery: The Forensic Science Service,” Comptroller and Auditor General, March, 28, 2003: 25. xxxiv There is the Chief police Officers Association to work on behalf of the members

31
xxxv Blakey, David, “Under the Microscope – Refocused : A revisit to the Investigative Use of DNA and Fingerprints,” HM Inspectorate of the Constabulary, June 2002: 1 xxxvi Ibid., 5. xxxvii Comptroller and Auditor General HC 523 session 2002-2003, “Improving Service Delivery: The Forensic Science Service,” Comptroller and Auditor General, March, 28, 2003: 14. xxxviii Bramley, Robert, Chief Scientist, Forensic Science Service, personal communication. xxxix Forensic Science Service. xl Werrett, David, Chief Executive, Forensic Science Service, personal communication. xli Forensic Science Service xlii Comptroller and Auditor General HC 523 session 2002-2003, “Improving Service Delivery: The Forensic Science Service,” Comptroller and Auditor General, March, 28, 2003: 6. xliii Ibid., 32 xliv Ibid., 32 xlv Forensic Science Service, Update, 1999. xlvi Bramley, Robert, Chief Scientist, Forensic Science Service, interview. xlvii Forensic Science Service, Annual Report 2001-2002, Forensic Science Service, 2002: 10.