the under-reporting of transfers in household surveys: its
TRANSCRIPT

1
The Under-Reporting of Transfers in Household Surveys: Its Nature and Consequences
Bruce D. Meyer, Wallace K.C. Mok and James X. Sullivan*
June 2015
Abstract
In recent years, roughly half of the dollars received through food stamps, Temporary Assistance for Needy Families and Workers’ Compensation have not been reported in the Current Population Survey. High rates of understatement are found also for many other government transfer programs and in other datasets that are commonly used to analyze income distributions and transfer receipt. Thus, this understatement has major implications for our understanding of the economic circumstances of the population and the effects of government programs. We provide estimates of the extent of transfer under-reporting for ten of the main transfer programs in five major nationally representative household surveys. We obtain estimates of under-reporting by comparing weighted totals reported by households for these programs with those obtained from government agencies. We also examine imputation procedures and the share of reported benefits that are imputed. Our results show increases in under-reporting and imputation over time and sharp differences across programs and surveys. These differences shed light on the reasons for under-reporting and are informative on the success of different survey methods. We present evidence on the extent of bias in existing studies of program effects and program takeup and suggest possible corrections. *Meyer: Irving B. Harris Graduate School of Public Policy Studies, University of Chicago, Chicago, IL 60637 Email: [email protected] ; Mok: Department of Economics, The Chinese University of Hong Kong, Hong Kong. Email: [email protected] ; Sullivan: Department of Economics and Econometrics, University of Notre Dame, Notre Dame, IN 46556 Email: [email protected] . This research was supported in part by the U.S. Social Security Administration through grant #10-M-98363-1-01 to the National Bureau of Economic Research as part of the SSA Retirement Research Consortium and by the Economic Research Service of the USDA through Cooperative Research Agreement 58-5000-6-0106, and the Research Grants Council of Hong Kong through the grant from the Early Career Scheme #459212. The findings and conclusions expressed are solely those of the authors and do not represent the views of the SSA, the ERS or any agency of the Federal Government, or the NBER. We thank participants at the Princeton Data Improvement Initiative Conference, the American Economic Association Annual Meetings, seminars at the Economic Research Service, the Institute for Social Research and the University of Chicago for their comments, and Stephen Issacson, Karen Peko and the staff at the Food and Nutrition Service, Kevin Stapleton at the Department of Labor, and Steve Heeringa at the PSID Statistical Design Group for help with data. We also thank Richard Bavier, Kalman Rupp, Robert Schoeni, and Frank Stafford for their helpful suggestions.

2
1. Introduction
Under-reporting of benefit receipt (or misreporting in general) has important
consequences for many types of analyses.1 First, under-reporting of benefits leads analyses to
overstate the dispersion of the income distribution of the entire population or various
demographic groups, such as the aged. For example, the official income and poverty report for
the U.S. (DeNavas-Walt and Proctor 2014) provides such statistics. Second, under-reporting of
benefits leads to an understatement of the effect of income transfer programs or taxes on this
distribution.2 Third, estimates of program takeup—the fraction of those eligible for a program
who participate—are biased downward.3
This paper provides information on the quality of individual reports of receipt of program
benefits for ten large transfer programs in five key US household surveys. We calculate the
reporting rate—the ratio of weighted survey reports of benefits received to administrative totals
for benefits paid out—for a wide range of programs, datasets and years. The proportional bias
can be obtained when these reporting rates are subtracted from one, and they generally provide a
lower bound on the extent of under-reporting. We relate the degree of under-reporting to
survey and program characteristics, such as form of interview, type of questionnaire, or potential
for stigma. This information is informative for both survey designers and data users. We
consider ways our results can be used to correct different types of data analyses. For example,
the reporting rates we calculate, under certain circumstances, can be used to make under-
reporting adjustments to survey estimates of benefit takeup rates.
The reporting rates that we discuss in this paper count imputed values as reported
numbers. The reporting rates would be much lower in many cases if these imputed values were
1 We refer to the subject of the paper as under-reporting rather than measurement error because the main pattern appears to be under-statement of benefits, rather than unbiased but potentially erroneous reporting. We should emphasize that we think of under-reporting as a synonym for under-statement or under-recording, since it is likely due to errors by both interviewers and interviewees. 2 For example, Jolliffe et al. (2005) examines the effects of the Food Stamp Program on poverty. Engelhardt and Gruber (2006) analyze the effects of social security on poverty and the income distribution. Meyer (2007), U.S. Census (2007) and Scholz, Moffitt and Cowan (2008) analyze the mechanical effects of a wide variety of programs and taxes on features of the income distribution. 3 For example, Blank and Ruggles (1996) examine the takeup of Aid to Families with Dependent Children (AFDC) and Food Stamps, while McGarry (2002) analyzes the takeup rate for Supplemental Security Income (SSI). A few takeup studies have corrected for under-reporting, such as Bitler, Currie and Scholz (2003) who examine the Women, Infants and Children (WIC) program. Some other studies use administrative data numerators that do not suffer from under-reporting. For surveys of research on takeup, see Remler and Glied (2003) and Currie (2006).

3
ignored. As a consequence, we also examine imputation rates and procedures, as they are both
needed to interpret reporting rates and are an independent measure of data quality. Our results
provide an important measure of data quality, but are only part of the picture.4
The programs we examine are Unemployment Insurance (UI), Workers’ Compensation
(WC), Social Security Retirement and Survivors Insurance (OASI) and Social Security Disability
Insurance (SSDI), Supplemental Security Income (SSI), the Food Stamp Program (FSP), the
Earned Income Tax Credit (EITC), Aid to Families with Dependent Children/Temporary
Assistance for Needy Families (AFDC/TANF), the Special Supplemental Nutrition Program for
Women, Infants and Children (WIC) program and the National School Lunch Program (NSLP).
These are all large transfer programs in the US, they distributed almost one trillion dollars in
2011. We calculate reporting rates in five large household surveys that are approximately
random samples of the entire civilian non-institutionalized U.S. population.5 The surveys are the
Current Population Survey – Annual Demographic File/Annual Social and Economic
Supplement (CPS), the Survey of Income and Program Participation (SIPP), the Panel Study of
Income Dynamics (PSID), the American Community Survey (ACS), and the Consumer
Expenditure Interview Survey (CE Survey). We calculate reporting rates and imputation rates
for as many years as is feasible. We account for definition and universe differences as well as
other data issues that affect the comparability of our estimates with their administrative
counterparts.
The datasets that we analyze are among the most important for social science research
and government policy. Income numbers from the CPS are the source of the official U.S.
poverty rate and income distribution statistics. The SIPP was specifically designed to determine
eligibility and receipt of government transfers. The PSID is the main source for information on
changes in income and poverty over a lifetime and for changes in income and inequality across
generations. The ACS is the replacement for the Census Long Form data and is the household
survey with the largest sample. As with the decennial Census, the ACS is vital in guiding
various public expenditures (Reamer, 2010). The CE Survey is the main source of consumption
information in the U.S. These datasets are among our most important for analyzing income and
4 Excellent summaries of data reporting issues in surveys include Moore, Stinson and Welniak (2000), Bound, Brown and Mathiowetz (2001), and Hotz and Scholz (2002). 5 We only consider surveys that cover the entire U.S. population to facilitate accurate comparisons since administrative data are often not available for all age groups and other characteristics that define certain surveys.
4
its distribution as well as transfer receipt. Thus, the understatement of transfers in these data has
major implications for our understanding of the economic circumstances of the population and
the effects of government programs across time.
In the next section we begin by describing the various methods that can be used to
examine under-reporting. We then describe our methods in detail as well as the statistical
framework to interpret how the reported estimates related to underlying true mean values. In
Section 3 we describe our main results on dollar and month reporting and provide some
comparisons to earlier studies. Section 4 describes imputation methods and the rates at which
transfers are imputed. Section 5 discusses caveats to our main results and potential biases.
Section 6 discusses characteristics of programs and surveys that may lead to under-reporting and
possible lessons from our results. Section 7 describes adjustment methods and examples of how
the estimates in the paper may be used. Section 8 concludes. A detailed data appendix provides
sufficient information to reproduce our results can be obtained from the authors.
2. Research Design and Methods
Past work on the extent of transfer under-reporting has mainly used two approaches. The
first approach is the one taken here, the comparison of weighted microdata to administrative
aggregates. A second approach compares individual microdata to administrative microdata.7
Neither approach has been used on a broad scale. Comparisons to administrative aggregates
have been used more widely, but results are only available for a few years, for a few transfer
programs and for some of the key datasets. Important papers include Duncan and Hill (1989),
Coder and Scoon-Rogers (1996), and Roemer (2000). These papers tend to find substantial
under-reporting that varies across programs.8 Comparisons to administrative microdata are even
more limited in the literature. Such approach has often been restricted to a single state, year,
program and dataset (Taeuber et al. 2004). Examples of studies that examine more than one
7 Bound et al. (2001, p. 3741) divide micro level comparisons into several types. We use a simpler categorization here and focus on their “complete record check study” category. 8 Studies that make comparisons to administrative aggregates for variables other than income is Barrow and Davis (2012).

5
program (but still a single dataset) include Moore, Marquis and Bogen (1996), Sears and Rupp
(2003) and Huynh et al. (2002).9
A third way to examine under-reporting is to compare the characteristics of program
recipients in administrative and survey data. This approach has been applied to under-reporting
in the Food Stamp Program (Meyer and Sullivan 2007a). Intuitively, the differences between the
characteristics of recipients in the two data sources can be used to determine how those
characteristics affect reporting. This approach can be used for many datasets and programs and
many years, but relies on the survey data and the administrative data representing the same
population. Biases in the estimated determinants of reporting could come from imputations,
inaccurate weights and false positive reporting (i.e. non-recipients who report receipt) in the
survey data.
Our analyses focus on how under-reporting has changed over time and how it differs
across programs and datasets. We compare weighted survey data to administrative aggregates
because this approach can be used for the widest range of transfer programs, the longest time
period and many datasets. We would also like to know how reporting varies with individual
characteristics, but matches to microdata have been quite limited in their scope. Furthermore,
the use of information from microdata matches is likely to be combined with the aggregate data
described here to adjust for changes over time or differences across datasets. This combination
of data could be used to extrapolate results from a one-year microdata match to other years.
2A. Calculating Reporting Rates
A dollar reporting rate (RRD) can be defined as the following ratio:
Similarly, one can define a month reporting rate (RRM) as
9 In related work, Card, Hildreth and Shore-Sheppard (2001) examine Medicaid reporting in the SIPP in California for several years.

6
The weaknesses of this approach are that it relies on the accuracy of weights and the
comparability of sample universes. The approach may understate non-reporting by true
recipients because of false positive reporting by non-recipients. We provide some
estimates of false positive reporting rates in Section 5. We calculate dollar and month
reporting rates for our ten programs for as many individual years as are available for the
five surveys. 10 The benefit programs available by year and respondent type are reported
in Appendix Tables 1 and 2 in summary form for the PSID and the CPS, respectively.
The remaining datasets are less complicated, but descriptions of the data sources can be
found in the Data Appendix. In the case of the SIPP, we should note that our approach of
examining reporting rates by calendar year will at times mask differences in reporting
rates across these SIPP survey panels and over time within panels, especially when data
from multiple panels are available for the same calendar year.11
2B. Making the Numerator and Denominator Comparable
We make a number of adjustments in order to make the administrative and survey data
totals comparable. All of our household surveys include only individuals living in the 50 states
and the District of Columbia. Consequently, to maintain comparability, for most programs in
most years, we are able to exclude from the administrative totals payments to those in U.S.
territories and those outside the U.S. In other cases, we subtract estimates of the share of such
payments obtained from years when this information is available. Specifically, we use the
dollars paid to those in the U.S. territories (and outside the U.S. in the case of OASI and SSDI)
for FS, OASI, SSDI, SSI and UI reported in various official publication. We also adjust the
administrative monthly counts using these data because we do not have other alternatives. For
most programs these adjustments are typically small, ranging from less than 0.02% (SSI) to
about 3% (SSDI). The notable exception is the Food Stamps Program, where dollars paid to
U.S. territories constituted about 10% of the total prior to 1982.14
10 We should emphasize that in some cases one can calculate dollar and month reporting rates for sub-groups using administrative totals for geographic areas or demographic groups defined by characteristics such as age and gender. 11 See the data appendix for details on how yearly estimates are calculated. 14 About 97% of the U.S. territory payments went to Puerto Rico. Payments to those in Puerto Rico under the Food Stamp Program were replaced in 1982 by a block grant program called the Nutrition Assistance Program.

7
For some programs (SSI, SSDI, OASI), the institutionalized can receive benefits but such
individuals are excluded from all of our survey datasets.15 To adjust for this, we rely on data
from the Decennial Censuses (which include the institutionalized) and the 2006 ACS to
determine the share of dollars that are likely missed in the five surveys. We simply reduce the
administrative data totals by the share of Census/ACS dollars that are received by the
institutionalized.16 Some programs, such as AFDC/TANF cannot be received while
institutionalized, but it is possible that some individuals are not institutionalized and receive
benefits during the survey’s reference period, but then become institutionalized during the
survey’s sampling period. Currently, we ignore this possibility because we expect it to be
infrequent.
Another comparability issue is the possibility that recipients of transfers in the previous
year could subsequently die before being interviewed the next year. This is a potential concern
because all of the surveys (except for the SIPP) ask about income during the previous year.17
Previous studies have adjusted for decedents by applying age, gender and race specific death
rates to the data (Roemer 2000). However, if survey weights have previously been calculated to
match survey weighted population totals with universe population estimates by age, gender and
race then such an adjustment is unwarranted. A case could be made for adjusting the data if
these characteristics are nonstationary (but such an adjustment is likely to be small), or if the
adjustments were based on additional individual characteristics which are not used to determine
weights but are related to death, such as receipt of SSDI or SSI or other programs. Because we
do not have this information, we do not adjust for decedents. Consequently, SSDI and SSI
reporting ratios are likely to be biased downward somewhat, since recipients likely have a higher
mortality rate than the average person of their age, gender and race, and consequently are more
likely to miss the interview the following year.18
A significant difficulty in several of the datasets is that there are at least some cases
where Social Security Disability benefits are combined with Social Security Retirement and
Survivors benefits. In these circumstances, we will use the data published in the various issues of 15 The institutionalized are included in the 2006 ACS. However, we exclude these individuals from our survey estimates to maintain consistency with the other estimates. 16 In 2000, the share of dollars received by the institutionalized reaches 3.4 percent for OASI and 4.5 percent for SSI. 17 The CPS and PSID ask about the previous calendar year, while the ACS and CE Survey ask about the previous 12 months. 18 It might be possible to correct for this potential source of bias with administrative data or data from the PSID.

8
the Annual Statistical Supplement to the Social Security Bulletin (U.S. Social Security
Administration, various years) to calculate for each year, age, in school status, and gender cell,
the proportions of total social security dollars that are paid to OASI and SSDI recipients. We use
these proportions to allocate combined SSDI and OASI benefits to the separate programs
whenever we have incomplete information about which program was received and whenever a
combined amount was reported for the programs. This allocation procedure is used for all
OASDI dollars and months in the CPS, ACS, and the CE Survey, and most years in the PSID.19
For the SIPP and the PSID (during 1983-1992 and 2003), it applies to a small share of dollars as
indicated in section 4 of the Data Appendix.
The PSID sample weights are not appropriate for weighting to the universe in some
years. We adjust them in a manner suggested by the PSID staff (see the Data Appendix for more
details). Also in the PSID, benefit receipt by family members besides the head and spouse is not
recorded in some years. We account for these other family members using estimates of their
share from the years when their benefit receipt is available. Finally, we convert fiscal year
administrative data to a calendar basis by appropriately weighting the fiscal years.
2C. Statistical Framework
Program reporting can be separated out into a possibly mismeasured binary random
variable Ri for receipt and a nonnegative random variable for dollars Di, or the length of period
received, such as months, Mi conditional on recorded recipiency (these last two variables are
taken to be zero when receipt is not recorded). Denote the corresponding correctly measured,
but unobserved, random variables Ri*, Di* and Mi*. Recorded dollars and months are RiDi and
RiMi. The expected values of the dollar and month reporting rates can then be written as
E[RRD]=E[RD]/E[R*D*], while E[RRM]=E[RM]/E[R*M*]. In the case where a receipt
response is available for each month (as is typically true in the SIPP) E[RRM] has the simpler
form E[R]/E[R*].
In general, we can write
19 The procedure is also used in the SIPP when we cannot unequivocally differentiate between SSDI or OASI (e.g. when an individual reports receipt of both).
9
(1)
1*|*
]0*,1|[)1(]1*,1|[)1(
*]*[
][][
1001
RDE
RRDERRDE
DRE
RDERRE D
and
(2)
1*|*
]0*,1|[)1(]1*,1|[)1(
*]*[
][][
1001
RME
RRMERRME
MRE
RMERRE M
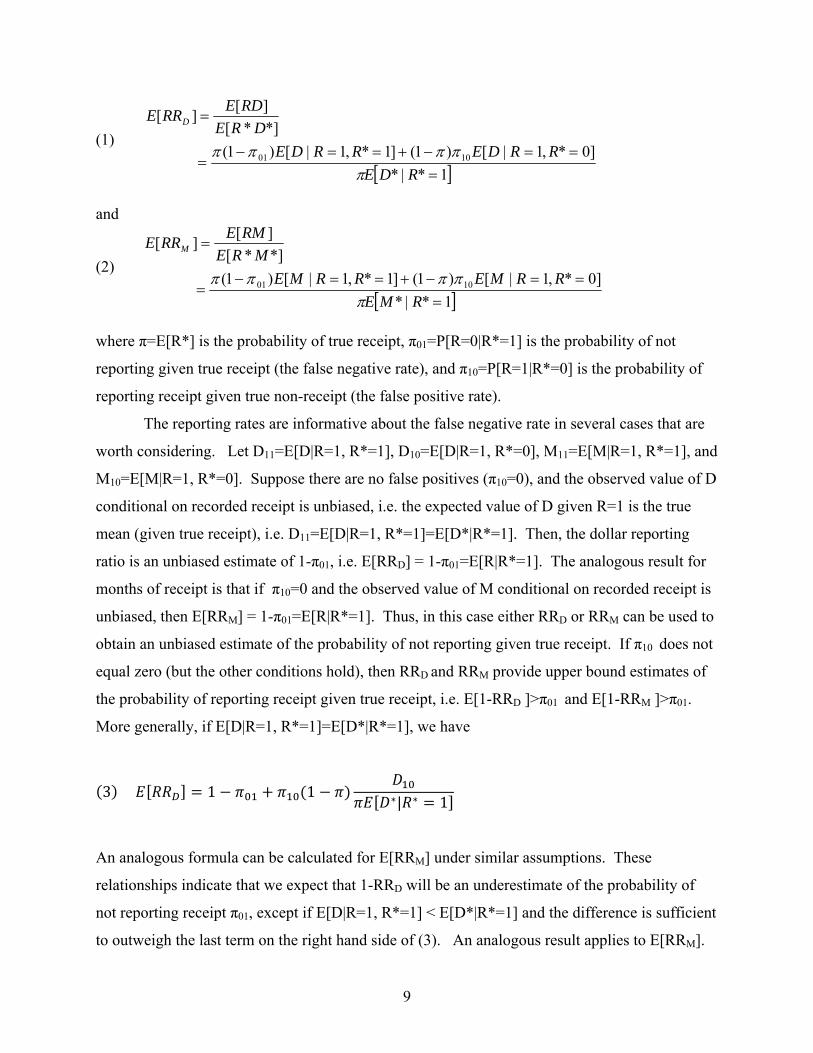
where π=E[R*] is the probability of true receipt, π01=P[R=0|R*=1] is the probability of not
reporting given true receipt (the false negative rate), and π10=P[R=1|R*=0] is the probability of
reporting receipt given true non-receipt (the false positive rate).
The reporting rates are informative about the false negative rate in several cases that are
worth considering. Let D11=E[D|R=1, R*=1], D10=E[D|R=1, R*=0], M11=E[M|R=1, R*=1], and
M10=E[M|R=1, R*=0]. Suppose there are no false positives (π10=0), and the observed value of D
conditional on recorded receipt is unbiased, i.e. the expected value of D given R=1 is the true
mean (given true receipt), i.e. D11=E[D|R=1, R*=1]=E[D*|R*=1]. Then, the dollar reporting
ratio is an unbiased estimate of 1-π01, i.e. E[RRD] = 1-π01=E[R|R*=1]. The analogous result for
months of receipt is that if π10=0 and the observed value of M conditional on recorded receipt is
unbiased, then E[RRM] = 1-π01=E[R|R*=1]. Thus, in this case either RRD or RRM can be used to
obtain an unbiased estimate of the probability of not reporting given true receipt. If π10 does not
equal zero (but the other conditions hold), then RRD and RRM provide upper bound estimates of
the probability of reporting receipt given true receipt, i.e. E[1-RRD ]>π01 and E[1-RRM ]>π01.
More generally, if E[D|R=1, R*=1]=E[D*|R*=1], we have
3 1 1 ∗| ∗ 1
An analogous formula can be calculated for E[RRM] under similar assumptions. These
relationships indicate that we expect that 1-RRD will be an underestimate of the probability of
not reporting receipt π01, except if E[D|R=1, R*=1] < E[D*|R*=1] and the difference is sufficient
to outweigh the last term on the right hand side of (3). An analogous result applies to E[RRM].

10
These equations are also informative regarding the interpretation of the relationship
between RRD and RRM. In many cases, we will find that the two reporting rates are not that
different, so it is useful to consider what might lead to this result. Suppose there are no false
positives (π10=0), D11=E[D*|R*=1], and M11=E[M*|R*=1], then the dollar and month reporting
rates will be the same in expectation. More generally, even if dollar and month reporting
conditional on reported receipt are biased, but biased by the same amount, then dollar and month
reporting rates will be equal in expectation. Another important case to consider is one where
month reporting is based on a yes or no question (as in the SIPP), so that trivially M11= M10=
[M*|R*=1]. If RRD and RRM are equal, and we are willing to assume D11=D10, then we know
D11= D10=E[D*|R*=1], i.e. dollar amounts are reported correctly on average. Finally, in the
case when months come from a question regarding the number of months received, if the two
reporting rates are equal and we are willing to assume D11=D10 and M11=M10, then either we are
estimating dollars and month on average right or we are understating both dollars and months by
the same ratio.
3. Reporting Rate Results
Table 1 indicates the years and programs available for each dataset when a
reporting rate can be calculated. Information on dollars received generally begins in the
1970s on programs in the PSID, CPS and CE Survey. SIPP program information begins
generally in 1983, while the ACS is more recent, beginning in 1999. We examine dollar
reporting rates for eight programs in the CPS, seven programs in the SIPP, PSID, and CE
Survey and five programs in the ACS. Information on monthly participation is more
limited. We can calculate reporting rates for seven programs in the PSID, the SIPP and
the CPS, and three in the ACS. We could calculate participation for several programs in
the CE Survey, but have not done so.
3A. Dollar Reporting Rates
Figure 1 presents the dollar reporting rates for AFDC/TANF and the FSP/SNAP
programs for the CPS, PSID, and SIPP. The rates for these surveys as well as for the CE
Survey and the ACS are also provided in Appendix Tables 3 and 4. Since 2003 both the

11
PSID and the CPS have had years when less than half of TANF dollars were recorded.20
In the SIPP under seventy percent of TANF dollars have been recorded in several recent
years and less than half of TANF dollars have been reported in the CE Survey recently,
while over eighty percent of TANF dollars have been captured by the ACS (Appendix
Table 3).21 The reporting rates for FSP/SNAP are also well below one. In the PSID and
the SIPP, approximately eighty percent of FSP/SNAP dollars are reported, while in the
remaining surveys it is closer to 60 percent.
Reporting rates for AFDC/TANF and FSP/SNAP have fallen over time. The CPS
provides perhaps the clearest case. The dollar reporting rate for AFDC/TANF never falls
below 0.69 between 1975 and 1990, but it has not exceeded 0.57 since 2000. There is
also a noticeable decline in reporting rates for FSP/SNAP in the CPS. In the PSID, there
is a low rate during much of the 1990s, but a recent improvement.
Figures 2A-2C provide information on OASI, SSDI, and SSI reporting. The
reporting rates for these programs for five surveys are also provided in Appendix Tables
5 through 8. The rates in Figures 2A and 2B indicate that Social Security benefits are
recorded well in the surveys, with average reporting rates near ninety percent in all cases
except the ACS. There is also no apparent decline over time in reporting. SSDI is
particularly well reported in the PSID and the CPS. There appears to be some over-
reporting in the PSID, with reporting rates over one for much of the 1970s through 1990s.
This over-reporting does not seem to be due to the imputed allocation of OASDI between
OASI and SSDI, which is often necessary, as the rates are similar during the period when
the type of benefits was directly recorded (1983-1992). For example, between 1980 and
1982, when OASDI needed to be allocated, the dollar reporting averaged 1.02, while it
was also 1.02 between 1983 and 1985, when OASI and SSDI were reported directly. In
20 The surveys worked to lessen any confusion that occurred with welfare reform. For example, the CPS had interviewers in a given state ask about TANF using the state specific name for the program. 21 As explained in section 4B, one reason the reporting rates are lower in the CE Survey and the PSID in some years is that these surveys do not impute income in some years. It should also be noted that in the ACS and the CE Survey the questionnaire asks for “Public Assistance” (or cash assistance) rather than just AFDC/TANF. Respondents may therefore report other non-AFDC/TANF benefits. Most of these other cash benefits are small except for General Assistance (GA). Therefore, in the last two columns of Appendix Table 3 we also provide ACS and CE Survey reporting rates when we compare the survey reports with the sum of AFDC/TANF and GA administrative totals. When GA is included, the CE Survey accounts for over half of the dollars until 1996, after which the drop in reporting becomes considerably more pronounced. By 2004, only about a quarter of the dollars are reported in the CE Survey.

12
the ACS, reporting of SSDI is not quite as good as the other sources, with almost thirty
percent of benefits not recorded. SSI is reported at a higher rate than AFDC/TANF or
FSP, but one-third of dollars are missing in the PSID and one-quarter in the CPS. There
is little pattern of decline in SSI reporting over time, except in the PSID.
Figures 3A and 3B present the dollar reporting rates for unemployment insurance
and Workers’ Compensation. Unemployment insurance dollars indicate somewhat better
reporting than for AFDC/TANF, and less evidence of a decline over time, though a fall is
still clear in the CPS and the CE Survey. About seventy percent of dollars are on average
reported in the PSID, the SIPP and the CPS, while just under half are reported in the CE
Survey. The ACS does not have specific questions about unemployment insurance (it is
combined with Veterans’ payments, child support and alimony).23 Under-reporting is
particularly severe for Workers’ Compensation. Typically less than half of all WC
dollars are recorded in the surveys (again the ACS does not ask specifically about WC).
A decline in reporting over time is less evident, except for in the CE Survey and in the
PSID after 2000. We should note that we have included lump sum payments in the
administrative totals. It has been argued elsewhere that the CPS and the SIPP intend to
exclude lump sum payments. It is difficult to see what wording in the questionnaires
would lead to this exclusion, and past authors have suggested that lump sums may not be
consistently excluded (see Coder and Scoon-Rogers 1996, pp. 15-16, Roemer 2000, pp.
33-34).
We have also looked at Earned Income Tax Credit payments in the CPS.24 CPS
reporting rates for the EITC have a different interpretation than those for the other
programs. All EITC payments are imputed based on family status, earnings, and income.
Therefore under-reporting comes from errors in one of these variables, the imputation
process, or noncompliance as discussed in Section 6 later. The implicit assumption is
that all eligible individuals receive the credit, which should lead the approach to overstate
receipt. However, the reverse is true as under seventy percent of EITC dollars are
23 The PSID UI reporting rate in 2003 is very low, possibly due to the information being collected in the 2005 survey. Individuals may have more difficulty recalling receipt two years ago than one year ago. 24 See Appendix Table 11 for EITC results. We considered including EITC reporting rates for the SIPP. However, most respondents to the topical module that asks about EITC receipt and amounts refuse to answer the questions, don’t answer, or don’t know (see Lerman and Mikelson 2004).

13
accounted for in the CPS on average and in recent years. These low rates suggest that the
types of errors suggested above are quite frequent.
3B. Month Reporting Rates
We also examine average monthly participation reporting rates when possible.25
For AFDC/TANF and FSP respectively, monthly participation reporting rates are very
similar to the corresponding dollar reporting rates in Figure 2. In the case of
AFDC/TANF the three datasets with both months and dollars indicate average reporting
rates of 0.47 (months) and 0.42 (dollars) for the PSID, 0.77 (months) and 0.71 (dollars)
for the SIPP and 0.63 (months) and 0.59 (dollars) for the CPS. In the case of FSP, the
reporting rates are even more similar, with the two types of reporting rates never differing
by more than 0.001 for the three datasets. For both AFDC/TANF and the FSP, month
reporting comes from a mix of direction questions about each month (the SIPP) and
questions about the number of months received (the CPS and the PSID). In the case of
the SIPP, assuming that the reported monthly benefit of those who are true recipients and
those who are not is similar (D11 approximately equals D10), this result suggests that
individuals report about the right amount on average, conditional on reporting. Or, put
another way, most of under-reporting consists of not reporting at all, rather than reporting
too little conditional on reporting (see Meyer, Mok and Sullivan 2015; Meyer and Mittag
2015). The dollar reporting rates are slightly lower than the month reporting rates,
suggesting that there is a small amount of under-reporting dollars conditional on receipt,
nevertheless. In the case of the CPS and the PSID, the evidence suggests that total
dollars and months are understated by similar amounts, again suggesting that monthly
benefits are reported about right on average, conditional on reporting.
For OASI, SSDI, SSI and WIC, reporting rates for monthly receipt are similar to
dollar reporting rates, but the similarity is not as close as it was for AFDC/TANF and
FSP. For these four programs, the surveys besides the SIPP do not report monthly
participation, only annual unique participation. Since our administrative numbers are for
monthly participation, we use the relationship between average monthly and annual
25 These rates are available in Appendix Tables 12 through 18 for seven programs (FSP, AFDC/TANF, SSI, OASI, SSDI, WIC, and NSLP).

14
unique participation calculated in the SIPP to adjust the estimates from the other sources.
This adjustment step likely induces some error that accounts for the weaker similarity
between month and dollar rates. If we just focus on the SIPP, where this adjustment step
is not needed, the two rates are much closer and the dollar rate is lower than the month
rate, as we saw above.
Average monthly participation reporting rates for the National School Lunch
Program (NSLP) are reported in the appendix. In the PSID and CPS, free and reduced
price lunches are combined, while in the SIPP we have separate columns for the two
types. Reporting seems to be quite low for the PSID and CPS at 54 percent on average.
In the SIPP, on the other hand, more participants are reported than we see in the
administrative data. For reduced price lunches, almost fifty percent more participants are
reported than actually receive lunches. This result is likely due to our assumptions that
all eligible family members (ages 5-18) receive lunches and that they do so for all four
months of a given wave.
3C. Comparisons to Earlier Studies
Estimates similar to those reported above are available in previous studies for some
surveys for a subset of years and programs. Our estimates are generally comparable to those in
these earlier studies, although discrepancies arise that are often due to methodological
differences.26
Coder and Scoon-Rogers (1996) provide reporting rates for five of our programs for 1984
and 1990 for the CPS and the SIPP. Roemer (2000) reports reporting rates for the same five
programs for 1990-1996 for the CPS and the SIPP. Our reporting rates differ from Roemer’s in a
number ways. His reporting rates average about one percentage point higher than our OASDI
numbers, likely due to differences in accounting for decedents. His SSI and WC reporting rates
are each about five to ten percentage points higher. The SSI difference appears to be due to
Roemer’s adjustment for the decedents, while the WC difference seems to be due to his
exclusion of lump sum payments from the administrative data. Our UI and AFDC/TANF
numbers tend to be within a few percentage points, with his UI numbers lower and the
26 See Section 5 for a comparison of our results to those from studies of microdata matches.

15
AFDC/TANF numbers generally higher than ours. Nevertheless, both our results and Roemer’s
do suggest a decline in survey quality over time as measured by benefit reporting.
Duncan and Hill (1989) have also studied the extent of benefit under-reporting in the CPS
and PSID. They report that in 1979, the CPS accounts for about 69% of SSI, 77% of AFDC
income, and 91% of Social Security/Railroad Retirement income. They have also reported that
in 1980, the PSID accounts for about 77% of AFDC income, 84% of SSI income and about 85%
of Social Security Income. For Social Security and AFDC, their numbers are quite similar to
ours. For SSI, however, our PSID reporting rates are somewhat lower than theirs. This
difference might be due to the difference in the re-weighting algorithm employed, and that we do
not account for those who receive benefits but die during the survey year. To account for this
latter issue, Duncan and Hill adjust the reporting rate up 5 percent.
3D. Summary
Reporting rates for all programs, measured as dollars reported in a household
survey divided by administrative reports of dollars of benefits paid out, are in almost all
cases considerably below one. Household surveys fail to capture a large share of
government transfers received by individuals.
Reporting rates vary sharply across programs. OASI payments and SSDI
payments are reported at a reasonably high rate. Over eighty percent of OASI benefits
are reported in all but one year in the CPS and the SIPP and over seventy percent in the
PSID. The reporting rates for SSDI tend to be higher. Nevertheless, typically more than
ten percent and frequently a higher share of Social Security retirement benefits are not
reported.
Reporting rates are especially low for certain programs. Only about fifty percent
of Workers’ Compensation benefits are reported in the CPS and an even smaller share is
reported in the SIPP and the PSID. Reporting rates for AFDC/TANF average below
seventy percent in all surveys except the SIPP and the ACS (when GA is not included).
Average reporting rates for UI and the FSP range from 50 to 82 percent across surveys.
The reporting rate for SSI differs sharply across surveys with over 100 percent reported
in the SIPP, but typically under 70 percent in the PSID and the CE Survey.

16
Surveys differ systematically in their ability to capture benefit receipt. The SIPP
typically has the highest reporting rate for government transfers, followed by the CPS and
the PSID. There are programs, however, that the other surveys do seem to capture
somewhat better. Unemployment Insurance and Workers’ Compensation are reported at
a slightly higher rate in the CPS than in the SIPP.
3E. Regression Estimates
To summarize and quantify the differences between surveys and programs described
above, we estimate a series of regressions with the reporting rate as the dependent variable.
Specifically, we estimate equations of the form
,111)4(1
1}{
1
1}{
1
1}{ pst
T
ttyeart
S
sssurveys
P
ppprogramppstR
where Rpst is the dollar or month reporting rate for program p in survey s in year t. We
exclude the EITC because it is qualitatively different from the other programs as it is
entirely imputed, and we alos exclude the NSLP because the data come in a different
form and more imputation is required. We include separate reporting rates for OASI and
SSDI, but not the combined reporting rate. We estimate separate equations for dollar and
month reporting rates, using the set of programs that is available in each case. The results
are reported in Table 2. For AFDC/TANF in the ACS and CE Survey, we include only
the reporting rates that account for GA.
The estimates in columns 1 and 2 indicate that the programs can be ranked by the
dollar reporting rate, from best to worst in the following order: SSDI, OASI, SSI,
FSP/SNAP, UI, AFDC/TANF, and WC. Column 3 examines this relationship for recent
years, specifically since the year 2000. The same pattern holds in recent years, OASI
and SSI are reported better than the base group (SSDI) now. The month reporting rate
regressions in columns 4 through 6 are very similar to the dollar reporting rate ones,
though we do not have rates for UI and WC.
Estimates of equation 4 also provide a ranking of the different surveys in terms of
reporting. One should bear in mind that the dollar reporting rate is only one measure of
data quality, and one that can be inflated by false positive reporting or imputation (that
may lead to false positive reporting). The estimates suggest that overall dollar reporting
17
is highest in the SIPP and CPS, followed by the ACS, PSID, and CE Survey in that order.
This ordering also roughly holds when we examine the patterns after 2000, either by
interacting survey with an indicator for the years starting with 2000 (column 2), or by
estimating using only data from 2000 forward (column 3). The ordering of the surveys
is somewhat different for month reporting rates. Overall, ACS has the lowest month
reporting rate, despite having the lowest survey non-response rate (Meyer, Mok and
Sullivan 2015). All three surveys though, have reporting rates generally well below those
of the SIPP. However, the SIPP in part does well because it tends to have the highest
imputation rate as we report below, while the CPS has a lower rate, and the PSID an even
lower rate yet. Prior to 2004, the CE Survey did not impute income.
We also examine trends in reporting by program and dataset by regressing the
dollar and month reporting rates on a constant and a time trend.27 The results (which are
reported in Meyer, Mok and Sullivan, 2015) indicate that most programs in the PSID,
CPS and CE Survey show a significant decline in dollar reporting over time, while there
is a significant decline in month reporting for most CPS programs. The time trends in
reporting in the SIPP and ACS are less pronounced. The exceptions to the general fall in
reporting are SSI in the case of the ACS and the SIPP and OASI, which have rising
reporting rates.
4. Imputation Methods and Shares
Reporting rates are only one indicator of survey quality. Rates of survey and item
nonresponse are two others (see the discussion in Meyer, Mok and Sullivan 2015). All of
the surveys we examine impute answers in some cases of item nonresponse. We describe
the methods used to impute these missing values below. We should emphasize that all of
the reporting rates we have presented include imputed values in the survey totals. A
survey’s reporting rate may be high, in part, because a substantial amount of program
dollars or months are imputed. In addition, as emphasized in Section 2C, reporting rates
are biased upward as a measure of reporting conditional on true receipt if there are false
27 We estimate OLS, Cocharne-Orcutt, and Prais-Winsten versions of these regressions.
18
positives. One of the most likely reasons for false positives is recipiency imputation.28
Imputed dollars or months conditional on receipt is also likely to induce error.29 Surveys
may impute recipiency—whether or not a person received a given type of benefit at all—
or dollars or months of benefits received conditional on reported or imputed receipt. In
this section, we discuss the importance and implications of such imputation in our
surveys.
4A. Imputation Methods
For the ACS and the CPS, the strategy employed to impute missing data is known as
“Hot-Deck” imputation or “Allocation”. A hot deck is a data table/matrix which stores the
values of donor values, stratified by characteristics. Missing data are assigned by using the
values from a donor in the hot deck who shares similar demographic and economic
background.30
For the SIPP, a somewhat more complex algorithm is used to impute missing data. For
the 1984-1993 panels, hot-deck imputation is used to impute missing data in each wave of the
panel.31 Beginning in the 1996 panel, however, the Census Bureau began to impute missing data
in a wave by using the respondent’s data in the previous wave (if available). In this study, we
regard such method as a form of imputation. Readers who are interested in how the SIPP
imputes missing data can refer to Chapter 4 of U.S. Census Bureau (2001) and Pennell (1993).32
28 Clearly an alternative would be to exclude all observations with imputed values and reweight by scaling all weights upward by the inverse of the share of weights of non-imputed observations. However, if item nonresponse is nonrandom, then such a strategy will lead to bias. 29 Not all types of imputation are necessarily bad. If the appropriate benefit schedule can be determined for an individual and one has the inputs to the formula well measured, the imputations may be more accurate than self reports. However, that is not the way imputation is done for the programs and surveys we examine. Hot deck imputation is the most common method (see Andridge and Little 2010), which likely leads to greater measurement error than self-reports. 30 The imputation flags in the CPS-ASEC should be used with caution. Since the CPS-ADF/ASEC is a supplement to the basic monthly CPS, there are interviewees who responded to the basic CPS survey, but not the ADF/ASEC. The imputation (allocation) flags for these individuals are set to zero (i.e. no allocation) even though data for these individuals are imputed. The variable FL-665 (available in the 1991-2008 surveys) is used to distinguish individuals who participated in the basic survey but not to the ADF/ASEC. 31 The Census Bureau also provides SIPP “full panel files” for the 1984-1993 panels that link all the waves in a panel together. Additional imputations are implemented in these full panel files. 32 For those who do not respond to the SIPP interview (person non-response), the imputation flags indicate whether the hot-deck donor is imputed, not the non-responding individual. Thus one has to adjust the imputation flags for these non-respondents (see section 4-13 of U.S. Census Bureau, 2001).
19
To reduce non-response to the income questions, the SIPP began the use of “Dependent
Interviewing” in wave 2 of the 2004 panel in which the interviewers use information from the
prior wave to tackle item non-response during the actual interview. For instance, in the event of
non-response, the interviewer asks “It says here that you received $X in the last interview, does
that still sound about right for the last 4 months?” Although this method is designed to reduce
non-response, Moore (2006) finds that there “is evidence of improper use of dependent follow-up
procedures by SIPP interviewers, resulting in very high rates of initial non-response to the wave
2 amount items in the 2004 panel.” Our SIPP imputation rates for 2004 are very high, a finding
in line with Moore’s conclusion.
For the CE Survey, we only include “complete income reporters” and reweight the
estimates. Complete income reporters are those who do report at least one major sources of
income (such as wages and salaries, self-employment income, social security income). Thus,
complete income reporters may have missing income data. For the CE Survey, missing income
data are not imputed prior to the 2004 survey. Beginning with the 2004 survey, a regression-
based method is used to impute missing income data. If an individual indicates receipt of a
source of income, but does not provide an amount, then his amount is imputed. If a respondent
provides no information on income for any sources at the consumer unit level and no member of
the consumer unit provides income at the individual level, and no member is imputed to be a
worker, then the receipt of transfers (yes/no) is imputed, along with amounts. First, the BLS runs
a regression of a type of income on demographic characteristics and a variable that equals the
quarterly expenditures of a consumer unit; the data used in this regression come from the valid
non-zero reporters. After estimating the regression, the estimated coefficients are perturbed by
adding random noise; an estimate is then produced using the resulting coefficients. This process
is performed five times in total, yielding five estimates. The imputed value is then the mean of
these five estimates. See Fisher (2006) and Paulin et al. (2006) for more details.
Prior to the 1994 survey, the PSID imputed missing income data by using the hot-deck
imputation method with the hot deck built using data from previous and current interviews.
Beginning with the 1994 survey, however, the PSID ceased imputing missing data.
4B. Imputation Shares
20
We report CPS, SIPP and ACS imputation shares as a consequence of item nonresponse
for various transfer programs. For the PSID and CE Survey we do not have information on
imputation shares. We also report total imputation rates for dollars or months that incorporate
yes/no and imputation conditional on that yes/no response.
Figures 4A and 4B report the share of recorded dollars that is imputed in the CPS
and SIPP for six of our programs. We report the share of dollars accounted for by all
types of imputation, and in the case of SIPP, we treat “Statistical or Logical Imputation
using Previous Wave Data” as non-imputation unless the original data are imputed. On
average, these rates are around 25 percent, but imputation has risen over time in both
surveys for all programs. In 2008, the imputation shares in the CPS ranged from 21
percent of FSP/SNAP dollars to 34 percent of social security dollars. Overall, the SIPP
has higher imputation rates than the CPS. This difference needs to be taken into account
when comparing reporting rates and other measures of data quality across surveys.
Appendix Table 19 reports dollar imputation shares for the ACS. These shares always
exceed ten percent and are fairly similar across programs.
In Appendix Tables 20 and 22 we also report the share of total dollars reported
attributable only to those whose recipiency is imputed. Typical recipiency imputation
shares are on the order of 10 percent, but they are frequently higher. There is substantial
variation across program and over time. For most of the years since 2000, recipiency
imputation exceeds 20 percent for AFDC/TANF. The rise in recipiency imputation over
time is less pronounced than that for overall imputation.
Appendix Tables 21 and 23 report the share of months that are imputed in the
CPS and SIPP for the programs where data on months is available. The numbers are
similar to those for dollars for both recipiency imputations and all imputations.33 In
recent years, at least ten percent of months are imputed in the CPS for all four programs.
Imputation rates were comparable across programs in the early 1990s, but rates for
AFDC/TANF and the FSP have risen more noticeably over time. For the SIPP, shares
are sometimes below ten percent, but are more typically between ten and twenty percent.
33 All imputation numbers for OASDI and SSI in the CPS are analogous to the recipiency imputations as months for these two programs are not directly reported in the CPS and are calculated using averages based on the SIPP.

21
OASDI months tend to have the lowest imputation shares in the SIPP. The shares have
generally risen over time.
As we did with reporting rates, we have also regressed imputation shares on a
constant and a time trend. Results suggest that dollar imputation rates rise significantly
for all programs in the CPS and SIPP and month imputation rates rise significantly in
most cases (see also in Meyer, Mok and Sullivan 2015).
5. Caveats and Biases
Some caveats are in order. First, the reporting of benefit receipt certainly contains
some individuals who mistakenly report receipt despite not receiving benefits. As with
previous research, we include imputed values in our survey totals. Even if not for other
reasons, due to imputed observations benefit receipt will be recorded for some people
who do not truly receive transfers. As discussed in Section 2C, false positive reporting of
receipt (π10 >0) likely implies that the fraction of dollars received by true recipients is
strictly less than the calculated reporting rates, i.e. our reporting rates if applied to true
recipients are biased upward. Results from matches of survey microdata to
administrative microdata provide evidence on the extent of such false positives. In Table
3 we examine reporting rates analogous to ours from several studies that use matched
data. Column 1 reports the month reporting rate conditional on true receipt, while
column 2 reports the unconditional reporting rate that is analogous to our reporting rates.
The difference between these two columns is the false positive rate. Note that the
numbers in column 1 are lower than those in column 2. In most cases the difference is
not more than 0.1. In some cases, however, the rates are substantial, such as for UI, WC
and SSI.
Second, in the situation where we have incomplete information about the type of
social security received, we apply the OASI and SSDI dollar proportions to determine
participation in these programs. A more desirable method would calculate these
proportions based on participation rather than dollars. Applying these proportions
essentially assumes that an individual can only receive benefits from either SSDI or
OASI, but not both, in a particular year. Strictly speaking, individuals can receive

22
benefits from both programs in a year, most commonly those whose SSDI benefit
switches automatically to OASI when they reach retirement age. This issue leads to a
bias downward in our social security retirement and disability participation estimates.
Third, in certain years of the PSID we do not have information about benefit receipt of
non-head and non-spouse family members. Although we have attempted to alleviate this issue
by using the share of total benefits received by these non-head, non-spouse family members in
other years and scaling up the aggregates accordingly, such methods assume that these shares are
relatively stable over time. Fourth, adults may receive social security and SSI benefits on behalf
of their children. Since administrative data are based on awardees, calculating weighted total
benefits based on payees rather than awardees may introduce biases. Unfortunately, most of the
household surveys provide little information about exactly who is the true awardee of the
benefit.34 Fifth, it is important to emphasize that our survey totals do not include the
institutionalized or decedents, although as explained in Section 2.B, we adjust these totals for the
former for SSI, SSDI, and OASI.
We should also note that the validity of these comparisons depends on unbiased survey
weights.35 The weights are based on the Census of Population, so an argument about
underweighting is essentially an argument about individuals being missed in the Census count.
Unfortunately, we have no estimates of the undercount for the populations receiving transfer
income. In 1990 for example, estimates are only available for broader groups such as non-blacks
and blacks, women and men, renters and owners, those in large urbanized areas and those in
other areas, and by age (and some cross-classifications of these groups).36 Overall estimates of
the 1990 undercount are fairly low, in the range of two percent. Estimates are higher for blacks
and renters, but lower for women, especially women of childbearing age.
We are also encouraged that errors in the weights are not a substantial source of bias
because the reporting rates are fairly similar to rates based on comparisons to administrative
microdata, in the few cases where such comparisons are available. Column 2 of Table 3 reports
reporting rates based on microdata comparisons, while column 3 reports numbers from our tables
that are based on comparisons of aggregates usually for the same year (but not the same months
34 The SIPP, however, does provide some information about who is the true awardee of Social Security benefits. 35 As a check, for each survey and year, we have confirmed that our weighted population totals are close to Census population estimates. 36 See Hogan (1993) and Robinson et al. (1993) for 1990 Census undercount estimates.

23
or states).37 The 1984 SIPP estimates from Marquis and Moore (1990) indicate that microdata
based reporting rates are similar to ours based on aggregates.38 The same is true for the other
studies, except for SSI for two years in one of the studies.39 The estimates from the microdata
match studies are often quite close to our numbers, and do not show a pronounced tendency to be
lower. Our reporting rates based on aggregates are particularly close (or higher) for FSP and
TANF, the programs most targeted to the poor, the group that might be most plausibly under-
weighted or under-represented. That these reporting ratios in matched administrative and survey
data are comparable to our main estimates suggests that weighting is not a substantial source of
bias.
6. Reasons for Under-reporting
The reasons for benefit receipt under-reporting in household surveys have been
catalogued by several authors.40 Interviewees may forget receipt or confuse the names of
programs. They may misremember the timing of receipt or who are the true recipients of a
program within a family. Errors may be due to a desire to reduce interview burden, the stigma of
program participation, or the sensitivity of income information. Survey and interviewer
characteristics such as the interview mode (in person or by phone), respondent type (self or
proxy) may matter for the degree of under-reporting. Information on the extent of under-
reporting, how it varies across programs, surveys and time should be informative about the
plausibility of different explanations for under-reporting. For example, comparisons of programs
with different degrees of stigma, and surveys with different question timing and wording, should
shed some light on the reasons for mis-reporting.
The different explanations for under-reporting suggest different approaches to improve
reporting. If the pattern of mis-reporting seems most consistent with recall biases, then changing
37 In some cases we must substitute dollar for month reporting rates. 38 There is a large difference for WC, but this may be due, in part, to the fact that for WC and UI, our estimates are based on dollars reported because months are not available, while the microdata estimates are based on months reported. 39 In the case of Huynh et al. (2002) and Sears and Rupp (2003) another source of noncomparability between columns 2 and 3 is that the administrative microdata behind column 2 exclude those under 18 (who may be especially likely to not report receipt), while the survey data behind column 3 include those under 18. 40 Marquis and Moore (1990) provide nice examples for the SIPP, while Bound, Brown and Mathiowetz (2001) and Groves (2004) provide more general discussions.

24
the timing of the questions relative to the period of receipt may be warranted. If interviewee
time burden seems to be the explanation, then the length of the interview may need to be altered.
If the stigma of program participation is a major issue, then a focus on question wording and the
way interviewers ask the questions may be warranted. The results could also suggest that some
dollar items should be calculated based on reported receipt and demographic characteristics, or
that respondents should be encouraged to obtain check stubs. Some items could also be obtained
through matching to administrative data, although it should be noted that consent to use such
data is most often required.
6A. Differences Across Programs
A standard explanation of under-reporting is the stigma of reporting receipt of “welfare”
programs, and the inclination to give “socially desirable” answers (Sudman and Bradburn 1974).
This explanation is consistent with the low reporting rates of four of the programs most
associated with “welfare” or idleness, AFDC/TANF, the FSP, UI and WIC. There has been a
noticeable decline over time in AFDC/TANF and food stamp reporting, which is broadly
consistent with the stigma explanation as the stigma associated with these programs has arguably
risen over time.41 However, some of the patterns of reporting by program do not fit with a
stigma explanation for under-reporting. Workers’ Compensation has the lowest reporting rate
but is presumably not a program that greatly stigmatizes its recipients, given that the program is
for those injured while working and not much evidence that WC is abused (Card and McCall
1996).
A second common explanation for under-reporting is that respondents forget that they
receive transfers. Benefits that an individual regularly receives or that account for a substantial
fraction of total resources are arguably easier to recall. An example of such a program is OASI,
which is often continuously received for many years and may be the only major source of
income for many recipients. OASI is reported at a high rate, generally above eighty percent and
often higher. By contrast, TANF benefit receipt is much more likely to be sporadic and
potentially harder to recall. With the reform of welfare in the mid-1990s the typical time on
welfare fell and the likelihood of return to the rolls decreased (U.S. House of Representatives
41 Opinion surveys provide some evidence of increased stigma. Data from the General Social Survey show that more than 40 percent of respondents report that spending on welfare is too high in the U.S., and this fraction increased sharply starting in 1993 (Scholz and Levine 2001).
25
2004). Reporting rates seem to have fallen at roughly the same time, though the PSID drop
seems to precede welfare reform. Receipt of FSP also tends to be more sporadic than OASI, but
the pattern of receipt has not changed as much as that of TANF. FSP reporting has dropped in
recent years in the PSID and the CPS, and the decline has been less pronounced than for TANF,
providing additional evidence that the regularity of receipt affects reporting.
How familiar an interviewer is with a particular program and how common it is to
receive it might also affect reporting because the ability of the interviewer to infer receipt might
affect the extent to which they probe respondents about particular programs. Workers’
Compensation is received by a small fraction of the population and has the lowest reporting rate.
Workers’ Compensation may also be the program of which the general public has the least
knowledge. It may also be hard for an interviewer to guess that a given person is a recipient and
probe further when asking the questions about receipt of Workers’ Compensation. By contrast,
an interviewer will know that anyone 65 or older is likely to be an OASI recipient.
Another explanation for under-reporting for a given program is that its name may be
confused with that of another program for which the benefits are reported instead. TANF
benefits might be reported as general assistance payments, OASI, SSDI, and SSI might be
confused, or SSDI and Workers’ Compensation might be confused. The surveys employ various
techniques to avoid this problem, such as asking specifically about the color of checks received
in the case of the PSID. We should also note that the reporting rate for SSDI in the PSID is not
noticeably different whether we impute the division of OASDI into OASI and SSDI or whether
we use self reports.42 It is plausible that the recent changes in the names of state and federal
welfare programs might have confused respondents into saying that they were not receiving
TANF, but other welfare instead. However, the reporting rate for a broader welfare measure that
combines TANF and general assistance tends to be lower than that for TANF alone in most
survey years, suggesting that such confusion is not responsible for the low reporting rates.
We also find the puzzling result that the EITC is sharply under-imputed in the CPS. This
result suggests a problem with survey misreporting of earnings or children, or tax
noncompliance.
6B. Differences Across Surveys
42 We impute based on the interaction of demographics and year as described in the Appendix.

26
The finding that the SIPP has higher program reporting rates than the other surveys is
consistent with the focus of the survey on program participation. Conversely, it is not surprising
that the CE Survey has low program reporting rates given the focus of the survey on collecting
detailed consumption data. Nevertheless, the survey characteristics and methods that lead to
high or low reporting merit exploration. The SIPP has the most detailed questions about
program receipt.43 The surveys differ across many dimensions as is indicated in Appendix Table
24 which summarizes the survey characteristics including frequency, target population, and
recall period. Given the many differences, it may be difficult to isolate the effect of a given
characteristic. The recall period also varies, it is the previous four months for the SIPP, the
previous calendar year for the PSID and CPS, and the previous twelve months for the ACS and
CE Survey. The only survey for which interviewees are legally required to respond is the ACS,
possibly accounting for its high reporting rate for TANF and some other programs. The PSID is
the only survey which provides monetary compensation to respondents. Most surveys use a
combination of phone and in-person interviewing, while the ACS also relies on mail back
responses and the CE Survey uses only in-person interviewing.
Changes in survey procedures over time potentially provide evidence on reasons for
under-reporting. Evidence on respondent recall biases comes from the PSID, which moved to
asking about FSP and SSI benefits received two years earlier rather than one year earlier for odd
numbered years starting in 1997 (2003 for TANF, UI and WC; see Appendix Table 1). The
longer recall period seems to have resulted in a decrease in reporting, as the dollar reporting rate
is lower in each odd numbered year than the following even numbered year (except 1999-2000
for FSP, Social Security and 1997-1998 and 1999-2000 for SSI).
Reduction or elimination of in-person interviewing seems to have little effect on
reporting rates. For example, reporting rates do not change much after the 1996 reduction of in-
person interviewing in the SIPP. This result is consistent with the Groves (2004) observation
that there is no robust evidence of a difference in errors between in-person and phone
interviewing. An exception may be the sharp fall in AFDC reporting in the PSID after the move
to telephone interviewing in 1973 (1972 income). There is some evidence from the PSID and
the CPS that a change to CATI/CAPI decreases reporting. In the case of the SIPP, however,
43 Though Czajka and Denmead (2008) observe that a small number of questions sometimes seem to do a good job of measuring mean income.
27
there does not appear to be a fall in reporting that coincides with the introduction of CATI/CAPI.
These analyses are complicated by simultaneous changes in the questionnaire in the cases of both
the PSID and the CPS.
We examine the effects of survey changes on reporting rates more directly with a number
of different regression specifications (the results of these analyses are not reported but are
available upon request), focusing on survey years without multiple contemporaneous changes.
For example, we study the effect of explicitly mentioning the name of a program on the reporting
accuracy for that program. Beginning in the 1978 PSID survey, for some programs the
interviewer mentions the name of the program when asking about the amount of dollars received
by the non-head non-spouse family members.44 Using a regression discontinuity framework, our
estimates of the effect of this change on reporting are small and not statistically significant.45
The estimated effects are also jointly statistically insignificant.46 Tentative results suggest that
imperfect recipiency recall may not be a strong reason for under-reporting. Another survey
change we examine is the addition of bracketed responses. Starting in 2001, when a specific
amount is not provided, the CE Survey asks interviewees whether the amount falls within certain
ranges. There is some evidence that this change increased the reporting rates of TANF and SSI
(by 5 and 23 percentage points respectively), while it decreased the reporting rate of OASI (by 9
percentage points). These estimated changes are jointly significant at the 1 percent level.
7. Some Adjustment Methods
Reporting rates calculated as above can be used to adjust existing data analyses. In
particular, the reporting rates we provide can be used to adjust estimated program effects on the
income distribution as well as estimates of program takeup. A takeup rate is typically measured
as the fraction of eligible individuals or families that receive a given transfer. A conservative
adjustment to the typical takeup rate can be obtained by multiplying the takeup rate by the
44In the other years, the interviewer asks the interviewee to recall what types of income were received. OASDI is explicitly asked starting in 1978 and AFDC starting in 1984. Starting in 1985 WC is explicitly asked, but we do not focus on this change because there were other survey changes implemented in 1985. 45 Specifically, we regress the reporting rate of a program on a constant, a time trend, time trend interacted with the post-change period, and a post-change period indicator variable. The coefficient of interest is that of the post-change indicator variable. We use only the 10 years of data surrounding the change. We correct for autocorrelation using the Prais-Winsten method. 46 We replace the after variable by after*program interactions in the regression and perform an F-test of whether all the after*program interaction coefficients are zero. The test statistic has a p-value of 0.25.

28
inverse of the reporting probability. For example, Blank and Ruggles (1996) examine the FSP
takeup rate in SIPP during 1986-1987. Their reported takeup rate is 0.52. Since our average
monthly participation reporting rate for these years averages 0.88, an adjusted takeup rate for this
period is 0.52/0.88 = 0.60. This adjustment is likely conservative because our reporting rate is
likely to be too high because some true non-recipients report receipt. While false positives could
bias the takeup rate upward, we are implicitly assuming that the eligibility calculations and the
likely exclusion of imputed observations imply that there are few false positives in the original
analysis.
Other adjustments are possible in more complicated situations. When estimating the
effect of a program on the income of a group, one can consider scaling up benefit receipt by one
over the dollar reporting rate. As long as non-reporting recipients have the same distribution of
characteristics as reporting recipients (where the set of characteristics is those that are used as
conditioning variables), the approach is unbiased. One application is to scale up benefits for the
group of potential recipients. If there are no false positives from outside the group of potential
recipients, then scaling by the inverse of the dollar reporting rate provides the amount of program
benefits received by potential recipients. If there are false positives from outside the group, then
the rescaling is a downward biased estimate of benefits received by the group. An example of
such an adjustment in the case of UI, FSP, WC, AFDC/TANF, SSI, SSDI and OASI is Meyer
and Mok (2008). Other studies have assumed that under-reporting is constant in proportional
terms across deciles or quintiles of the income distribution. Examples of adjustments based on
this assumption can be found for the FSP and AFDC/TANF in Primus et al. (1999) and for
unemployment insurance in Anderson and Meyer (2006).
However, in many analyses of income distributions or the distributional effects of
transfers, it will be difficult to adjust the analyses for under-reporting using aggregate reporting
rates. One often needs to know exactly who under-reported, and by how much. An example of
the difficulties of trying to make such an adjustment can be found in Meyer and Sullivan (2006)
for the case of FSP and AFDC/TANF in the CE Survey.
A type of analysis that might be particularly sensitive to under-reporting is analyses of
the probability that a member of a disadvantage population neither works nor receives welfare.
Blank and Kovak (2008) recently found a rise in the share of single mothers who are neither
working nor receiving welfare; these women are referred to as “disconnected single mothers.”

29
Blank and Kovak estimate that the among low-income single mothers (defined as those with
family income below 200% of the poverty line), the fraction who are disconnected single
mothers has risen from 18.8% in 1990 to 24.9% in 2003 using the SIPP, and from 9.9% in 1990
to 20.0% in 2005 using the CPS.47
We use our reporting rates to reexamine the estimates reported in Blank and Kovak
(2008). Given that they rely on the reported fraction of poor single mothers who are not working
and not receiving welfare, their rate may be overstated as some of those who receive welfare do
not report it. Under fairly reasonable assumptions,48 the Blank and Kovak estimate is overstated
by k(1-y)/y, where k is the observed probability of not working and receiving welfare (among
poor single mothers) and y is the AFDC/TANF month reporting rate of the corresponding year.49
Using this adjustment factor, we adjust the Blank and Kovak estimates.
Table 4 reports our results. Panels A and B report the results for the SIPP and the CPS
respectively. In column 1 of each panel, the estimates from Blank and Kovak (2008) are shown.
Column 2 reports the adjustment factor and column 3 reports the adjusted fraction of
disconnected single mothers. Accounting for under-reporting, we see that the fraction of
disconnected single mothers is somewhat lower than that reported by Blank and Kovak (2008).
In 1990, Blank and Kovak (2008) suggest that disconnected single mothers constitute 19% and
10% of the poor single mothers population in the SIPP and the CPS respectively. After
correcting for under-reporting, these fractions drop to 10% and 2% for the SIPP and the CPS
respectively. Nevertheless, Blank and Kovak’s finding that the fraction of single mothers who
are disconnected has risen is still evident in our adjusted numbers. In fact, after correcting for
under-reporting, the rise in the disconnected single mothers population is more serious than what
47 Blank and Kovak (2008) define disconnected single mothers in the CPS as those who did not receive welfare and did not have earnings in the calendar year, while in the SIPP they consider welfare recipiency and earnings in a month. Thus the CPS rates are considerably lower than those obtained in the SIPP. 48 We assume 1) there is no failure to report work, and 2) true welfare recipients who work are as likely to fail to report receipt as those who do not work. The first assumption biases us towards a higher rate of disconnected single mothers. We motivate the second assumption by considering that welfare recipients who work may be more willing to report due to lower stigma, but yet the amount of AFDC/TANF they receive may be too small for them to bother reporting. Also, interviewers may be less likely to probe for welfare information if the individual is working. These opposing forces may imply similar average reporting rates between those who work and those who do not. 49 Formally, consider a single mother who is either working (W) or not working (NW), and who either receives or does not receive welfare (B and NB), and who either reports or does not report welfare recipiency (R and NR). This situation yields eight possibilities. Blank and Kovak (2008) estimate the observed fraction of poor single mothers who are not working and not receiving welfare, which is equivalent to the sum of Prob(NW ∩ NB ∩ NR) and Prob(NW ∩ B ∩ NR). Assuming no false positives, the true fraction of disconnected single mothers should only be Prob(NW ∩ NB ∩ NR), thus the Blank and Kovak’s estimate is overstated by Prob (NW ∩ B ∩ NR).

30
Blank and Kovak suggest—between 1990-2005 the adjusted numbers suggest that the fraction of
disconnected single mothers has doubled in the SIPP and risen by a factor of seven in the CPS.
8. Conclusions and Extensions
We provide estimates of the extent of under-reporting of dollars and months of
participation for ten large transfer programs in five major household surveys. We find that
under-reporting is common and has increased over time. Less than half of Workers’
Compensation benefits are typically reported, and only about two-thirds of Food Stamp Program,
TANF, WIC and Unemployment Insurance benefits are commonly reported. Three-quarters of
SSI benefits and a much larger share of SSDI and OASI benefits tend to be recorded. There is
substantial variation across surveys, with the CE Survey typically having the lowest reporting
rate and the SIPP having the highest rate for most programs.
Over time, the reporting of many programs in the surveys has sharply deteriorated. We
have also seen a noticeable rise in the share of responses that are imputed. This rise in
imputation and under-reporting is part of an overall pattern of decline in the quality of data from
U.S. household surveys. Other papers have shown a rise in survey nonresponse and item
nonresponse and a drop relative to alternative sources (Atrostic et al. 2001, Meyer and Sullivan
2007b, 2009).
The patterns of under-reporting that we find do not seem to be consistent with a simple
story of stigma or the sensitivity of income reporting. While these reasons are plausible
explanations for the low FSP and TANF reporting rates, they cannot explain the very low WC
reporting rate. We suspect that other factors, including continuity of receipt, the ease of
reporting, the survey structure, and a desire to reduce the length of interviews play a large part in
determining the degree of under-reporting.
We have also shown how our estimates can be used to correct the findings of recent
studies. We can extend these results by calculating aggregate based reporting rates for
demographic groups, regions or states to make more refined adjustments. Ideally one would also
use microdata to match these surveys to program data. It would be useful to analyze such
matches to understand how mis-reporting varies with respondent and interviewer characteristics,

31
and to assess the extent of false positive reporting by nonrecipients to better adjust studies of the
effects of transfer programs.

32
References
Anderson, Patricia M. and Bruce D. Meyer. 2006. “Unemployment Insurance Tax Burdens and
Benefits: Funding Family Leave and Reforming the Payroll Tax,” National Tax Journal, 77-95.
Andridge, Rebecca and Roderick Little. "A review of hot deck imputation for survey non‐response." International Statistical Review 78.1 (2010): 40-64.
Atrostic, B. K, Nancy Bates, Geraldine Burt, and Adrian Silberstein. 2001. “Nonresponse in U.S. Government Household Surveys: Consistent Measures, Recent Trends, and New Insights,” Journal of Official Statistics, 17:209-226.
Barrow and Davis (2012. “The upside of down: Postsecondary enrollment in the Great Recession.” Economic Perspectives. 4Q. 117-129.
Bitler, M., J. Currie and J. K. Scholz. 2003. "WIC Eligibility and Participation," Journal of Human Resources, 38:S, 1139-1179.
Blank, Rebecca M. and Brian Kovak. 2008. “The Growing Problem of Disconnected Single Mothers,” National Poverty Center Working Paper #07-28.
Blank, Rebecca M. and Patricia Ruggles (1996): "When Do Women Use AFDC & Food Stamps? The Dynamics of Eligibility vs. Participation," Journal of Human Resources 31, 57-89.
Bollinger, Christopher and Martin David (1997). “Modeling Discrete Choice with Response Error: Food Stamp Participation.” Journal of the American Statistical Association, 92 (439) pp. 827-835.
Bollinger, Christopher and Martin David (2001), Estimation with Response Error and Nonresponse: Food-Stamp Participation in the SIPP, Journal of Business and Economic Statistics, 19:2, 129-141.
Bound, John, Charles Brown, and Nancy Mathiowetz (2001), “Measurement Error in Survey Data,” in Handbook of Econometrics. Volume 5, ed. by J.J Heckman and E. Leamer. Elsevier: Amsterdam.
Card, David, Andrew K.G. Hildreth and Lara D. Shore-Sheppard (2001), “The Measurement of Medicaid Coverage in the SIPP: Evidence from California 1990-1996” NBER Working Paper 8514.
Card, David and Brian P. McCall (1996): "Is Workers' Compensation Covering Uninsured Medical Costs? Evidence from the 'Monday Effect'," Industrial and Labor Relations Review, 49, 690-706.
Charles, Kerwin K. 2003. “The Longitudinal Structure of Earnings Losses among Work-Limited Disabled Workers.” Journal of Human Resources 38(3): 619-46
Coder, John and Lydia Scoon-Rogers. 1996. AEvaluating the Quality of Income Data Collected in the Annual Supplement to the March Current Population Survey and the Survey of Income and Program Participation,@ Housing and Household Economic Statistics Division, Bureau of the Census.
Currie, Janet. 2006. “The Take-up of Social Benefits,” in Alan J. Auterbach, David Card, and john M. Quigley, eds. Public Policy and the Income Distribution, Russell Sage Foundation: New York.
Czajka, John L. and Gabrielle Denmead. 2008. AIncome Data for Policy Analysis: A Comparative Assessment of Eight Surveys,@ Mathematica Policy Research.

33
DeNavas-Walt, Carmen, and Bernadette D. Proctor. 2014. “Income, and Poverty in the United States: 2013” Current Population Reports P60-249, US Census Bureau.
Doyle, Pat, Betsy Martin and Jeff Moore. 2000. “The Survey of Income and Program
Participation (SIPP) Methods Panel Improving Income Measurement.” The Survey of Income and Program Participation Working Paper No. 234.
Duncan, Greg J. and Daniel H. Hill. 1989. “Assessing the Quality of Household Panel Data: The Case of the Panel Study of Income Dynamics.” Journal of Business and Economic Statistics, 441-52.
Engelhardt, Gary and Jon Gruber. 2006. “Social Security and the Evolution of Elderly Poverty,” in Alan J. Auterbach, David Card, and john M. Quigley, eds. Public Policy and the Income Distribution, Russell Sage Foundation: New York.
Fisher, Jonathan D. 2006. “Income Imputation and the Analysis of Consumer Expenditure Data.” Monthly Labor Review, November 2006: 11-17.
Groves, Robert M. 2004. Survey Errors and Survey Costs. Hoboken, NJ: John Wiley & Sons. Hogan, Howard. 1993. “The 1990 Post-Enumeration Survey: Operations and Results.” Journal
of the American Statistical Association 88(3): 1047-1060. Hotz, V. Joseph and John Karl Scholz. 2002. “Measuring Employment and Income for Low-
Income Populations With Administrative and Survey Data.” In Studies of Welfare Populations: Data Collection and Research Issues, eds. Michele Ver Ploeg, Robert A. Moffitt, and Constance F. Citro, 275-313. Washington, DC: National Academy Press.
Huynh, Minh, Kalman Rupp, and James Sears. 2002. “The Assessment of Survey of Income and Program Participation (SIPP) Benefit Data using Longitudinal Administrative Records.” Social Security Administration.
Joint Economic Committee Democrats. 2004. “Reduction in Poverty Significantly Greater in the 1990s than Official Estimates Suggest,” Policy Brief, August.
Jolliffe, Dean, Craig Gundersen, Laura Tiehen, and Joshua Winicki (2005). “Food Stamp Benefits and Child Poverty,” American Journal of Agricultural Economics, August, 569-581.
Lerman, Robert I. and Kelly S. Mikelson, 2004. “Examining the Relationship between the EITC and Food Stamp Program Participation Among Households with Children,” Working Paper, American University.
Marquis, Kent H. and Jeffrey C. Moore. 1990. “Measurement Errors in SIPP Program Reports.” In Proceedings of the 1990 Annual Research Conference, 721-745. Washington, DC.: U.S. Bureau of the Census.
McGarry, Kathleen. 2002. “Guaranteed Income: SSI and the Well Being of the Elderly Poor,” in The Distributional Aspects of Social Security and Social Security Reform, ed. by Martin Feldstein and Jeffrey B. Liebman, Chicago: University of Chicago Press, 2002.
Meyer, Bruce D. 2007. “The U.S. Earned Income Tax Credit, its Effects, and Possible Reforms,” Swedish Economic Policy Review 14: 55-80.
Meyer, Bruce D. and Wallace K.C. Mok. 2008. “Disability, Earnings, Income and Consumption.” Manuscript, University of Chicago.
Meyer, Bruce D. and James X. Sullivan. 2003. “Measuring the Well-Being of the Poor Using Income and Consumption.” Journal of Human Resources, 38(Supplement): 1180-1220.
Meyer, Bruce D. and James X. Sullivan. 2006. “Consumption, Income and Material Well-Being After Welfare Reform.” NBER Working Paper 11976.

34
Meyer, Bruce D. and James X. Sullivan. 2007a. “Reporting Bias in Studies of the Food Stamp Program.” Unpublished manuscript.
Meyer, Bruce D. and James X. Sullivan. 2007b. “Further Results on Measuring the Well-Being of the Poor Using Income and Consumption,” NBER Working Paper 13413.
Meyer, Bruce D. and James X. Sullivan. 2009. “Five Decades of Consumption and Income Poverty,” NBER Working Paper 14827, March.
Moore, Jeffrey C., Kent H. Marquis, and Karen Bogen. 1996. “The SIPP Cognitive Research Evaluation Experiment: Basic Results and Documentation.” The Survey of Income and Program Participation, Working Paper No. 212. Washington D.C.: U.S. Census Bureau.
Moore, Jeffrey C. 2006. “The Effects of Questionnaire Design Changes on General Income Amount Nonresponse in Waves 1 and 2 of the 2004 SIPP Panel.” Research Report Series (Survey Methodology #2006-4). Statistical Research Division, U.S. Census Bureau, Washington, DC.
Moore, Jeffrey C., Nancy Bates, Joanne Pascale, Julia Klein Griffiths and Aniekan Okon. 2006a. “Use of Dependent Interviewing Procedures to Improve Data Quality in the Measurement of Change.” Research Report Series (Survey Methodology #2006-2). Statistical Research Division, U.S. Census Bureau, Washington, DC.
Moore, J. C., Stinson, L.L. and Welniak, E. J. Jr. 2000. “Income Measurement Error in Surveys: A Review.” Journal of Official Statistics, 14:4, 331-361.
Paulin, Geoffrey, Jonathan D. Fisher and Sally Reys-Morales. 2006. “User's Guide to Income Imputation in the CE.” Bureau of Labor Statistics.
Pennell S. G. 1993. “Cross-Sectional Imputation and Longitudinal Editing Procedures in the Survey of Income and Program Participation” U. S. Department of Commerce, Census Bureau.
Primus, Wendell, Lynette Rawlings, Kathy Larin, and Kathryn Porter. 1999. “The Initial Impacts of Welfare Reform on the Incomes of Single-Mother Families.” Washington, DC: Center on Budget and Policy Priorities.
Remler, Dahlia K and Sherry A. Glied. 2003. “What Other Programs Can Teach Us: Increasing Participation in Health Insurance Programs.” American Journal of Public Health 93(1): 67-74.
Robinson, J. Gregory, Bashir Ahmed, Prithwis Das Gupta and Karen A. Woodrow. 1993. “Estimation of Population Coverage in the 1990 United States Census Based on Demographic Analysis.” Journal of the American Statistical Association 88(3): 1061-1071.
Roemer, Marc I. 2000. “Assessing the Quality of the March Current Population Survey and the Survey of Income and Program Participation Income Estimates, 1990-1996.” Staff Papers on Income, Housing and Household Economic Statistics Division. Washington D.C.: U.S. Census Bureau.
Scholz, John Karl, and Kara Levine. 2001. “The Evolution of Income Support Policy in Recent Decades.” In Sheldon Danziger and Robert Haveman, eds., Understanding Poverty, Cambridge, MA: Harvard University Press, 193–228.
Scholz, John Karl, Robert Moffitt, and Benjamin Cowan. 2008. “Trends in Income Support.” Working Paper, University of Wisconsin, Madison.
Sears, James and Kalman Rupp. 2003. “Exploring Social Security Payment History matched with the Survey of Income and Program Participation. Social Security Administration.

35
Stephens, Mel. 2001. “The Long-Run Consumption Effects of Earnings Shocks.” Review and Economics and Statistics 83(1):28-36.
Sudman, Seymour and Norman M. Bradburn. 1974. Response Effects in Surveys. Chicago: NORC/Aldine Publishing Company.
Taeuber, Cynthia, Dean M. Resnick, Susan P. Love, Jane Stavely, Parke Wilde, and Richard Larson. 2004. “Differences in Estimates of Food Stamp Program Participation Between Surveys and Administrative Records” working paper, U.S. Census Bureau.
U.S. Census Bureau. 2001. “Survey of Income Program Participation Users’ Guide” Third Edition. Washington D.C.: U.S. Census Bureau.
U.S. Census Bureau. 2007. “The Effects of Taxes and Transfers on Income and Poverty in the United States: 2005,” March.
U.S. Department of Health and Human Services. 2008. “Indicators of Welfare Dependence: Annual Report to Congress 2007.” U.S. Department of Health and Human Services, Washington, D.C.
U.S. Department of Labor. Various Years. “Unemployment Insurance Financial Data Handbook.” Employment and Training Administration. ET Handbook No. 394.
U.S. House of Representatives (2004). 2004 Green Book. Committee on Ways and Means. Washington DC: USGPO.
U.S. Social Security Administration. Various Years. “Annual Statistical Supplement to the Social Security Bulletin.” U.S. Social Security Administration, Office of Research, Evaluation and Statistics.

36
Table 1: Benefit Programs and Periods Examined, by Survey
A. Aggregate Dollars Survey and Calendar Years
Benefit Program PSID SIPP CPS-
ADF/ASEC ACS CE Survey
AFDC/TANF 1970-2010 1983-2011 1975-2011 2000-2010 1979-2011 FSP/SNAP 1973-2010 1983-2012 1979-2012 2005-2006 1979-2011 OASI 1970-2010 1983-2012 1967-2012 2000-2011 1979-2011 SSDI 1970-2010 1983-2012 1967-2012 2000-2011 1979-2011 SSI 1974-2010 1983-2012 1975-2012 2000-2011 1979-2011 UI 1976-2010 1983-2012 1987-2012 1979-2011 WC 1976-2010 1983-2011 1987-2011 1979-2011 EITC 1991-2011
Note: For the NSLP and WIC program, how to measure dollar information is conceptually unclear and also not available in most of these surveys (SIPP has dollar amount of WIC).
B. Average Monthly Participation
Survey and Calendar Years Benefit Program
PSID SIPP CPS-
ADF/ASEC ACS
AFDC/TANF 1993-2010 Retrospective #
of months
1983-2012 Monthly
1987-2012 Retrospective # of months
FSP 1980-2010 Retrospective #
of months
1983-2012 Monthly
1980-2012 Retrospective # of months
OASI 1974-2010 At all last year
1983-2012 Monthly
1971-2011 At all last
year
2000-2011 At all last 12 months
SSDI 1974-2010 At all last year
1983-2012 Monthly
1971-2011 At all last
year
2000-2011 At all last 12 months
SSI 1974-1991 At all last year 1992-2010
Retrospective # of months
1983-2012 Monthly
1975-2012 At all last
year
2000-2011 At all last 12 months
WIC 1998-2010 At all last year
1983-2012 Monthly
2000-2012 At all last
year
NSLP 1998-2010 At all last year
1983-2012 At all last 4
months
1979-2012 At all last
year
Note: Several of the surveys report combined receipt and dollars for OASI and SSDI. See the Data Appendix for more details. UI, WC and the EITC are not paid on a monthly basis.
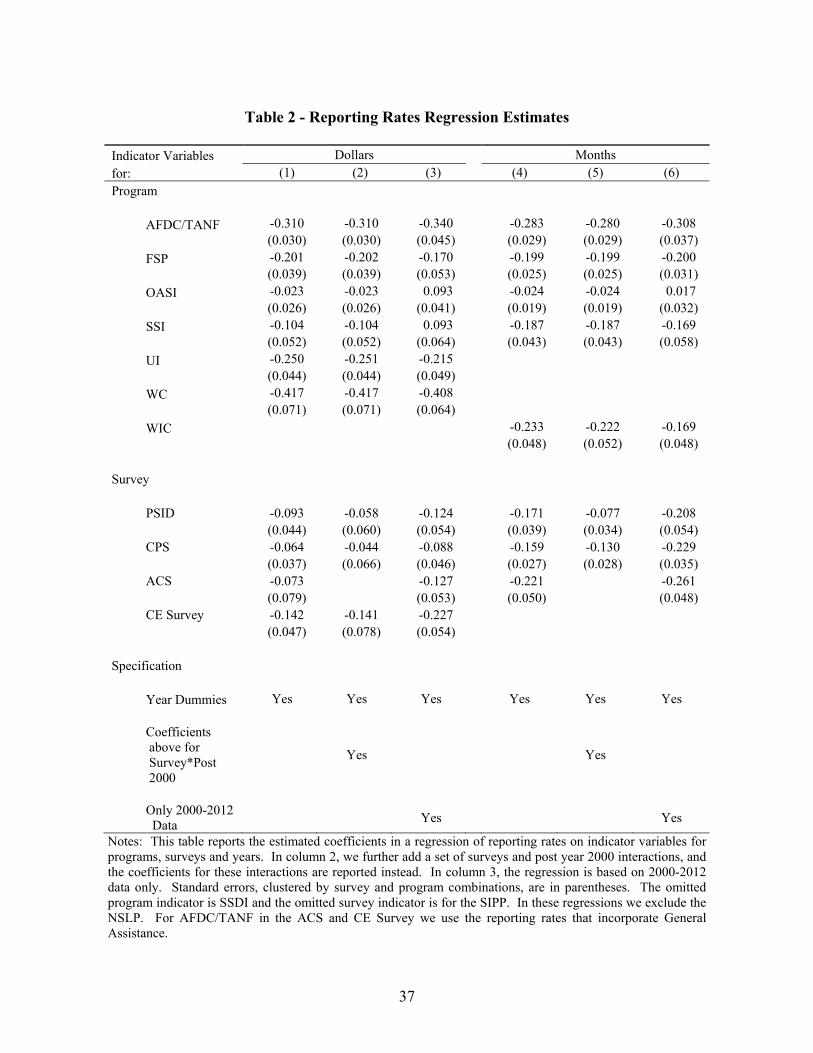
37
Table 2 - Reporting Rates Regression Estimates
Indicator Variables Dollars Months
for: (1) (2) (3) (4) (5) (6) Program
AFDC/TANF -0.310 -0.310 -0.340 -0.283 -0.280 -0.308
(0.030) (0.030) (0.045) (0.029) (0.029) (0.037)
FSP -0.201 -0.202 -0.170 -0.199 -0.199 -0.200
(0.039) (0.039) (0.053) (0.025) (0.025) (0.031)
OASI -0.023 -0.023 0.093 -0.024 -0.024 0.017
(0.026) (0.026) (0.041) (0.019) (0.019) (0.032)
SSI -0.104 -0.104 0.093 -0.187 -0.187 -0.169
(0.052) (0.052) (0.064) (0.043) (0.043) (0.058)
UI -0.250 -0.251 -0.215 (0.044) (0.044) (0.049) WC -0.417 -0.417 -0.408 (0.071) (0.071) (0.064) WIC -0.233 -0.222 -0.169
(0.048) (0.052) (0.048)
Survey
PSID -0.093 -0.058 -0.124 -0.171 -0.077 -0.208 (0.044) (0.060) (0.054) (0.039) (0.034) (0.054) CPS -0.064 -0.044 -0.088 -0.159 -0.130 -0.229 (0.037) (0.066) (0.046) (0.027) (0.028) (0.035) ACS -0.073 -0.127 -0.221 -0.261 (0.079) (0.053) (0.050) (0.048) CE Survey -0.142 -0.141 -0.227
(0.047) (0.078) (0.054) Specification
Year Dummies Yes Yes Yes Yes Yes Yes Coefficients above for Survey*Post 2000
Yes
Yes
Only 2000-2012 Data
Yes
Yes
Notes: This table reports the estimated coefficients in a regression of reporting rates on indicator variables for programs, surveys and years. In column 2, we further add a set of surveys and post year 2000 interactions, and the coefficients for these interactions are reported instead. In column 3, the regression is based on 2000-2012 data only. Standard errors, clustered by survey and program combinations, are in parentheses. The omitted program indicator is SSDI and the omitted survey indicator is for the SIPP. In these regressions we exclude the NSLP. For AFDC/TANF in the ACS and CE Survey we use the reporting rates that incorporate General Assistance.
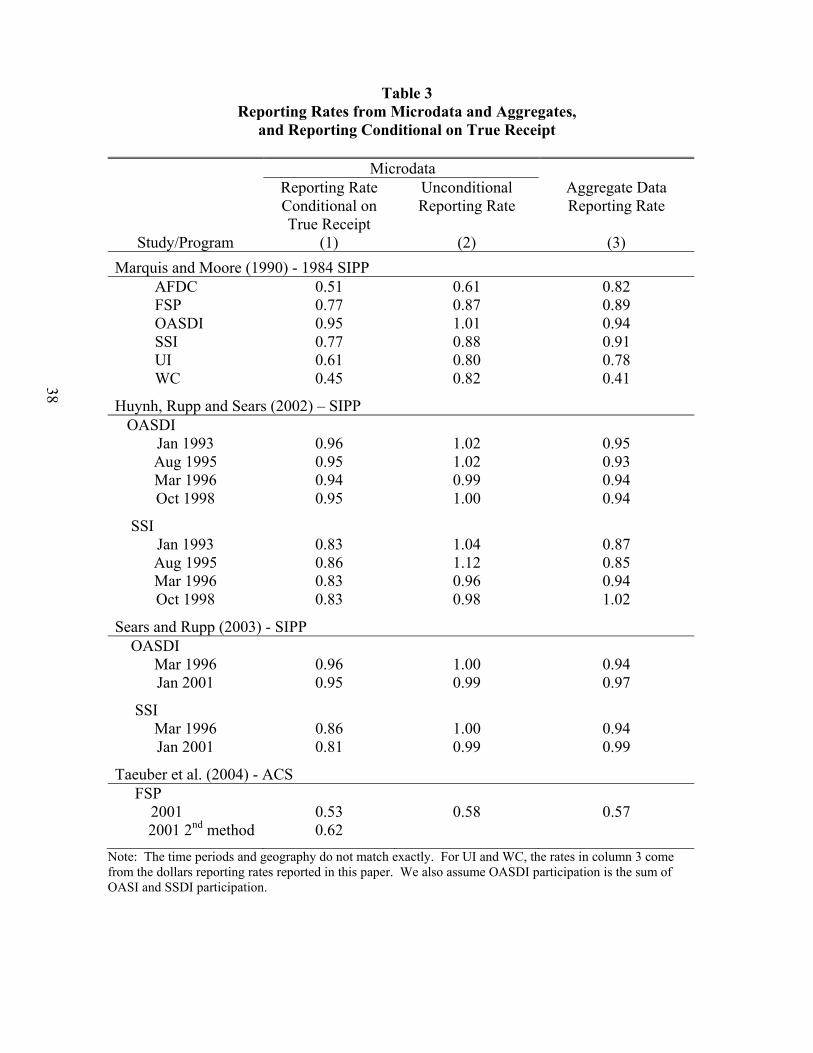
38
Table 3 Reporting Rates from Microdata and Aggregates,
and Reporting Conditional on True Receipt
Microdata Reporting Rate
Conditional on True Receipt
Unconditional Reporting Rate
Aggregate Data Reporting Rate
Study/Program (1) (2) (3)
Marquis and Moore (1990) - 1984 SIPP AFDC 0.51 0.61 0.82 FSP 0.77 0.87 0.89 OASDI 0.95 1.01 0.94 SSI 0.77 0.88 0.91 UI 0.61 0.80 0.78 WC 0.45 0.82 0.41
Huynh, Rupp and Sears (2002) – SIPP OASDI
Jan 1993 0.96 1.02 0.95 Aug 1995 0.95 1.02 0.93 Mar 1996 0.94 0.99 0.94 Oct 1998 0.95 1.00 0.94
SSI Jan 1993 0.83 1.04 0.87 Aug 1995 0.86 1.12 0.85 Mar 1996 0.83 0.96 0.94 Oct 1998 0.83 0.98 1.02
Sears and Rupp (2003) - SIPP OASDI
Mar 1996 0.96 1.00 0.94 Jan 2001 0.95 0.99 0.97
SSI Mar 1996 0.86 1.00 0.94 Jan 2001 0.81 0.99 0.99
Taeuber et al. (2004) - ACS FSP 2001 0.53 0.58 0.57 2001 2nd method 0.62
Note: The time periods and geography do not match exactly. For UI and WC, the rates in column 3 come from the dollars reporting rates reported in this paper. We also assume OASDI participation is the sum of OASI and SSDI participation.

39
Table 4
Adjusted Trends in the Number of Single Mothers with Neither Work or Welfare, CPS and SIPP Data
A. SIPP
Calendar Year Observed Fraction of
Disconnected Single Mothers in Blank and Kovak (2008)
Adjustment Factor
Adjusted Fraction of Disconnected Single
Mothers (1) (2) (3) = (1) – (2) 1990 0.188 0.092 0.096 1996 0.170 0.081 0.089 2001 0.232 0.041 0.191 2003 0.249 0.053 0.196
B. CPS
Calendar Year Observed Fraction of
Disconnected Single Mothers in Blank and Kovak (2008)
Adjustment Factor
Adjusted Fraction of Disconnected Single
Mothers (1) (2) (3) = (1) – (2) 1990 0.099 0.076 0.023 1995 0.117 0.108 0.009 2000 0.146 0.056 0.090 2005 0.200 0.049 0.151
Notes: The sample is based on families headed by a single mother ages 18-54, with at least one child ages 0-18, and with family income equal or less than 200% of the poverty level (for the SIPP, we annualize the monthly income reported prior to comparing to the poverty level). For the CPS, disconnected single mothers are those with: 1) zero earnings in the past calendar year, 2) zero AFDC/TANF receipts in the past calendar year, and 3) those who reported not working in the past calendar year for reasons other than going to school. For the SIPP, disconnected single mothers are those with: 1) zero earnings in the month, 2) zero AFDC/TANF receipts in the month, and 3) those who are not in school in the month. Column 1 numbers are obtained from Table 2 of Blank and Kovak (2008). The adjustment factors in columns 2 are equal to k(1-y)/y where k is the observed probability of not working and receiving welfare (among low-income single mothers) and y is the AFDC/TANF month reporting rate of the corresponding year.

40
Figure 1 Reporting Rates of AFDC/TANF and FSP/SNAP
Figure 2A Reporting Rates of OASI
0.20
0.30
0.40
0.50
0.60
0.70
0.80
0.90
1.00
1.10
1.20
1970 1975 1980 1985 1990 1995 2000 2005 2010
Rep
ortin
g R
ate
Calendar Year
AFDC/TANF (CPS) AFDC/TANF (PSID) AFDC/TANF (SIPP)
FSP/SNAP (CPS) FSP/SNAP (PSID) FSP/SNAP (SIPP)
0.60
0.65
0.70
0.75
0.80
0.85
0.90
0.95
1.00
1.05
1967 1972 1977 1982 1987 1992 1997 2002 2007 2012
Rep
ortin
g R
ate
Calendar Year
PSID SIPP CPS ACS CES

41
Figure 2B Reporting Rates of SSDI
Figure 2C Reporting Rates of SSI
0.60
0.65
0.70
0.75
0.80
0.85
0.90
0.95
1.00
1.05
1967 1972 1977 1982 1987 1992 1997 2002 2007 2012
Rep
ortin
g R
ate
Calendar Year
PSID SIPP CPS ACS CES
0.40
0.50
0.60
0.70
0.80
0.90
1.00
1.10
1.20
1.30
1.40
1974 1979 1984 1989 1994 1999 2004 2009
Rep
ortin
g R
ate
Calendar Year
PSID SIPP CPS ACS CES
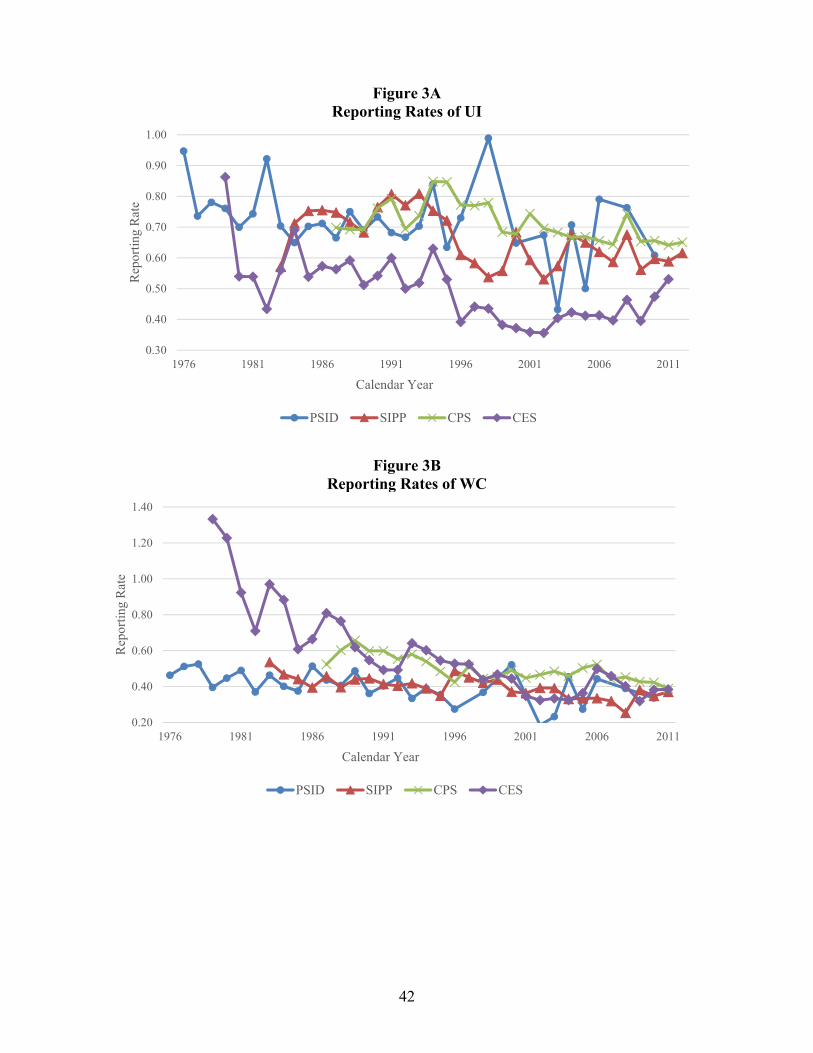
42
Figure 3A Reporting Rates of UI
Figure 3B Reporting Rates of WC
0.30
0.40
0.50
0.60
0.70
0.80
0.90
1.00
1976 1981 1986 1991 1996 2001 2006 2011
Rep
ortin
g R
ate
Calendar Year
PSID SIPP CPS CES
0.20
0.40
0.60
0.80
1.00
1.20
1.40
1976 1981 1986 1991 1996 2001 2006 2011
Rep
ortin
g R
ate
Calendar Year
PSID SIPP CPS CES
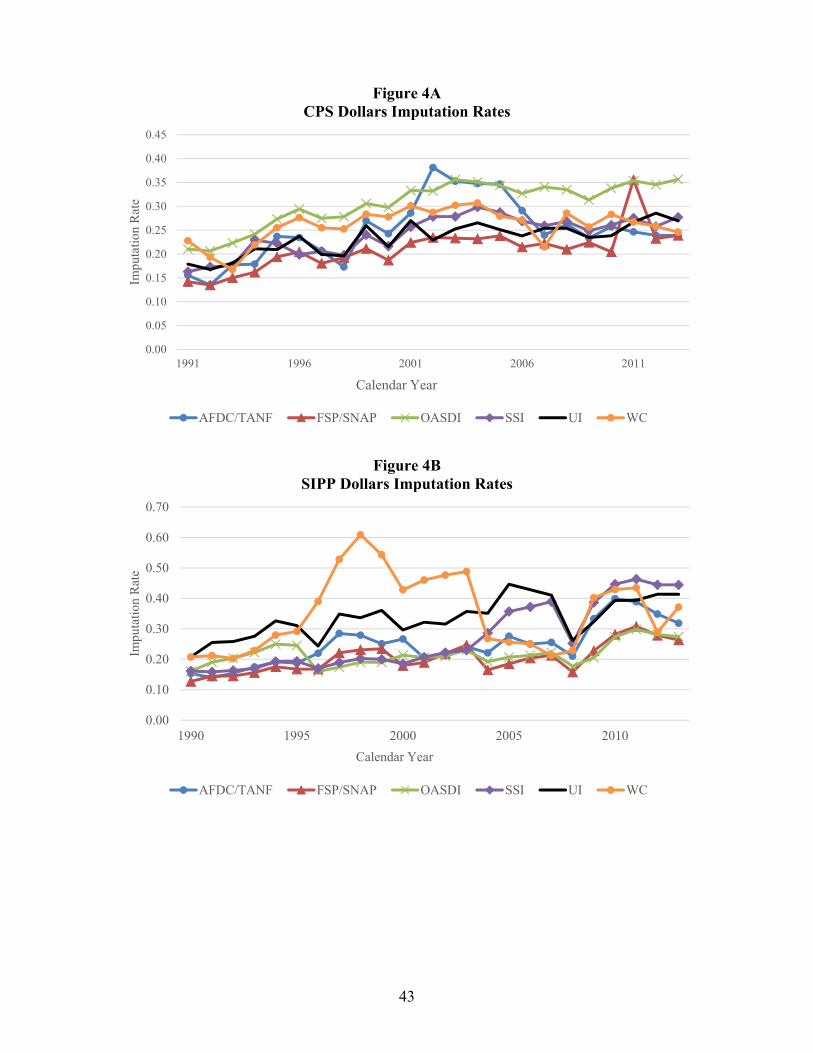
43
Figure 4A CPS Dollars Imputation Rates
Figure 4B SIPP Dollars Imputation Rates
0.00
0.05
0.10
0.15
0.20
0.25
0.30
0.35
0.40
0.45
1991 1996 2001 2006 2011
Impu
tatio
n R
ate
Calendar Year
AFDC/TANF FSP/SNAP OASDI SSI UI WC
0.00
0.10
0.20
0.30
0.40
0.50
0.60
0.70
1990 1995 2000 2005 2010
Impu
tatio
n R
ate
Calendar Year
AFDC/TANF FSP/SNAP OASDI SSI UI WC
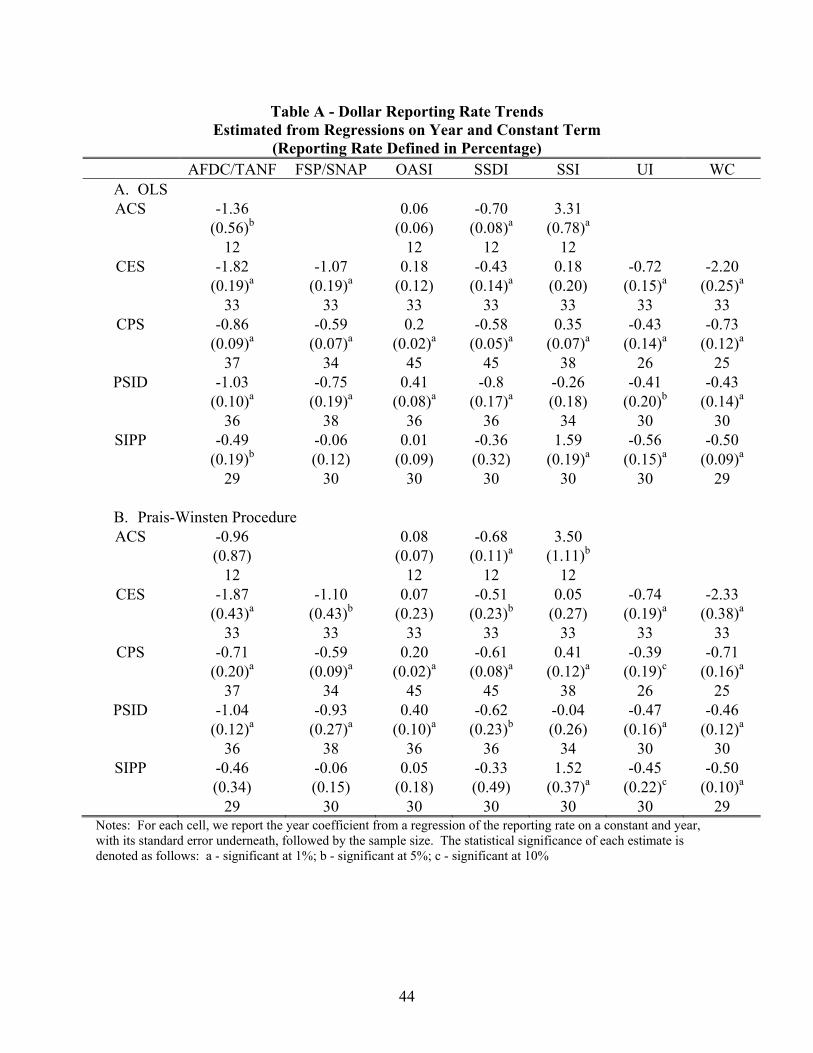
44
Table A - Dollar Reporting Rate Trends
Estimated from Regressions on Year and Constant Term (Reporting Rate Defined in Percentage)
AFDC/TANF FSP/SNAP OASI SSDI SSI UI WC A. OLS ACS -1.36 0.06 -0.70 3.31
(0.56)b (0.06) (0.08)a (0.78)a 12 12 12 12
CES -1.82 -1.07 0.18 -0.43 0.18 -0.72 -2.20 (0.19)a (0.19)a (0.12) (0.14)a (0.20) (0.15)a (0.25)a
33 33 33 33 33 33 33 CPS -0.86 -0.59 0.2 -0.58 0.35 -0.43 -0.73
(0.09)a (0.07)a (0.02)a (0.05)a (0.07)a (0.14)a (0.12)a 37 34 45 45 38 26 25
PSID -1.03 -0.75 0.41 -0.8 -0.26 -0.41 -0.43 (0.10)a (0.19)a (0.08)a (0.17)a (0.18) (0.20)b (0.14)a
36 38 36 36 34 30 30 SIPP -0.49 -0.06 0.01 -0.36 1.59 -0.56 -0.50
(0.19)b (0.12) (0.09) (0.32) (0.19)a (0.15)a (0.09)a
29 30 30 30 30 30 29
B. Prais-Winsten Procedure ACS -0.96 0.08 -0.68 3.50
(0.87) (0.07) (0.11)a (1.11)b 12 12 12 12
CES -1.87 -1.10 0.07 -0.51 0.05 -0.74 -2.33 (0.43)a (0.43)b (0.23) (0.23)b (0.27) (0.19)a (0.38)a
33 33 33 33 33 33 33 CPS -0.71 -0.59 0.20 -0.61 0.41 -0.39 -0.71
(0.20)a (0.09)a (0.02)a (0.08)a (0.12)a (0.19)c (0.16)a 37 34 45 45 38 26 25
PSID -1.04 -0.93 0.40 -0.62 -0.04 -0.47 -0.46 (0.12)a (0.27)a (0.10)a (0.23)b (0.26) (0.16)a (0.12)a
36 38 36 36 34 30 30 SIPP -0.46 -0.06 0.05 -0.33 1.52 -0.45 -0.50
(0.34) (0.15) (0.18) (0.49) (0.37)a (0.22)c (0.10)a 29 30 30 30 30 30 29
Notes: For each cell, we report the year coefficient from a regression of the reporting rate on a constant and year, with its standard error underneath, followed by the sample size. The statistical significance of each estimate is denoted as follows: a - significant at 1%; b - significant at 5%; c - significant at 10%
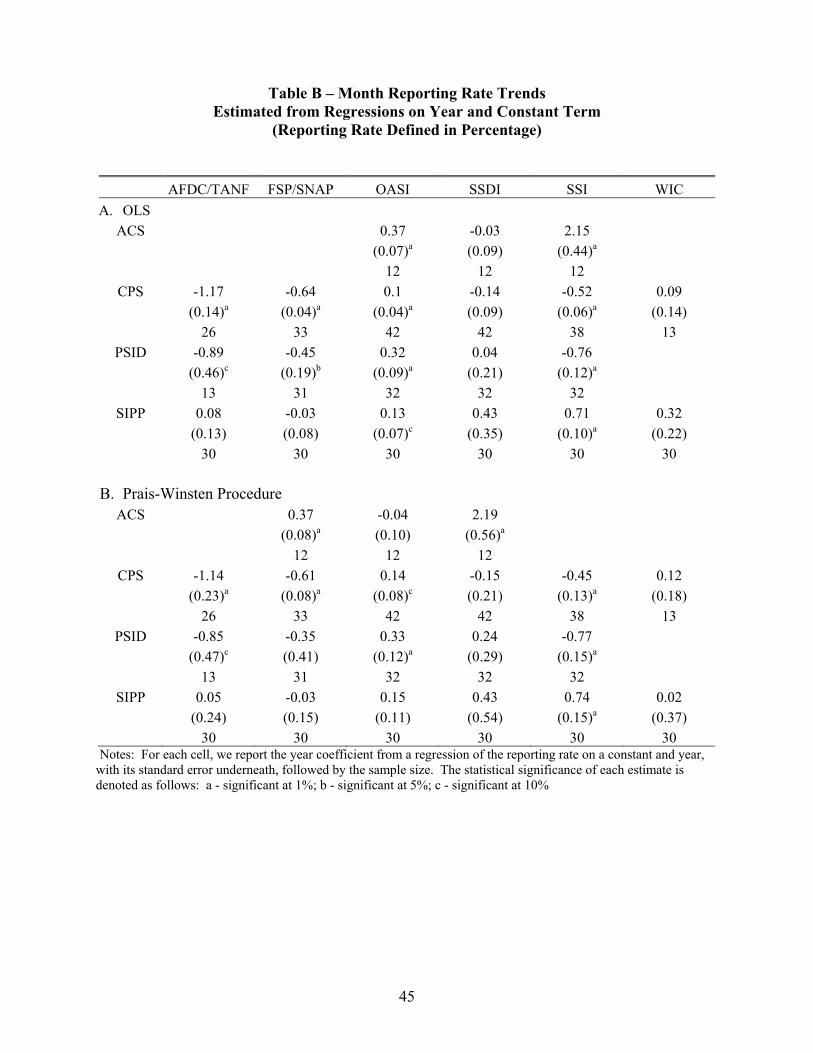
45
Table B – Month Reporting Rate Trends Estimated from Regressions on Year and Constant Term
(Reporting Rate Defined in Percentage)
AFDC/TANF FSP/SNAP OASI SSDI SSI WIC
A. OLS
ACS 0.37 -0.03 2.15
(0.07)a (0.09) (0.44)a
12 12 12
CPS -1.17 -0.64 0.1 -0.14 -0.52 0.09
(0.14)a (0.04)a (0.04)a (0.09) (0.06)a (0.14)
26 33 42 42 38 13
PSID -0.89 -0.45 0.32 0.04 -0.76
(0.46)c (0.19)b (0.09)a (0.21) (0.12)a
13 31 32 32 32
SIPP 0.08 -0.03 0.13 0.43 0.71 0.32
(0.13) (0.08) (0.07)c (0.35) (0.10)a (0.22)
30 30 30 30 30 30
B. Prais-Winsten Procedure ACS 0.37 -0.04 2.19
(0.08)a (0.10) (0.56)a
12 12 12
CPS -1.14 -0.61 0.14 -0.15 -0.45 0.12
(0.23)a (0.08)a (0.08)c (0.21) (0.13)a (0.18)
26 33 42 42 38 13
PSID -0.85 -0.35 0.33 0.24 -0.77
(0.47)c (0.41) (0.12)a (0.29) (0.15)a
13 31 32 32 32
SIPP 0.05 -0.03 0.15 0.43 0.74 0.02
(0.24) (0.15) (0.11) (0.54) (0.15)a (0.37)
30 30 30 30 30 30 Notes: For each cell, we report the year coefficient from a regression of the reporting rate on a constant and year, with its standard error underneath, followed by the sample size. The statistical significance of each estimate is denoted as follows: a - significant at 1%; b - significant at 5%; c - significant at 10%

46
Table C – Dollar Imputation Rate Trends Estimated from Regressions on Year and Constant Term
(Reporting Rate Defined in Percentage)
AFDC/TANF FSP/SNAP OASDI SSI UI WC
A. OLS
CPS 0.44 0.49 0.62 0.47 0.39 0.22 (0.18)b (0.10)a (0.08)a (0.08)a (0.06)a (0.10)b
23 23 23 23 23 23 SIPP 0.81 0.51 1.24 0.47 0.67 0.27
(0.13)a (0.10)a (0.16)a (0.07)a (0.13)a (0.37) 24 24 24 24 24 24
B. Prais-Winsten Procedure
CPS 0.41 0.49 0.64 0.48 0.39 0.18 (0.35) (0.08)a (0.13)a (0.12)a (0.06)a (0.17)
23 23 23 23 23 23 SIPP 0.79 0.53 1.25 0.48 0.69 0.40
(0.19)a (0.14)a (0.26)a (0.10)a (0.16)a (0.66) 24 24 24 24 24 24
Notes: For each cell, we report the year coefficient from a regression of the imputation rate on a constant and year, with its standard error underneath, followed by the sample size. In the case of SIPP, we treat all “Statistical and Logical Imputation using Previous Wave Data” as non-imputation unless the original data are imputed. The statistical significance of each estimate is denoted as follows: a - significant at 1%; b - significant at 5%; c - significant at 10%
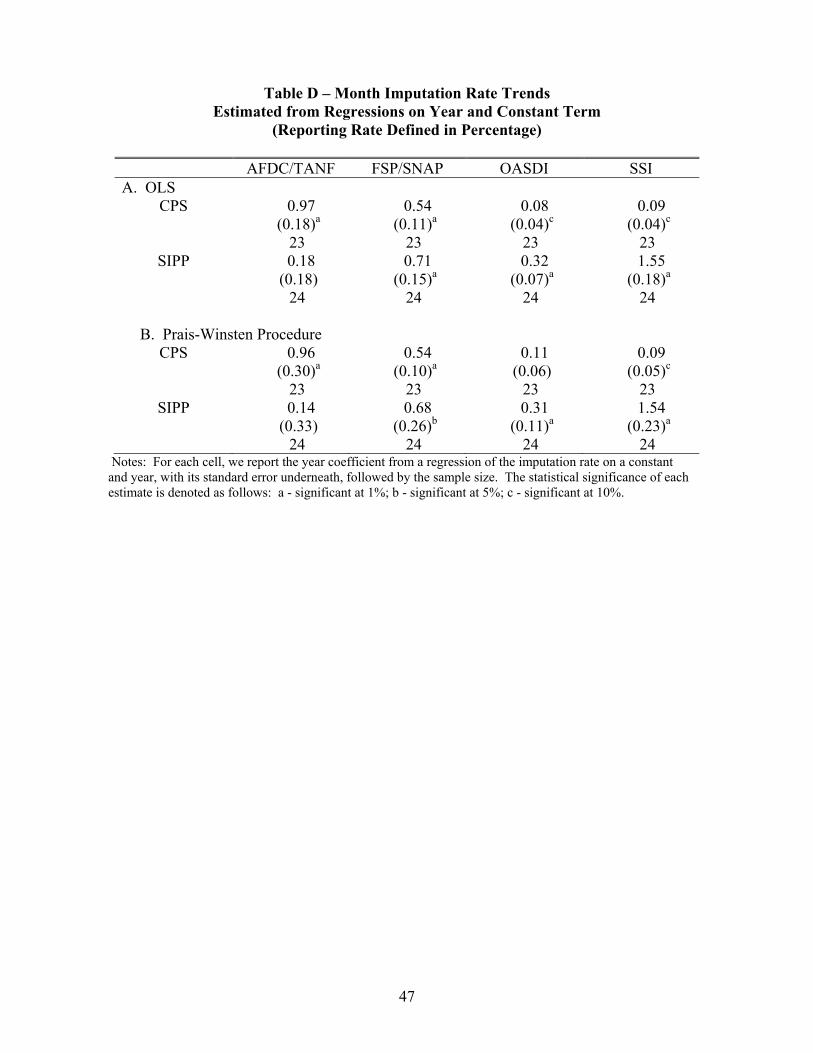
47
Table D – Month Imputation Rate Trends Estimated from Regressions on Year and Constant Term
(Reporting Rate Defined in Percentage)
AFDC/TANF FSP/SNAP OASDI SSI A. OLS
CPS 0.97 0.54 0.08 0.09 (0.18)a (0.11)a (0.04)c (0.04)c 23 23 23 23
SIPP 0.18 0.71 0.32 1.55 (0.18) (0.15)a (0.07)a (0.18)a 24 24 24 24
B. Prais-Winsten Procedure
CPS 0.96 0.54 0.11 0.09 (0.30)a (0.10)a (0.06) (0.05)c 23 23 23 23
SIPP 0.14 0.68 0.31 1.54 (0.33) (0.26)b (0.11)a (0.23)a 24 24 24 24
Notes: For each cell, we report the year coefficient from a regression of the imputation rate on a constant and year, with its standard error underneath, followed by the sample size. The statistical significance of each estimate is denoted as follows: a - significant at 1%; b - significant at 5%; c - significant at 10%.