the uk nursing labour market review 2016
TRANSCRIPT

Unheeded warnings: health care in crisis The UK nursing labour market review 2016
R C N L A B O U R M A R K E T R E V I E W

Unheeded warnings: health care in crisis The UK nursing labour market review 2016 2
Contents
1. Introduction and commentary 3
2. The UK nursing workforce 5
3. Immigration 9
4. The nursing workforce in NHS England, Scotland, Wales and Health in Social Care in Northern Ireland 14
5. Nursing and earnings 29
6. Nurse education and graduate earnings 33

Unheeded warnings: health care in crisis The UK nursing labour market review 2016 3
1. Introduction and commentary
This report provides a review of the UK nursing labour market, looking at recent data and trends for nursing staff working in the health sector across the UK, drawing out differences and similarities across the four UK countries. The review uses national data sets to estimate the size, shape and composition of the nursing workforce. The review covers:
• theUKnursingworkforceacrossthewholeUKeconomy
• immigration
• thenursingworkforceinNHSEngland,Scotland,WalesandinHealthandSocialCare, NorthernIreland
• nursingearnings
• pre-registrationeducationandgraduateearnings.
Thepublicationofthisyear’sLabour Market Review (LMR) comes just a few months after the decision wasmadebytheMigrationAdvisoryCommittee(MAC)toplacenursesontheShortageOccupationList1.Whenoccupationsareplacedonthislist,fewerrestrictionsareplacedonUKemployersrecruitingcandidatesdirectlyfromoverseas;specificallyfromoutsidetheEU.Theywouldnolongerneedtocompletearesidencytest,whichinvolvesdemonstratingthatasearchforsuitablecandidateswithintheUKinthefirstinstancehasbeenunsuccessful.
Thisdecisionandthereasonsfordoingso,encapsulatetheriskstakenwithsecuringsufficientsupplyinthenursingworkforce.TheRCNhasbeenwarningabouttherisksofwoefullyinadequateworkforceplanninggoingbackatleasttwentyyears.
TheMAChasstatedclearlythatthereisanursingshortageintheUKandhasexplainedthatthecurrentshortageismostlydowntofactorswhichcould,andshould,havebeenanticipatedbythehealth, care and independent sectors. These issues include an ageing population, problems with staff training,payandrecruitment,compoundedbyasqueezeonbudgets.
MuchoftheMAC’sanalysisresonateswiththeRCN’swarningsinourLabour Market Review and elsewhere.Theanalysispointsoutthatdemandfornursingstaffhasgrownduetotheageingpopulation,reformstothedeliveryofhealthandsocialcare,thepushtoincreasenursetopatientratios in the wake of the Francis Report and staffing guidelines, as well as the changing role of the profession,withnursingstafftakingonmoredutiespreviouslycarriedoutbyothers.Thisgrowthindemand for nursing staff should and could have been predicted through workforce planning.
Theanalysisalsorepeatsourconcernsabouttheuncoordinatedapproachtomanagingthesupplyofqualifiednurses,withfragmentedworkforceplanningstructures,cumulativereductionsinthenumberoftrainingplacesfornursesandthemoveawayfrombursariestoastudentloansystem.Inrelationtothisdecisiontoreplacebursarieswithloansfornursingstudents,theMACwarnsthatpublicsectorpayrestraintmaylimitthenumberspreparedtotakeuptheextraplacesprovidedbyuniversitiesthroughthenewsystembeingintroducedinEngland.Thisyear’sLMRalsopointstothenarrowinggapbetweengraduateandnon-graduateearningsintheeconomyasawholewhichmayimpact on nursing as a degree choice.
1 www.gov.uk/government/uploads/system/uploads/attachment_data/file/510630/Partial_review_of_the_shortage_occupation_list_-_review_of_nursing.pdf

Unheeded warnings: health care in crisis The UK nursing labour market review 2016 4
The committee also points to the failure to ensure that the number of nurses trained is sufficient to meetdemandfornursesinthecareandindependentsectors,creatingastructuralundersupplyintheseareas.TheMACgoesontoquestiontheirlowlevelsofinvolvementinandcontributiontothetrainingofpre-registrationnursesintheUK,despitetheirrelianceonthiscohortofstaff.
BoththeRCNandtheMAChavehighlightedthehistoricpatternofpeaksandtroughsinthesupplyofmigrantnurses,withthecommitteesuggestingthatmigrantnurseshavebeenusedtosavecosts.Itstates that nursing is an occupation in which migrants earn, on average, less than UK workers doing thesamejob.Inmostothergraduateoccupations,migrantsearnonaveragemorethanUKworkersinthe same job.
Payrestraintisalsoasharedissueofmajorconcern,withtheMACindicatingthatpaycouldbeakeydriverofpoorretentionofnursesinpermanentrolesintheNHSandcaresectors,withmanymovingtoagencyworkorleavingtheprofessionaltogether.Italsopointstotheuseofsignificantpayincreasesinthelate1990sand2000stotargetseverenurseshortagesintheNHSandquestionswhythisstrategycouldnotberepeatednowgiventheshortageofnurses.
TheRCNbelievesthatunlesstheUKgovernmentsrapidlygettogripswiththedemandandsupplyfactorscausingthecurrentnursingshortageandtakestrategicactiontoaddressthesupplyissues,includingrecruitmentandretention,theshortageislikelytogetworse.Thepotentiallyseriousanddangerousimplicationsforhealthandsocialcareshouldnotbeunderestimated.Withoutsufficientnursingstaffandexponentiallyrisingdemand,patientcareisbeingputatrisk.

Unheeded warnings: health care in crisis The UK nursing labour market review 2016 5
2. The UK nursing workforce
The Labour Market Review aims to estimate the size, shape and composition of the nursing workforce usingOfficeofNationalStatisticsdatasetsinadditiontodatacollectedbythefourUKhealthdepartments.Itshouldbenotedthatdatasetsoftenusedifferentterminology,particularlyaroundthedefinitionofnursesandmidwivesandnursingsupportstaff,anddataissometimescollectedacrossdifferenttimeframesandthatthesedifferenceshavebeenidentifiedwheresignificant.Forexample,somedatasetsrefertoregisteredandotherstoqualifiednurses.Nursingsupportstaffarereferredtoasnursingassistantsandauxiliariesinofficialdatawhileotherdefinitionsareusedbydifferenthealthdepartments.
Section2providesananalysisoffiguresfromtheLabour Force Survey(LFS)whichprovidesofficialmeasuresofemploymentandunemploymentfortheUK.Itgivesanindicationofthenumberofnurses,nursingassistantsandauxiliariesandmidwivesworkingacrosstheUKeconomy(asdefinedbytheOfficeforNationalStatistics).
Figure 1: Nurses, nursing assistants/auxiliaries and midwives in employment (2006-2016)
Source:AnalysisofLabourForceSurveysApril-June2006-2016
TheLFSprovidesanestimationofthesizeofindividualsectorsasdefinedbystandardindustrialclassification(SIC)codesandthenumberofpeopleworkingingivenoccupationsasdefinedbystandardoccupationclassification(SOC)codes–inthiscasenurses2,nursingauxiliariesand
2 SOC2231definesnursesasthoseproviding‘generaland/orspecialisednursingcareforthesick,injuredandothersinneedofsuchcare,assistmedicaldoctorswiththeirtasksandworkwithotherhealthcareprofessionalsandwithinteamsofhealthcareworkers.Theyadviseonandteachnursingpractice.’
700,000
650,000
600,000
550,000
500,000
450,000
400,000
350,000
300,000
250,000
200,000
150,000
100,000
50,000
02006 2007 2008 2009 2010 2011 2012 2013 2014 2015 2016
Nurses MidwivesNursing auxilaries and assistants

Unheeded warnings: health care in crisis The UK nursing labour market review 2016 6
assistants3 and midwives.4ThesegroupsareclassifiedasworkingintheNHS,otherpartsofthepublicsectorandtheindependentandvoluntarysectors.
Figure1showsasteadyincreaseinthenumberofnursesbetween2006and2016,withtheexceptionofaperiodofdeclinebetween2008and2010.Therewereestimatedtobearound665,841peopleemployedintheoccupationalcategoryofnursein2016,havingrisenby23%since2006.
Thereareanestimated302,381peopleemployedinthecategoryofnursingauxiliariesandassistantsintheUKin2016,havingrisenby37%since2006.
Inaddition,thereareestimatedtobearound42,308peopleemployedasmidwivesintheUKin2015,havingrisenby27%since2006.
Overthissameperiod,thetotalnumberofpeopleinemploymentroseby7%fromalmost29milliontojustaround31.7million.
Figure 2: Nurses and midwives in employment and sector of work (2016)
Source:AnalysisofLabour Force Survey January-March 2016
Figure 3: Nursing auxiliaries and assistants in employment and sector of work (2016)
Source:AnalysisofLabour Force Survey January-March 2016
3 SOC6141definesnursingauxiliariesandassistantsaswho‘assistdoctors,nursesandotherhealthprofessionalsincaringforthesickandinjuredwithinhospitals,homes,clinicsandthewidercommunity.’
4 SOC2232definesmidwivesasthosewho‘deliver,orassistinthedeliveryofbabies,provideantenatalandpostnatalcareandadviseparentsonbabycare.Theyworkwithotherhealthcareprofessionals,andadviseonandteachmidwiferypractice.’
Health authority or NHS trust
Charity/voluntary sector
Other public sector
Private sector
1.8%
14.7%
80.8%
2.7%
6.6%
22.7%
64.8%
5.9%
Health authority or NHS trust
Charity/voluntary sector
Other public sector
Private sector

Unheeded warnings: health care in crisis The UK nursing labour market review 2016 7
AnalysisofLFSdatashowthatthemajorityofbothnursesandnursingauxiliaries/assistantsworkforhealthauthoritiesorNHStrusts/boards.Aroundoneinsevennursesandoneinfivenursingauxiliaries/assistantsworkintheprivateorindependentsector.
AccordingtoLaingBuisson(independenthealth,communitycareandchildcaresectoranalysts)revenuesgeneratedbyprivateorindependentsectorprovidersinthehealthandcaremarketgrewby5%in2015toreach£45.3bn.
Theyexplainthatgrowthwasledbyprivateacutehealthcare,drivenbyprivatedemandaswellasNHS‘chooseandbook’patientsoptingtoreceiveNHSpaidtreatmentinindependenthospitals,followedbycarehomesforolderpeople(drivenbyprivatelypayingresidents)andmentalhealthhospitals.5Privateandindependentsectorprovidersthereforeplayamajorroleindeliveringcare,yetitisdifficulttoassesscurrentorfutureworkforceneedsbecauseitislargelyexcludedfrombothofficial workforce data and formal workforce planning processes.
Figure 4: Proportion of nurses, nursing auxiliaries/assistants and all UK employees working part time (2006-2016)
Source:AnalysisoftheLabour Force Survey 2006-2016
Figure4showsestimatesofpart-timeworkingamongthenursingworkforceascomparedtothewhole UK working population.6
In2006,almosttwofifths(37%)ofnursesreportedthattheyworkedparttime,droppingto28%in2013andthenmovingupto33%in2015.Asimilartrendisevidentamongnursingauxiliariesandassistants,with41%reportingworkingparttimein2006,decliningto35%in2013andincreasingto37%in2015.
Part-timeworkingisclearlymoreprevalentinthenursingworkforcethantheworkforceasawhole;justoveraquarterreportedtheyworkedparttimedroppingto22%in2014beforereturningto26%in2016.
5 www.laingbuisson.co.uk/MediaCentre/PressReleases/HealthcareReview28.aspx
6 Full-timeandpart-timestatusisself-classifiedbyrespondentstothe Labour Force Survey.
504540353025201510
50
2006 2007 2008 2009 2010 2011 2012 2013 2014 2015 2016
Nurses All UK employeesNursing auxilaries and assistants
%

Unheeded warnings: health care in crisis The UK nursing labour market review 2016 8
Figure 5: Proportion of female nurses, female nursing auxiliaries/assistants and all female UK employees working part time (2004-2014)
Source:AnalysisoftheLabour Force Survey 2004- 2014
Figure5looksatpart-timeworkinginmoredetailthoughanalysisoftheincidenceamongfemaleemployeesonly,duetothehighproportionofwomeninthehealthcareworkforce(around90%ofnursesand80%ofnursingauxiliariesandassistantsarefemale).
AmongallfemaleemployeesintheUK,part-timeworkingishigherthanamongmen.In2016,twofifths(41%)ofallwomenreportedworkingparttimein2016comparedto12%ofmen.
Lookingatnursesinemployment,therewasanoveralldownwardtrendinpart-timeworkingamongthefemaleworkforcebetween2006and2013from37to30%.By2016,theproportionworkingparttimehasreturnedtothelevelseenin2006.Thetrendappearsslightlymoreerraticamongnursingauxiliariesandassistants,withpeaksandtroughsoverthelast10years,finishingat41%in2016.
50
45
40
35
30
252006 2007 2008 2009 2010 2011 2012 2013 2014 2015 2016
Nurses All UK employeesNursing auxillaries and assistants
%

Unheeded warnings: health care in crisis The UK nursing labour market review 2016 9
3. Immigration
Section3considerstheissueofimmigration,thecurrentnumbersofnursingstaffbornortrainedoutside the UK and recent developments impacting on immigration.
ThefirstmajordevelopmentisthedecisiontoplacenursingontheShortageOccupationList,inrecognitionthatthedemandforqualifiednursesacrossallhealthandsocialcareproviderscurrentlyexceedstheavailablesupply.
ThesecondmajordevelopmentistheJune2016referendumdecisionfortheUKtoleavetheEuropeanUnion.
ThissectiondrawsondatafromtheNursingandMidwiferyCouncil(NMC)andtheLabour Force Survey(LFS)toprovideestimatesaboutthenumberofnursingstaffbornortrainedasanurseoutsidetheUK.Therearekeydifferencesinthedatapresented,inparticulartheNMCdatapresentsthenumberofqualifiednursesandmidwiveswhoregisteredabroad.AllnursesandmidwiveswhopractiseintheUKmustbeontheregister,howeverthisdoesnotnecessarilymeantheyareworkingasanurseormidwife.SincetheLabourForceSurveyasksrespondentsabouttheircountryofbirth,therearethereforemethodologicaldifferencesbetweenthedataanalysedandpresented.
3.1 Nursing and Midwifery Council data
LookingfirstatNursingandMidwiferyCouncil(NMC)datatogiveaninindicationofthenumberofnursesandmidwivesontheNMCregister,therewere686,782nursesandmidwivesontheregisterasof31March2015.Thisrepresentsanincreaseof5,924(0.9%)since2014.7Oftheseregistrants,around33,000nurseswhotrainedintheEUorEuropeanEconomicArea(EEA)areregisteredtoworkintheUK.Over9,000EEAnursesjoinedtheNMCregisterin2015/16,whichisa21%increaseon2014/15figures.
3.1.1 Inflow and outflow of registrants
TheNMCalsorecordsverificationsissuedtoothercountrieswhichgivesanindicationoftheoutflowofregisterednursescomparedtoinflowfromnewregistrants.Figure6showsthattheinflowhasbeenhigherthanoutflowsince2013/14.
Ofthe4,866verificationsissuedin2015/16,twofifths(46%)wereissuedtoAustralia,20%totheUSA,10%toIrelandand6%toNewZealand.
7 NursingandMidwiferyCouncil.Annual Reports and Accounts 2014-15 and 2013-14 www.nmc.org.uk/about-us/reports-and-accounts/annual-reports-and-accounts/

Unheeded warnings: health care in crisis The UK nursing labour market review 2016 10
Figure 6: Inflow and outflow of nurses and midwives from the UK (1995/6 – 2015/6)
Source:NursingandMidwiferyCouncil
3.1.2 New entrants 2015-16
Figure7showsthetrendinnumbersofnewnursesenteringthelabourmarketfromUKtrainingbetween2006/7and2015/16.Itshowsthattherewere17,257newregistrationsin2015-16,afallof25%since2013-14,reflecting,atleastinpart,reductionsinthenumberofnursingstudents.
Figure 7: Number of new entrants to the UK nursing register from UK sources (2006/7 to 2015/16)
Source:NursingandMidwiferyCouncil
30,000
28,000
26,000
24,000
22,000
20,000
18,000
16,000
14,000
12,000
10,000
2006-7
2007-8
2008-9
2009-10
20010-11
20011-12
20012-13
20013-14
20014-15
20015-16
New
ent
rant
s
18,000
16,000
14,000
12,000
10,000
8,000
6,000
4,000
2,000
0
Inflow Outflow
1995-6
1996-7
1997-8
1998-9
1999-00
2000-1
2001-2
2002-3
2003-4
2004-5
2005-6
2006-7
2007-8
2008-9
2009-10
2010-11
2011-12
2012-13
2013-14
2014-15
2015-16

Unheeded warnings: health care in crisis The UK nursing labour market review 2016 11
Figure8showsthepatternofannualregistrationofnursesandmidwivesfromnon-EEAcountriesandEEAcountriessince2006-07.TheNMCdatarecordswhenanurseregisters,butthisdoesnecessarilymeanthattheyareworkingintheUKasanurse.
Overallnumbershavebeenrisingrapidlysince2010/11,triplingoverthisperiodfrom3,858to11,261in2015/16,withmostgrowthseeninregistrationsfromnursesinitiallyregisteredintheEU.Thedropinmid-to-late2000sislinkedtostricterimmigrationrulesaswellasmorecostlyapplicationrequirementsimplementedbytheNMCforinternationalnurses.Meanwhile,thenumberofEUregistrantshasincreasedashealthandsocialcareorganisationsseektofillworkforcegapsandnursingstaffseektoleaveEuropeancountrieshitbyeconomicdownturn.
In2015/16,60%ofnewentrantstotheNMCregisterwerefromtheUK,32%fromtheEEAand8%fromoutsidetheEEA.
Figure 8: Number of new entrants to the UK nursing register from non-EEA and EEA sources (2006/7 to 2015/16)
Source:NursingandMidwiferyCouncil
12,000
10,000
8,000
6,000
4,000
2,000
0
Non-EU
2006-7
2007-8
2008-9
2009-10
20010-11
20011-12
20012-13
20013-14
20014-15
Num
ber o
f adm
issi
ons
200115-16
EU

Unheeded warnings: health care in crisis The UK nursing labour market review 2016 12
3.2 Labour Force Survey data
This section looks at data from the Labour Force Survey(LFS),lookingatresponsesfromrespondentswhoreportworkingasnurses,midwivesornursingauxiliariesandassistantsandtheircountryofbirth.ThisanalysisincludespeoplewhobecameUKnationalsaftermovingtotheUKandpeoplewhowerebornabroadtoUKnationalparentsandthereforemaybeslightlyhigherthanotherestimates.However,thisgivesanindicationoftherelianceonEUandnon-EUnationalsamonghealthandsocialcare providers.
Acrossallproviders,thereareanestimated21%ofthenursingandmidwiferyworkforceand25%ofthenursingauxiliaryandassistantworkforcewhowerebornoutsidetheUK.Therelianceonforeignbornnursingstaffisparticularlyhighintheprivatesector,makinguptwofifthsofthenursingandmidwiferyworkforceandalmostathirdofthenursingauxiliaryandassistantworkforce.
Table1: Country of birth as percentage of occupational groupings
All sectors NHS Private firms
EU % Non-EU % EU % Non-EU % EU % Non-EU %
Qualifiednursesand midwives
6.8 14.6 6.4 15.0 11.7 29.7
Nursingauxiliariesand assistants
5.1 20.2 5.7 19.7 5.2 24.7
Source:Labour Force Survey,January-March2016
3.3 European nationals in the nursing workforce
DependingonthesettlementthattheUKnegotiateswiththeEUpost-Brexit,theUKmayrestricttheflowofimmigrantsfromEurope.ThefuturesituationofEEAnationalsalreadyworkinginthehealthand care sector is also unresolved. Both these factors could cause a major problem for staffing in the NHSandotherhealthandsocialcareorganisations,eitherdirectlythroughnewrestrictionspreventingEU-bornNHSstafffromworkinginBritain,orindirectlybecauseEU-bornstaffmaychoosetoleavetheUKduetotheuncertaintycreatedbeforenewrulesareputinplaceonmigrationrestriction.
Analysisofthedatasuggeststhatthecountryofbirthforalmost7%ofallnursesandmidwivesand5%ofnursingauxiliariesandassistantsintheUKworkforceiswithinanotherEUcountry.Inaddition,almost15%ofallnursesandmidwivesand20%ofnursingauxiliariesandassistantsemployedintheUK were born in other countries.
FornursesandmidwivesworkingforahealthauthorityorNHStrust,theproportionborninanotherEUcountryisestimatedatjustover6%andtheproprtionborninanothercountryis15%.Amongnursingauxiliariesandassistants,almost6%wereborninanotherEUcountryandfurther20%outsidetheEU.
Thefiguresaremuchhigherforprivatefirms,with12%ofnursesandmidwivesborninanotherEUcountryand30%inanon-EUcountry.Lookingatnursingauxiliariesandassistants,5%werebornelsewhereintheEUwhile25%reporttheircountryofbirthasanon-EUcountry.

Unheeded warnings: health care in crisis The UK nursing labour market review 2016 13
3.4 Shortage Occupation List
TheShortageOccupationListisdesignedtotemporarilyassistemployersinmeetingdomesticmarketshortages,andisregularlyreviewedbytheMigrantAdvisoryCommittee(MAC).
Themostrecentfullreviewwasheldin2013,anditwasnotrecommendedthatnursesshouldbeplacedonthelistatthattime.However,apartialreviewin2015concludedthattherewasasignificantshortageofnursesandthattheyshouldbeaddedtothelistforalimitedperiod.
ThereportreleasedbyMACinMarch2016criticisedtheDepartmentofHealthforusingimmigrationasa“get-out-of-jail-freecard”whenshortfallsshouldhavebeenanticipatedanddomesticnursesshould have been trained.
Thecommitteerecommendedthatthereshouldbeamaximumannualcapof5,000placesfornursesunderTier2(workvisasforskilledmigrantsfromoutsidetheEuropeanEconomicArea)withthelimitreducinggraduallyoverthenextthreeyears.ThislimitwassetbecausetheannualquotaofTier2visascurrentlystandsat20,700foreveryindustrythatwantstobringinnon-EUworkers,andthecommitteeidentifiedthedangerofnursescrowdingoutskilledmigrantsfromoccupationsnotinshortage,includingengineersandworkersinthefinancialsector.Inaddition,UKemployerswishingtorecruitanon-EEAnursearealsorequiredtocompleteaResidentLabourMarketTest.

Unheeded warnings: health care in crisis The UK nursing labour market review 2016 14
4. The nursing workforce in NHS England, Scotland, Wales and in Health and Social Care in Northern Ireland
ThissectionlooksattrendsinthenursingworkforceacrossthefourUKcountriesbetween2009and2015.8WhileservicesareoftenreferredtoastheNHStheyaremostlyindependentfromeachotherandoperateunderdifferentmanagement,rules,andpoliticalauthority.
This timeframe has been used to allow for consistent comparison of data, taking into account methodologicalchangesmadebyNHSDigitalinEngland,whichisresponsiblefortheprovisionofNHSworkforcedata.
Thesemethodologicalchangeshaveinvolvedthere-categorisationoftheworkforce,whichinturnimpactsonthecomparabilitywithpreviouslypublishedworkforcenumberswhichhavebeenusedinpreviouseditionsoftheRCN’sLabour Market Review.
SinceNHSDigitalhaveproducedrevisedhistoricaldatagoingbacktoSeptember2009,thisdatehasbeenusedasthestartingpointforthisyear’sLabour Market Review for workforce data relating to all fourcountries’nationalhealthservices.
Alleffortshavebeenmadetoensureconsistencybetweenmeasuresbuttherearevariationsindefinitionsandmethodsofdatacollectionbetweenthedifferentcountries.Althoughdatamaynotbefullycomparablebetweencountries,wecanseeageneralupwardtrendintheregisterednursing,midwiferyandhealthvisitingworkforceandanupwardtrendinthehealthcareassistant/healthcaresupportworkerworkforceoverthelasttenyearsinEngland,ScotlandandWales.Trendsforeachcountryareexploredfurtherinthereport.
Table 2: Full-time equivalent (FTE) and percentage change in the qualified nursing, midwifery and health visiting workforce, 2009, 2014-2015, England, Scotland, Wales and Northern Ireland910
2009 2014 2015 % change 2009-2015
% change 2014-2015
England 297,430 299,819 302,4089 1.7% 0.9%
Scotland 42,670 42,61610 43,085 1.0% 1.1%
Wales 21,714 21,987 22,146 2.0% 1.7%
NorthernIreland 13,934 14,472 14,725 5.7% 2.0%
8 Dataforallfourcountriesisprovidedaswholetimeequivalent(WTE)figuresandmeasuredatSeptemberannually.
9 NHSHospital&CommunityHealthService(HCHS)monthlyworkforcestatistics–ProvisionalStatistics:(2016)
10 ISDScotland(2015)NHS Scotland Workforce – Data as at 30th September 2014 – Nursing and midwifery staff in post www.isdscotland.org/Health-Topics/Workforce/Publications/data-tables.asp?id=577#577
Unheeded warnings: health care in crisis The UK nursing labour market review 2016 15
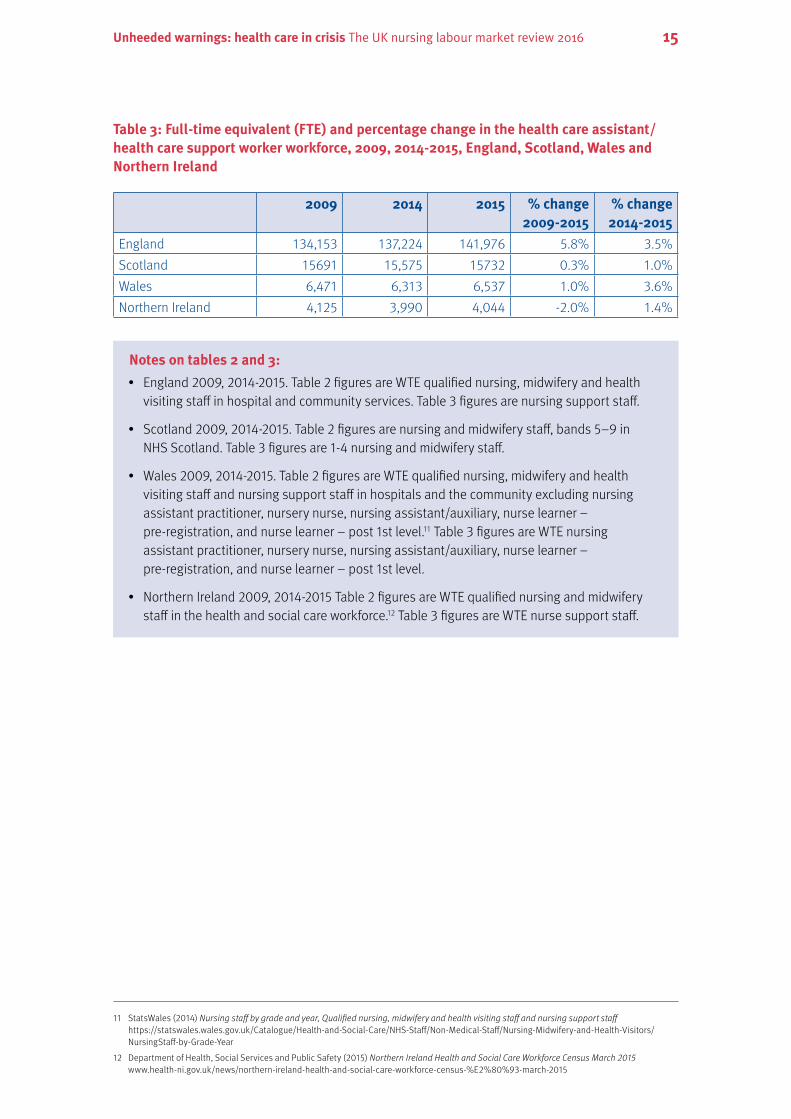
Table 3: Full-time equivalent (FTE) and percentage change in the health care assistant/health care support worker workforce, 2009, 2014-2015, England, Scotland, Wales and Northern Ireland
2009 2014 2015 % change 2009-2015
% change 2014-2015
England 134,153 137,224 141,976 5.8% 3.5%
Scotland 15691 15,575 15732 0.3% 1.0%
Wales 6,471 6,313 6,537 1.0% 3.6%
NorthernIreland 4,125 3,990 4,044 -2.0% 1.4%
Notes on tables 2 and 3:
• England2009,2014-2015.Table2figuresareWTEqualifiednursing,midwiferyandhealthvisitingstaffinhospitalandcommunityservices.Table3figuresarenursingsupportstaff.
• Scotland2009,2014-2015.Table2figuresarenursingandmidwiferystaff,bands5–9in NHSScotland.Table3figuresare1-4nursingandmidwiferystaff.
• Wales2009,2014-2015.Table2figuresareWTEqualifiednursing,midwiferyandhealth visitingstaffandnursingsupportstaffinhospitalsandthecommunityexcludingnursingassistantpractitioner,nurserynurse,nursingassistant/auxiliary,nurselearner– pre-registration,andnurselearner–post1stlevel.11Table3figuresareWTEnursing assistantpractitioner,nurserynurse,nursingassistant/auxiliary,nurselearner– pre-registration,andnurselearner–post1stlevel.
• NorthernIreland2009,2014-2015Table2figuresareWTEqualifiednursingandmidwifery staff in the health and social care workforce.12Table3figuresareWTEnursesupportstaff.
11 StatsWales(2014)Nursing staff by grade and year, Qualified nursing, midwifery and health visiting staff and nursing support staff https://statswales.wales.gov.uk/Catalogue/Health-and-Social-Care/NHS-Staff/Non-Medical-Staff/Nursing-Midwifery-and-Health-Visitors/NursingStaff-by-Grade-Year
12 DepartmentofHealth,SocialServicesandPublicSafety(2015)Northern Ireland Health and Social Care Workforce Census March 2015 www.health-ni.gov.uk/news/northern-ireland-health-and-social-care-workforce-census-%E2%80%93-march-2015

Unheeded warnings: health care in crisis The UK nursing labour market review 2016 16
4.1 NHS England nursing workforce
4.1.2 Hospital and community
Figure 9: Qualified nursing and midwifery staff (FTE); health care/nursing assistants (2004-2014) Index change: 2004 = 100
Source:NHSDigital
Figure9showsthetrendinqualifiednursingstaffandunregisterednursingstaffintheNHSinEnglandbetween2004and2014.Whiletherehasbeenanoverallincreaseof9%intheFTEnumberofqualifiednursesandmidwives(from286,841in2004to313,514in2014),thechartshowsthatthereweretwoperiodswhennumbersfell;between2006and2007,and2010and2011.
Lookingatnumbersofhealthcareassistantsandnursingassistants/auxiliaries,therehasbeenanoveralldownwardtrendbetween2004and2014,withfull-timeequivalentstafffallingby4%(from110,196to108,556).However,numbershavereturnedtogrowthsince2012whentheystoodat103,549.
115
110
105
100
95
90
85
802004 2005 2006 2007 2008 2009 2010 2011 2012 2013 2014
Qualified nursing and midwifery Health care/nursing assistants

Unheeded warnings: health care in crisis The UK nursing labour market review 2016 17
Figure 10: NHS England, monthly staffing, qualified nursing, midwifery and health visiting (FTE) September 2009-March 2016
Source:NHSDigital
Figure10showsmonthlystaffingfiguresandtracksthetrendinthequalifiednursingandmidwiferyworkforceinmoredetail.Thisshowsanoveralldownwardtrendbetween2009and2012andreachingaten-yearlowof269,912inAugust2012.Therehassincebeenanoverallrecoveryinnumbers,reaching285,387inMarch2016.
Table4looksindetailatthetrendinqualifiednursing,midwiferyandhealthvisitingstaffbetween2011and2015,andshowsthemixedfortunesacrossdifferentworkareas.
Numbersincreasedoverthisperiodinadultandchildren’snursing,amongmidwivesandhealthvisitors,therehavebeensizeablefallsincommunityandlearningdisability/difficultynursing.
Table 4: England, qualified nursing, midwifery and health visiting staff (FTE) by work area (2011-2015)
2011 2012 2013 2014 2015 % change 2011-2015
All 277,047 271,407 274,627 278,981 281,437 1.6%
Adult 166,977 165,017 168,410 172,511 174,960 4.8%
Children’snursing 17,490 17,839 19,157 19,467 19,650 12.3%
Communityhealth 40,281 39,836 36,705 36,490 36,413 -9.6%
Mental health 39,024 39,178 37,397 37,536 37,659 -3.5%
Healthvisitors 7,802 7,687 7,910 7,963 7,986 2.3%
Learning disabilities/difficulties
4,667 4,613 4,035 3,999 4,000 -14.3%
Midwives 19,878 20,178 20,344 20,357 20,414 2.7%
290,000
285,000
280,000
275,000
270,000
265,000
260,000
Sep 09
Dec 09
Mar 10Jun 10
Sep 10Dec 1
0Mar 1
1Jun 11
Sep 11Dec 1
1
Mar 12Jun 12
Sep 12Dec 1
2Mar 1
3Jun 13
Sep 13Dec 1
3
Mar 14Jun 14
Sep 14Dec 1
4Mar 1
5Jun 15
Sep 15Dec 1
5
Mar 16
FTE

Unheeded warnings: health care in crisis The UK nursing labour market review 2016 18
Figures11and12lookatmorerecent,monthlydataandconfirmstherecentopposingtrendsinstaffingnumbersbetweenadultandcommunitynursing.ByFebruary2015,thenumberoffull-timeequivalentqualifiednursingstaffhadreached177,716inadultsettingsand36,260incommunityservices.
Figure 11: NHS England monthly staffing, qualified nursing (FTE) in adult settings (September 2009-March 2016)
Source:NHSDigital
Figure 12: NHS England monthly staffing, qualified nursing staff (FTE) in community health September 2009 -March 2016)
Source:NHSDigital
180,000
175,000
170,000
165,000
160,000
155,000
FTE
Sep 09
Dec 09
Mar 10Jun 10
Sep 10Dec 1
0Mar 1
1Jun 11
Sep 11Dec 1
1
Mar 12Jun 12
Sep 12Dec 1
2Mar 1
3Jun 13
Sep 13Dec 1
3
Mar 14Jun 14
Sep 14Dec 1
4Mar 1
5Jun 15
Sep 15Dec 1
5
Mar 16
44,000
42,000
40,000
38,000
36,000
34,000
32,000
FTE
Sep 09
Dec 09
Mar 10Jun 10
Sep 10Dec 1
0Mar 1
1Jun 11
Sep 11Dec 1
1
Mar 12Jun 12
Sep 12Dec 1
2Mar 1
3Jun 13
Sep 13Dec 1
3
Mar 14Jun 14
Sep 14Dec 1
4Mar 1
5Jun 15
Sep 15Dec 1
5
Mar 16

Unheeded warnings: health care in crisis The UK nursing labour market review 2016 19
Figure 13: England, qualified nursing workforce (FTE), health visitors and district nurses (2000-2016)
Source:NHSDigital
Communityhealthnursinghasseenanoverall12%dropinFTEstaffingnumberssinceSeptember2009andlookingingreaterdepthattheworkforcegroupsinthisworkareashowshowtwodifferentoccupationshavefared.Whilethenumberofhealthvisitorshasgrownbyaquartersince2009,thenumberofdistrictnurseshasdroppedby41%.TheHealthVisitorImplementationPlan2011-15assistedadramaticincreaseinthenumberofhealthvistors,yetnumbershavefallensincetheendofthe programme.13Thenumberofdistrictnumbershasbeenfallingsince2009asthenumberbeingtrained has failed to keep up with the number leaving or retiring.
13 www.gov.uk/government/uploads/system/uploads/attachment_data/file/213759/dh_124208.pdf
12,000
10,000
8,000
6,000
4,000
2,000
0
FTE
District nurses Health visitors
Sep 09
Dec 09
Mar 10Jun 10
Sep 10Dec 1
0Mar 1
1Jun 11
Sep 11Dec 1
1
Mar 12Jun 12
Sep 12Dec 1
2Mar 1
3Jun 13
Sep 13Dec 1
3
Mar 14Jun 14
Sep 14Dec 1
4Mar 1
5Jun 15
Sep 15Dec 1
5
Mar 16

Unheeded warnings: health care in crisis The UK nursing labour market review 2016 20
Figure 14: Source of recruitment of joiners to the qualified nursing staff group (as can be best determined from the data available)
Source:NHSDigital,2016
Figure14looksatthesourceofrecruitmenttothequalifiednursingworkforceascanbebestdeterminedfromthedataavailable.Itshouldbenotedthatforasizeableproportionofjoinersthesourceofrecruitmentisunknown,rangingfrom42%for2010-11to17%in2014-15.Whilethismakesanalysisdifficult,therearesomeinterestingtrendsinthedata.
TheproportionofthenursingstaffjoiningtheworkforcefromtheEUrosefrom3.5%in2010-11to12.4%in2013-14,withasmallernumber(1.5%)recruitedfromoutsidetheEU.
Theproportionofjoinersfromeducation/trainingdroppedslightlyfrom15.3%toaround14%whilethelevelofmovementaroundtheNHSappearstohavesloweddownwiththeproportionofjoinerscomingfromotherNHSorganisationsfallingfrom33%in2010-11to26%.
40%
35%
30%
25%
20%
15%
10%
5%
0%2010-2011 2011-2012 2012-2013 2013-2014 2014-2015
NHS organisation
Other private sector
Education/training
Abroad – EU country
Private health/social care
Newly qualified
No employment
Abroad – Non-EU country
Other public sector

Unheeded warnings: health care in crisis The UK nursing labour market review 2016 21
4.2 NHS in Scotland
Figure 15: Scotland, registered and non-registered nursing and midwifery staff (FTE) 2009-2015. Index change: 2009=100
Source:InformationServicesDivision,Scotland
Figure15showstherelatedpatternsofgrowthintheregisteredandnon-registerednursingandmidwiferyworkforceinNHSScotlandbetween2009and2015.WhilethenumberofFTEregisterednursingandmidwiferyroseslightlyfrom42,670in2009to43,085in2015(1%),theperiodhasbeenoneofdeclinefollowedbyrecovery,fallingtoalowof41,066in2012.
Asimilartrendcanbeseeninthenon-registerednursingandmidwiferyworkforce,startingat15,691in2009,reachingitslowestpointofat14,671in2012beforerisingto15,732in2015.
CommunitynursingworkforcedatahasbeenunderreviewinScotlandduetoissueswithdataqualityandin2014/15anNHSScotlandwideprojecttoimprovetheaccuracyofrecordingandreportingonthecommunitynursingworkforcewascarriedout.Longertermtrenddataisnotavailableasdatapriortothecompletionofthereview(forDecember2014andearlier)isnotcomparable.
Table 5: NHS Scotland nursing staff by selected community speciality, 2015
Mar 2015 Jun 2015 Sep 2015 Dec 2015
District nursing 3,478.2 3,461.5 3,494.2 3,503.6
Healthvisiting 1,889.8 1,874.0 1,899.4 1,902.7
Specialistnursing 1,227.4 1,250.9 1,235.8 1,247.6
Publichealthnursing 627.6 629.9 630.4 618.6
Schoolnursing 350.3 342.6 356.2 358.1Source:InformationServicesDivision,Scotland
110
105
100
95
90
85
802009 2010 2011 2012 2013 2014 2015
Registered nursing and midwifery staff
Non-registered nursing and midwifery staff

Unheeded warnings: health care in crisis The UK nursing labour market review 2016 22
4.3 NHS in Wales
Figure 16: Wales, qualified nursing and midwifery staff and nursing support staff (FTE), 2006-2015. Index change 2006=100
Source:StatsWales,WelshGovernment
Figure16showsthatthatnumberofqualifiednursingandmidwiferystaffhasrisengraduallyby6%from20,980(FTE)in2006to22,146in2015,whilethenursingsupportworkforcedroppedfrom6,920(FTE)in2006to6,313in2014(9%)beforerecoveringslightlyto6,537in2015.
110
105
100
95
90
85
802006 2007 2008 2009 2010 2011 2012 2013 2014 2015
Qualified nursing and midwifery staff
Nursing support staff

Unheeded warnings: health care in crisis The UK nursing labour market review 2016 23
Table 6: Nursing and midwifery staff (FTE) by work area (2011-2015)
2011 2012 2013 2014 2015 % change 2011-2015
Acute,elderlyandgeneral
15,839 15,913 15,937 15,891 16,181 2.2
Communityservices
3,478 3,536 3,695 3,808 3,915 12.6
Communitypsychiatry
1,256 1,325 1,339 1,337 1,376 9.6
Otherpsychiatry
3,141 3,075 3,064 3,036 2,951 -6.1
Maternityservices
1,700 1,655 1,658 1,649 1,650 -2.9
Paediatricnursing
1,033 1,040 1,033 1,084 1,128 9.2
Communitylearning disabilities
299 300 281 281 284 -5.0
Otherlearning disabilities
470 465 452 444 448 -4.7
Neonatalnursing
423 419 439 428 418 -0.9
Schoolnursing
211 220 207 222 222 5.3
Source:StatsWales.Nursingstaffbygradeandyear2011-2015
LookinginmoredetailatthenursingandmidwiferyworkforceinWalesbetween2011and2015,Table6showsanoveralldropinmaternityservices,paediatricnursingandlearningdisabilities.Thebiggestgrowthhasbeenseenincommunityservices.A10%increaseincommunitypsychiatrynurseshasbeenpartiallyoffsetbya6%fallinnursingnumbersinotherpsychiatrysettings.

Unheeded warnings: health care in crisis The UK nursing labour market review 2016 24
Figure 17: Nursing workforce (FTE) community nursing services, health visitors and district nurses (2006-2015). Index change: 2006 = 100
Source:StatsWales.Nursingstaffbyareaofworkandyear2006-2015
Figure18showsasimilarpicturetoEnglandinrelationtothetrendinqualifiednursesworkingincommunityservices;withanoverallincreaseinnumbersworkingincommunityservices(28%increaseinFTEnursingstaff).HoweverwhilethenumberofFTEhealthvisitorshasgrownby50%from582to896,thenumberofdistrictnurseshasfallenby42%overthesame10-yearperiod,from896in2006to522in2015.
1601501401301201101009080706050
2006 2007 2008 2009 2010 2011 2012 2013 2014 2015
All District nurseHealth visitor

Unheeded warnings: health care in crisis The UK nursing labour market review 2016 25
4.4 Health and social care in Northern Ireland
Figure 18: Qualified nursing and midwifery staff (FTE), unqualified nursing staff/nurse support staff (2006-2015). Index change: 2006=100
Source:DepartmentofHealth,SocialServicesandPublicSafety,NorthernIrelandHSCWorkforceCensus
UsingtheMarchWorkforceCensusdata,thequalifiednursingandmidwiferyworkforce(FTE)grewoverallbetween2006and2015,risingby7%,havingrecoveredfromadipinnumbersbetween2010and2011.
Thenursingsupportstaffworkforcepeakedin2008beforereachingalowof3,849in2012andthenrisingbackto4,019in2015.
Table 7: Northern Ireland, qualified nursing and midwifery staff (FTE) by work area (2011-2015)
2011 2012 2013 2014 2015 % change 2011-2015
Acutenurses 7,171 7,197 7,334 7,520 7,778 8.5
Mental health nurses 1,581 1,627 1,617 1,636 1,591 0.6
Midwifery 1,014 1,040 1,086 1,095 1,079 6.4
District nurses* 824 834 860 853 793 -3.8
Paediatricnurses 637 682 713 749 765 20.1
Healthvisitors** 438 427 458 461 491 12.1
Learningdisabilitynurses
437 421 417 428 404 -7.6
Source:DepartmentofHealth,SocialServicesandPublicSafety,NorthernIrelandHSCWorkforceCensus
*includescommunitystaffnursesworkingwithindistrictnursingservices
**includesstudenthealthvisitorsfrom2014onwards
110
108
106
104
102
100
98
96
94
92
Qualified nursing and midwifery staff Nurse support staff
2006 2007 2008 2009 2010 2011 2012 2013 2014 2015

Unheeded warnings: health care in crisis The UK nursing labour market review 2016 26
Table7providesthenumbersofqualifiednursingandmidwiferyworkforcebyworkareabetween2011and2015.ThenumberofFTEnursesworkinginacutesettingsroseby8.5%overthisperiodandtherewasalsogrowthinthenumberofpaediatricnurses(20%),healthvisitors(12%)andmidwives(6%).Therewassomegrowthinthenumberofmentalhealthnursesuntil2014,beforefallingbackalmostto2011levels.Therehasalsobeenadipinthenumberoflearningdisabilityanddistrictnursessince2011.
4.5 Nursing and age
ThefollowingfiguresprovideestimatesoftheageprofileofqualifiednursingstaffusingavailabledatafromNHSEngland,ScotlandandHealthandSocialCareNorthernIreland.DataisnotavilableforWales.Analysisofthefiguresshowsaprogressivelyageingworkforce.Comparisonsofdatafrom2006and2015highlighthowolderworkersformasubstantialandgrowingcomponentoftheworkforce in all countries.
Figure 19: NHS England, age profile, qualified nursing staff, September 2006 and September 2015 (headcount)
Source:NHSDigital
Figure19showstheshiftinageprofileamongthequalifiednursingworkforceinEnglandbetween2006and2015.Whileoverathird(38%)oftheworkforcewasaged45oroverin2010,thishasrisento48%in2015.
40
35
30
25
20
15
10
5
0
2006
Under 25 25-34 35-44 45-54 55-64 >65
%
2015Age
3.04.5
24.723.0
34.1
24.0
28.2
9.7
13.6
0.3 0.7
34.2

Unheeded warnings: health care in crisis The UK nursing labour market review 2016 27
Figure 20: Scotland, nursing and midwifery staff, September 2006 and 2015 (headcount)
Source: Information Services Division, Scotland
Figure 20 shows a similar age profile in the nursing workforce in Scotland to that in England. Two fifths (43%) of the nursing and midwifery workforce was aged over 45 in 2006, compared to over half (54%) in 2015.
Figure 21: Northern Ireland, qualified nursing, midwifery and health visiting staff by age, 2005 and 2015 (headcount)
Source: Department of Health, Social Services and Public Safety, Northern Ireland HSC Workforce Census
40
35
30
25
20
15
10
5
0
2006
Under 25 25-34 35-44 45-54 55-59 60+
%
2015Age
4.2 4.5
17.9 18.3
35.4
22.8
30.5
37.0
8.9
12.2
3.25.2
40
35
30
25
20
15
10
5
0
2006
Under 25 25-34 35-44 45-54 55-64 >65
%
2015Age
3.9 3.6
21.522.5
27.1
34.0
7.9
12.2
0.1 0.6
37.8
28.8
Unheeded warnings: health care in crisis The UK nursing labour market review 2016 28
Figure21showsthesharpchangeintheageprofileofthequalifiednursingworkforceinNorthernIrelandbetween2006and2015.In200663%ofqualifiednursingstaffwerebelowtheageof45,comparedwithjustoverhalf(53%)in2015.
DuetochangesintheNHSpensionschemeandgovernmentpolicy,theaverageretirementageofnurses has risen:
• thenormalNHSpensionagehasincreasedfrom60to65
• theNHSearlyretirementageincreasedfrom50to55
• theUKgovernmentabolishedthedefaultretirementageof65years
• thestatepensionageisduetoincreaseto66by2020,to67by2028andto68by2046.
Althoughthenumberofnursesapproachingretirement(55yearorolder)hasincreasedoverthepast10years,thenumberofactualretirementshasbeenflat,suggestinganincreasingnumberofnursesaredelayingtheirretirement.14
14 IndicativefiguresfromNHSDigitalshowingreasonsforleavingandstaffmovementsamongnursingstaffhasremainedstablebetween2011-15

Unheeded warnings: health care in crisis The UK nursing labour market review 2016 29
5. Nursing and earnings
5.1 Nursing staff
Section5looksataverageearningsgrowthfornursingstaffcomparedtootheremployeesintheUK,using official statistics.
Figure 22: Median weekly earnings for full-time employees compared to CPI and RPI inflation. Index: 2010=100
Source:OfficeforNationalStatistics.AnnualSurveyofHoursandEarningsandConsumerPriceInflationtimeseriesdataset
Figure22showsthegrowthinfull-timeweeklyearningsforallUKnursingstaffandallUKemployersbetween2010and2015,using2010figuresasthebase.Since2010,nominalweeklyearningsroseby3.5%fornursesand5.5%fornursingauxiliaries,comparedto5.9%forthewholepopulationworkingfulltime.Meanwhile,theRetailPricesIndex(RPI)hasrisenby19%andtheConsumerPricesindex(CPI)by15%.
Medianweeklyfull-timeearningsfornursingstaffstoodat£615in2015and£373fornursingauxiliariesandassistants.
125
120
115
110
105
100
95
CPIRPI All full-time
Nurses full-time
2010 2011 2012 2013 2014 2015
Nursing auxillaries and assistants part-time

Unheeded warnings: health care in crisis The UK nursing labour market review 2016 30
Figure 23: Real terms annual change for median weekly earnings (full-time employees)
Source:OfficeforNationalStatistics.AnnualSurveyofHoursandEarningsandConsumerPriceInflationtimeseriesdataset
Figure 24: Real terms annual change for median weekly earnings (part-time employees)
Source:OfficeforNationalStatistics.AnnualSurveyofHoursandEarningsandConsumerPriceInflationtimeseriesdataset
Figure23looksatyear-on-yearchangesinmedianweeklyearningssince2010,adjustingforRPIinflation.Itshowsthatineveryyearbetween2010and2015,realtermsmedianweeklyearningsgrowthhasbeenbelowzeroforallfull-timeemployeesintheUKeconomy.Amongfull-timenurses,therehasbeenacumulativerealtermsfallinweeklyearningsof13.9%anda9.9%cumulativerealtermsdropfornursingauxiliariesandassistants.
2
1
0
-1
-2
-3
-4
-5
-62010 2011 2012 2013 2014 2015
Nurses full-time All full-timeNursing auxiliaries and assistants full-time
%
4
2
0
-2
-4
-6
-8
-10
-12
%
Nurses part-time All part-timeNursing auxiliaries and assistants part-time
2010 2011 2012 2013 2014 2015

Unheeded warnings: health care in crisis The UK nursing labour market review 2016 31
Figure24showsrealtermsmedianweeklyearningsgrowthforpart-timeworkersbetween2010and2015.Part-timenursingauxiliariesandassistantshaveexperiencedacumulativerealtermsfallinearningsof16.2%,whileearningshavedroppedby18.2%forpart-timenurses.
Medianpart-timeearningsfornursingstaffstoodat£324in2015and£195fornursingauxiliariesandassistants.
5.2 NHS earnings
Thedatapresentedbelowshowtrendsinmedianearningsforqualifiednursing,midwiferyandhealthvisitorstaffinEnglandbetween2011and2016.ComparativedatafortheotherUKcountriesarenotavailable.
However,itmustbenotedthatduetodifferentapproachestakentopayawardsacrosstheUK,eachcountrynowhasitsownAgendaforChangepayscale.Forexample,anurseemployedonthefirstpointofAgendaforChangeBand5inNorthernIrelandhasastartingsalaryof£526lessthanacounterpartinScotland.
Thisdatashouldbeinterpretedagainstthebackgroundofpublicsectorpayconstraintsince2012.
• 2012:payfreezeforthoseearningabove£21,000peryear.
• 2013:1%consolidatedupliftforallstaffinUK.
• 2014:1%non-consolidatedupliftonlyforstaffatthetopoftheirpaybandinEnglandandNorthernIreland;aone-offpaymentof£187inWales;1%consolidatedupliftforallstaffinScotland.
• 2015:1%consolidatedupliftforthoseearninguptopoint42oftheAgendaforChangepayscale(£56,504)inEngland;1%consolidatedupliftforallAgendaforChangestaffinWalesandScotlandaswellastheLivingWage.
• 2016:1%consolidatedpayupliftforallstaff.
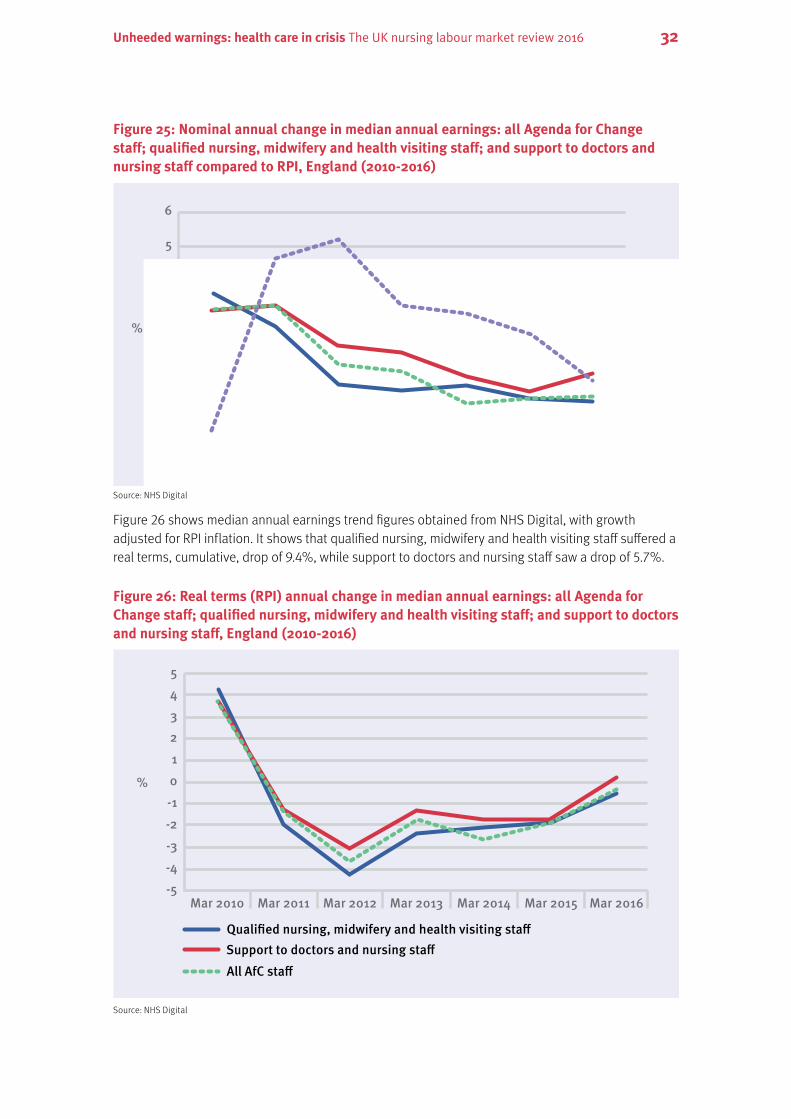
Figure26showsthatwhileRPIroseby18.9%between2010and2016,nominalearnings(nottakinginto account inflation) changed for the following staff groups:
• allstaffonAgendaforChangepaybands:10.3%
• qualifiednursing,midwiferyandhealthvisitingstaff:9.5%
• supporttodoctorsandnursingstaff:13.2%.
Unheeded warnings: health care in crisis The UK nursing labour market review 2016 32
Figure 25: Nominal annual change in median annual earnings: all Agenda for Change staff; qualified nursing, midwifery and health visiting staff; and support to doctors and nursing staff compared to RPI, England (2010-2016)
Source:NHSDigital
Figure26showsmedianannualearningstrendfiguresobtainedfromNHSDigital,withgrowthadjustedforRPIinflation.Itshowsthatqualifiednursing,midwiferyandhealthvisitingstaffsufferedarealterms,cumulative,dropof9.4%,whilesupporttodoctorsandnursingstaffsawadropof5.7%.
Figure 26: Real terms (RPI) annual change in median annual earnings: all Agenda for Change staff; qualified nursing, midwifery and health visiting staff; and support to doctors and nursing staff, England (2010-2016)
Source:NHSDigital
6
5
4
3
2
1
0
-1Mar 2010 Mar 2011 Mar 2012 Mar 2013 Mar 2014 Mar 2015 Mar 2016
%
Qualified nursing, midwifery and health visiting staff
All AfC staff RPISupport to doctors and nursing staff
543210-1-2-3-4-5
Mar 2010 Mar 2011 Mar 2012 Mar 2013 Mar 2014 Mar 2015 Mar 2016
%
Qualified nursing, midwifery and health visiting staff
All AfC staffSupport to doctors and nursing staff

Unheeded warnings: health care in crisis The UK nursing labour market review 2016 33
6. Nurse education and graduate earnings
This section looks at data and trends regarding the number of commissioned student places as well asdemandforandentrytonursingcoursesinhighereducationinstitutions(HEI).ThisdataiswidelyusedasanindicationofthefuturesupplyofqualifiednursesintotheUKworkforce.Ithasalsobeenrecentlyusedtoestimatethelikelydemandfornursingcoursespriortothedecisiontoreplacethecurrentsystemofgrantsandbursariesfornursingstudents,withthestandardsystemforothercoursescoveringbothlivingcostsandtuitionfeesinEngland.
The rationale for this change has been the search for cost savings, allied to the removal of what is seenasanartificialcaponstudentplaces,whichiscurrentlydeterminedbythefundingmadeavailablebyHealthEducationEngland.TheGovernmenthasestimatedthat10,000newnursingstudentplaceswillbecreatedby2020andpointtocurrentoversubscriptionasanindicationoffuturedemand for nursing courses.
This section also looks at the graduate wage premium to provide a perspective on the relative attraction of pursuing a nursing degree (along with the associated loans to cover tuition fees and livingcosts)comparedtoacareertakinganon-graduateroute.
6.1 Higher education
Figure27looksatthenumberofapplicationsandacceptancestoallcoursesinUKhighereducationinstitutionsbetween2011and2015andtherelationshipbetweenthetwofigures.In2015theacceptanceratereached74%.
Figure28looksatthenumberofapplicantsandacceptancesfornursingcoursesbetween2010and2014andshowsthatthetotalnumberofapplicantsroseby85%,whilethenumberofacceptancesroseby26%overtheperiod.Theacceptanceratehasremainedstableataround40%throughthisperiod.
WhilefiguresforHEIentryaregivenfortheUK,thenumberofplacescommissioned–whichisthekeydeterminantoffutureintaketoeducation–isundertakenseparatelybyeachUKcountry.

Unheeded warnings: health care in crisis The UK nursing labour market review 2016 34
Figure 27: Applicants for entry to all courses at higher education institutions in the UK (2011-15)
Source:UCASAnnualreferencetables
Figure 28: Applicants for entry to nursing courses at higher education institutions in the UK (2010-14)
Source:UCASAnnualreferencetables
Figure29showsthatthenumbersofstudentplacescommissionedinEnglandhavebeguntoriseagain,afterfallingto17,219in2012/13.Thereare20,003plannedplacesfor2015/16comparedto22,815in2003/4.
800,000700,000600,000500,000400,000300,000200,000100,000
0
Num
ber o
f app
lican
ts a
nd
acce
ptan
ces
Acceptance rate %
75
74
73
72
71
70
69
682011
700,160492,03070.3%
2012653,635464,910
71.1%
2013677,375495,59573.2%
2014699,685512,37073.2%
2015718,480532,300
74.1%
ApplicantsAcceptancesAcceptance rate
100,00090,00080,00070,00060,00050,00040,00030,00020,00010,000
0
Num
ber o
f app
lican
ts
and
acce
ptan
ces
Acceptance rate %
50454035302520151050
201061,14526,55543.4%
201162,00023,99038.7%
201260,57523,83039.3%
201362,51524,70039.5%
201466,46026,96540.6%
ApplicantsAcceptancesAcceptance rate

Unheeded warnings: health care in crisis The UK nursing labour market review 2016 35
Figure 29: England, number of nursing places commissioned (2005/6 to 2015/16)
Sources:ParliamentaryQuestion29November2013[179089]www.publications.parliament.uk/pa/cm201314/cmhansrd/cm131129/text/131129w0002.htm
HealthEducationEnglandDraft Workforce Plan for Englandhttp://hee.nhs.uk/wp-content/uploads/sites/321/2013/12/Workforce-plan-interactive1.pdf
Figure30showsthatstudentintakeplacesinScotlandfellbyaquarterbetween2005/6and2012/13,droppingfrom3,592to2,713.Numbershavebeguntoriseagainsince2013/14,with3,185placesplannedfor2014/15.
25,000
20,000
15,000
10,000
5,000
0
2005/06
2006/07
2007/08
2008/09
2009/10
2010/11
20011/12
20012/13
20013/14
20014/15
20015/16
Com
mis
sion
ed p
lace
s
Entry year

Unheeded warnings: health care in crisis The UK nursing labour market review 2016 36
Figure 30: Scotland, nursing and midwifery student intakes (2003/04 to 2014/15)
Source:InformationServicesDivision,Scotland
Figure31showsafallof27%incommissionedplacesbetween2005/6and2012/13inWales,droppingfrom1,260to919.In2016/17,thereare1,418placesplanned,representinga54%increasefrom2012/13.In2015/163038placeswereplanned.
Figure 31: Wales, number of nursing places commissioned, 2004/5 to 2014/5 and places planned for 2016/17
Source:HealthandSocialServices,WelshGovernment
4,000
3,500
3,000
2,500
2,000
1,500
1,000
500
0
2004/05
2005/06
2006/07
2007/08
2008/09
2009/10
20010/11
20011/12
20012/13
20013/14
20014/15
Inta
kes
Entry year
1,600
1,400
1,200
1,000
800
600
400
200
0
2005/06
2006/07
2007/08
2008/09
2009/10
20010/11
20011/12
20012/13
20013/14
20014/15
20015/16
20016/17
Com
mis
sion
ed p
lace
s
Entry year

Unheeded warnings: health care in crisis The UK nursing labour market review 2016 37
Figure33showsafallof20%inthenumberofcommissionedplacesinNorthernIrelandbetween2008/9and2015/16,droppingfrom792to645.Anincreaseof100placeswasplannedfor2016/17.
Figure 32: Northern Ireland, number of nursing places commissioned, 2008/9 to 2016/17
Source:A Workforce Plan for Nursing and Midwifery in Northern Ireland(2015-2025)15
6.2 Graduate earnings
AnalysisbytheInstituteforFiscalStudies(IFS)showsthatgraduatesintheUKeconomycurrentlyenjoysignificantlyhigherwagesthanthosewithoutadegree,despitetherapidriseinthenumberofpeople with degrees over the past three decades.16However,IFSresearcherspredictthatfuturegraduatesacrossalloccupationsarelikelytobenefitlessandthathence,webelievefutureincreasesintheproportionofgraduatesintheUKwilltendtoreducegraduates’relativewages.
Theiranalysisshownbelowillustratesthatgraduatesintheirlatethirtiesearnabout1.6timesasmuchperhourasthosewholeftschoolat16andthisratiohasremainedroughlythesameforthepast30years.
Between2008and2013,realtermsmedianhourlyearningsofgraduatesfellbynearly20%. Non-graduatessawsimilarfalls,thusmaintainingthegapbetweenthetwogroups.
Thedatapresentedbelowshowtrendsinmedianearningsforqualifiednursing,midwiferyandhealthvisitorstaffinEnglandbetween2011and2016.ComparativedatafortheotherUKcountriesarenotavailable.
However,itmustbenotedthatduetodifferentapproachestakentopayawardsacrosstheUK,eachcountrynowhasitsownAgendaforChangepayscale.Forexample,anurseemployedonthefirstpointofAgendaforChangeBand5inNorthernIrelandhasastartingsalaryof£526lessthanacounterpartinScotlandand£217lessthaninEnglandorWales.
15 www.health-ni.gov.uk/sites/default/files/publications/health/workforce-plan-nursing-midwifery-2015-2025.pdf
16 www.ifs.org.uk/publications/8409
850
800
750
700
650
600
2008/09
2009/10
20010/11
20011/12
20012/13
20013/14
20014/15
20015/16
20016/17
Com
mis
sion
ed p
lace
s
Entry year

Unheeded warnings: health care in crisis The UK nursing labour market review 2016 38
Figure 33: Median real hourly wage of 25- to 29-year-olds, by educationSource:InstituteforFiscalStudies:Thepuzzleofgraduatewages
IFSresearchershaveconcludedthatthemainreasontheincreaseingraduatenumbershasnotdrivendownthepremiumis‘becausefirmshaveusedtheincreasedsupplyofhighlyeducatedworkerstoswitchtoadifferent,lesshierarchicalandmoredecentralisedmanagementstructure.’Organisationshavechangedthewaytheyworktomakebetteruseofthemorehighlyskilledemployeesavailable.
Asnursingisagraduateprofession,thekeyquestionisnotwhethernursinggraduatesearnmorethannursingnon-graduates,butwhetherthefuturegainsfromobtainingandself-fundingadegreeare worthwhile in comparison to other career options.
15141312111098765
Degrees or above Below GCSEsGCSEs or above, no degrees
£ pe
r hou
r
1993
1994
1995
1996
1997
1998
1999
2000
2001
2002
2003
2004
2005
2006
2007
2008
2009
2010
2011
2012
2013
2014
2015

TheRCNrepresentsnursesandnursing,promotesexcellenceinpracticeand shapes health policies
October2016
RCNOnline www.rcn.org.uk
RCNDirect www.rcn.org.uk/direct 03457726100
PublishedbytheRoyalCollegeofNursing 20CavendishSquare London W1G0RN
02074093333
Publicationcode:005779R
CN
LA
BO
UR
MA
RK
ET
RE
VIE
W