the two main market forces: demand and … two main market forces: demand and supply instructor:...
TRANSCRIPT

THE TWO MAIN MARKET FORCES:
DEMAND AND SUPPLY
Instructor: Ghislain Nono Gueye
1
The concept of demand
• You demand a good/service when you:
- Want it
- Can afford it
- Plan to buy it
• You are not demanding if you think: “I would love to buy it if only it were less expensive!”
2
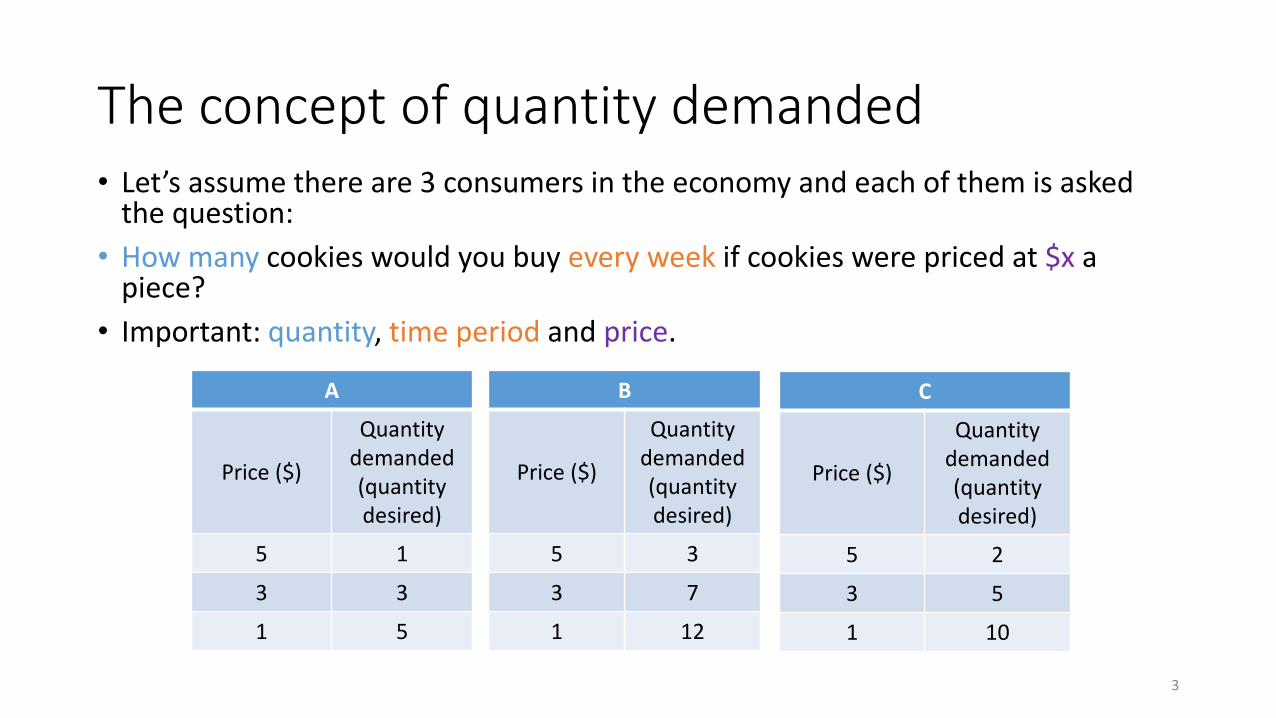
The concept of quantity demanded• Let’s assume there are 3 consumers in the economy and each of them is asked
the question:
• How many cookies would you buy every week if cookies were priced at $x a piece?
• Important: quantity, time period and price.
A
Price ($)
Quantitydemanded(quantity desired)
5 1
3 3
1 5
B
Price ($)
Quantitydemanded(quantity desired)
5 3
3 7
1 12
C
Price ($)
Quantitydemanded(quantity desired)
5 2
3 5
1 10
3
The concept of quantity demanded (2)
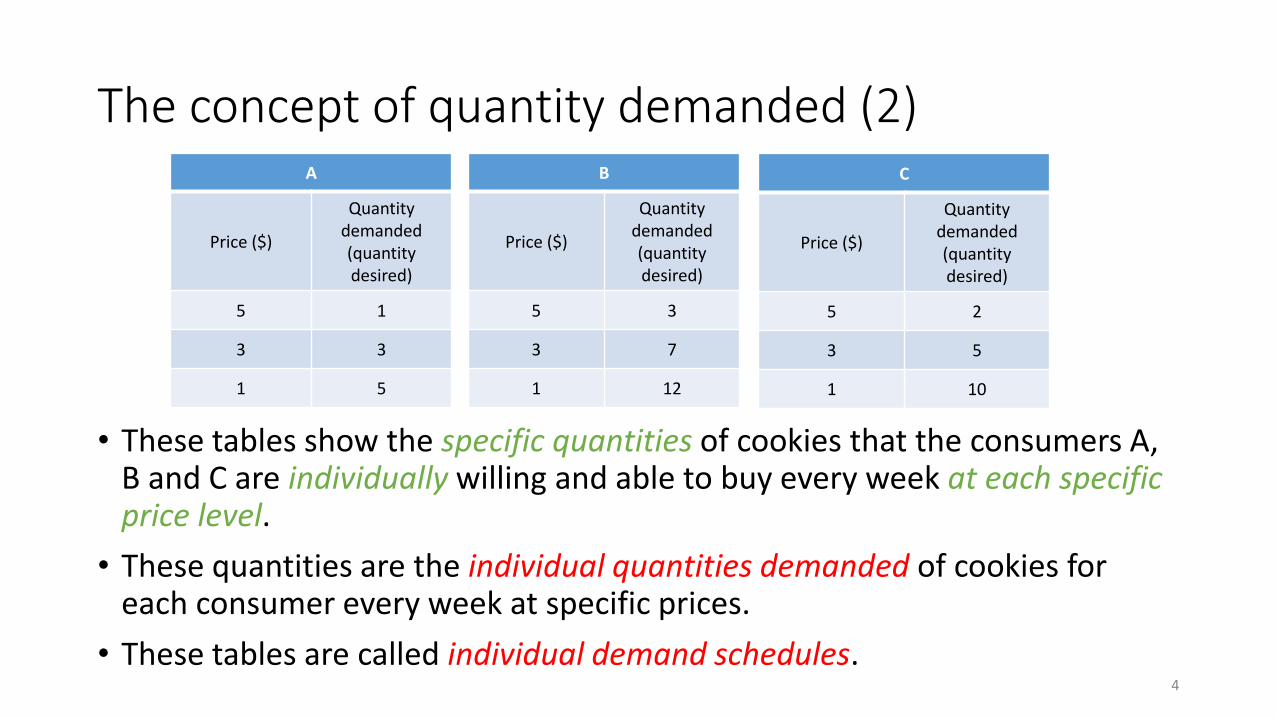
• These tables show the specific quantities of cookies that the consumers A, B and C are individually willing and able to buy every week at each specific price level.
• These quantities are the individual quantities demanded of cookies for each consumer every week at specific prices.
• These tables are called individual demand schedules.
A
Price ($)
Quantitydemanded(quantitydesired)
5 1
3 3
1 5
B
Price ($)
Quantitydemanded (quantity desired)
5 3
3 7
1 12
C
Price ($)
Quantitydemanded (quantity desired)
5 2
3 5
1 10
4
The concept of quantity demanded (3)
A
Price ($)
Quantity demanded(quantity desired)
5 1
3 3
1 5
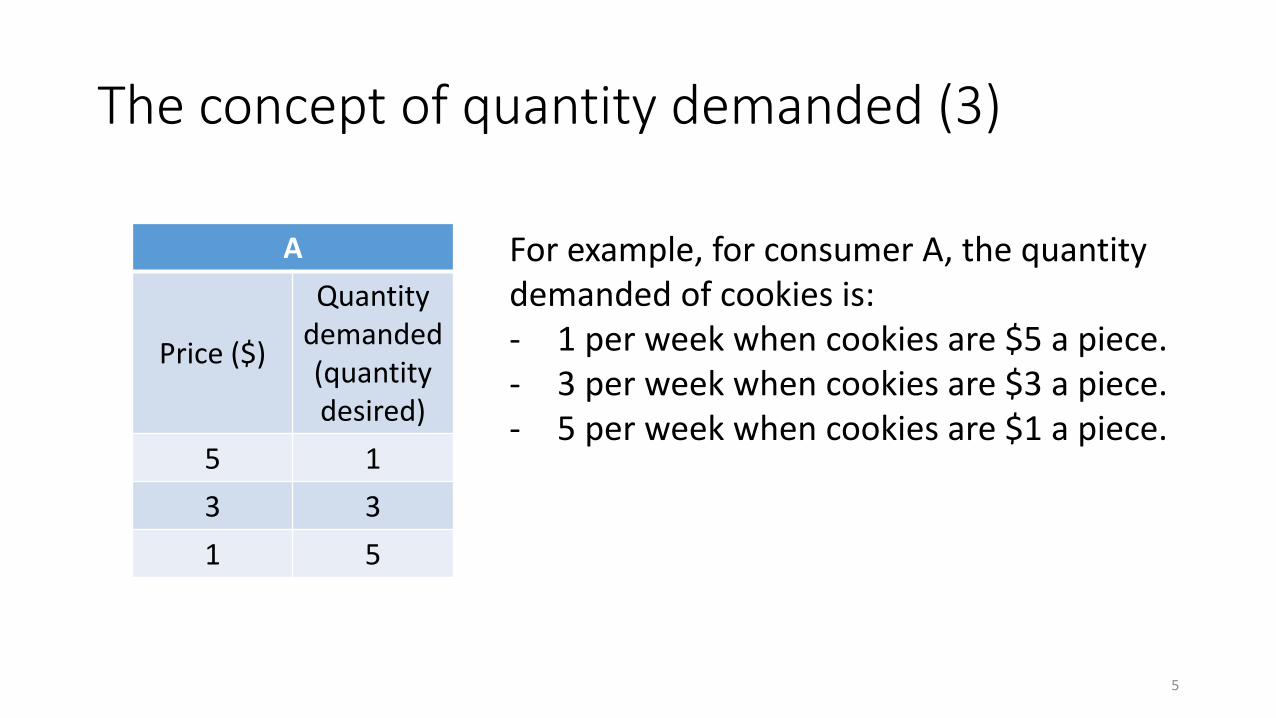
For example, for consumer A, the quantity demanded of cookies is:- 1 per week when cookies are $5 a piece.- 3 per week when cookies are $3 a piece.- 5 per week when cookies are $1 a piece.
5
The concept of quantity demanded (4)
Price (in $) Consumer
Quantitydemanded (quantity desired)
Total quantity
demanded(desired)
5
A 1
6B 3
C 2
3
A 3
15B 7
C 5
1
A 5
27B 12
C 10
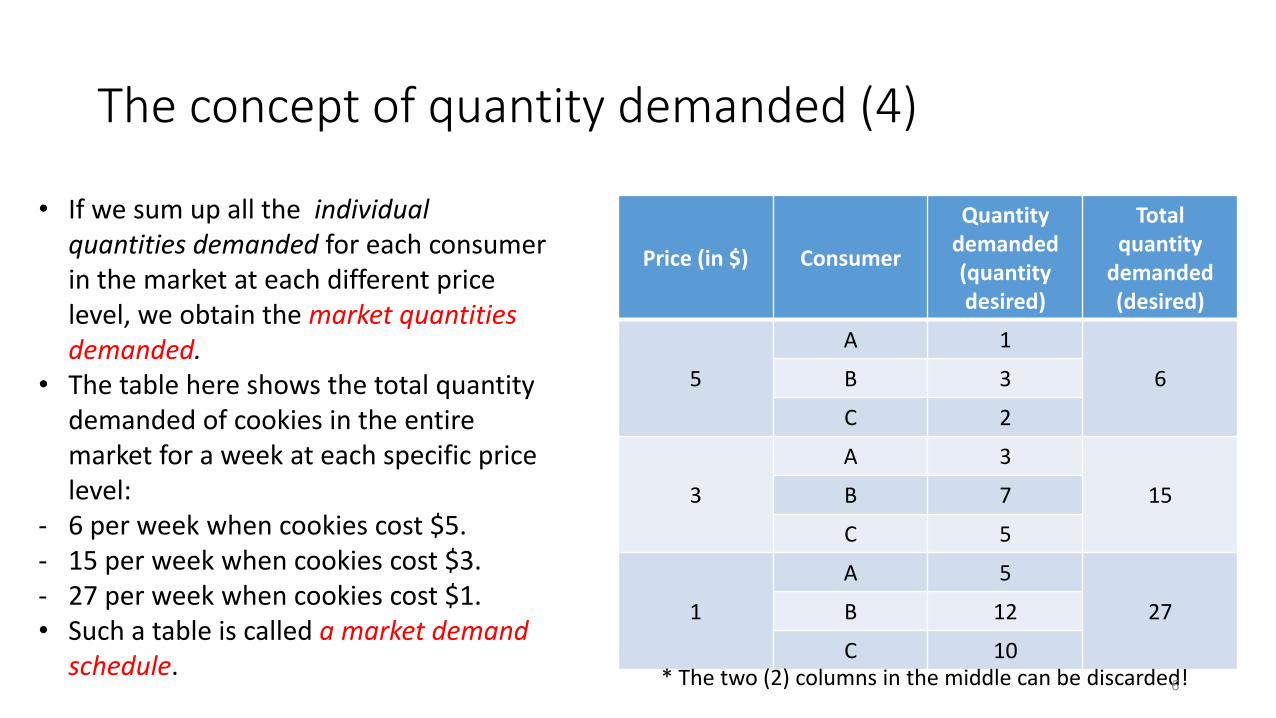
• If we sum up all the individual quantities demanded for each consumer in the market at each different price level, we obtain the market quantities demanded.
• The table here shows the total quantity demanded of cookies in the entire market for a week at each specific price level:
- 6 per week when cookies cost $5.- 15 per week when cookies cost $3.- 27 per week when cookies cost $1.• Such a table is called a market demand
schedule. * The two (2) columns in the middle can be discarded!6
Quantity demanded defined
• The individual quantity demanded of a good is the specific quantity of a good that a consumer is willing and able to buy during a time period at a specific price, ceteris paribus.
• The market quantity demanded for a good is the sum of all the individual quantities demanded of all the consumers in the market. In other words, it is the sum of all the quantities of a good/service that each consumer in the market is willing and able to buy during a time period at a specific price level, ceteris paribus.
• We usually refer to “market quantity demanded” whenever we say “quantity demanded”.
7
The two types of demand defined: Individual demand
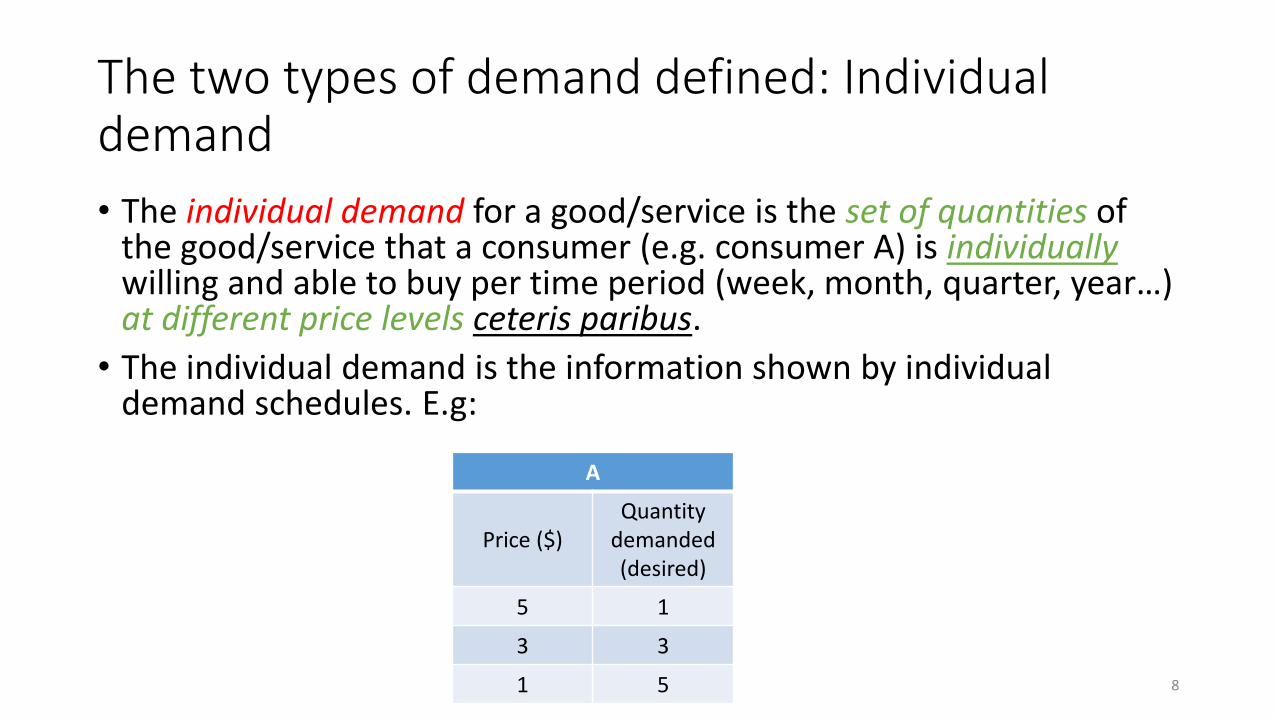
• The individual demand for a good/service is the set of quantities of the good/service that a consumer (e.g. consumer A) is individuallywilling and able to buy per time period (week, month, quarter, year…) at different price levels ceteris paribus.
• The individual demand is the information shown by individual demand schedules. E.g:
A
Price ($)Quantity
demanded(desired)
5 1
3 3
1 5 8
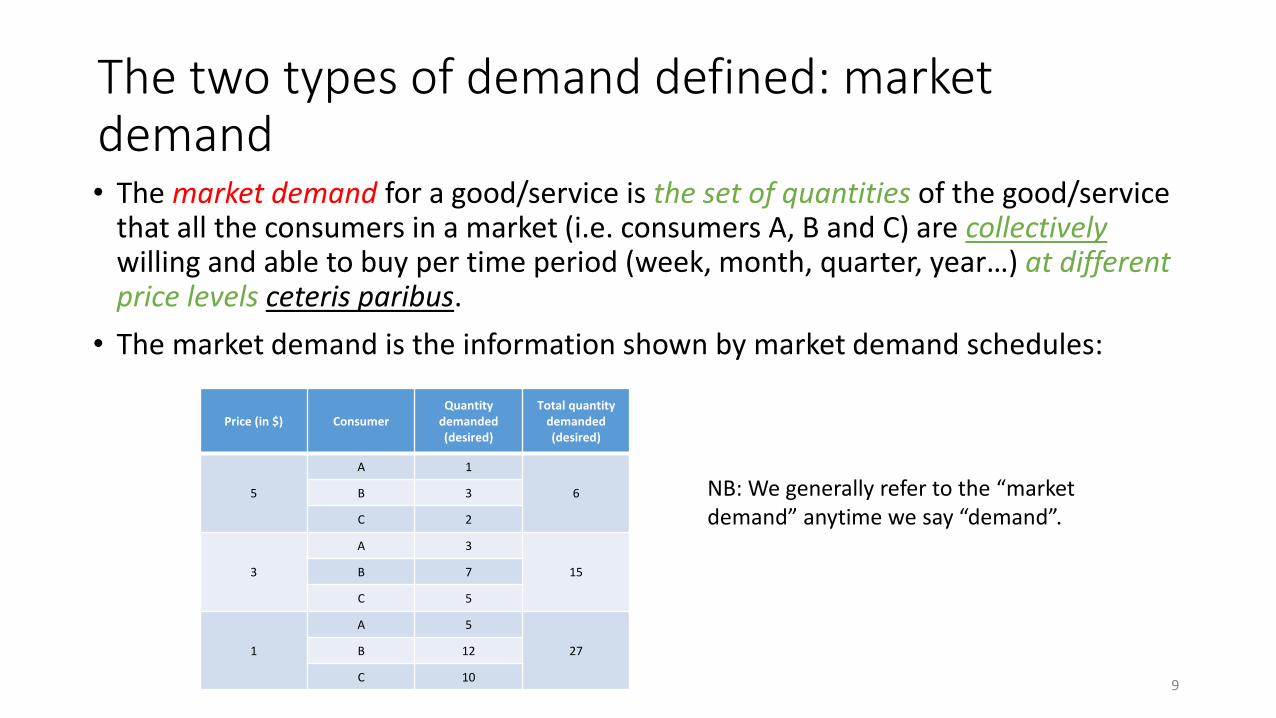
The two types of demand defined: market demand• The market demand for a good/service is the set of quantities of the good/service
that all the consumers in a market (i.e. consumers A, B and C) are collectivelywilling and able to buy per time period (week, month, quarter, year…) at different price levels ceteris paribus.
• The market demand is the information shown by market demand schedules:
Price (in $) ConsumerQuantity
demanded (desired)
Total quantitydemanded (desired)
5
A 1
6B 3
C 2
3
A 3
15B 7
C 5
1
A 5
27B 12
C 10
NB: We generally refer to the “market demand” anytime we say “demand”.
9
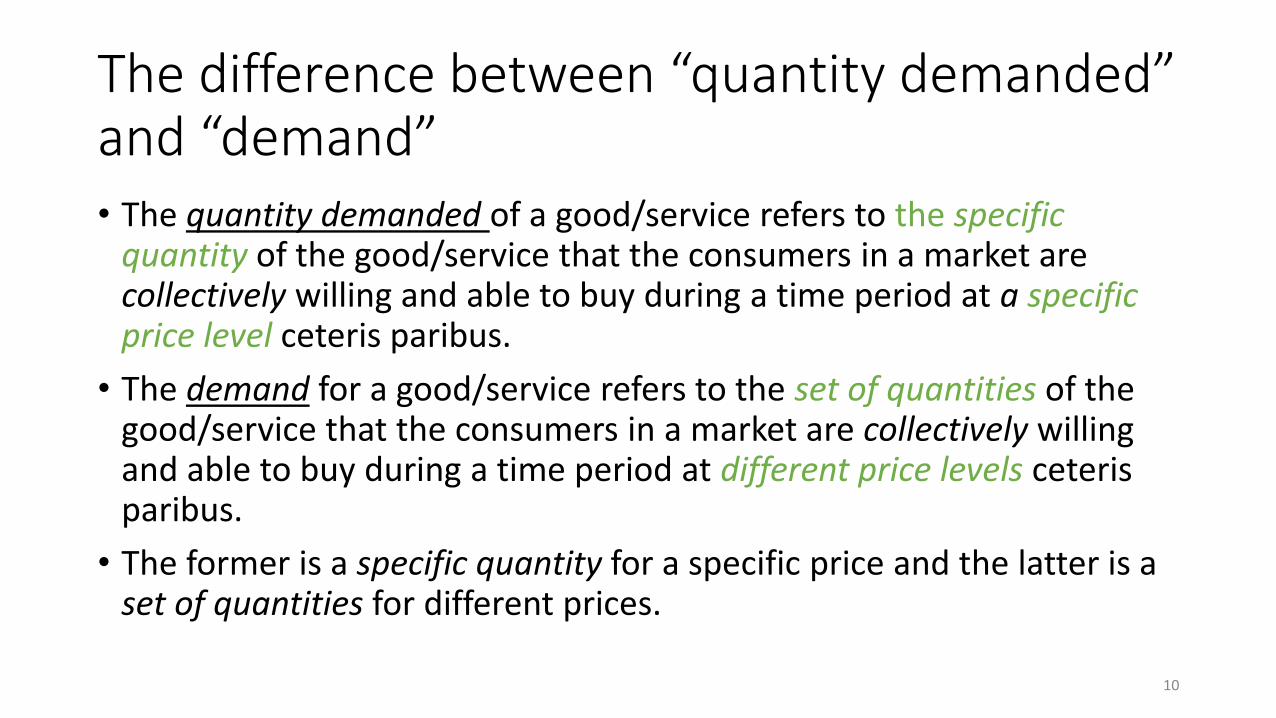
The difference between “quantity demanded” and “demand”• The quantity demanded of a good/service refers to the specific
quantity of the good/service that the consumers in a market are collectively willing and able to buy during a time period at a specific price level ceteris paribus.
• The demand for a good/service refers to the set of quantities of the good/service that the consumers in a market are collectively willing and able to buy during a time period at different price levels ceteris paribus.
• The former is a specific quantity for a specific price and the latter is a set of quantities for different prices.
10
Graphical illustration
• We can plot individual demand schedules as well as market demand schedules.
• What we obtain is the individual/market demand curve.
• We generally refer to the market demand curve anytime we say “demand curve”.
• Prices are on the vertical axis (the y-axis) and quantities demanded are on the horizontal axis (the x-axis).
11

Plotting individual demand curves
0
1
2
3
4
5
6
0 1 2 3 4 5 6
Pri
ce
Quantity demanded
Demand curve for consumer A • Individual demand curves slope downward (they have a negative slope).
• The negative slope of individual demand curves reflects the negative relationship between relative price and individual quantities demanded.
• A negative relationship between two variables means that when one increases, the other one decreases. 12

Plotting market demand curves
0
1
2
3
4
5
6
0 5 10 15 20 25 30
Pri
ce
Quantity demanded
Market demand curve • Market demand curves also slope downward.
• The negative slope of market demand curves reflects the negative relationship between relative price and market quantities demanded.
13

The Law of Demand
• Ceteris paribus, a fall in the relative price of a good/service induces a rise in the quantity demanded.
• Similarly, ceteris paribus, a rise in the relative price of a good/service induces a fall in the quantity demanded.
14
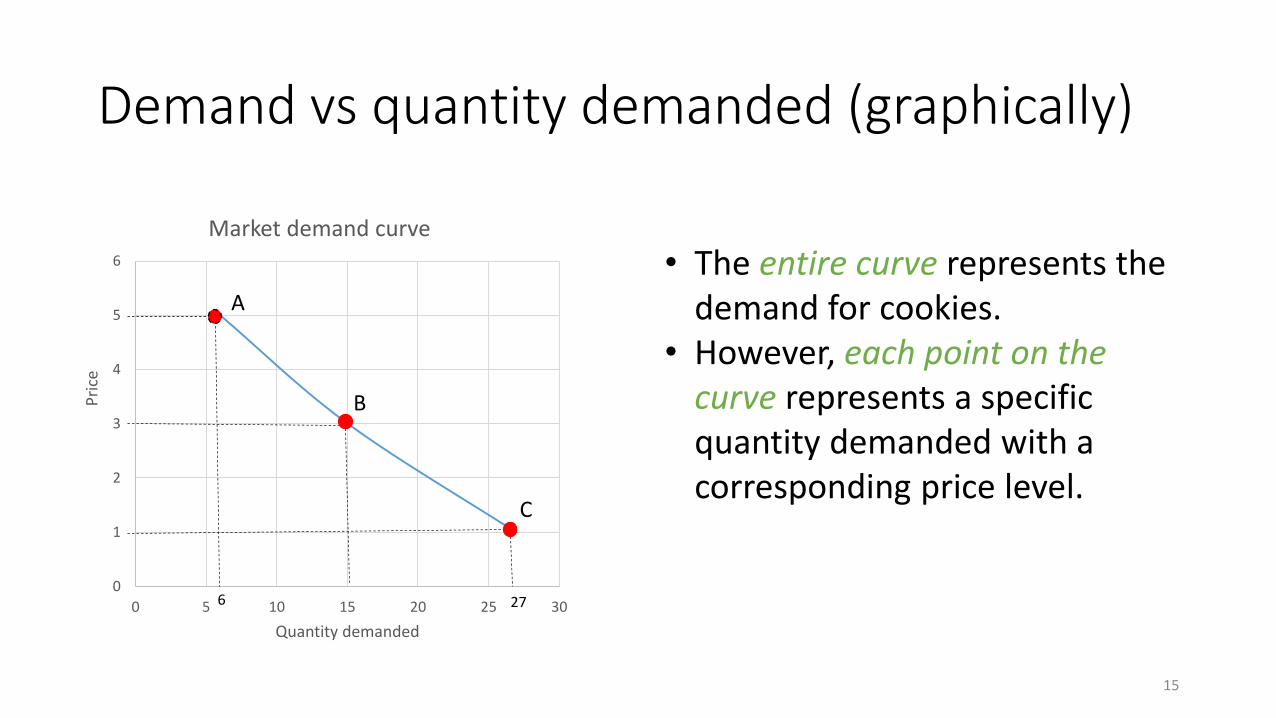
Demand vs quantity demanded (graphically)
0
1
2
3
4
5
6
0 5 10 15 20 25 30
Pri
ce
Quantity demanded
Market demand curve
A
B
C
6 27
• The entire curve represents the demand for cookies.
• However, each point on the curve represents a specific quantity demanded with a corresponding price level.
15
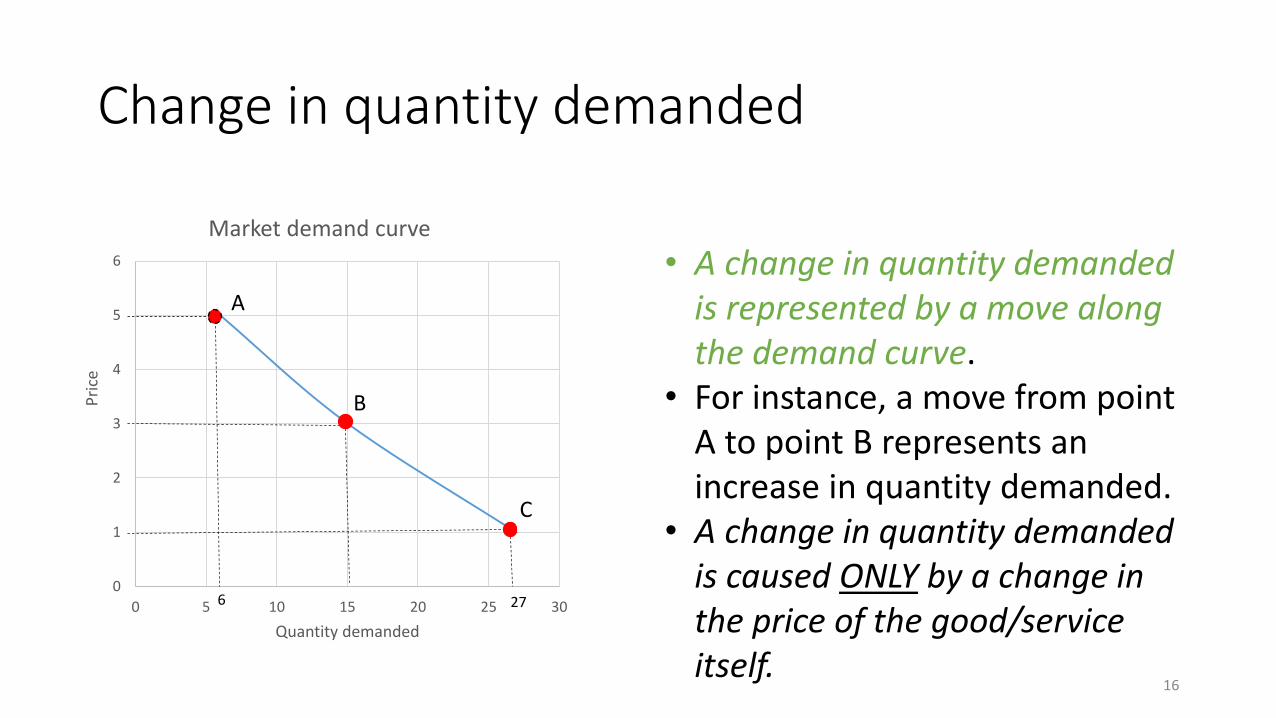
Change in quantity demanded
0
1
2
3
4
5
6
0 5 10 15 20 25 30
Pri
ce
Quantity demanded
Market demand curve
A
B
C
6 27
• A change in quantity demanded is represented by a move along the demand curve.
• For instance, a move from point A to point B represents an increase in quantity demanded.
• A change in quantity demanded is caused ONLY by a change in the price of the good/service itself.
16
Change in quantity demanded (2)
0
1
2
3
4
5
6
0 5 10 15 20 25 30
Pri
ce
Quantity demanded
Market demand curve
A
B
C
6 27
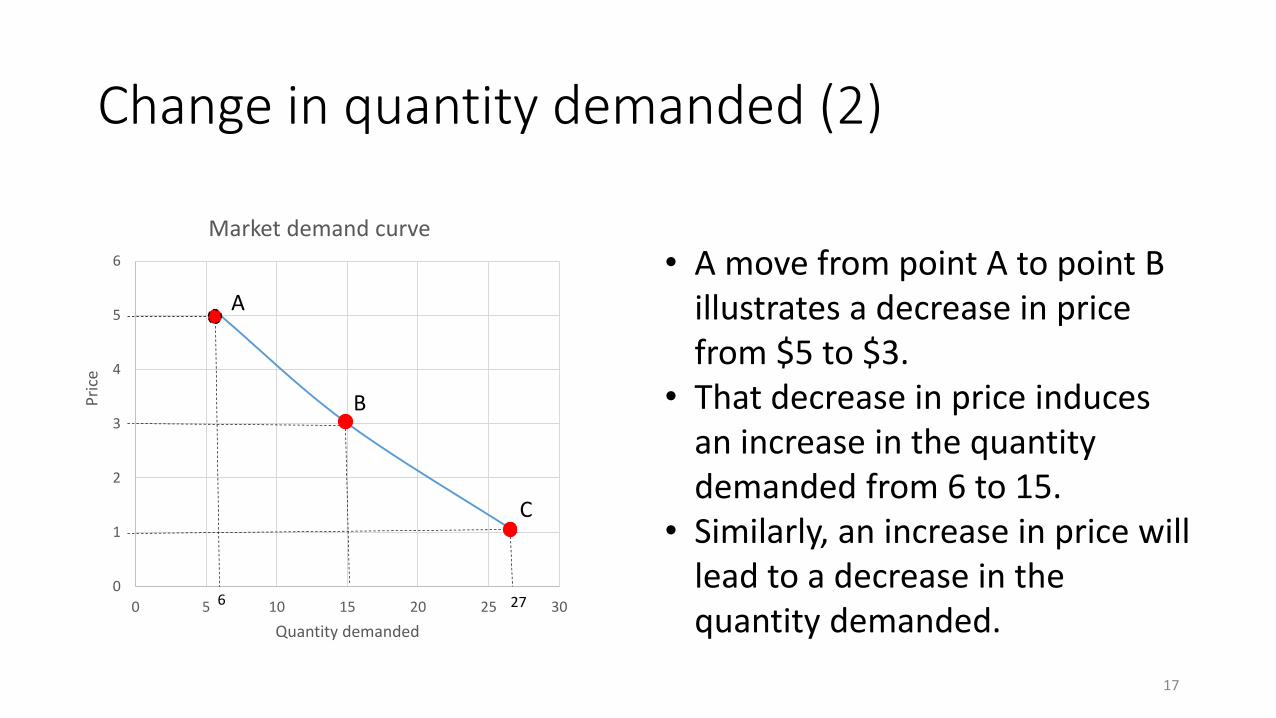
• A move from point A to point B illustrates a decrease in price from $5 to $3.
• That decrease in price induces an increase in the quantity demanded from 6 to 15.
• Similarly, an increase in price will lead to a decrease in the quantity demanded.
17
Change in demand
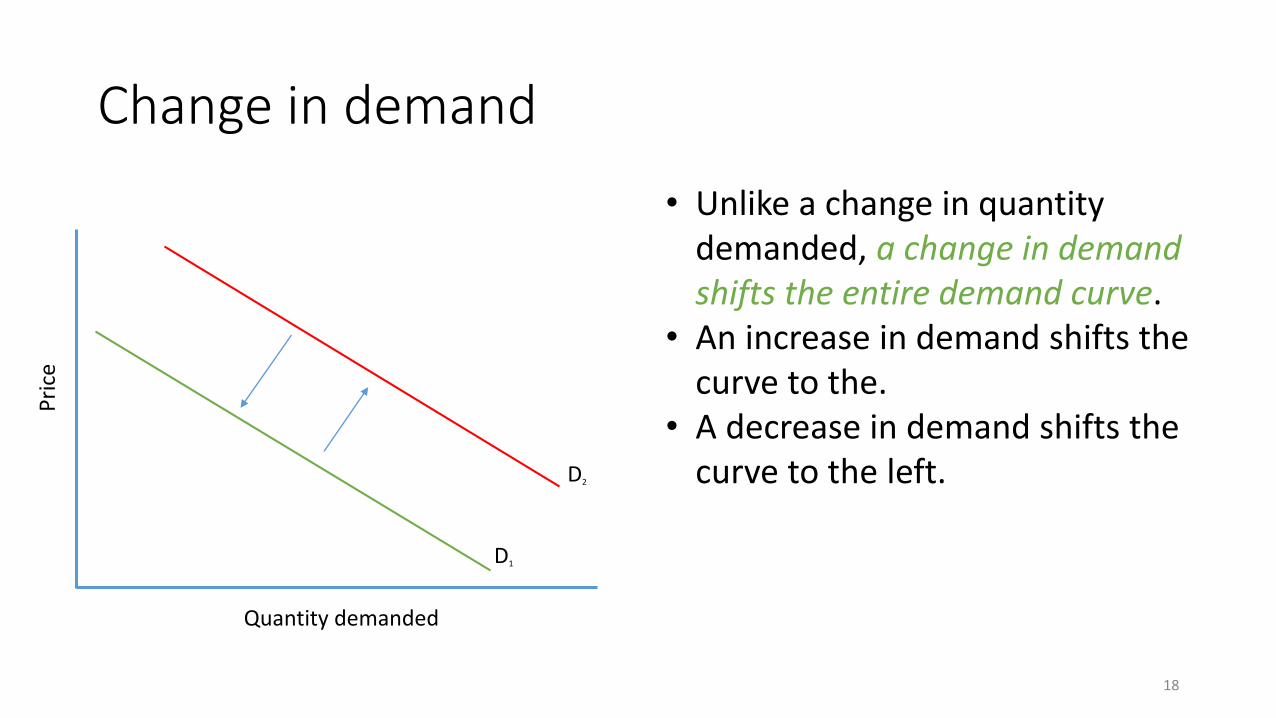
• Unlike a change in quantity demanded, a change in demand shifts the entire demand curve.
• An increase in demand shifts the curve to the.
• A decrease in demand shifts the curve to the left.
Quantity demanded
Pri
ce
D1
D2
18

Factors that change demand
• Many factors may change the demand for a good. Following are six (6) of them:
- The prices of related goods
- Expected future prices
- Income
- Natural factors
- Market size
- Tastes and preferences
19
1- The prices of related goods
• There are two types of related goods:
- Complements: Goods that are complements cannot be consumed separately. They cannot be consumed independently.
E.g. a toothbrush and a toothpaste, bread and butter, milk and cereals…
- Substitutes: Goods that are substitutes are very similar. You may consume one in place of the other.
E.g. Coca Cola or Pepsi, a Dell or an HP laptop, an HTC or a Samsung phone…
20

1- The prices of related goods (2)
• The demand for good X changes when the price of a related good Y changes.
Type of relationChange in price of related
good YChange in demand of good X
Complements
Increase Decrease in demand
Decrease Increase in demand
Substitutes
Increase Increase in demand
Decrease Decrease in demand
21

1- The prices of related goods (3)
• Bread and butter are complements. When the price of bread decreases, the quantity demanded of bread will increase ceteris paribus (that’s the law of demand).
• In other words, consumers of bread will buy more bread when bread gets cheaper.
• Since more bread requires more butter, all things held constant, the demand for butter will increase.
• Consequently, the demand curve for butter will shift to the right.
22

1- The prices of related goods (4)
• Gatorade and Powerade are substitutes. When the price of Gatorade increases, the quantity demanded of Gatorade falls ceteris paribus (again, that’s the law of demand).
• The consumers of Gatorade buy less of it when it gets more expensive.
• Since Powerade is a very good alternative, all things being held constant, many consumers of Gatorade will switch to it and the demand for Powerade will increase.
• Consequently, the demand curve for Powerade will shift to the right.
23

2- Expected future prices
• When the price of a good (that can be stored) is expected to change in the future, the demand for the good changes.
• For instance, if the price of cream corn is expected to rise, all the consumers of cream corn will stock up on cream corn cans now so they don’t have to spend more money when the price is up.
• The demand for cream corn will increase ceteris paribus and, therefore, shift the demand curve for cream corn to the right.
• When prices are expected to increase, the demand increases.
• When prices are expected to decrease, the demand falls.
24

3- Income
• When income increases, the demand for most goods increases.
• However, the demand for some goods does not increase with income; it decreases instead.
• A good whose demand increases with more income is called a normal good. (E.g. electronic gadgets, textbooks, …)
• A good whose demand decreases with more income is called an inferior good. (E.g. fast food, thrift store items, …)
25
4- Natural factors
• Natural factors may affect the demand for a good.
• For example, it is very cold in the winter and no one is really interested in ice creams. The demand for ice creams falls during the winter.
• After a hurricane, many buildings need repairs and some structures even need to be rebuilt. The demand for construction materials increases.
26
5- Market size
• The size of the market for a good (especially the number of buyers of the good) affects the demand for the good.
• This is the main purpose of adverts. They aim at attracting more buyers of a good in order to increase its demand.
• So good advertisement increases the number of buyers of a good, which increases the demand for the good (rightward shift in the demand curve).
• Propaganda about a good may decrease the number of buyers and therefore decrease the demand for the good (leftward shift in the demand curve).
27
6- Tastes and preferences
• The taste or the preference of a consumer for a good determines how much value he/she places in the good.
• A change in the taste/preference of the consumers of a good will change the demand for the good.
• If the consumers of a good have more taste for the good, the demand for the good will increase (and the demand curve of the good will shift to the right).
• If the consumers of a good have less taste for the good, the demand for the good will decrease (and the demand curve of the good will shift to the left).
28
The concept of supply
• You supply a good/service when you:
- Have the resources and technology to produce it
- Can profit from producing it
- Plans to produce and sell it
• To have the resources and technology to produce a good or offer a service is not enough.
• Doing so has to be profitable.
29
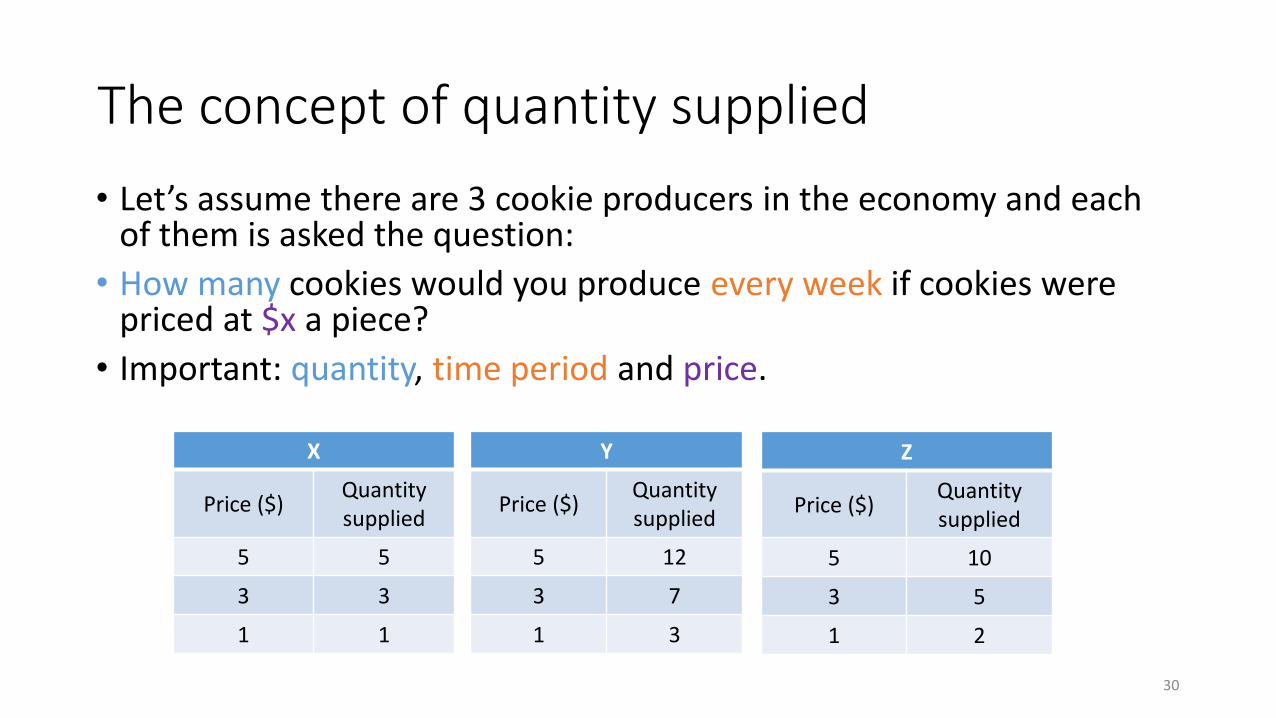
The concept of quantity supplied
• Let’s assume there are 3 cookie producers in the economy and each of them is asked the question:
• How many cookies would you produce every week if cookies were priced at $x a piece?
• Important: quantity, time period and price.
X
Price ($)Quantitysupplied
5 5
3 3
1 1
Y
Price ($)Quantitysupplied
5 12
3 7
1 3
Z
Price ($)Quantitysupplied
5 10
3 5
1 2
30

The concept of quantity supplied (2)
• These tables show the specific quantities of cookies that the producers X, Y and Z are individually willing and able to produce and sell every week at each specific price level.
• These quantities are the individual quantities supplies of cookies by each producer every week at specific prices.
• These tables are called individual supply schedules.
X
Price ($)Quantitysupplied
5 5
3 3
1 1
Y
Price ($)Quantitysupplied
5 12
3 7
1 3
Z
Price ($)Quantitysupplied
5 10
3 5
1 2
31

The concept of quantity supplied (3)
Y
Price ($)Quantitysupplied
5 12
3 7
1 3
For example, for producer Y, the quantity supplied of cookies is:- 12 per week when cookies are $5 a piece.- 7 per week when cookies are $3 a piece.- 3 per week when cookies are $1 a piece.
32
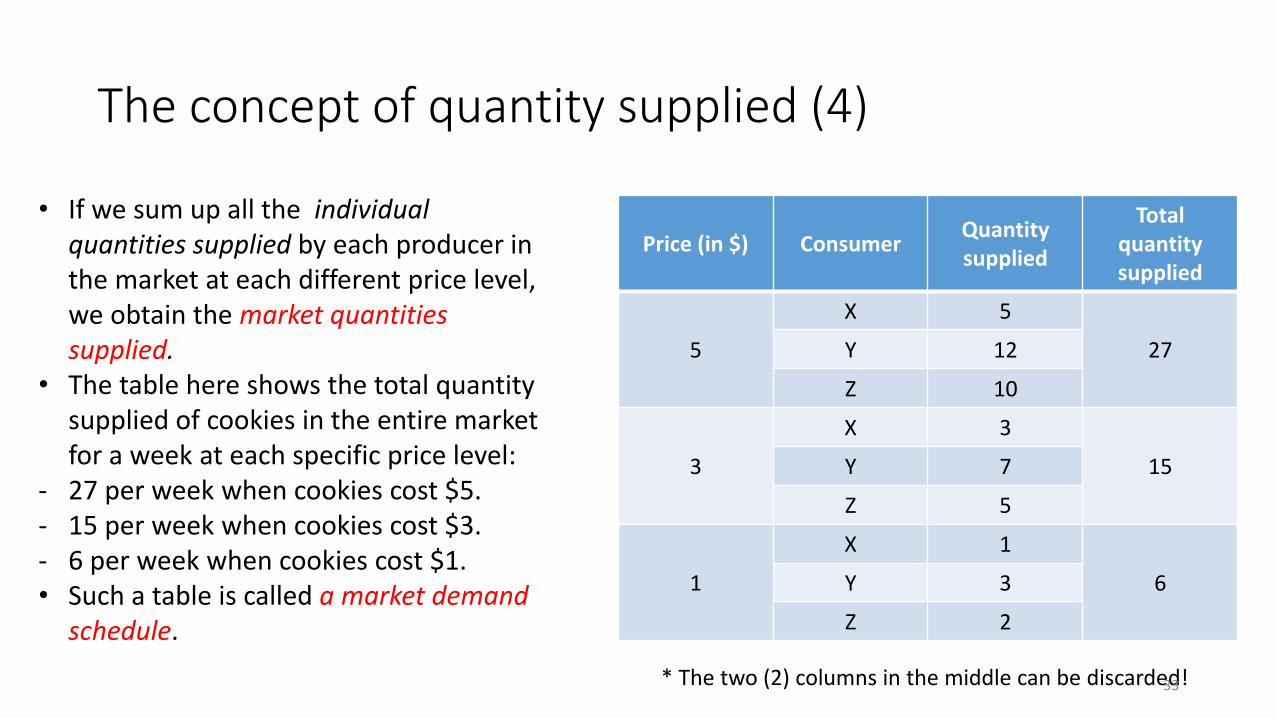
The concept of quantity supplied (4)
Price (in $) ConsumerQuantitysupplied
Total quantitysupplied
5
X 5
27Y 12
Z 10
3
X 3
15Y 7
Z 5
1
X 1
6Y 3
Z 2
• If we sum up all the individual quantities supplied by each producer in the market at each different price level, we obtain the market quantities supplied.
• The table here shows the total quantity supplied of cookies in the entire market for a week at each specific price level:
- 27 per week when cookies cost $5.- 15 per week when cookies cost $3.- 6 per week when cookies cost $1.• Such a table is called a market demand
schedule.
* The two (2) columns in the middle can be discarded!33
Quantity supplied defined
• The individual quantity supplied of a good is the specific quantity of a good that a producer is willing and able to produce and sell during a time period at a specific price, ceteris paribus.
• The market quantity supplied for a good is the sum of all the individual quantities supplied by all the producers in the market. In other words, it is the sum of all the quantities of a good that each producer in the market is willing and able to produce and sell during a time period at a specific price level, ceteris paribus.
• We usually refer to “market quantity supplied” whenever we say “quantity supplied”.
34
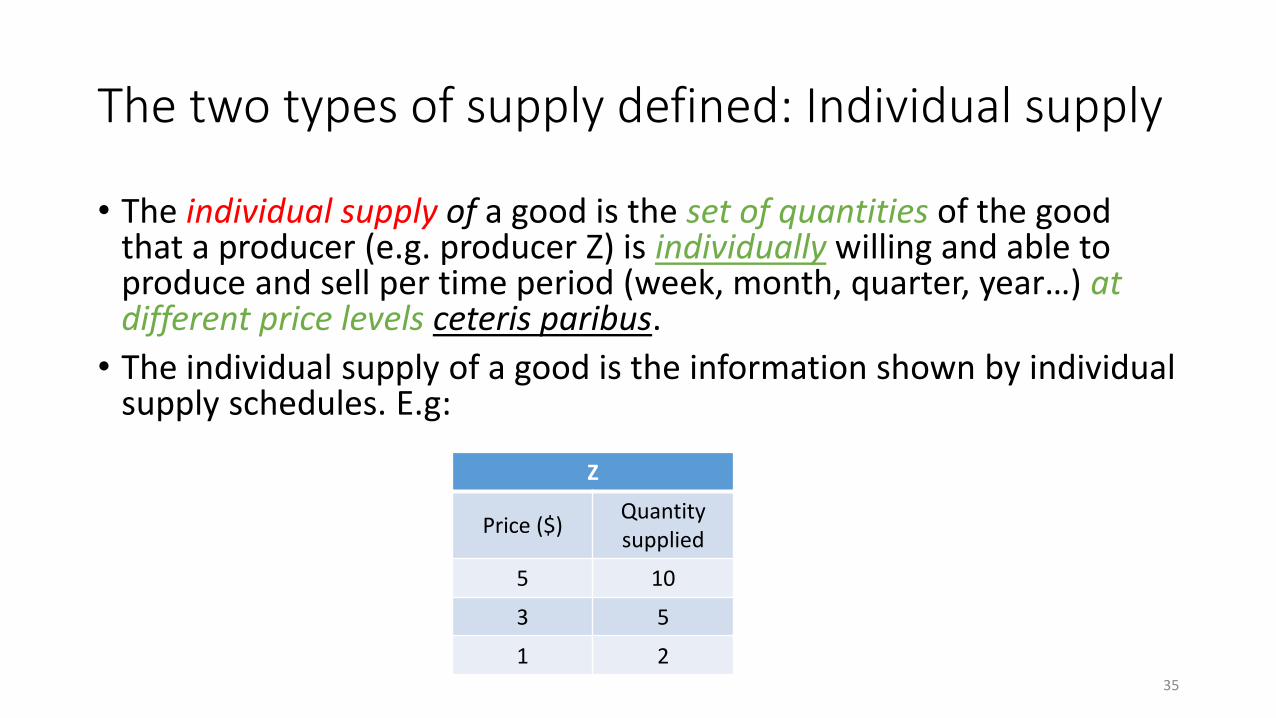
The two types of supply defined: Individual supply
• The individual supply of a good is the set of quantities of the good that a producer (e.g. producer Z) is individually willing and able to produce and sell per time period (week, month, quarter, year…) at different price levels ceteris paribus.
• The individual supply of a good is the information shown by individual supply schedules. E.g:
Z
Price ($)Quantitysupplied
5 10
3 5
1 235

The two types of supply defined: market supply
• The market supply of a good is the set of quantities of the good that all the producers in a market (i.e. producers X, Y and Z) are collectively willing and able to produce and sell per time period (week, month, quarter, year…) at different price levels ceteris paribus.
• The market supply is the information shown by market supply schedules:
NB: We generally refer to the “market supply” whenever we say “supply”.
Price (in $) ConsumerQuantitysupplied
Total quantitysupplied
5
X 5
27Y 12
Z 10
3
X 3
15Y 7
Z 5
1
X 1
6Y 3
Z 2
36
The difference between “quantity supplied” and “supply”• The quantity supplied of a good refers to the specific quantity of the
good that the producers in a market are collectively willing and able to produce and sell during a time period at a specific price levelceteris paribus.
• The supply of a good refers to the set of quantities of the good that the producers in a market are collectively willing and able to produce and sell during a time period at different price levels ceteris paribus.
• The former is a specific quantity for a specific price and the latter is a set of quantities for different prices.
37
Graphical illustration
• We can plot individual supply schedules as well as market supply schedules.
• What we obtain is the individual/market supply curve.
• We generally refer to the market supply curve whenever we say “supply curve”.
• Prices are on the vertical axis (the y-axis) and quantities demanded are on the horizontal axis (the x-axis).
38
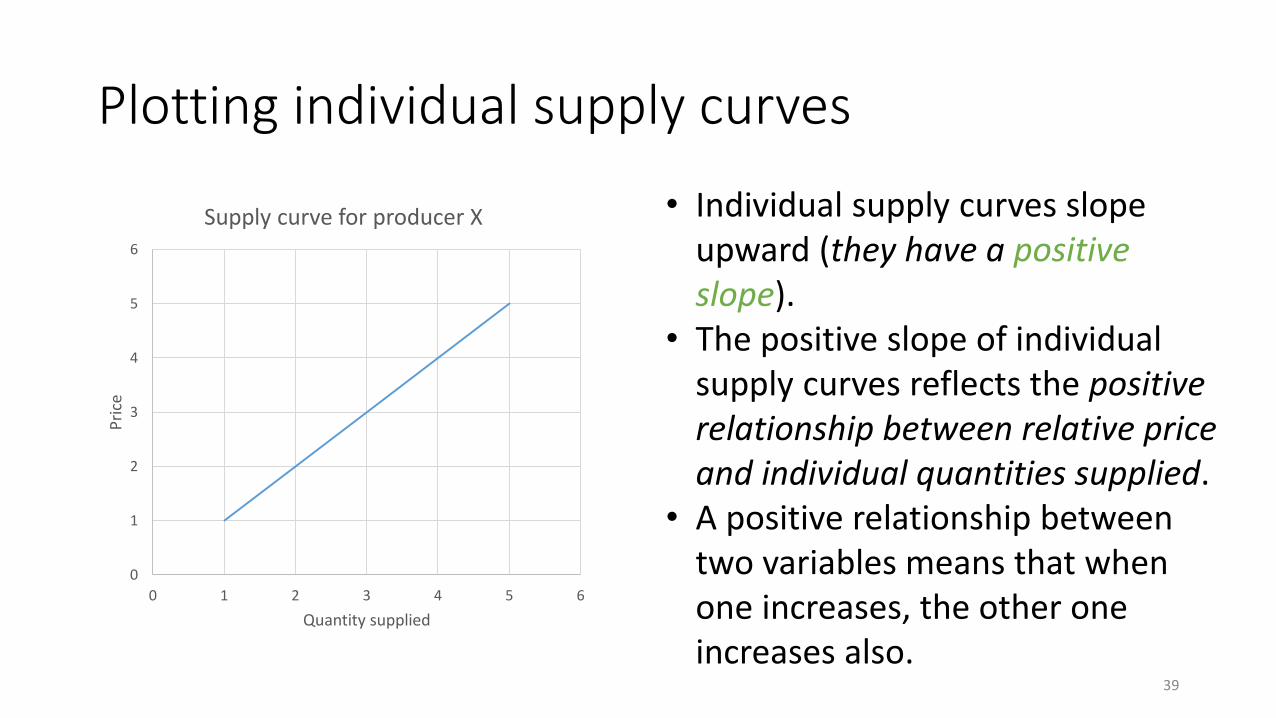
Plotting individual supply curves
0
1
2
3
4
5
6
0 1 2 3 4 5 6
Pri
ce
Quantity supplied
Supply curve for producer X • Individual supply curves slope upward (they have a positive slope).
• The positive slope of individual supply curves reflects the positive relationship between relative price and individual quantities supplied.
• A positive relationship between two variables means that when one increases, the other one increases also.
39
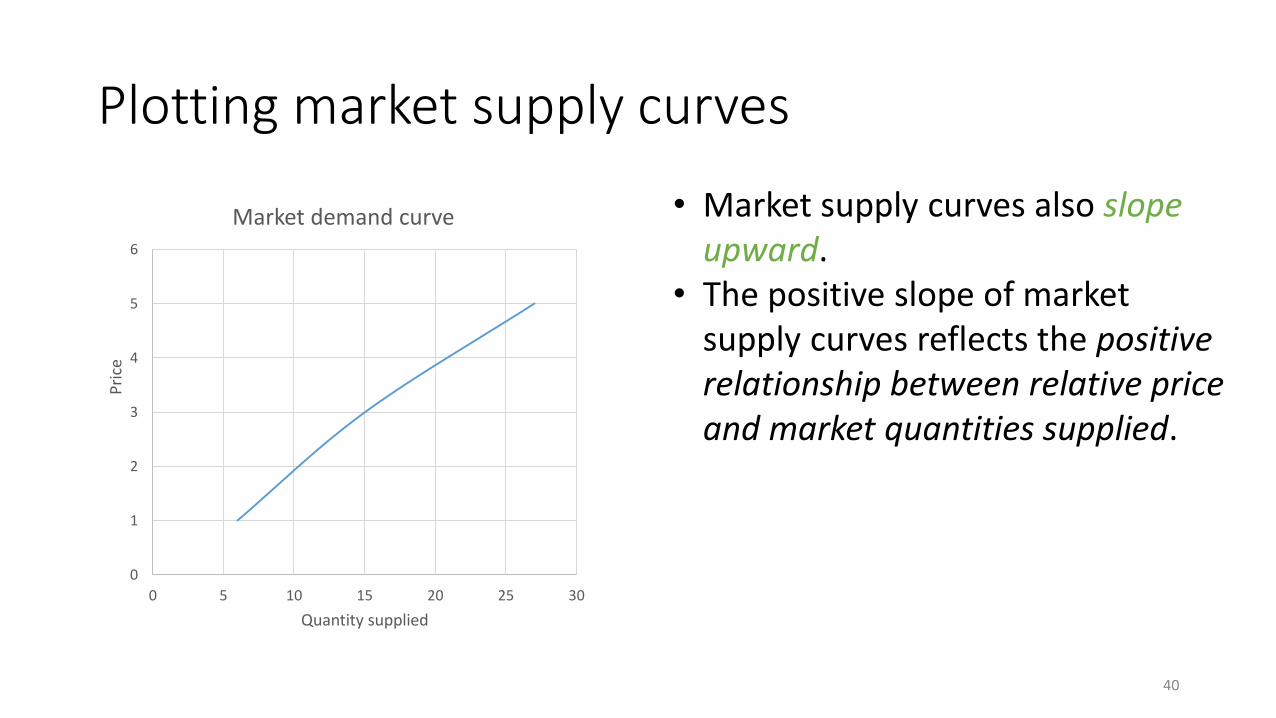
Plotting market supply curves
0
1
2
3
4
5
6
0 5 10 15 20 25 30
Pri
ce
Quantity supplied
Market demand curve • Market supply curves also slope upward.
• The positive slope of market supply curves reflects the positive relationship between relative price and market quantities supplied.
40
The Law of Supply
• Ceteris paribus, a rise in the relative price of a good/service induces a rise in the quantity supplied.
• Similarly, ceteris paribus, a fall in the relative price of a good/service induces a fall in the quantity supplied.
41
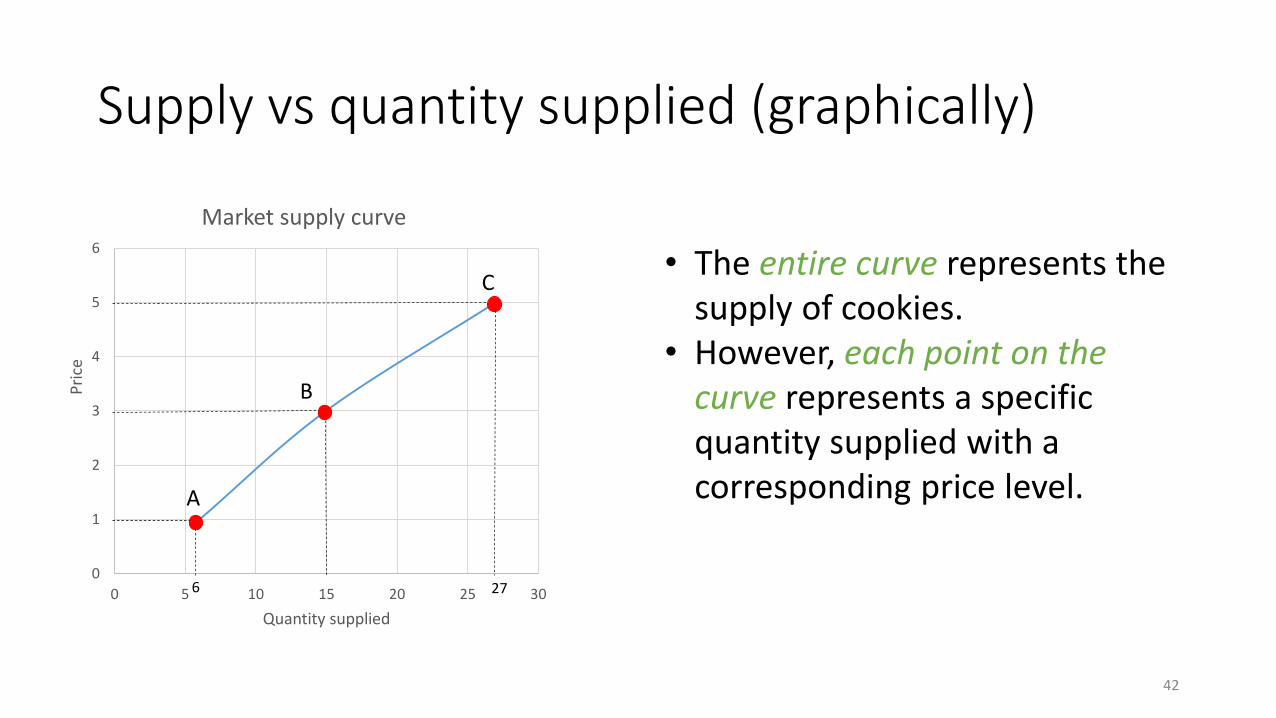
Supply vs quantity supplied (graphically)
• The entire curve represents the supply of cookies.
• However, each point on the curve represents a specific quantity supplied with a corresponding price level.
0
1
2
3
4
5
6
0 5 10 15 20 25 30
Pri
ce
Quantity supplied
Market supply curve
A
B
C
6 27
42
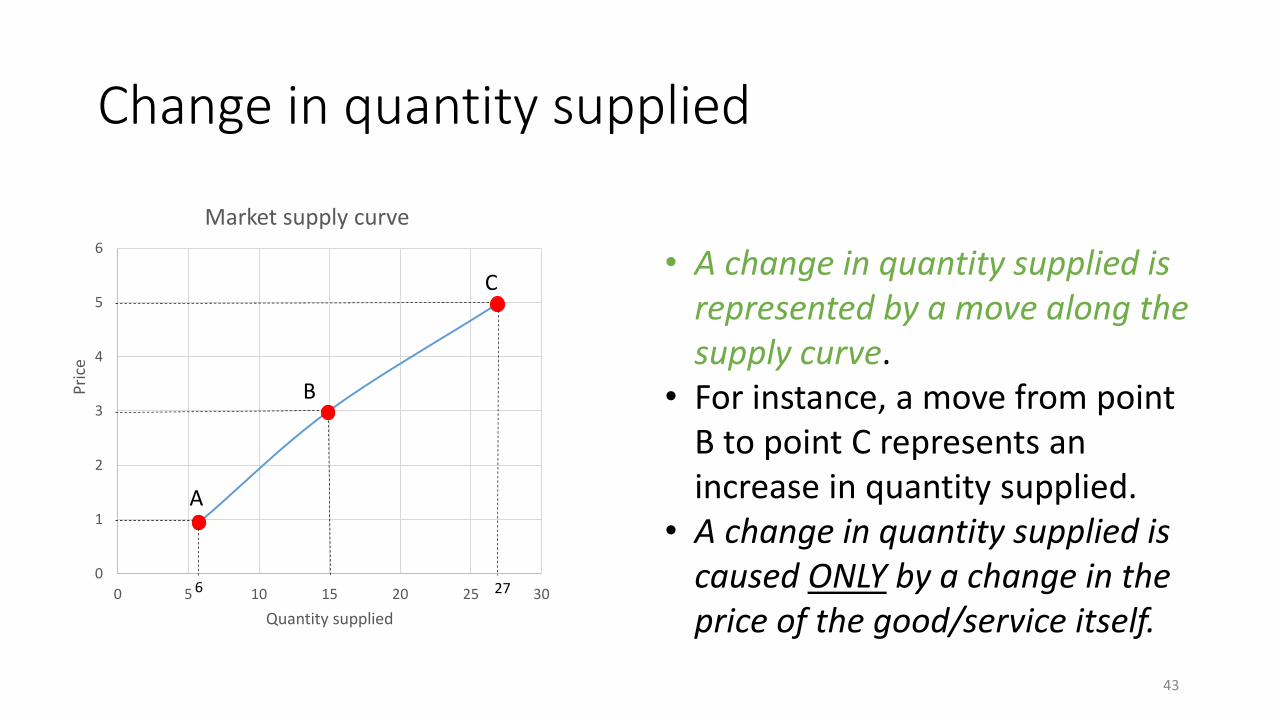
Change in quantity supplied
• A change in quantity supplied is represented by a move along the supply curve.
• For instance, a move from point B to point C represents an increase in quantity supplied.
• A change in quantity supplied is caused ONLY by a change in the price of the good/service itself.
0
1
2
3
4
5
6
0 5 10 15 20 25 30
Pri
ce
Quantity supplied
Market supply curve
A
B
C
6 27
43

Change in quantity supplied (2)
• A move from point B to point C illustrates an increase in price from $3 to $5.
• That increase in price induces an increase in the quantity supplied from 15 to 27.
• Similarly, a decrease in price will lead to a decrease in the quantity supplied.
0
1
2
3
4
5
6
0 5 10 15 20 25 30
Pri
ce
Quantity supplied
Market supply curve
A
B
C
6 27
44
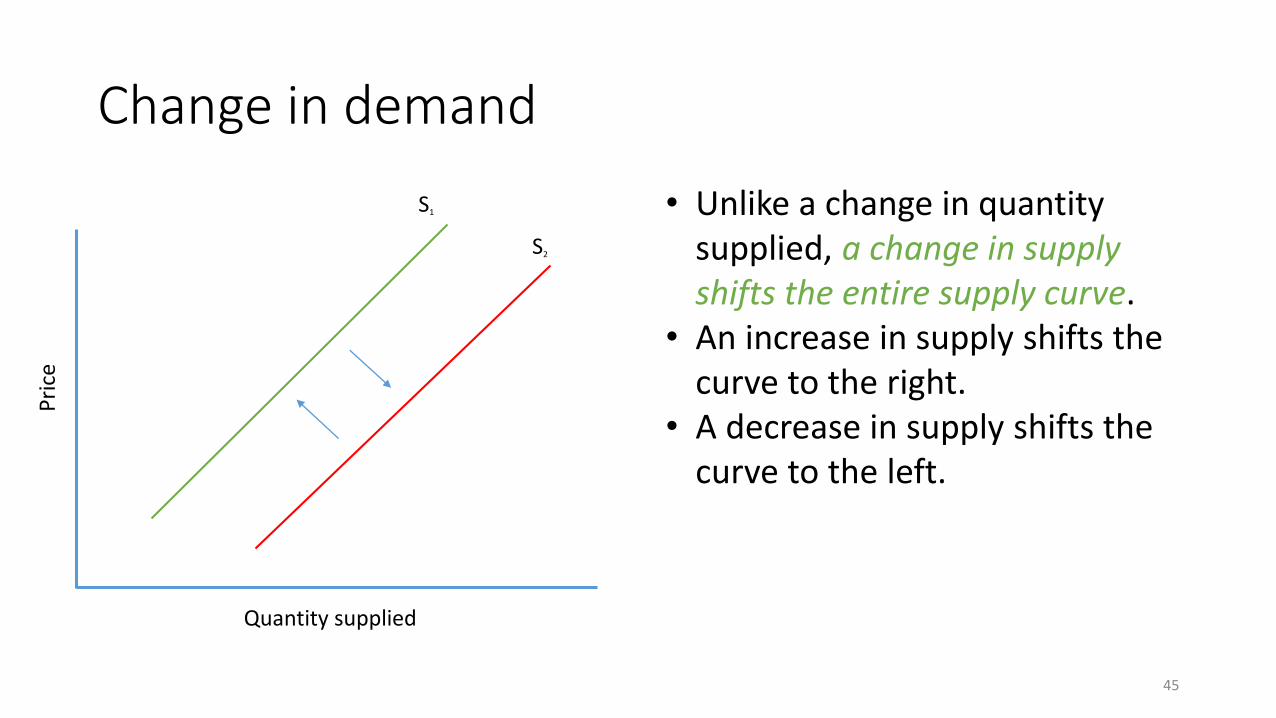
Change in demand
• Unlike a change in quantity supplied, a change in supply shifts the entire supply curve.
• An increase in supply shifts the curve to the right.
• A decrease in supply shifts the curve to the left.
Quantity supplied
Pri
ce
S1
S2
45

Factors that change supply
• Many factors may change the supply of a good. Following are six (6) of them:
- The prices of inputs
- The prices of related goods
- Expected future prices
- Technology
- Natural factors
- Number of suppliers
46
1- The price of inputs
• When the price of an input decreases, it becomes cheaper to produce the output.
• For example, it become cheaper to produce tables when the price of wood falls.
• Consequently, the producer has an incentive to produce output.
• There is an increase in the supply of the output.
• A fall in the price of inputs leads to an increase in supply.
• A rise in the price of inputs leads to a decrease in supply.
47
2- The prices of related goods
• Again, there are two types of related goods: complements and substitutes.
• A change in the price of a complementary good Y will shift the supply of a good X.
• For example, if the price of shoes (complements) increases, the quantity supplied will also increase (this is the law of supply).
• The producers of shoe polish will respond by increasing its supply [the supply of shoe polish].
• The supply of a good is positively correlated with the price of its complements.
48
2- The prices of related goods (2)
• A change in the price of a substitute Y will shift the supply of good X.
• For example, if the price of vegetable oil (substitute) rises, the (profit-minded) producers of peanut oil will switch and begin the production of vegetable oil in search of higher profits.
• Consequently, the supply of peanut oil will fall.
• The supply of a good is negatively related with the price of its substitutes.
49
2- The prices of related goods (3)
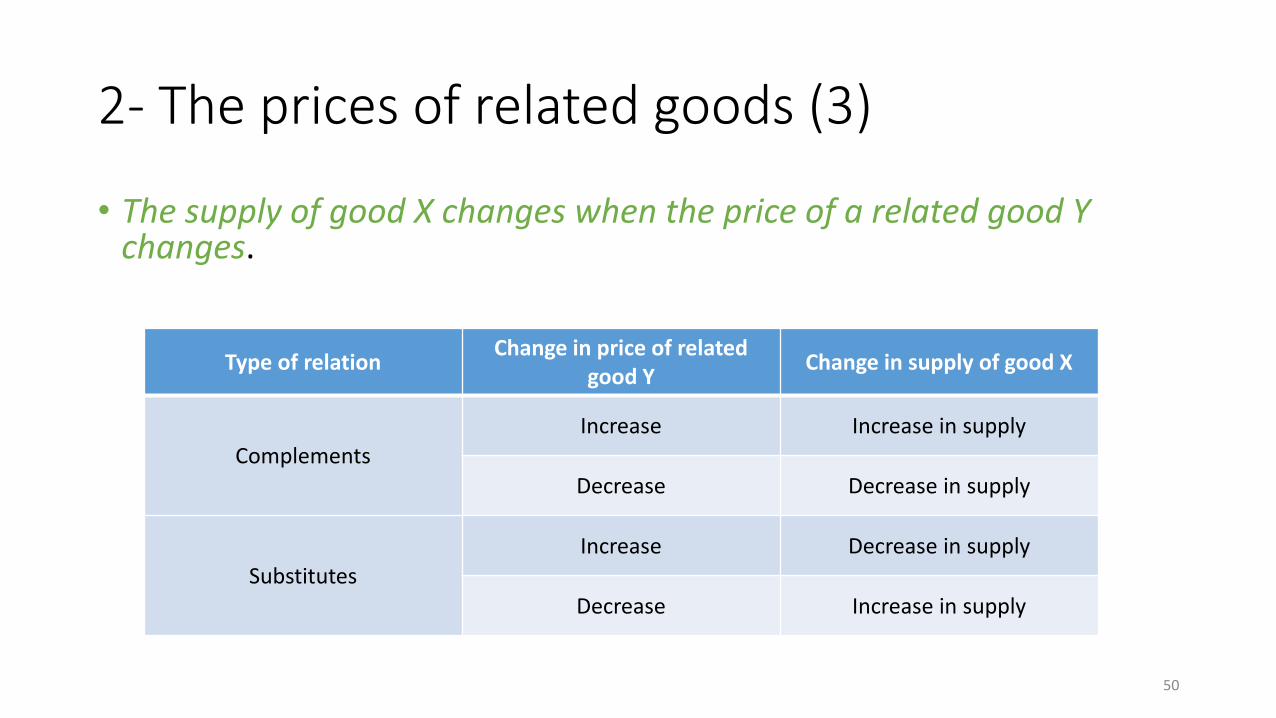
• The supply of good X changes when the price of a related good Y changes.
Type of relationChange in price of related
good YChange in supply of good X
Complements
Increase Increase in supply
Decrease Decrease in supply
Substitutes
Increase Decrease in supply
Decrease Increase in supply
50
3- Expected future prices
• When the expected future price of a good changes, its supply also changes.
• For example, let’s assume the price of cars is expected to rise during the summer.
• The car manufacturers will decrease their supply of cars before the summer so they can take advantage of the higher price later.
• The supply of a good is negatively related with its expected future prices.
51
4- Technology
• A higher level of technology means a higher supply.
• For example, the supply of books was much lower 200 years ago than it is now.
• This is due to the advancement of the technology involved in the printing industry.
• An increase in the technology used to produce a good will also increase the supply of the good.
52
5- Natural factors
• Many natural factors may affect the supply of a good.
• Weather, for instance, is a crucial natural factor that affects agricultural production.
• Or a hurricane will negatively affect the production of many goods in a city.
• Many more examples can be given.
53

6- Number of suppliers
• Obviously, if the number of suppliers of a good changes in the market, the supply of the good will change.
• For example, the supply of mobile phones has drastically increased over the years.
• This is due to the increase in the number of phone manufacturers: Samsung, HTC, Motorola, Apple…
• The supply of a good is positively correlated with the number of its suppliers.
54
You should now be able to…
• Define a good/service• Explain the significance of ceteris paribus in economics• Define a market• Define quantity demanded and demand and explain the main differences
between both concepts (with words and graphs)• Draw a demand curve and comment on its slope• State the reason that can cause quantity demanded to change• Illustrate a change in quantity demanded graphically• State the law of demand• Give a few reasons that can cause demand to change and explain the
mechanics• Illustrate a change in demand graphically
55
You should now be able to… (2)
• Define quantity supply and supply and explain the main differences between both concepts (with words and graphs)
• Draw a supply curve and comment on its slope
• State the reason that can cause quantity supply to change
• Illustrate a change in quantity supplied graphically
• State the law of supply
• Give a few reasons that can cause demand to change and explain the mechanics
• Illustrate a change in supply graphically
56

THANK YOU
57