the two tomorrows€¦ · foundations, corporations, universities, health care systems, business...
TRANSCRIPT

The Two Tomorrows
Regional priorities for a better tomorrow from the Fund for Our Economic Future


The Fund for Our Economic Future

foundations, corporations, universities, health care systems, business
and civic associations, government entities and individuals that
pool resources and know-how to advance economic growth and
equitable access to opportunity for all people of Northeast Ohio
through improved job creation, job preparation and job access.
This approach is called “Growth & Opportunity.” The economic
development priorities laid out in this report are the opinions of
our Fund, the collective voice of philanthropy, born of economic
research and nearly 15 years of working on the economy (with
many of you who are reading this). They outline what is needed for
our community now to advance Growth & Opportunity.
We are an alliance of funders –

Our economy has experienced some exciting and very visible growth,
but is NEO investing in ideas and industries that will serve our children
and their children? Can current and future residents access this
growth? We at our Fund are deep in a conversation about how our
regional economy is doing and we are going to be candid: Northeast
Ohio’s economy is too much icing and not enough cake.
Can we talk?
“Not everything that is faced can be changed, but nothing can be changed
until it is faced.” – James Baldwin

Northeast Ohio has had its share of high-profile economic wins that should be celebrated. Recent headlines like “Akron ranks high on list of ‘Overlooked Dream Cities’”; “Youngstown Business Incubator tops university-affiliated business incubator list”; “Wooster-Wayne County a top micropolitan … Again”; and many others have touted our region’s assets to the world.
The press Northeast Ohio received from hosting the Republican National Convention was overwhelmingly upbeat. Downtown Cleveland has benefited from large infrastructure projects like the revamping of Public Square and sleek new hotels, and has enjoyed an influx of residents; meanwhile, its neighborhoods like Tremont, Ohio City and others are teeming with new bars, restaurants and housing. In addition, let us not forget that in one of the most tortured sports communities in the nation, the Cavs won an NBA Championship and the Indians went to the World Series—in the same year.
These impressive developments are good for the psyche of the region and our national reputation.
At the same time, these achievements should not be mistaken for the overall state of the region’s economy. Northeast Ohio faces real economic challenges. On a fundamental level, we are clinging to average, and average is not good enough. We are not innovating and investing to the level needed to drive and sustain global competitiveness.
We also need to change what we consider to be success. Our Fund believes “Growth & Opportunity,” or the mutual reinforcement of economic growth and equitable access to opportunity, must be a community imperative. Economic polarization and systemic racial exclusion are serious threats to our region’s long-term vibrancy. We are leaving people behind and further widening the economic and racial divide. Concentrations of poverty are persistent and growing. Racial inequalities in economic outcomes cannot be ignored or explained away.
The more time that passes, the more we risk normalizing the growing inequality. But there is a path forward and inclusive prosperity is within reach. Which tomorrow will we choose?
To address our economic lassitude and inequality in a comprehensive and cooperative way, we must ask ourselves: Are we prepared to transform our economy from exclusive to inclusive, from average to extraordinary?
What follows is not a plan. It is a call for a collective sense of purpose—for choosing a better tomorrow.
Step one is coming together around shared regional priorities that connect Growth & Opportunity through Job Creation, Job Preparation and Job Access, with deliberate attention to systemic race-based inequities and the barriers to opportunity they create and exacerbate.
Taking action on these priorities will require many groups throughout Northeast Ohio to embrace their importance and work together to advance them. Most of this work will happen at the local level, some of it will be regional and hopefully all of it will be mutually reinforcing.
We are proud of our work through our Fund; we have also done an honest reckoning of what has and has not worked on our part. While our intentions have always been good, and we have enjoyed some real successes, we have had our share of misfires and know we are nowhere near our potential. We hope the greater Northeast Ohio community will undertake an honest reckoning, too. Together, we can do better than just icing.
The Fund for Our Economic Future is committed to doing our part to ensure the best is ahead, and we look forward to building the future with all of you. Ever onward.

• 18 counties• 4 Metropolitan Areas (Akron, Canton, Cleveland, Youngstown)• 4 Million People• $225 Billion Annual Gross Regional Product (2016)
Cleveland
Akron
Canton
Lorain
Medina
Wayne Stark
SummitPortage
Geauga
Lake
Cuyahoga
Ashtabula
Trumbull
Mahoning
Erie
Huron
Richland
Ashland
Columbiana
Tuscarawas
Our Region:
Youngstown

Table of Contents
Executive Summary
CONTEXTHow We Work
National Trends
Systemic Racial Exclusion
PRIORITIESJob Creation
1-5 Job Creation Sections
Job Preparation1-3 Job Preparation Sections
Job Access1-2 Job Access Sections
METRICSHow to Measure Progress
Our Conclusion
Appendix
10
16
2026
3034-49
5254-64
6668-75
78
8490


ExecutiveSummary

10 The Two Tomorrows
01 - Executive Summary
Being average is a choice.
So is being extraordinary.

11The Two Tomorrows
01 - Executive Summary
The Goal: Our Fund believes Northeast Ohio will have achieved Growth & Opportunity and increased its global economic competitiveness when there is a continuously regenerating economy creating good jobs and rising incomes for everyone. What does that look like? A region with a growing traded sector and vibrant young firms. A region that is increasing the prosperity of all its residents, providing full employment and economic security to those who call it home. A region that eliminates racial employment and income disparities and finds solutions to the problem of concentrated poverty.
Why It Will Be Tough:We are faced with the challenge of deciding between two tomorrows. One where we are average. Where a legacy industry mix, lower-than-average educational attainment rates, the outmigration of people and jobs, persistent concentrations of poverty and racial disparities continue to undermine Northeast Ohio’s economic competitiveness. The other where we are extraordinary. Where we embrace strategies in Job Creation, Job Preparation and Job Access to fully realize our potential, and achieve Growth & Opportunity. For those who work so hard to strengthen our region, the idea of two tomorrows may be a difficult truth. In the coming years, we must build an economy based on good jobs and rising incomes for everyone, otherwise Northeast Ohio risks being defined by its economic polarization. To do this, we must understand the issues holding us back from inclusive transformation and align our regional priorities accordingly.
What Is Next:Being average is a choice. So is being extraordinary. We have a choice to make. With success and our regional priorities defined, and with plenty of hard work, Northeast Ohio can achieve Growth & Opportunity. At our Fund, we will use these priorities to shape our collective actions and inform the individual actions of our members.
But we cannot achieve Growth & Opportunity alone. We hope these priorities can serve as a basis to align efforts with our partners from business, the public sector, neighborhood-based leadership, higher education and national communities of practice.
Many conversations and much work are already underway. But there is more to do. To discuss these priorities and how we advance a better tomorrow, reach us at: [email protected].
12 The Two Tomorrows
01 - Executive Summary
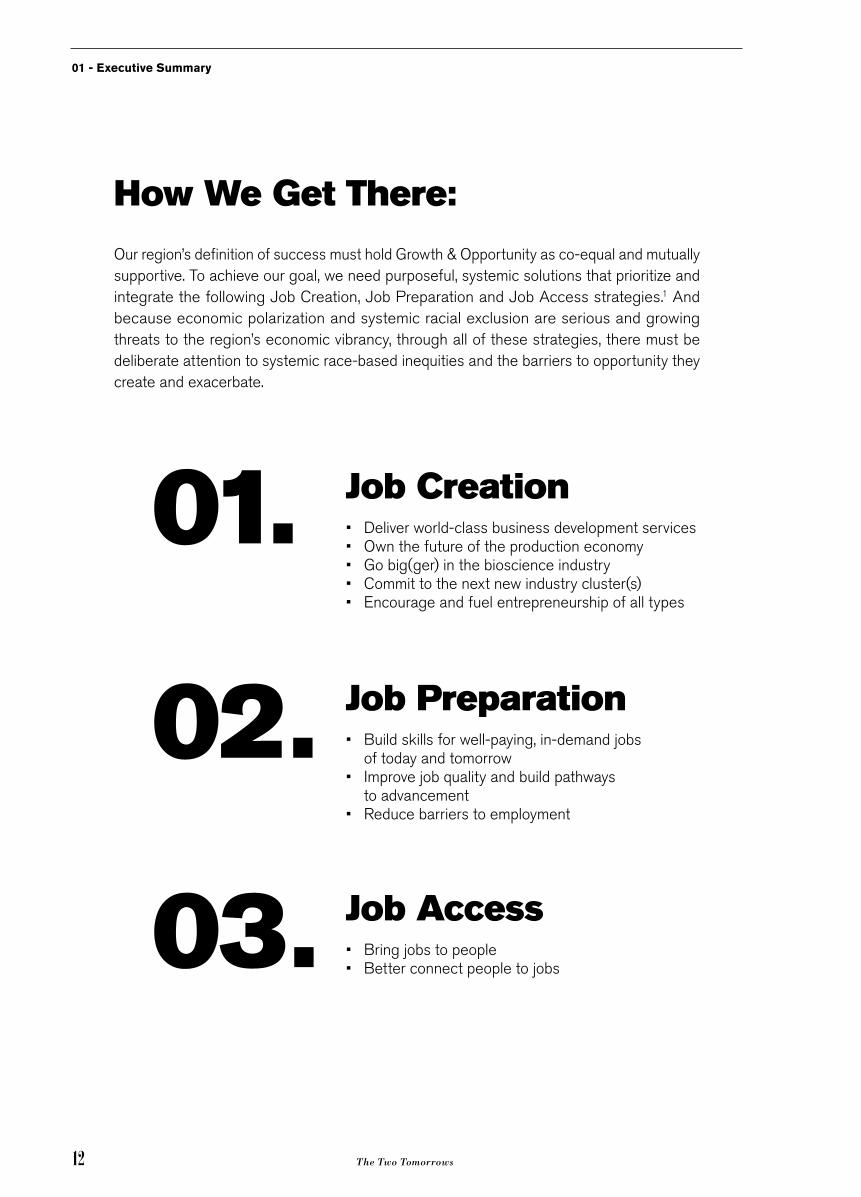
How We Get There:
Our region’s definition of success must hold Growth & Opportunity as co-equal and mutually supportive. To achieve our goal, we need purposeful, systemic solutions that prioritize and integrate the following Job Creation, Job Preparation and Job Access strategies.1 And because economic polarization and systemic racial exclusion are serious and growing threats to the region’s economic vibrancy, through all of these strategies, there must be deliberate attention to systemic race-based inequities and the barriers to opportunity they create and exacerbate.
Job Creation• Deliver world-class business development services• Own the future of the production economy• Go big(ger) in the bioscience industry• Commit to the next new industry cluster(s) • Encourage and fuel entrepreneurship of all types
Job Preparation• Build skills for well-paying, in-demand jobs
of today and tomorrow• Improve job quality and build pathways
to advancement• Reduce barriers to employment
Job Access• Bring jobs to people• Better connect people to jobs

13The Two Tomorrows
01 - Executive Summary
Job Preparation
Job Creation
A stronger,
more sustainable economy.
Job Access


15The Two Tomorrows Report
Section Title
How We Work

16 The Two Tomorrows
02 - How We Work
We also recognize that the economy is not going to fix itself and that
none of us—no single leader, company or organization—can do it
alone. It takes a region to lift an economy. To be most effective, we
believe in the importance of strong local strategies, shared regional
priorities for statewide and national advocacy, a focus on systemic
solutions and a collaborative mindset.
The four-part Fund formula.
Our Fund firmly believes in our collective ability to achieve Growth & Opportunity for Northeast Ohio.

17The Two Tomorrows
02 - How We Work
A healthy economy starts with local capacity. Local economic, land use, transportation, education and workforce policies shape much of our regional economy. Strong local strategies to advance economic growth with equitable access to opportunity improve the ability of communities to leverage regional economic development assets and strengthen the places where our residents live and work.
Improving baseline conditions undermining our economic competitiveness—our legacy industry mix, lower-than-average educational attainment rates, the outmigration of people and jobs, persistent concentrations of poverty and racial disparities—requires more than incremental, disconnected programs. We need to drive systemic solutions purposefully. That presents challenges because, unlike projects, systemic solutions typically do not fit into election cycles or onto the pages of annual reports. Systemic solutions are long-term, messy and interconnected. But ultimately, it is systemic change that leads to real transformation.
Northeast Ohio is 36 percent of the overall Ohio economy2 and representative of rural, urban, suburban and exurban communities with $225 billion in 2016 gross regional product (GRP).3 Where there are common interests—and there are many—the regional voice has the potential to have a significant influence on state and federal policies and funding that, in turn, can have significant impact on our ability to advance our regional priorities. Ohio Third Frontier funding, JobsOhio incentives, investments in transportation and workforce, and funding for brownfield redevelopment are all examples of shared regional interest.
The past decade has shown how much progress can be made when we work together on our toughest challenges, especially when we focus on contribution versus attribution. To achieve transformation, we must bring together our local assets and individual skills and move collaboratively toward shared goals.
With this spirit, we aim to work with others on priorities that connect growth with opportunity through attention to Job Creation (page 30), Job Preparation (page 52) and Job Access (page 66). We’ve designed these priorities with the following context in mind.
Advocacy and Influence
Strong Local Strategies
Collaboration
Systemic Solutions

18 The Two Tomorrows
03 - National Trends

19The Two Tomorrows
03 - National Trends
National Trends
20 The Two Tomorrows
03 - National Trends
Northeast Ohio’s economy is shaped by national economic trends.
“The only sustainable prosperity is shared
prosperity.” Joseph E. Stiglitz
Understanding how national trends show up in Northeast Ohio
informs how we work to improve the region’s economic future.
Economic polarization, comparative performance of regional
industries, rapid digitization, reurbanization and systemic racial
exclusion influence our Fund’s approach to Job Creation, Job
Preparation and Job Access.

21The Two Tomorrows
03 - National Trends
Economic PolarizationA strong economy is defined both by whether it grows and by how it grows. Growing economic polarization, characterized by inequality in income, wealth generation and potential for economic mobility,4 is a national issue that threatens to undermine the long-term stability of the Northeast Ohio economy.5 Drivers of economic polarization are many and include rapid productivity improvements resulting in the changed nature, number and types of available jobs; the bifurcation of employment growth over recent decades into low- and high-income jobs with substantial reductions in middle-wage jobs;6 the spatial mismatch between people and jobs; and persistent, systemic race-based bias.
Economic polarization shows up in real ways for people in Northeast Ohio. Between 2011 and 2015, average household income in Northeast Ohio rose 4 percent,7 yet regional concentrations of poverty increased. Overall, absolute numbers of areas of economic distress increased by nearly 30 percent and the number of people living in these areas increased by 31 percent.8
Combating economic polarization requires advancing the mutually reinforcing propositions of economic growth and equitable access to opportunity through a focus on the inter-related priorities of Job Creation, Job Preparation and Job Access.
Industry MixNortheast Ohio’s economy is over-weighted in industries that are not growing nationally. This is largely due to the region’s legacy in manufacturing, an industry that has struggled nationally and even more so locally.
Northeast Ohio also appears to be slow to develop new, emerging industries. While professional and management-based industries, hospitals and other health care facilities have been bright spots for the region, an overreliance on one or two growing industries leaves Northeast Ohio more vulnerable to potential economic shocks (e.g., national health care reform).
These facts suggest both a strong need to foster new industry clusters to diversify the regional economy, as well as a need to innovate within existing dominant industries, such as manufacturing. Targeting strategies effectively will matter. For example, while manufacturing largely lost jobs nationally, and while Northeast Ohio largely lost jobs more quickly than the nation, jobs in certain manufacturing subsectors like plastics, chemicals and coatings grew locally over the past 10 years. Understanding where Northeast Ohio can be competitive and outperform is the foundation of a strong job creation strategy.
And Northeast Ohio’s industry mix can be influenced. The region’s prowess in the bioscience industry grew out of deliberate attention by and cooperation among influential private, nonprofit, public sector and philanthropic leaders. A decade of persistent effort and investment has paid off: from 2000 to 2016, the industry experienced 59 percent growth, and now accounts for 2.8 percent of Northeast Ohio GRP; job growth increased to around 1,000 jobs per year in 2016, from just more than 400 jobs three years earlier.9
Northeast Ohioans lives in an area of economic distress.
151in

22 The Two Tomorrows
03 - National Trends
DigitizationRapid technological improvements over recent decades have driven the mass adoption of connected digital services by people, businesses and the public sector. This digitization, referred to as the Fourth Industrial Revolution, is proceeding at an “… exponential rather than linear pace.”11 Strong improvements in business productivity have been realized in the U.S. and across the world, as well as in Northeast Ohio.12 Digitization pervades all industries, with an outsized impact on older industrial cities like those in Northeast Ohio.13 Continued reliance on manufacturing means a substantial portion of regional businesses must innovate or risk becoming obsolete.
Further, while digitization is responsible for significant gains in productivity, these gains typically come with declines in jobs. Productivity gains also have strongly contributed to the bifurcation of job growth into “high tech” and “low tech”—and a commensurate bifurcation of wages. Perhaps more importantly, the nature of work and
skills required for jobs have changed substantially over a short period. The breakdown in advancement opportunities leaves people stranded in low-wage work and businesses with unfilled positions.
Northeast Ohio must prioritize driving innovation into existing industries, foster flexible and responsive job preparation activities that can keep up with new market demands and purposefully build in digital access for disconnected residents currently cut off by a growing digital divide.
Outpacing National Growth: • General medical and surgical hospitals• Residential intellectual and developmental disability, mental health and substance abuse facilities
Growing, But Not as Fast as Elsewhere in the Country: • Management of companies and enterprises
Shrinking Nationally, and Shrinking Even Faster Locally:• Motor vehicle parts manufacturing• Other fabricated metal product manufacturing• Machine shops; turned product; and screw, nut and bolt manufacturing• Machinery, equipment and supplies merchant wholesalers
Growing Jobs, Shrinking Jobs10

23The Two Tomorrows
03 - National Trends
ReurbanizationStories of people and jobs moving back to cities in recent years have promoted a broad-brush belief that generational preferences of baby boomers and millennials are fueling the return of economic growth to cities. This conversation, however, is often focused on the benefits (and challenges) reurbanization poses to high-population, high-economic growth cities and does not yet translate to slow or no-growth regions like Northeast Ohio.
Without a doubt, downtowns throughout Northeast Ohio are benefitting from a resurgence in residential occupancy rates, leading to many important benefits to regional economic and psychological well-being. Over time, this trend is likely to yield increases in tech-based and headquarters-related jobs, as it has in other cities. However, this has yet to materialize meaningfully and local, regional and statewide policies and practices continue to promote the development of new sites over use of existing infrastructure, driving land use patterns that undermine the region’s economic competitiveness.
From 2002 to 2012, Northeast Ohio’s population was stagnant, job growth was flat and traded-sector jobs became more geographically dispersed.14 The result: between 2000 and 2012, the number of jobs within the typical commute distance of Northeast Ohio residents declined by 22 percent, meaning that one in five jobs disappeared from within the typical commute range.15 This is bad for residents who face the real cost of increasingly long commutes16 (if they can get to work at all), bad for businesses that are reporting struggles with employee timeliness,17 bad for local government officials facing ever-increasing costs of infrastructure on a declining tax base,18 and bad for the environment, manifested in air and water quality rankings near the bottom of the U.S.19
For too long, Northeast Ohio has adopted an “any job is a good job” mentality without accounting for the spatial ramifications of this attitude. Strategies to build up and reinforce job hubs, or areas in the region with a high concentration of traded sector jobs (companies that trade with people and businesses outside of the regional economy), could drive significant improvements in job access—but will require partners from across sectors and across the region to work together.
22%.
Between 2000 and 2012, the number of jobs within the typical commute distance of Northeast Ohio residents declined by

24 The Two Tomorrows
04 - Systemic Racial Exclusion

25The Two Tomorrows
04 - Systemic Racial Exclusion
Systemic Racial
Exclusion

26 The Two Tomorrows
04 - Systemic Racial Exclusion
Across the nation, communities, businesses and individuals are
grappling with persistent and growing disparities between whites
and people of color across all systems, including housing, education,
health care and criminal justice.20 Disparities in economic outcomes
(employment and income) are equally stark. Strategies calling for
racial inclusion—in our region and across the nation—demonstrate
the shared belief that closing these gaps matter. Still, the gaps
aren’t closing. Why? Individual interventions aren’t enough to combat
centuries of systemic racial exclusion.
Systemic racial exclusion is
still real. Individual interventions aren’t enough to combat centuries of
systemic racial exclusion.

27The Two Tomorrows
04 - Systemic Racial Exclusion
Achieving Growth & Opportunity, an inclusive economy where all people have the opportunity to benefit, will require more than increasing energy for existing inclusion strategies that largely aim to “fix” outcomes through a focus on behaviors and accountabilities of individuals and companies. The challenge transcends person- and company-specific attitudes and actions. Our fundamental systems are racially exclusive.
Broadly speaking, the argument for addressing racial inclusion in an economic strategy is as follows: when large portions of a region’s population are disconnected from jobs, the entire regional economy suffers. As the demographics of Northeast Ohio and the nation move quickly toward “majority minority,”21 the region simply cannot afford for large numbers of people to be cut off from economic opportunity.
Disaggregation of data by race demonstrates that stark economic inequalities have persisted, and by some measures worsened. Nationally, in 2014, white families held 90 percent of the wealth, while black and Latino families together held less than 5 percent of the nation’s wealth,22 despite making up 13 percent and 18 percent of the population, respectively.23 Meanwhile, the black unemployment rate is more than twice the white unemployment rate—a gap that has remained staggeringly consistent over 60 years.24 The unemployment rate for young black college graduates (age 24 to 29) is twice the unemployment rate for young white college graduates,25 suggesting that improved access to educational attainment is not resulting in commensurate improvements in access to career opportunities.
In 2016 in Northeast Ohio, the black unemployment rate was nine percentage points higher than the white unemployment rate, a disparity that increased from 2013 to 2016 in every Northeast Ohio metro area except Cleveland.26 And in a climate of slow overall wage growth, racial earnings disparities are actually increasing in Youngstown, Akron and Cleveland, where in 2016 whites earned 1.40 times, 1.74 times, and 1.75 times more, respectively, than black workers on average each month.27 In Canton, the gap has stayed constant for the past three years: white workers earned 1.5 times more than black workers on average each month.
Previous actions to promote economic racial inclusion in Northeast Ohio have included targeted support to minority entrepreneurs and minority-owned businesses, mentorship programs designed to improve social networks and career prospects of minorities in the workforce, increased access to higher education for minority students, and sector-based inclusion and diversity strategies (e.g., efforts to increase minority construction contracts).
Strategies like these will remain important but their success has been undermined by long-standing and current institutional practices determining land use, transportation, infrastructure development, educational support, and business development. These practices drive and reinforce systemic racial exclusion and result in economic inequality. Combating systemic racial exclusion requires more; it requires changing minds, policies, practices, and laws. We can drive more equitable outcomes through increased awareness, actions and accountability.
IT REQUIRES CHANGING MINDS, POLICIES, PRACTICES AND LAWS.
Combating systemic racial exclusion requires more;

28 The Two Tomorrows
04 - Systemic Racial Exclusion
Awareness Embedding an awareness of systemic racial exclusion is step one. The goal: a changed frame and shared vocabulary that then informs the collective work of actors across the region. This hard work has already begun. In 2017, more than 1,400 civic leaders across Northeast Ohio chose to attend workshops offered by the Racial Equity Institute of North Carolina, after more than 400 regional leaders participated in workshops in 2016. The workshops provided data and context, and demonstrated how disparities in outcomes by race pervade every system, from health care to education to criminal justice. Importantly, the analysis demonstrated that other factors, such as poverty, do not fully explain the measured disparities in outcomes. That is, race is itself an explanatory variable.28 This analysis, coupled with historical context of how systems have been designed to exclude people of color, provided workshop attendees with a broader lens within which to consider potential strategies. Continued shared awareness building will be an important foundation for the development of more robust inclusive strategies.
ActionsDifferentiated actions must result from this new awareness. The Job Creation, Job Preparation and Job Access chapters that follow each include an example of how broader awareness and differentiated data can suggest such actions (see pages 49, 64, 75).
AccountabilityNortheast Ohio must address the cost and consequences of systemic racial exclusion and hold itself accountable with success measures that call for elimination of racial economic disparities; see Chapter 08: “How to Measure Progress” on page 78 for details.

29The Two Tomorrows
05 - Job Creation
Job Creation
30 The Two Tomorrows
05 - Job Creation
To achieve sustained long-term growth, the region should focus
its collective economic development energy on driving the kind of
growth needed to achieve a continuously regenerating economy:
growth in the traded sector (companies that trade with people and
businesses outside of the regional economy) and growth in the
number of young firms (less than five years old) of any kind.
When is good, good enough? To be competitive, Northeast Ohio will have to be great.

31The Two Tomorrows
05 - Job Creation
Traded sector jobs drive economic prosperity and support the long-term growth of population-serving jobs. Traded sector jobs pay, on average, twice as much as population-serving jobs. Traded sector growth also stimulates growth in kind: every new traded sector job imputes, on average, 2.4 other jobs needed for supply chain or other services, significantly higher than the 0.5 jobs imputed for each population-serving job.29 Meanwhile, young firms are suggestive of the degree to which an economy is forward-looking and bringing in new ideas. Northeast Ohio is underperforming: between 2012 and 2016, the Canton, Cleveland and Youngstown metropolitan statistical areas (MSAs) failed to keep pace with average peer MSA30 growth rates for either traded sector gross metropolitan product (GMP) or jobs in young firms. Notably, the Akron MSA kept pace with peer metros on both measures.
Understanding the root of Northeast Ohio’s relative economic underperformance is not complicated:
• The regional economy is dominated by slow- or negative-growth industries. Forty percent of the region’s jobs are in declining industries, based on nationwide economy and industry growth rates.31
• Simultaneously, Northeast Ohio industries underperform relative to the nation. Cleveland, Akron and Youngstown MSAs all significantly underperformed expected job growth from 2005 to 2015, based on national job growth rates that account for industrial structure.32
Growth strategies must improve performance in existing industries while driving a shift in the overall industry mix. Without concerted efforts to change the dynamic, the region’s growth story is unlikely to improve.
Northeast Ohio’s slow-growing industry mix is no secret. Policymakers, business leaders, economic developers and foundations at the national, state and local levels have been working for years to change the dynamic, by encouraging entrepreneurship, driving innovation and growing existing businesses. For example, between 2004 and 2017, the state of Ohio’s Third Frontier Program committed more than $94 million dollars to Northeast Ohio through regional economic development organization JumpStart and its
partners in the Northeast Ohio Entrepreneurial Services Provider (ESP) Program, with the aim of shaping the next wave of market and company growth opportunities.33
The philanthropic community—through and beyond our Fund—and other private and public sector actors also have invested heavily in job creation over the past decade. County and local governments have supported start-up and expansion financing, and business chambers and regional intermediaries have provided leadership, additional funding and critical growth services.
The traded sector includes any industries like manufacturing or business consulting that export (or trade) goods and services outside of Northeast Ohio. By doing so, the limits of local market demand do not constrain the growth of companies in this sector. The traded sector represents roughly three-quarters of Northeast Ohio’s gross regional product (GRP), and companies in this sector create indirect benefits in the local economy by supporting supply chain activity, and by creating wealth that supports population-serving industries. Furthermore, jobs in the traded sector typically pay double the wages of local, population-serving jobs (e.g., hospitality, retail).
What Is The Traded Sector?
32 The Two Tomorrows
05 - Job Creation
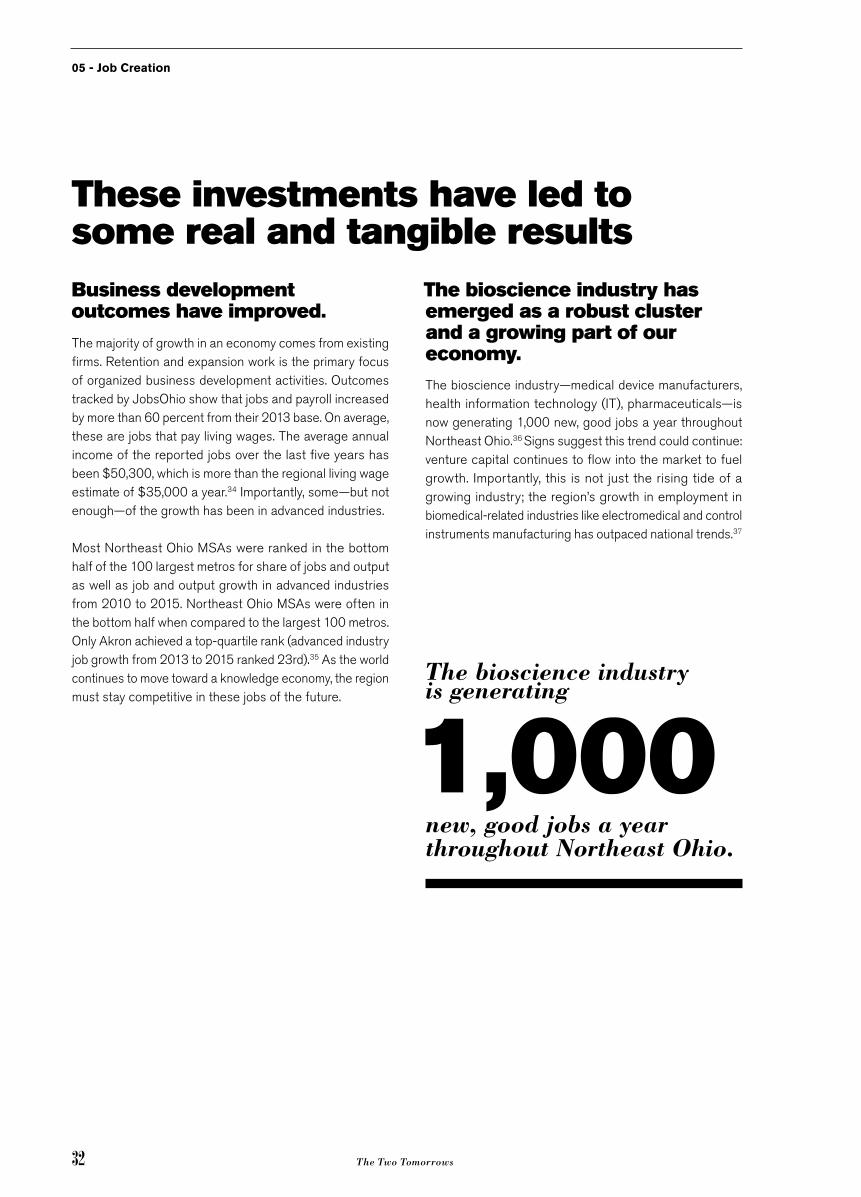
Business development outcomes have improved.
The majority of growth in an economy comes from existing firms. Retention and expansion work is the primary focus of organized business development activities. Outcomes tracked by JobsOhio show that jobs and payroll increased by more than 60 percent from their 2013 base. On average, these are jobs that pay living wages. The average annual income of the reported jobs over the last five years has been $50,300, which is more than the regional living wage estimate of $35,000 a year.34 Importantly, some—but not enough—of the growth has been in advanced industries.
Most Northeast Ohio MSAs were ranked in the bottom half of the 100 largest metros for share of jobs and output as well as job and output growth in advanced industries from 2010 to 2015. Northeast Ohio MSAs were often in the bottom half when compared to the largest 100 metros. Only Akron achieved a top-quartile rank (advanced industry job growth from 2013 to 2015 ranked 23rd).35 As the world continues to move toward a knowledge economy, the region must stay competitive in these jobs of the future.
The bioscience industry has emerged as a robust cluster and a growing part of our economy.
The bioscience industry—medical device manufacturers, health information technology (IT), pharmaceuticals—is now generating 1,000 new, good jobs a year throughout Northeast Ohio.36 Signs suggest this trend could continue: venture capital continues to flow into the market to fuel growth. Importantly, this is not just the rising tide of a growing industry; the region’s growth in employment in biomedical-related industries like electromedical and control instruments manufacturing has outpaced national trends.37
These investments have led to some real and tangible results
1,000new, good jobs a year throughout Northeast Ohio.
The bioscience industry is generating

33The Two Tomorrows
05 - Job Creation
Entrepreneurship, once dormant, is active and growing. Over the past 15 years, significant private, civic and public sector resources have been invested in promoting entrepreneurship. Today, the regional entrepreneurial climate is increasingly vibrant and has achieved a self-perpetuating momentum, giving lift to a growing roster of young businesses and entrepreneurial support organizations, and a new civic mindset at the neighborhood, city and regional levels about both tech- and non-tech-based businesses. The results have been encouraging: The Northeast Ohio ESP Network has supported more than 1,150 startups, and those companies have raised more than $2 billion in capital and created more than 10,000 jobs.38
There is always more work to do.
To go from relative underperformance to outperformance, from average to extraordinary, the region needs strategies that target growing the traded sector and foster an environment that supports and cultivates young firms.
Northeast Ohio needs private, public and philanthropic partners working together to: • Grow and innovate within existing industries, through
the delivery of world-class business development services
• Capitalize on the potential of digitization and new materials to own the future of the production economy
• Strengthen our industry mix, through the continued development of the bioscience industry
• Commit to the next new industry cluster(s)
• Encourage and fuel entrepreneurship of all types

34 The Two Tomorrows
05 - Job Creation
Deliver world-class business development services.
Even accounting for industry mix, the region’s growth underperforms
the nation. But this reality does not imply abandonment of retention
and expansion as a core economic development service; if anything,
strategic targeting of these services takes on greater importance
because existing companies drive most economic growth.
JOB CREATION STRATEGY01:

35The Two Tomorrows
05 - Job Creation
Significant future potential exists for those who can innovate new products, adopt new process technologies and enter new markets.
Seven “driver” industries in Northeast Ohio – Chemicals; Automotive; Metals; Other Manufacturing; Professional, Scientific and Technical Services; Headquarters; andHeathcare/BioSciences – comprise approximately 14,000 companies and approximately 348,400 employees.39 Understanding the national trends and regional performance within subsectors of these driver industries can improve strategic business development targeting and make better use of scarce resources.
While traditional manufacturing subsectors like metal, auto and rubber are still significant employers in the region, these subsectors are declining both regionally and nationally. In addition, the region is losing jobs in these subsectors even more rapidly than other parts of the country. The national growth outlook for many traditional manufacturing subsectors remains negative, suggesting the region’s strategies should focus on recreating traditional sectors or leveraging legacy strengths into growing sectors (see “Job Creation Strategy 02”).
On the other hand, the region is outpacing national growth rates in subsectors like plastics, paint and coatings, and electromedical and instrument manufacturing. And within subsectors, technological changes are opening up new possibilities for growth. Targeting business development services toward future growth areas like these can ultimately drive a shift in the region’s overall industry mix.
How communities interact with and support companies can spell the difference in how fast and where they grow. Historically, this support has been in the form of available sites, good infrastructure and favorable tax treatment and incentives. The 2017 Amazon HQ2 request for proposals provided rare direct insight into what companies are looking for now. The Amazon “wish list” emphasized the importance of the “ … capacity to produce skilled, technical talent … access to domestic and global markets through modern infrastructure … connected, sustainable placemaking … and culture and diversity.”40
The most competitive communities will offer incentives, yes, and access to a skilled workforce, global connectivity and a quality of place that is attractive to new talent. Increasingly, the interests of business developers aiming to land new jobs are aligned with disciplines like community and workforce development.
Northeast Ohio has made efforts to better focus, align and build its business development support, particularly recently. However, the “system” is still highly fragmented, is frequently in a reactive mode and often fails to connect companies to experts who know their business and industry. In 2012, a national economic development consultant described the region’s business development services as the “weak link” in the economic development chain.
TECHNOLOGICAL CHANGES ARE OPENING UP NEW POSSIBILITIES FOR GROWTH.

36 The Two Tomorrows
05 - Job Creation
Traditional measures of economic performance, including increases in jobs, payroll and economic output (gross product), ignore the criticality of inclusive growth to long-term economic success and, for regions like Northeast Ohio, encourage unachievable—and potentially undesirable—job growth goals.
Net job growth in Northeast Ohio falls well below U.S. job growth rates (references chart on the right). Not impressive—and not surprising given Northeast Ohio’s high concentration of jobs in declining industries. The region’s job creation efforts should strive to change this dynamic.
But there also is a strong link between job growth and population growth that impacts the region’s prospects. Roughly 70 percent of an average developed economy is “population serving,” meaning comprised of companies (and jobs) in industries like retail and hospitality that serve a local population. If the population of a region is shrinking, the part of the economy that is serving it will likewise shrink. Northeast Ohio’s population shrank by approximately 2 percent from 2005 to 2015.41
The population of Pittsburgh, a peer economy often heralded as a transformed city due to its strong growth in technology industries, shrank by approximately 1 percent over the same period. While better than Northeast Ohio’s, Pittsburgh’s job growth was still below other large U.S. metros.42 On the other hand, the population of MSAs like Boise, Idaho, Charlotte, North Carolina and Orlando, Florida, grew 15 percent to 16 percent and experienced comparatively higher rates of job growth.43
What if Northeast Ohio MSAs could add population and jobs as fast as Boise, Charlotte and Orlando? Would that be success? Despite their slow job growth numbers, Pittsburgh and the largest metros in Northeast Ohio made stronger gains in measures of prosperity than the fast-growing MSAs of Boise, Charlotte and Orlando.
Overweighting the importance of job growth in an economy can yield a distorted definition of success. If Northeast Ohio measures its economic success by relative increases in jobs, that implies the region is striving for an economy like Boise, Charlotte or Orlando, with rapid job growth that can yield declines in measures of standard of living and median wage, over an economy like Pittsburgh, with slower job growth in better jobs.
To make sure the regional economy is a dynamic one that continually creates new opportunities, Northeast Ohio should focus on growing the traded sector and seeking full employment and rising incomes for its residents.
Why are Northeast Ohio’s relative job growth numbers so low? And how concerned should we be?
Change in Total Employment: NEO vs. US 1970 – 2015
2.00
1.80
1.60
1.40
1.20
1.00
0.80
‘70 ‘73 ‘76 ‘79 ‘82 ‘85 ‘88 ‘91 ‘94 ‘97 ‘00 ‘03 ‘06 ‘09 ‘12 ‘15
NEO US Source: Team NEO
Total employm
ent indexed to 19
70

37The Two Tomorrows
05 - Job Creation
Northeast Ohio Driver Industries and Subsectors44
2017 Estimated Jobs
2012 – 2017 % Change
2017 Location Quotient
ChemicalsBasic Chemical Manufacturing 4,500 11% 2.25
Paint, Coatings and Adhesive Manufacturing 5,000 4% 6.04
Plastics Product Manufacturing 19,100 8% 2.48
Rubber Product Manufacturing 5,300 (2%) 2.94
AutomotiveEngine, Turbine and Power Transmission Equipment Manufacturing
1,000 (30%) 0.80
Motor Vehicle Manufacturing 5,300 (7%) 1.83
Motor Vehicle Body and Trailer Manufacturing 3,200 1% 1.58
Motor Vehicle Parts Manufacturing 18,000 14% 2.28
MetalsSteel Product Manufacturing from Purchased Steel 4,800 (3%) 6.41
Alumina and Aluminum Production and Processing 2,600 28% 3.40
Nonferrous Metal (except Aluminum) Production and Processing
3,000 27% 3.71
Foundries 5,800 (5%) 3.72
Other Fabricated Metal Product Manufacturing 12,200 (18%) 3.37
Other ManufacturingMetalworking Machinery Manufacturing 9,600 (1%) 3.95
Navigational, Measuring, Electromedical and Control Instruments Manufacturing
6,300 15% 1.18
Professional, Scientific and Technical Services
83,400 4% 0.7
Headquarters 47,900 3% 1.58
Healthcare/BioMedical Equipment and Supplies Manufacturing 5,000 (15%) 1.20
Hospital and Surgical Centers 106,400 6% 1.7
Total 348,400 4%
Location Quotient: Industry LQ is a way of quantifying how concentrated an industry is in a region compared to a larger geographic area, such as the state or nation. Industry LQs are calculated by comparing the industry’s share of regional employment with its share of national employment.
38 The Two Tomorrows
05 - Job Creation
To become world-class, the region needs to:
A. B.To the degree possible, expansion resources should be focused on potential “scaleup” companies, or companies likely to grow. Business development relationship managers are a critical entry point into a range of services. While knowledge of and access to expansion incentives and transactional support will always be important, increasingly, the most effective business development professionals serve as growth partners to companies.
As the Brookings Institution noted in its 2016 landmark piece, “Remaking Economic Development”: “There are three ways that regions can increase productivity: by helping firms and industries innovate and invest in R&D and technology (including those supplied by other firms), by helping industries access skilled labor or invest in training, and by improving the industry mix in the region to include more innovative, higher value sectors of the economy.”45
This implies different skillsets for economic development institutions and individuals. With data and effective sales management, relationship managers can understand future needs of high-potential companies and act as a concierge, connecting these companies with the region’s diverse innovation assets (e.g., workforce support, university research, other growth services, capital providers).
Regional economic development organizations such as MAGNET have developed growth services for high-potential companies that have shown great promise. This kind of service should be continued, expanded and marketed. At the same time, Northeast Ohio needs a substantial, coordinated export strategy. With a gross regional product of more than $225 billion,46 Northeast Ohio has globally significant export potential that is not fully realized.
Target proactive calling efforts on companies with high-growth potential using subject matter experts
Expand the suite of services that can help companies grow and facilitate access to them

39The Two Tomorrows
05 - Job Creation
D. While business development efforts should focus on the growth of existing Northeast Ohio companies and avoid the kind of “smokestack chasing” that leads to large payoffs to corporations without clear gains to the local economy, a value-based attraction strategy can deliver benefits when attached to clusters and/or other regional assets.
Such strategies have increasingly been the focus of business development entities at the state and regional levels. In these cases, the competition is not based on price alone; networks, innovation resources, proximity to end-use markets and labor pools can make the region distinctive. Northeast Ohio should leverage its distinctive assets and work in close connection with the state to realize the potential of foreign direct investment. According to the U.S. Department of Commerce, nationally, foreign direct investment grew in excess of 6 percent annually from 2009 to 2014,47 roughly two to three times the rate of the overall economy. It now represents 6.8 million direct jobs, $57 billion in R&D spending and 23 percent of exports.48 According to the regional business development entity Team NEO, there are more than 400 foreign companies with investments in Northeast Ohio, representing 40 countries and more than 62,000 jobs.
Myriad business development entities, including cities, counties, the state, chambers, regional intermediaries, port authorities and others, provide services to companies across the region. These entities often use different data sources and metrics and are frequently uncoordinated. The result, according to companies and site selectors, is a confusing cacophony of voices and, in some scenarios, entities working at cross purposes.
While Team NEO and its partners have worked to rectify this, alignment of efforts has moved in fits and starts and has focused on a subset of entities advancing business development, largely excluding the public sector. Coordination needs to move to a higher level so that the region can present a more unified front to its most promising employers and to the rest of the world.
Strengthen public and private sector coordination to improve overall business environmentC.
Increase concentration of core traded sector companies through targeted attraction efforts

40 The Two Tomorrows
05 - Job Creation
Own the future of the production economy.
For too long, the region has been ambivalent about where production
fits into Northeast Ohio’s future. Production is part of the region’s
identity and should be celebrated. This means a shared future
of production strategy at the local, regional and state levels that
incorporates technology, workforce and marketing. Even more
importantly, it means a strong civic commitment to becoming a
global leader in our chosen arenas.
02:JOB CREATION STRATEGY

41The Two Tomorrows
05 - Job Creation
In Northeast Ohio, there exist thousands of companies with established positions, extensive industry supply chains, know-how in companies and universities, robust professional/financial services and an aging but still existing cadre of experienced people.
While traditional manufacturing subsectors are declining nationally and regionally, the region retains significant strength in manufacturing—a competitive advantage on which Northeast Ohio must build. Manufacturing comprises 20 percent of GRP and 26 percent of its traded sector employment,49 representing more than 265,000 jobs.50
And while real wages have fallen in recent decades, the average wage for a skilled employee is still $52,000 per year, significantly higher than many other industries for given skill levels.51 Over the last 10 years, for jobs requiring a high school diploma or less, manufacturing paid higher average hourly wages ($17.93) than health care and social assistance ($15.17), retail ($16.49) and accommodation and food services ($14.72).52
As the rest of the world clamors to build clusters in advanced manufacturing, Northeast Ohio already possess many preconditions for success. A look at the concentration of firms in the robotics industry alone is one example of
An interesting phenomenon: while Northeast Ohio jobs in manufacturing are down more than 10 percent from 2007, actual output of goods and services increased 2.4 percent. This creates conflicting narratives about economic health. In earlier decades, much of the regional and national decline in manufacturing jobs resulted from offshoring of production to lower-cost economies. More recently, however, Northeast Ohio companies have leveraged new technologies and production materials to produce more with less.
Improvements in productivity are critical to the health and competitiveness of the region’s manufacturing base. In the long term, economic theory suggests these productivity gains should be good for the overall economy and those employed in manufacturing, as rising productivity creates room for wage gains and standard of living increases.
However, it also presents three major challenges:
1. Productivity gains often result in job losses. Although productivity gains may result in sales increases or better quality jobs, history suggests the total number of jobs will be lower.
2. Productivity gains do not automatically translate into wage increases. While productivity creates room for wage increases, such increases have not manifested in recent years. Instead, global market pressures and uncertainties, and fragile labor markets have meant most of the gains from productivity have accrued to customers and owners rather than workers.
3. New technologies that lead to productivity gains often require new workforce skills and higher levels of preparedness, resulting in job gains that are increasingly bifurcated between low and high skill.
Northeast Ohio’s strong starting point. Ohio has the second largest share of all U.S. industrial robots of any state in the country, and Youngstown ranks sixth among the country’s 100 largest MSAs in terms of industrial robots per 1,000 workers.53
Other work to advance the production economy is underway across Northeast Ohio. The region is home to America Makes, the National Additive Manufacturing Innovation Institute. Institution-specific initiatives focused on what is next in manufacturing include The Richard Desich SMART Commercialization Center for Microsystems at Lorain County Community College; Case Western Reserve University and Cleveland State University’s partnership targeting the Internet of Things; the University of Akron’s National Center for Education and Research on Corrosion and Materials Performance; and Kent State University’s Glenn H. Brown Liquid Crystal Institute.
All of these initiatives are important. Much more needs to happen to connect these building blocks to the rapidly changing environment, embrace opportunities and scale this work. And this work must be integrated with talent development strategies, as discussed in the Job Preparation section. The future of production is advancing rapidly as digital technologies dramatically change how products are made, and the introduction of new materials is altering the functionality and economics of products.
The blessings and challenges of increased productivity

42 The Two Tomorrows
05 - Job Creation
Go big(ger) in the bioscience industry.
More than a decade ago, a concerted effort began to leverage
existing innovation assets and build off of a small but promising
bioscience industry to transform that industry into a driver of the
region’s economy.
03:JOB CREATION STRATEGY

43The Two Tomorrows
05 - Job Creation
Growth of Biomedical GRP: 2000 – 2016
Medical Device Manufacturing
Pharmaceutical and Therapeutics
$billion
Research & Development and Labs
$6.0
$5.0
$4.0
$3.0
$2.0
$1.0
'00 '01 '02 '03 '04 '05 '06 '07 '08 '09 '10 '11 '12 '13 '14 '15 '16
Biomedical GRP is $5.6 Billion
The GRP for the biomedical industry in Northeast Ohio has steadily increased since 2000, with a minor dip in 2009 as a result of the recession. It has recovered to become a $5.6 billion industry in 2016.
Source: Moody’s Economy.com
Between 2000 and 2016, the bioscience industry grew by 59 percent to
Efforts to grow the bioscience industry have included targeted business attraction, assistance to established companies and assistance to early-stage companies. BioEnterprise, a collaboration between Cleveland Clinic, Case Western Reserve University and University Hospitals, with support from the state of Ohio and the philanthropic community, leads these efforts. It has worked with more than 400 companies that have raised more than $2.3 billion in capital.
The bioscience industry includes medical device manufacturing, pharmaceuticals and health-related IT. The multiple elements reflect the growing complexity of sector-based strategies and the need for alignment across sectors (for example, shared talent strategies across IT needs generally, as well as an understanding of the specific needs of health IT). Continued growth will require ongoing attention to capital attraction, services to entrepreneurs, talent development strategy and attraction of new businesses, all of which require leadership, organization and funding.
$5.6 billion in GRP.
44 The Two Tomorrows
05 - Job Creation
Commit to the next new industry cluster(s).
Efforts to grow the bioscience industry have led to real, economically
significant results. To prosper and compete as an economy of the
future, the region needs to commit to similarly intensive efforts
to grow other industries or industry functions. While efforts are
underway to bolster the flexible electronics, advanced energy and
water technology industries, it is not yet clear if any of these emerging
opportunities offer the growth potential of the bioscience industry.
04:JOB CREATION STRATEGY

45The Two Tomorrows
05 - Job Creation
To advance a next cluster, the region should:
Define the growth potential of the industry, including the potential share to be captured by Northeast OhioA.
Identify regional assets that provide a competitive advantageB.Identify other potential cluster benefits (e.g., environmental, marketing, community development) that may bolster the region’s economic prospects beyond direct cluster growthC.Develop a leadership body capable of bringing attention and funding to the cluster, if the first two steps suggest viabilityD.

46 The Two Tomorrows
05 - Job Creation
Encourage and fuel entrepreneurship of all types.
Sustaining an environment supportive of all types of entrepreneurs is
essential to a healthy economy: regions with more entrepreneurs, including
those who operate small businesses, have less economic disparity.54
05:JOB CREATION STRATEGY

47The Two Tomorrows
05 - Job Creation
A new business formation strategy should:
A.A coordinated effort by research institutions, businesses, philanthropy and the public sector that began more than a decade ago rejuvenated the region’s capacity for nurturing entrepreneurs. Through regional efforts and state-leveraged resources, the region has heavily emphasized high-tech entrepreneurship and the catalytic economic effect of company formation in the traded sector.
A network of organizations provides advice, services and capital to early-stage companies with high-growth potential. More than 1,150 startups have been supported by the Northeast Ohio ESP Network and those companies have raised more than $2 billion in capital and have created more than 10,000 jobs.55 The sale of CoverMyMeds to McKesson in January 2017 for $1.1 billion56 is recent evidence of the health of the region’s entrepreneurial environment. The nine-year-old company in the health IT space received support, including capital, from members of the Northeast Ohio ESP Network to help accelerate its growth. The story of Northeast Ohio’s entrepreneurial resurgence is in part the story of new capital. State policies created a variety of new capital pools that were supported by private, philanthropic and local dollars. The ESP, for example, provides state dollars to support a variety of investment funds that are available to young, high-growth potential companies. These investment funds range from early-stage capital for pre-revenue companies to later-stage capital for companies that are on the verge of aggressive growth.
Attract capital to support high-tech entrepreneurship
However, relatively recent changes in state policy and changes in the venture marketplace have reduced the amount of venture capital available for companies, especially ones toward the middle of their startup journey. Demand for capital far exceeds supply and despite several successes, such as CoverMyMeds, the returns generated by Northeast Ohio’s startups have not yet attracted sufficient out-of-region capital to meet that demand.
New state and regional policies are needed to subsidize and attract venture capital to the region to sustain the improvements made over the last decade. Foundations, large institutions with endowments, and the region’s largest companies all can play a role in addressing this need by advocating for state policies that make it more attractive for them to allocate investment capital into funds focused on meeting the growing demand for venture dollars in Northeast Ohio.
48 The Two Tomorrows
05 - Job Creation
B. C.Non-traded sector entrepreneurship can be beneficial to neighborhood redevelopment, but the net impact on overall economic growth is unclear. To inform resource prioritization for neighborhood-based, population-serving entrepreneurial activities, it would be helpful to quantify potential import substitution effects, as well as wealth retention impacts for various kinds of startups (e.g., does a local business retain more wealth in the community than a franchise or a chain?). An equally important effect to understand is the degree to which neighborhood-based entrepreneurship serves as an entry point into the economy for residents who are otherwise disconnected. Innovative programs such as BoxSpot in the Central neighborhood or the Midtown Tech Hive, both in Cleveland, should be closely monitored and enabled elsewhere if successful.
Northeast Ohio has many exciting assets through which to strengthen its entrepreneurial climate. JumpStart has built a powerful capability to provide mentorship, capital and other services to entrepreneurs across Northeast Ohio. The state and JumpStart have supported locally driven initiatives such as Bounce in Akron, the Youngstown Business Incubator, NEOMED’s REDIzone®, Great Lakes Innovation and Development Enterprise (GLIDE) at Lorain County Community College, and Flashstarts. Newer co-working and community programming efforts are being propelled by DigitalC (Midtown Tech Hive), Case Western Reserve University (think[box]) and others. And there are many more networking and community efforts such as Launch League, TechPint, Ladies Who Launch and the Cleveland Culinary Launch and Kitchen.
Additionally, universities are increasing their commitment to entrepreneurship. This explosion of activity and experimentation is to be encouraged rather than controlled. Long-term community commitments should be put toward activities that are entrepreneur-led, highly inclusive and provide programs and services that reach all segments of the entrepreneurial community.57
As Northeast Ohio focuses on the important work of driving a continuously regenerating economy by innovating within existing industries, building new clusters and supporting young, growing companies, it cannot worry just about growth. To achieve economic transformation, the region must think more robustly about job creation, make sure it’s creating jobs that offer opportunities for workers of multiple skill levels, provide a path to a living wage and make effective use of existing infrastructure.
Understand economic impact of and support neighborhood-based entrepreneurship
Promote a culture of entrepreneurship, including in our higher education institutions

49The Two Tomorrows
05 - Job Creation
Systemic Racial Inclusion: Digging Into The Data
Inequality in earnings by race are staggering: a white worker in Northeast Ohio earns approximately $20,000 more annually than a black worker.58 Racial wage inequality is increasing, and gaps are not explained by differences in levels of education. A 2016 analysis from the Economic Policy Institute finds: “Black male college graduates (both those with just a college degree and those who have gone beyond college) newly entering the workforce started the 1980s with less than a 10 percent disadvantage relative to white college graduates but by 2014 similarly educated new entrants were at a roughly 18 percent deficit.” 59
This challenges persistent narratives that closing gaps in educational attainment will close racial earnings gaps. Though this work is critical and must continue, strategies to advance economic equity must also ask: what else requires attention?
A forthcoming analysis60 disaggregates 2016 Cleveland MSA compensation data by race and suggests two considerations: the occupation of employment and wages earned by workers within occupations. White workers are disproportionality represented in occupations like management, which pay higher wages on average, while workers of color are disproportionality represented in occupations like health care support, which pay lower wages on average. Further, within occupations, workers of color often earn less on average than white workers. For example, in Northeast Ohio a
white worker in a management occupation earned an estimated $85,000 annually, on average, while a worker of color earned an estimated $66,000 annually, on average. The result: of the $69 billion earned each year in compensation by workers in the Cleveland MSA, $58 billion is earned by white workers and $11 billion is earned by workers of color. White workers earn more than $6 billion more than would be expected if compensation were distributed in accordance with the demographics of the working age population of the region.
These racial income disparities contribute to persistent inequality. Leaders of all sectors must ask: how does my work contribute to or combat this paradigm?


51The Two Tomorrows
06 - Job Preparation
Job Preparation

52 The Two Tomorrows
06 - Job Preparation
As a vast body of research and, more practically, conversations with
employers make clear, the vitality of a region’s economy depends
on its ability to connect people to good jobs and firms to workers
with the appropriate skillsets. Despite the work of many talented and
committed individuals and organizations, open positions go unfilled.
Regional reports find a persistent disconnect between the expressed
demand for workers and preparation levels of job seekers.61 New
jobs are often not “good” jobs: more than half of new jobs from the
25 fastest growing regional industries pay wages below $35,000 a
year.62 And adults disconnected from work find opportunities limited
by inaccessibility of quality, affordable child care, tradeoffs between
earning income and increasing skills, and past criminal convictions.
Now hiring: not you.
There is an abundance of job seekers and an abundance of open positions,
so what’s the problem?

53The Two Tomorrows
06 - Job Preparation
This results in real economic costs: businesses report workforce shortages as a limiting factor for growth, people earn less than they otherwise might and Northeast Ohio loses deals when it is unable to demonstrate how its workforce can meet the needs of potential new businesses. Heroic, institution-specific strategies will not be enough to remedy the current situation.
Job preparation is a team sport requiring high performance and increased alignment across a variety of institutions. Northeast Ohio will have achieved high-performing talent development systems when they are data-informed, demand-driven, sector-based, advancement-focused and rely on responsiveness from aligned organizations, institutions and programs to near- and long-term changes in market demand. For example, knowing 75 percent to 85 percent of regional jobs require medium-to-high digital literacy63 can improve job preparation outcomes only if, in response to the data, training is made available and tied to other needed services (e.g., career coaching, job search assistance, transportation).
Further, regional employers must actively engage in problem-solving. While business engagement in job preparation work to date has provided important insight, too often the work has been based on an implicit assumption that any “fix” to job preparation is the responsibility of service providers, the public sector or individual job seekers.
While all of the aforementioned matter, employers must also reflect on their own policies and practices that make filling open positions more difficult. Are wages competitive? Are job requirements clear? Are education and experience prerequisites reasonable for open positions? Are internal policies like shift schedules, background checks and drug screening requirements excluding large numbers of potential workers? If so, are the policies reasonable? In a tightening labor market, now is the time for reflection and behavior change.
High-performing, aligned efforts to advance effective job preparation strategies do exist within the region. For example, Summit County-based ConxusNEO brings together business, public sector, education and philanthropy to discuss data, industry-specific talent needs in manufacturing and IT, and potential workforce programming. Also in Summit County, the Summit Education Initiative (SEI) uses student performance data and predictive indicators to inform strategy and programing for education.
HIT in the CLE, led by cluster development organization BioEnterprise, informs curricula for school districts based on input from regional companies with openings in the growing health IT field. The Regional IT Engagement (RITE) Board, housed by Lorain County Community College, has focused on bringing together companies from a broad range of sectors with common IT hiring needs to more consistently communicate demand, work with institutions of higher education on curricula and experiential learning and support hiring fairs. And through the Mahoning Valley Manufacturers Coalition, companies work together to identify common challenges and opportunities and collectively champion solutions, particularly the shared need for a skilled workforce.64
Northeast Ohio must more consistently develop these and other networks across high-demand sectors and occupations; enable the aggregation of industry data and employer input; and enable connections to aligned networks of service delivery partners that use the industry information to inform job preparation efforts.
High-performing job preparation networks serve as the foundation from which leaders can work together to:
• Build skills for well-paying, in-demand jobs of today and tomorrow
• Improve job quality, through efforts to raise the floor and build pathways to advancement
• Reduce barriers to employment, ultimately improving outcomes for people and businesses

54 The Two Tomorrows
06 - Job Preparation
JOB PREPARATION
STRATEGY
Build skills for well-paying, in-demand jobs of today and tomorrow.
By 2020, the majority of jobs in Ohio will require education beyond high
school, and adults with higher levels of education will be more likely
to be employed and to be employed in jobs that pay higher wages.65
01:

55The Two Tomorrows
06 - Job Preparation
An analysis issued by Team NEO in June 2017 found substantial misalignment between skill attainment of Northeast Ohio’s workforce, as measured by estimated certificates and degrees, and estimated demand, as measured by job openings in the highest growing industries. For example, the analysis found that demand for computer and IT workers exceeded the number of post-high school credentials awarded by nearly three times (see page 56).
Simultaneously, students coming out of high school are often not ready for the next step, whether that is direct employment, technical or credentialed training or bachelor’s degrees. Offered curriculum must become more consistently relevant to today’s highest demand and highest paying industries. For example, less than 50 percent of public high school students in Cuyahoga County have access to computer science courses,66 part of a knowledge base for competitive IT openings. Further, upon leaving school, earn-and-learn opportunities are limited, excluding too many adults of all ages from moving into and completing post-secondary education. And culturally, technical training has been devalued, resulting in decreased exposure to well-paying opportunities in fields like manufacturing or trades.
To build skills relevant to today’s economy, Northeast Ohio should drive toward more consistent adoption of industry-informed curricula and career academies, and build more opportunities for apprenticeships in traditional and non-traditional industries. Meanwhile, the region’s employers must reassess how they measure readiness for work and experiment with skills-based hiring opportunities.
• A small learning community
• A college-prep sequential curriculum with a career theme
• An advisory board that forges partnerships with employers, higher education institutions and the community
Source: National Career Academy Coalition
A. School reform in districts across the region, including the Cleveland Metropolitan School District, Akron Public Schools, Lorain City School District, and Youngstown City School District, offers an opportunity to dramatically improve the educational offerings for Northeast Ohio students. While the reform work is and will be an expansive and community-wide effort in each of these local places, encouraging industry-informed curricula is one critical common theme.
The districts in Akron and Cleveland have already embraced and advanced one such strategy: promotion of career academies aligned with industry needs. This approach is supported by national research that suggests investments in career-related experiences during high school can produce substantial and sustained improvements in labor market prospects and transitions to adulthood. For example, in a longitudinal study, MDRC, a nonprofit, nonpartisan education and social policy research organization, found that career academies produced sustained earnings gains of 11 percent more per year for the academy group members than for individuals in the non-academy group.67 Local circumstances will determine the best public school district interventions; this is one strategy with potential.
�Industry-informed�curricula�and��career�academies
Key components of career academies:

56 The Two Tomorrows
06 - Job Preparation
Misalignment of Skills, DemandDemand��
2015 AlignmentCredentials��
Awarded�2014
IT
Computer & IT Workers 16,638 5,995
Manufacturing & Construction�
Metal & Plastic Workers 2,938 1,016
Installation, Maintenance & Repair Workers 4,497 1,764
Skilled Production Workers 5,538 3,112
Construction Trade Workers 2,329 1,946
Health
Health Diagnosing & Treating Pracitioners 20,122 11,273
Health Technologists & Technicians 6,945 7,809
Health Therapist Aides & Support Workers 818 5,298
Nursing & Home Health Aides 4,070 1,888
Life Sciences/Engineering
Architects & Engineering Technicians 1,740 1,639
Engineers 5,257 2,283
Life Science Workers 1,718 10,490
Finance & Business Services
Financial Clerks 4,913 1,928
Financial Specialists 5,612 3,417
Information & Record Clerks 8,154 1,959
Secretaries & Administrative Assistants 3,707 2,188
Management
Managers, Professional & Health 8,869 22,720
Supervisors of Skilled Workers 2,855 4,857
There is more demand than supply of credentials
Demand and supply appear in relative balance
There is more supply of credentials than demand
Source: Team NEO

57The Two Tomorrows
06 - Job Preparation
B. C. In recent years, public and private sector leaders have demonstrated increased interest in the reinvigoration of apprenticeship training programs. Industries with defined apprenticeship pathways, like manufacturing, are exploring ways to connect with their future workforce. The U.S. Department of Labor reports that 87 percent of apprentices are employed after completing their programs, with an average starting wage above $50,000.68 In 2015, the Department of Labor awarded nearly $3 million to the Mahoning Valley and neighboring counties for the adoption of an apprenticeship model to help manufacturers in the region find highly skilled, credentialed employees. And through MAGNET’s Early College Early Career program, educators and businesses are working together to start high school juniors on a manufacturing apprenticeship program that includes opportunities to pursue higher education.
Other areas of the country are experimenting with defined apprenticeships in non-traditional industries like retail and IT. Employers in these industries recognize a need to define a path to advancement for their entry-level workforce. The message is consistent: a combination of skills, on-the-job training and continuing education is important, and apprenticeships provide a structure within which an individual can more clearly communicate knowledge and skills.
To get an interview—let alone a job—an individual must be able to efficiently and effectively communicate a skill set that meets a business need. In recent decades, hiring managers have increasingly relied on the level of education (high school diploma, “some college,” associate’s degree, bachelor’s degree, etc.) as a proxy for a needed skill set. As confidence in secondary school education as a proxy for needed skills eroded, education requirements increased. The higher the education requirement, the higher—and more expensive—the barrier to entry, particularly for residents with lower incomes who often cannot afford higher education fees or the time out of the workforce to attend school.
In response to this reality, community efforts have often focused on improving access to and affordability of higher education. This work is vitally important and remains critical to long-term economic competitiveness. However, in addition to promoting educational attainment, we should understand when and where skills-based approaches can improve outcomes for individuals and businesses.
Analysis of research from prior decades indicates skills are more predictive of on-the-job success than any other indicator, including educational attainment or in-person interview,69 suggesting effective use of skills scores could lower costs for job seekers and hiring managers alike. A current regional effort called TalentNEO is investigating where skills scores might more effectively connect un- and under-employed residents to open opportunities. Improved applications could include:
• Matching of individuals to training, increasing the likelihood of earning an industry credential (and, ultimately, employment).
• Matching individuals with entry-level jobs, through the use of skills scores as a proxy for experience, education or both.
• Matching incumbent workers with advancement opportunities, using skills scores to source high-potential frontline workers.
Apprenticeships�in�manufacturing�and�beyond Skills-based�hiring

58 The Two Tomorrows
06 - Job Preparation
Improve job quality, through efforts to raise the floor and build
pathways to advancement.
02:JOB PREPARATION
STRATEGY
Northeast Ohio has the opportunity to build on lessons from
a recent workforce initiative that demonstrated significant impact.

59The Two Tomorrows
06 - Job Preparation
A. Nearly 50 percent of jobs created in recent years by the 25 fastest growing industries in Northeast Ohio are in industries that, on average, pay below a living wage.70 Nationally, 40 percent of the U.S. labor force is made up of contingent workers, including workers who are temporary, part-time, on-call, independent contractors or self-employed.71 Low wages, lack of job security and unpredictable hours are characteristics of low-quality jobs. With a tightening labor market, national workforce conversations have expanded to include a push for improved job quality, such as schedule improvements, wage hikes and the balance between a temporary and permanent workforce.
Issues of job quality highlight the dangers of an “any job is a good job” approach to workforce. As observed by Steven Dawson in the Pinkerton Papers:
“A bad job is not simply the absence of a good job… . A bad job not only fails to pay enough for decent food and shelter for a worker’s family, but it can also risk her health, disrupt any chance for a predictable family life, undermine her dignity, and deny her voice within the workplace. And when a local economy hosts a large number of bad jobs, the community is forced to subsidize those bad jobs by paying for additional public benefits, tax credits and health care costs… . In short, bad jobs are a core driver of inequality and it is left to the rest of us to pick up the costs.”72
Raise�the�floor
Improvements in job quality include and go beyond wage improvements. Non-wage-based improvements can yield substantive increases in earnings. A randomized control trial evaluation of WorkAdvance, a national pilot with implementation sites in Northeast Ohio, led locally by Towards Employment, found that program participants averaged a 14 percent increase in earnings after two years over a control group—and later program enrollees in the five-year pilot achieved an average of a 22 percent increase in earnings, or close to $3,000 a year.
Notably, these results were achieved with a limited hourly wage impact. Most of the increased earnings came from other job quality improvements: those in the program group were more likely to be working a regular shift, full-time or in a permanent job, and more likely to report that in their current job their scope of work increased and offered many opportunities for career advancement. (For more on the results of this national pilot, see page 61, “The WorkAdvance Difference.”)
The region should follow the national trend and bring issues of job quality into the broader workforce conversation.
DRIVER OF INEQUALITY.”— THE PINKERTON PAPERS
“BAD JOBS ARE A CORE

60 The Two Tomorrows
06 - Job Preparation
B. Historically, business-focused talent development efforts have centered on attraction or development of high-skilled talent. For example, efforts to nurture CEOs for emerging companies through CEO-in-residence programs are robust and recognized as high-value business investments. Companies that invest resources in programs promoting educational attainment often target higher-wage, higher-skilled employees either explicitly, through requirements that educational pursuits are relevant to job duties, or implicitly, through reimbursement programs that require employees to bear initial out-of-pocket costs for education.
Less attention has been paid to needed investments in the frontline workforce. Simultaneously, internal career ladders have been broken, as it’s become harder to advance from the shop floor into jobs requiring advanced degrees, particularly in manufacturing.
Moreover, national “Welfare to Work” workforce reform more than two decades ago heavily prioritized job placement and devalued public investments in longer-term career-building activities such as job retention and training for in-demand occupations. This “any job is a good job” approach has stranded many individuals in low-wage work and left businesses dealing with high turnover rates.
Fortunately, the conversation is beginning to shift. Continued reductions in unemployment suggest a tightening labor market where talent will become a more competitive asset. While increased productivity will shift total labor force demand, both in sheer numbers of workers required and in types of openings, current projections still highlight the high demand for workers in industries from manufacturing and IT to health care and hospitality.
Build�pathways�for�advancement�
In the near term, workforce strategies able to build pathways for individuals improve competitiveness through an increased ability to respond to employer demand; in the longer term, improving competitiveness through connecting individuals to economic opportunity builds pathways out of poverty and reduces economic polarization.
More fortunately, Northeast Ohio has a leg up, having been a test site for WorkAdvance. Local organizations now have experience developing career pathways with career coaching and support services that increase the likelihood of advancement for individuals. Leaders in the public, private and nonprofit sectors should build upon this work by supporting the technical capacity for currently underfunded elements, like career coaching. Forthcoming groundbreaking research on opportunity industries from the Brookings Institution also suggests strong potential for improved data-based pathway development to increase the likelihood of success in advancement strategies.

61The Two Tomorrows
06 - Job Preparation
An individual navigating Northeast Ohio’s workforce system today often has trouble connecting to the right services at the right time, despite a myriad of successful program offerings. Over the last few years, leaders in Northeast Ohio tested the potential of a different approach through a national pilot initiative called WorkAdvance. Coordinated locally by Cleveland-based nonprofit Towards Employment, the five-year pilot was a randomized control trial, meaning some individuals received WorkAdvance services, and others did not, but were free to access other services.
The results showed WorkAdvance as a clear winner. Northeast Ohio program participants accessed more services; were 49 percent more likely to work in a targeted, in-demand industry (health care or manufacturing); and were more likely to be working a regular shift, full-time or in a permanent job, and in a job with opportunities for career advancement. On top of that, after two years, WorkAdvance participants’ earnings were on average 14 percent higher than the control group’s.
What is more, dollars for services delivered through WorkAdvance were used more efficiently, with participants nearly four times as likely to enter into technical training and more than four times as likely to complete training as those with access to the current system. The cost per participant through WorkAdvance ($5,200 to $6,700) was comparable to the cost of current service delivery.
What made the difference? A comprehensive set of services, tied to in-demand jobs in growing industries with a focus on advancement, not just job placement, delivered by and coordinated through an aligned network of industry partners and service providers.
For information on how WorkAdvance principles are being embedded locally, a copy of the local report or a briefing on the results, email [email protected].
The WorkAdvance Difference
THE “ANY JOB IS A GOOD JOB” APPROACH HAS STRANDED MANY INDIVIDUALS IN LOW-WAGE WORK AND LEFT BUSINESSES DEALING WITH HIGH TURNOVER RATES.

62 The Two Tomorrows
06 - Job Preparation
Reduce barriers to employment.Job placement and advancement for individuals is limited by the
types of available jobs and real and imposed barriers like criminal
histories, drug use, language barriers or inadequate geographic
access to quality, affordable child care and/or workforce services.
Increasingly, discussions centered on improving access to talent are
broadening to include removing barriers to employment.
03:JOB PREPARATION
STRATEGY

63The Two Tomorrows
06 - Job Preparation
Addressing non-skills-based barriers is a question of policy, practice and resource. It requires understanding the economic costs of these barriers to workforce participation, using the information to contribute to potential changes in policy and practice currently limiting individuals’ abilities to connect to opportunity and finding ways to tie flexible funding for supportive services to all workforce service delivery.
A. B. The limits posed by criminal backgrounds and the lack of access to quality, affordable child care are oft-cited barriers for un- and under-employed residents in Northeast Ohio. (Improved transportation access, also a critical need, is addressed in Chapter 07: “Job Access” on page 66.) Yet, the magnitude of these barriers is unknown. The number of un- and under-employed adults with criminal backgrounds has not been quantified, nor has the number or kinds of jobs that restrict hiring only to individuals with clean records.
Also unknown is how many adults in communities of economic distress are disconnected from the labor force because of lack of child care or how many leave or lose their jobs due to lack of family leave (though this burden is disproportionately borne by women73).
Significant and important work has focused on the kinds of policies (e.g., flexible working hours) businesses might consider in response to these challenges. But until these barriers to employment are viewed as an economic problem rather than a social service or individual problem, they are unlikely to garner the necessary support to advance meaningful improvements.
The region should support efforts to gather, analyze and report on relevant data, with a view toward understanding the economic costs of barriers faced by individuals and businesses, and the policies limiting change.
Increasingly, economic development, workforce and social service professionals are recognizing the interdependency of the disciplines and the necessity of working together to improve outcomes for people and businesses. Current work in Cuyahoga County, for example, is targeting the connection between funding from Temporary Assistance for Needy Families (TANF) and the Workforce Innovation and Opportunity Act (WIOA). However, many workforce funding streams limit the availability and flexibility of resources for supportive services, like transportation or child care assistance. Yet, research demonstrates improved outcomes are possible when appropriate services are available.74 To get the most out of funding directed toward higher-cost workforce services like training, there needs to be flexible funding for needed supportive services.
Done right, job preparation strategies can increase opportunities for people and expand the talent pool for businesses. If successful, that would be a victory for Growth & Opportunity.
Understand�the�economic�cost�of�barriers�to�employment�
Flexible�funding�pool�for�supportive�services
64 The Two Tomorrows
06 - Job Preparation
In Northeast Ohio, the black unemployment rate is roughly three times as high as the white unemployment rate.75
While many complex factors contribute to this persistent disparity, observable discrimination in hiring practices76 cannot be ignored. And this discrimination cannot be addressed through the provision of increased or improved workforce services to job seekers; hiring practices must be changed by employers making the hiring decisions. Adoption of processes that use skill assessments in hiring decisions is one strategy that can increase objectivity in hiring, decrease barriers to opportunity for job seekers and improve workforce diversity. For example, Mercy Health, a regional health ministry of Trinity Health and a partnership of hospitals and healthcare providers throughout Western Michigan, instituted new hiring and advancement practices beginning in 2010. One of the new practices introduced was an evidence-based selection process to promote objective hiring; this process included a skills-assessment. As a result, the health system realized significant improvements in both hiring diversity and workplace diversity. By 2016, 38 percent of the health system’s new hires and 20 percent of the workforce were people of color, up from baselines of 18 percent and 13 percent, respectively.77
Northeast Ohio has the baseline conditions to advance similar, meaningful improvements. Prominent businesses like MetroHealth are publicly acting to realize workforce diversity goals; local practitioners have experience implementing skills-based approaches to hiring through TalentNEO; and a tightening labor market provides motivation to act with urgency. Closing the racial unemployment gap will require employers to hire differently. Use of skills assessments offers one path forward.
Systemic Racial Inclusion: Hiring Practices

65The Two Tomorrows Report
Section Title
65The Two Tomorrows Report
Section Title
Job Access

66 The Two Tomorrows
07 - Job Access
As has been stated (it bears repeating), the vitality of a region’s
economy depends on its ability to connect people to good jobs and
firms to workers with the appropriate skillsets. Spatially—on both of
these counts—Northeast Ohio is falling short relative to other regions
in the U.S. and relative to its potential to be globally competitive.78
Good jobs: a long-distance
relationship.The vitality of a region’s economy depends on its ability to connect
people to good jobs.

67The Two Tomorrows
07 - Job Access
Increasing access to jobs will require changes in development, land use, transportation and other policies and practices that incentivize the outmigration of jobs, perpetuate institutional racism and exacerbate economic disparity.
Northeast Ohioans are using more land today than ever before. Cuyahoga County used twice as much land in 2002 as it did in 1948, despite having the same population in both of those years.79 Across Northeast Ohio, 13 of the 20 largest job hubs lost traded sector jobs between 2002 and 2015, while the overall number of jobs across the region held roughly constant.80 As jobs continue to disperse, the amount of infrastructure needed to support them—from roads to sewers to public transit—swells and the relatively flat economy cannot support the ever-growing costs.
Between 2000 and 2012, the number of jobs proximate to the average resident in Northeast Ohio declined 22 percent.81 It is no wonder that residents of Northeast Ohio’s core cities spend a greater share of their income on transportation than housing.82 Meanwhile, businesses have reported an inability to find reliable workers as their number one issue.83 The outmigration of people and jobs costs residents time and money, and it is undermining our competitiveness.
Northeast Ohio cannot continue to spread a flat job base over an ever-larger geography and remain competitive. To improve connections of people and jobs, job creation strategies need to occur in areas proximate to existing
population centers (bring jobs to people), and mobility solutions must make it easier for people to get to existing jobs (bring people to jobs).
Many issues related to job access—urban redevelopment, infrastructure spending, land use, etc.—are positioned as dividing urban and rural interests. In fact, in Northeast Ohio, the interests of rural, suburban and urban residents are more often aligned than they are divergent. This alignment is most evident in Wayne County and the community of Wooster. Coordinated land use and economic strategies have allowed the city of Wooster to strengthen its manufacturing base while also protecting the value and appeal of surrounding agricultural lands.
Shifting industrial and commercial infrastructure from urban cores to rural communities undermines both. The fate of the region’s urban cores, both large and small, is tied to whether Northeast Ohio can strengthen and sustain the vibrancy of its rural communities. More counties should follow Wayne County’s lead and coordinate land use and economic development planning, and develop investment strategies that leverage existing infrastructure and reduce the need to extend job sprawl. Older industrial communities ranging from small ones such as Louisville in Stark County and Conneaut in Ashtabula County, or large ones like Akron and Warren, will need additional resources to attract and retain jobs. Those same strategies will reduce pressure to convert valuable rural land into residential, commercial or industrial use.
Traded Sector Job HubsChange in Traded-Sector EmploymentNEO Region; 2002 – 2015
Partners across the region are working together to finalize
this job hubs map.
Loss of more than 20k jobs
Loss of 2k to 20k jobs
Loss of 2k to gain of 1k jobs
Gain of 1k to gain of 8k jobs
Gain of more than 8k jobs
Wayne
Lorain
Stark
SummitPortage
Geauga
Lake Ashtabula
Trumbull
Mahoning
Medina
Cuyahoga

68 The Two Tomorrows
07 - Job Access
JOB ACCESS
STRATEGY
Bring jobs to people.
Northeast Ohio’s land use trends result from a series of individual
decisions, but they are not merely the consequence of a free market.
Strategic investments in transportation, site improvement and
agricultural preservation and incentives to businesses can encourage
development patterns that improve the long-term connectivity of
people and jobs.
01:

69The Two Tomorrows
07 - Job Access
Economic development, land use and transportation planning (at the local and regional levels) have been uncoordinated. Northeast Ohio cannot continue to spread jobs across an ever-larger geography, especially in a flat to low-growth environment.
The region must align infrastructure and economic development investments and incentives to encourage industrial redevelopment in ways that use and build upon existing strengths while preserving and protecting valuable agricultural and environmental assets. This alignment can be achieved when leaders:
A. B. Job hubs are contiguous places with highly concentrated employment and multiple traded sector employers. Northeast Ohio’s job hubs account for more than 50 percent of traded sector jobs in the region (see map on page 70).84 Every county has at least one job hub. To align infrastructure and economic development investments and incentives, regional leaders must first share the same definition of job hubs and agree to prioritize future development in ways that reinforce them. Once agreed to, defined and prioritized jobs hubs can influence resources directed toward transportation infrastructure, site inventory and improvement and economic development incentives. (For more on the region’s job hubs, see www.jobhubsneo.org.)
Investments in transportation infrastructure can enable the outmigration of jobs. For example, in Cuyahoga County, the Harvard Road interchange on Interstate 271 enabled development of the Chagrin Highlands and the in-region movement of Eaton Corp., and the Avon exchange on Route 90 enabled the development of Avon and Westlake into a job hub and the in-region movement of Bendix Commercial Vehicle Systems LLC. These and many other companies made in-region moves for business reasons. The question is: Are the region’s investments in infrastructure and incentives encouraging business location decisions that support Northeast Ohio’s long-term economic vibrancy? Metropolitan planning organizations (MPOs) and economic developers understand the importance of transportation assets to company location decisions, yet they do not have the tools to prioritize development in a way that systematically connects transportation investments to economic priorities. Defining job hubs will enable MPOs and others with authority over transportation budgets to account for economic priorities in their decision-making.
Prioritize and build up regional job hubs
Realign transportation infrastructure and site development investments

70 The Two Tomorrows
07 - Job Access
Northeast Ohio Traded Sector Job HubsPartners in communities across the region are working together to finalize this job hubs map. The research will continue to expand regionally. This is a working draft.
Wayne
Lorain
Stark
Summit
Portage
Geauga
Lake Ashtabula
Trumbull
Mahoning
Medina
Cuyahoga

71The Two Tomorrows
07 - Job Access
C. D.Site selectors seeking industrial and commercial property for development typically prefer properties that are more than 30 acres in size, but the majority of identified inventory in Northeast Ohio does not meet this requirement: 30+ acre sites represent 64 percent of demand but only 19 percent of regional inventory.85 Team NEO maintains a site database of ready, available sites to market to businesses looking to expand or locate in Northeast Ohio. Identifying and collecting details on vacant land for industrial or commercial reuse requires time and resources. Defining regional job hubs can enable prioritization of site inventory in places that have been collectively identified as preferred for future growth. Further, strategies to aggregate smaller parcels into larger (30 acres or more) plots can be targeted in prioritized regional hubs.
Once cataloged and, if necessary, aggregated, sites often require improvement. Prioritization of regional job hubs can enable targeted investment in improvements like increased broadband access and remediation of brownfields or former industrial and commercial sites. Further, identification of priority redevelopment sites using the job hub definition could be used to encourage changes to the state investment philosophy toward site improvement, which strongly favors directing funding to outlying areas, a strategy that is undermining our region’s competitiveness. Brownfield strategies may have more upfront costs than developing greenfields or undeveloped sites, but the long-term costs associated with building and maintaining more infrastructure at the edges of the region are unsustainable.86
While the economy is regional, local elected and appointed officials are often judged on the ability to bring jobs—and the resultant tax base—to their locality. This leads to a perverse set of incentives that reward movement of companies around the region. Recent examples of incentivized in-region moves include the less-than-five-mile move of Riddell Inc. from Elyria to North Ridgeville, the less-than-10-mile move of Bendix from Elyria to Avon, and the 30-mile move of 7signal Solutions from Akron to Independence. While there was no doubt a logic for each of these as industrial transactions, the moves cost taxpayers and undermine the region’s competitiveness through the hollowing out of existing communities, decreased effectiveness of public transportation and increased costs of infrastructure, causing long-term fiscal problems for local governments.
Cooperative agreements where attraction and expansion gains are shared can change this dynamic. Site selection decisions are based on factors other than incentives, such as criteria considered by Riddell: “… access to and visibility from the interstate, quick movement on permits, services such as roads, sewage and electric, and the possibility of future expansion… moving quickly into a new facility and retaining its existing workforce.”87 All of these are reasonable to a modern business. This is also where longer-term strategic thinking is necessary. Instead of incentivizing regional movement, public dollars should be put toward improving sites within job hubs to make them more marketable to businesses, while simultaneously protecting valuable environmental and agricultural assets. This change could be the most important thing the region does to improve its competitiveness.
Engage in strategic site inventory and improvement
Implement anti-poaching agreements and regional revenue sharing

72 The Two Tomorrows
07 - Job Access
Better connect people to jobs.
The decline in “proximate jobs” is detrimental to all workers, but
is particularly acute for residents living in high-poverty areas who
are less likely to own or have access to a car. While the number
of nearby jobs declined by 22 percent from 2000 to 2012 for
the average Northeast Ohio resident, the number of nearby jobs
for those living in high-poverty neighborhoods in Northeast Ohio
declined by 31 percent.88
02:JOB ACCESS
STRATEGY
73The Two Tomorrows
07 - Job Access
This reduction in the number of nearby jobs leads to untenable choices: a commute by public transit that can be as long as three hours a day,89 an expensive commute by car or a significantly smaller set of employment options. This amounts to distance discrimination for residents living in the region’s urban cores. Black residents in the Cleveland MSA who commute on public transportation spend 15 percent, or seven minutes, more time commuting than white residents that also rely on public transportation. This distance discrimination is exacerbated by differing rates of car ownership by race across Northeast Ohio. In the Cleveland MSA, 6.8 percent of white residents do not own a vehicle, compared to 25.4 percent of black residents; the percentage of white households without a vehicle is 6.2 percent, 6.5 percent and 7 percent in Akron, Canton and Youngstown MSAs, respectively, compared to 22 percent, 19 percent and 19.3 percent for black residents of those same MSAs.90
Northeast Ohio leaders must make it easier for people to get to existing jobs, through advocating for a public transportation agenda, improved use of data analytics in decision-making by public transportation agencies and infusion of innovation into transportation solutions to bridge between legacy system designs and current population and job distributions.
A.A robust transportation agenda should include both state and local actions. At both levels, vocal business leadership will be central to improving the connections between people and jobs.
State context: Between 2000 and 2014, state funding levels for public transportation dropped by nearly 40 percent.91 The current absolute level of funding by the state of Ohio for public transportation is roughly equivalent to the absolute state funding level for public transportation provided in Alaska.92 The lack of state investment has left Northeast Ohio without sufficient match funding for millions of federal dollars.93 This all points to “a stark and steady abandonment of public transit by our state government”94 in a time when people and jobs are becoming more dispersed95 and national trends point to younger generations moving away from car ownership.96 Northeast Ohio leaders must call attention to the economic consequences of this disinvestment, and call on state legislators to prioritize this issue.
While local agendas will be tailored to local priorities, common points of leverage exist across communities. Parking costs and availability, zoning codes and walkability affect the quality and use of public transportation systems. Codifying these leverage points can enable local leaders to discuss the means through which to improve local transportation systems.
Articulate and advocate for a public transportation agenda
COMMUTES BY PUBLIC TRANSIT CAN BE AS LONG AS THREE HOURS A DAY.

74 The Two Tomorrows
07 - Job Access
B. C.Data-based route planning tools can help guide decision-making by public transportation agencies that face difficult tradeoffs when funding is reduced. Use of data analytics tools can also prompt new thinking about resource allocation and has been shown to improve the two most important factors driving satisfaction with transit—service frequency and travel time—with limited incremental cost.97 Moreover, the ability to demonstrate efficient and effective use of current public transit funding will ultimately be important in statewide discussions advocating for increased funding levels. Northeast Ohio leaders should ensure the region’s public transit agencies have the tools necessary to gather and make use of rider and potential ridership data.
Much of Northeast Ohio’s public transportation system was designed using a hub-and-spoke model. But the region’s jobs are no longer concentrated along existing public transportation routes, and as job and population density decreases, so do the economics of traditional public transportation. Advocacy efforts to increase state funding to address these shifts will take time to come to fruition. Meanwhile, residents are struggling to get to jobs and businesses are struggling to find reliable employees now. On-demand ride-sharing solutions may offer a bridge between legacy system design and current development patterns. Targeted experiments connecting disconnected neighborhoods to growing job hubs can provide a baseline for longer-term system reform.
In the near term, addressing issues of equity, poverty and talent shortages requires Northeast Ohio to drive for more effective connections between people and jobs. In the long term, the region’s economic competitiveness depends on strong, growing job hubs that bring jobs closer to people.
Improve use of data analytics by public transportation agencies for route planning and service improvements
Infuse innovation into transportation solutions to bridge between legacy design and current population and job distributions

75The Two Tomorrows
07 - Job Access
Residents of both rural and low-income urban communities can face digital isolation. Notably, urban communities without consistent, high-speed access are populated predominately by people of color, raising questions of whether this disconnect amounts to digital redlining. Meanwhile, entrepreneurs, independent contractors and full-time professionals are looking for places to innovate, work and learn.
Increasingly, innovation spaces across the region and the country are striving to simultaneously meet the needs of technology innovators and the digitally isolated. This is progress. And to meet this dual objective, new innovation spaces are choosing to locate closer to communities with low digital access.
Systemic Racial Inclusion: Inclusive Innovation Spaces
While a necessary precondition, geographic proximity alone won’t be enough to shift the dynamic from exclusive to inclusive. Attracting a diverse user base requires inviting diversity through deliberate attention to:
• Power: Who is empowered to make decisions about design and programming? Is the decision-making body reflective of the desired end-users?
• Proximity: Is the space embedded in the community whose residents it purports to serve? Is its location a walkable distance for surrounding residents?
• Programming: Are offerings in service to the residents of the community in which it is situated?
• People: Who actually uses the space? Who do area residents see using the space?
• Price: Can residents afford to access the innovation space?
Broader awareness of how to design and market innovation spaces so they are truly inclusive can differentiate Northeast Ohio communities, and bring greater digital access and entrepreneurial opportunities to more residents across the region.


77The Two Tomorrows
08 - How to Measure Progress
77The Two Tomorrows Report
Section Title
How To Measure Progress

78 The Two Tomorrows
08 - How to Measure Progress
The long-time focus of economic developers, politicians and other
civic actors across the nation (and globe) on traditional economic
success measures like job gains, gross product and per capita
income have encouraged narrow attention to growth activities and
simultaneously ignored whether gains have been shared by residents
of all races and across all places.
What gets measured gets done.
It is time to redefine how we measure progress toward a better tomorrow.

79The Two Tomorrows
08 - How to Measure Progress
Northeast Ohio has been forward-thinking in some respects. For example, geographic inclusion has been measured through regular reporting on changes in areas of economic distress, a proxy for changes in concentrated poverty. Individual organizations and programs have also consistently reported measures of racial inclusion.
The problem? These measures implied work to address economic opportunity was additive to work to address economic growth, and opportunity goals were often subordinated in favor of growth goals. Meanwhile, economic polarization and systemic racial exclusion are serious and growing threats to the region’s economic vibrancy. Our region’s definition of success must hold Growth & Opportunity as co-equal and mutually supportive. It’s time to redefine how we measure progress toward a better tomorrow.
Northeast Ohio will have achieved Growth & Opportunity and increased its global economic competitiveness when there is: a continuously regenerating economy creating good jobs and rising incomes for everyone.
Just as success measures should describe the kind of economy the region aims to have, benchmarks should ground our progress against metro areas with similar characteristics. This type of benchmarking helps uncover where Northeast Ohio is competitive and where the region might be falling short. For this analysis, peer economies include the MSAs of Cincinnati, Detroit, Columbus, Indianapolis, Buffalo, Baltimore, Chicago, Milwaukee and Pittsburgh. Economic units for data are typically MSAs, counties or census tracts. To understand the progress of Northeast Ohio, data analysis includes weighted averaging performance over the MSAs of Akron, Canton, Cleveland and Youngstown. Metro-specific scorecards are available in the Appendix.
Benchmarking and Data
ECONOMIC POLARIZATION AND SYSTEMIC RACIAL EXCLUSION ARE SERIOUS AND GROWING THREATS TO THE REGION’S ECONOMIC VIBRANCY.

80 The Two Tomorrows
08 - How to Measure Progress
Goal: A continuously regenerating economy creating good jobs and rising incomes for everyone.
Progress: There is work ahead, especially on equity.
A Continuously Regenerating Economy
A continuously regenerating economy has the prospect of sustained, long-term economic growth, propelled by a growing traded sector. It is also forward-looking, with innovative new ideas developed by a strong cohort of growing, young firms.
Northeast Ohio’s performance is below its peers, and it is making unsteady progress.
Success Measures and Progress
1. Outperform Peers in Traded Sector GMP Growth: Over the past five years, Northeast Ohio’s traded sector GMP grew at a compound annual rate of 2.9 percent, 0.4 percentage points less than peer economies over the same period.98
2. Outperform Peers in Young Firm Employment Growth: Between 2012 and 2016, employment at young firms across Northeast Ohio remained constant, with a compound annual growth rate of 0.1 percent. This was well behind the 2.5 percent annual growth rate of peer economies.99
An economy creating good jobs and rising incomes provides rising prosperity for its residents, employment for those who want it and economic security for its families.
Northeast Ohio is not currently meeting these goals, but is making progress against all measures.
Success Measures and Progress
3. Outperform Peers in Prosperity Increases: Northeast Ohio’s performance falls below its peers in the prosperity index tracked by the Brookings Institution’s Metro Monitor, but performance is improving.
4. Achieve Full Employment: Northeast Ohio will achieve this goal when 75 percent of working-age adults are employed. The region is moving closer to full employment, with 70 percent of working-age adults employed as of 2015. The difference between current employment and full employment translates to a need for roughly 123,000 more jobs in the region.
5. Provide Economic Security: Wage growth has been slow, and many new jobs pay below living-wage standards.100 Sixty-eight percent of Northeast Ohio families earned a living wage in 2016.101 The share of families earning a living wage has increased since 2012 but is still below the goal of 75 percent.
With Good Jobs and Rising Incomes

81The Two Tomorrows
08 - How to Measure Progress
For EveryoneWho is Responsible? Over What Time Period?
An economy for everyone provides access to opportunity regardless of race or place, evidenced by the reduction and eventual elimination of racial income and employment disparities, as well as by lifting residents out of areas of concentrated poverty.
This is the region’s challenge; current performance is extremely poor and getting worse.
Success Measures and Progress
6. Achieve Employment Equity: Eliminate racial unemployment disparities. Unemployment rates for black Northeast Ohio residents in 2016 were nine percentage points higher than for whites. This gap is larger than it was in 2013 for all MSAs except Cleveland. Similar gaps exist for Latino residents, although limited data prevents a full analysis for Latino residents or those of other races and ethnicities.
7. Achieve Income Equity: Eliminate racial income disparities. White workers earned $1,700 more per month on average than black workers in 2016, a gap that has increased since 2013.102 Again, data limitations prevented a full analysis for residents of other races and ethnicities.
8. Achieve Geographic Equity: Eliminate concentrations of poverty. The number of people living in areas of economic distress in Northeast Ohio increased by 31 percent from 2011 to 2015, to 238,000. One in 15 Northeast Ohioans now lives in an economically distressed neighborhood.103
As these measures make clear, much work remains. Achieving Growth & Opportunity is undoubtedly long-term work. It will require change across the systems, organizations and individuals that impact, influence and shape our region.
This work cannot wait. With a collective commitment to Growth & Opportunity goals, and new and refreshed strategies that advance job creation, job preparation and job access, Northeast Ohio can realize an inclusive and prosperous tomorrow.
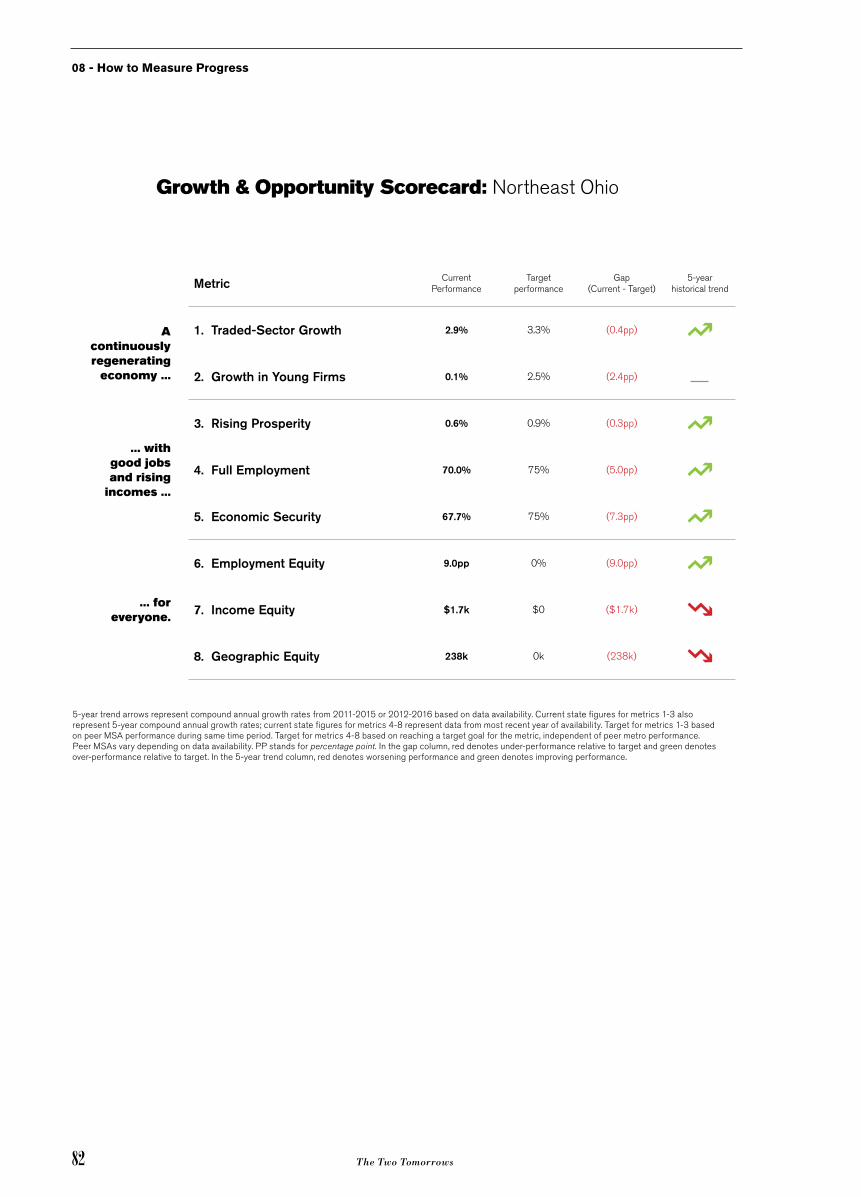
82 The Two Tomorrows
08 - How to Measure Progress
Growth & Opportunity Scorecard: Northeast Ohio
Metric Current Performance
Target performance
Gap (Current - Target)
5-year historical trend
A continuously regenerating
economy ...
1. Traded-Sector Growth 2.9% 3.3% (0.4pp)
2. Growth in Young Firms 0.1% 2.5% (2.4pp)
... with good jobs and rising
incomes ...
3. Rising Prosperity 0.6% 0.9% (0.3pp)
4. Full Employment 70.0% 75% (5.0pp)
5. Economic Security 67.7% 75% (7.3pp)
... for everyone.
6. Employment Equity 9.0pp 0% (9.0pp)
7. Income Equity $1.7k $0 ($1.7k)
8. Geographic Equity 238k 0k (238k)
5-year trend arrows represent compound annual growth rates from 2011-2015 or 2012-2016 based on data availability. Current state figures for metrics 1-3 also represent 5-year compound annual growth rates; current state figures for metrics 4-8 represent data from most recent year of availability. Target for metrics 1-3 based on peer MSA performance during same time period. Target for metrics 4-8 based on reaching a target goal for the metric, independent of peer metro performance. Peer MSAs vary depending on data availability. PP stands for percentage point. In the gap column, red denotes under-performance relative to target and green denotes over-performance relative to target. In the 5-year trend column, red denotes worsening performance and green denotes improving performance.

83The Two Tomorrows
09 - Our Conclusion
83The Two Tomorrows Report
Section Title
Our Conclusion

84 The Two Tomorrows
09 - Our Conclusion
Which tomorrow will you choose?
In the coming years, if Northeast Ohio does not build a continuously
regenerating economy that creates good jobs and rising incomes
for everyone, our region will be defined by its economic polarization.
When we understand the issues holding us back from Growth &
Opportunity and align our regional priorities, we can ascend above
average to extraordinary.
Northeast Ohio has the people and the assets to be successful. The
critical ingredients are civic will and alignment.

85The Two Tomorrows
09 - Our Conclusion
BEING AVERAGE IS A CHOICE. SO IS BEING EXTRAORDINARY.
WHICH TOMORROW WILL YOU CHOOSE?
Tell us at [email protected].
Building a transformative economy requires the public, private and nonprofit sectors to strategically and systematically coordinate efforts across the region. It takes time to identify effective systems and effort to commit necessary resources. And all regional economic and community development participants will need to take on risks and responsibilities that may challenge their traditional roles. We cannot just focus on top-line recovery efforts. We must dig deeper to bring everyone along.
Armed with these priorities and focused on these measures for progress, our region can achieve Growth & Opportunity. At the Fund, we will use these priorities to shape our collective actions and inform the individual actions of our members. We also hope these priorities will serve as a basis to align efforts with our partners from business, the public sector, neighborhood-based leadership, higher education, and national communities of practice.

86 The Two Tomorrows Report
Section Title
• David Abbott
• Abington Foundation
• Akron Community Foundation
• Eva L. and Joseph M. Bruening Foundation
• Burton D. Morgan Foundation
• Case Western Reserve University
• The Catherine L. and Edward A. Lozick Foundation
• Cleveland Neighborhood Progress
• Cleveland State University
• Community Foundation of Lorain County
• Community Foundation of the Mahoning Valley
• COSE/Greater Cleveland Partnership
• Cuyahoga Community College
• Cuyahoga County
• Deaconess Foundation
• Early Stage Partners
• Elizabeth Ring Mather and William Gwinn Mather Fund
• FirstEnergy Corp.
• Forest City Realty Trust
• Frances Shoolroy Charitable Fund
• Fred A. Lennon Charitable Trust
• Frederick W. and Janet P. Dorn Foundation
• GAR Foundation
• The George Gund Foundation
• The George W. Codrington Charitable Foundation
• Hollington Family Foundation
• Robert and Sarah Jaquay
Who We Are…

• John Huntington Fund for Education
• JPMorgan Chase Foundation
• Katherine and Lee Chilcote Foundation
• Kent H. Smith Charitable Trust
• Kent State University Foundation
• Lorain County Community College
• McGregor Foundation
• Meisel Family Foundation
• Nathan and Fannye Shafran Foundation
• Northeast Ohio Medical University (NEOMED)
• The Raymond John Wean Foundation
• Reinberger Foundation
• Robert W. Briggs Fund of the Akron Community Foundation
• Saint Luke’s Foundation
• Sears-Swetland Family Foundation
• Sisters of Charity Foundation of Canton
• Sisters of Charity Foundation of Cleveland
• Stark Community Foundation
• Summa Health System
• Third Federal Foundation
• The Trumbull 100
• Wayne Growth Partnership
• Westfield Insurance Foundation
• Thomas and Shirley Waltermire
• Brad and Amy Whitehead
• The Youngstown Foundation


89The Two Tomorrows
10 - Appendix
Appendix

90 The Two Tomorrows
10 - Appendix
Growth & Opportunity Scorecard: Akron MSA
Current Performance
TargetPerformance
Gap (Current - Target)
5-year historical trendMetric
Traded-Sector Growth 4.8% 3.3% 1.5pp
Growth in Young Firms 2.5% 2.5% 0.0pp
Rising Prosperity 1.3% 0.9% 0.4pp
Full Employment 70.4% 75% (4.6pp)
Economic Security 69.5% 75% (5.5pp)
Employment Equity 9.0pp 0% (9.0pp)
Income Equity $1.8k $0 ($1.8k)
Geographic Equity 30.4k 0k (30.4k)
A continuously regenerating
economy ...
... with good jobs and rising
incomes ...
... for everyone.
Growth & Opportunity Scorecard: Canton MSA
Metric Current Performance
TargetPerformance
Gap (Current - Target)
5-year historical trend
Traded-Sector Growth 2.8% 3.3% (0.5pp)
Growth in Young Firms (2.4%) 2.5% (4.9pp)
Rising Prosperity 2.0% 0.9% 1.1pp
Full Employment 71.0% 75% (4.0pp)
Economic Security 71.0% 75% (4.0pp)
Employment Equity 10.1pp 0% (10.1pp)
Income Equity $1.1k $0 ($1.1k)
Geographic Equity 11.0k 0k (11.0k)
A continuously regenerating
economy ...
... with good jobs and rising
incomes ...
... for everyone.

91The Two Tomorrows
10 - Appendix
Growth & Opportunity Scorecard: Cleveland MSA
Metric Current Performance
TargetPerformance
Gap (Current - Target)
5-year historical trend
Traded-Sector Growth 2.8% 3.3% (0.5pp)
Growth in Young Firms (0.5%) 2.5% (3.0pp)
Rising Prosperity 0.2% 0.9% (0.7pp)
Full Employment 70.9% 75% (4.1pp)
Economic Security 67.1% 75% (7.9pp)
Employment Equity 8.7pp 0% (8.7pp)
Income Equity $2.0k $0 ($2.0k)
Geographic Equity 147.0k 0k (147.0k)
A continuously regenerating
economy ...
... with good jobs and rising
incomes ...
... for everyone.
Growth & Opportunity Scorecard: Youngstown-Warren MSA
Metric Current Performance
TargetPerformance
Gap (Current - Target)
5-year historical trend
Traded-Sector Growth 0.4% 3.3% (2.9pp)
Growth in Young Firms 1.2% 2.5% (1.3pp)
Rising Prosperity 0.8% 0.9% (0.1pp)
Full Employment 65.1% 75% (9.9pp)
Economic Security 65.2% 75% (9.8pp)
Employment Equity 11.3pp 0% (11.3pp)
Income Equity $1.0k $0 ($1.0k)
Geographic Equity 49.5k 0k (49.5k)
A continuously regenerating
economy ...
... with good jobs and rising
incomes ...
... for everyone.
5-year trend arrows represent compound annual growth rates from 2011-2015 or 2012-2016 based on data availability. Current state figures for metrics 1-3 also represent 5-year compound annual growth rates; current state figures for metrics 4-8 represent data from most recent year of availability. Target for metrics 1-3 based on peer MSA performance during same time period. Target for metrics 4-8 based on reaching a target goal for the metric, independent of peer metro performance. Peer MSAs vary depending on data availability. PP stands for percentage point. In the gap column, red denotes under-performance relative to target and green denotes over-performance relative to target. In the 5-year trend column, red denotes worsening performance and green denotes improving performance.
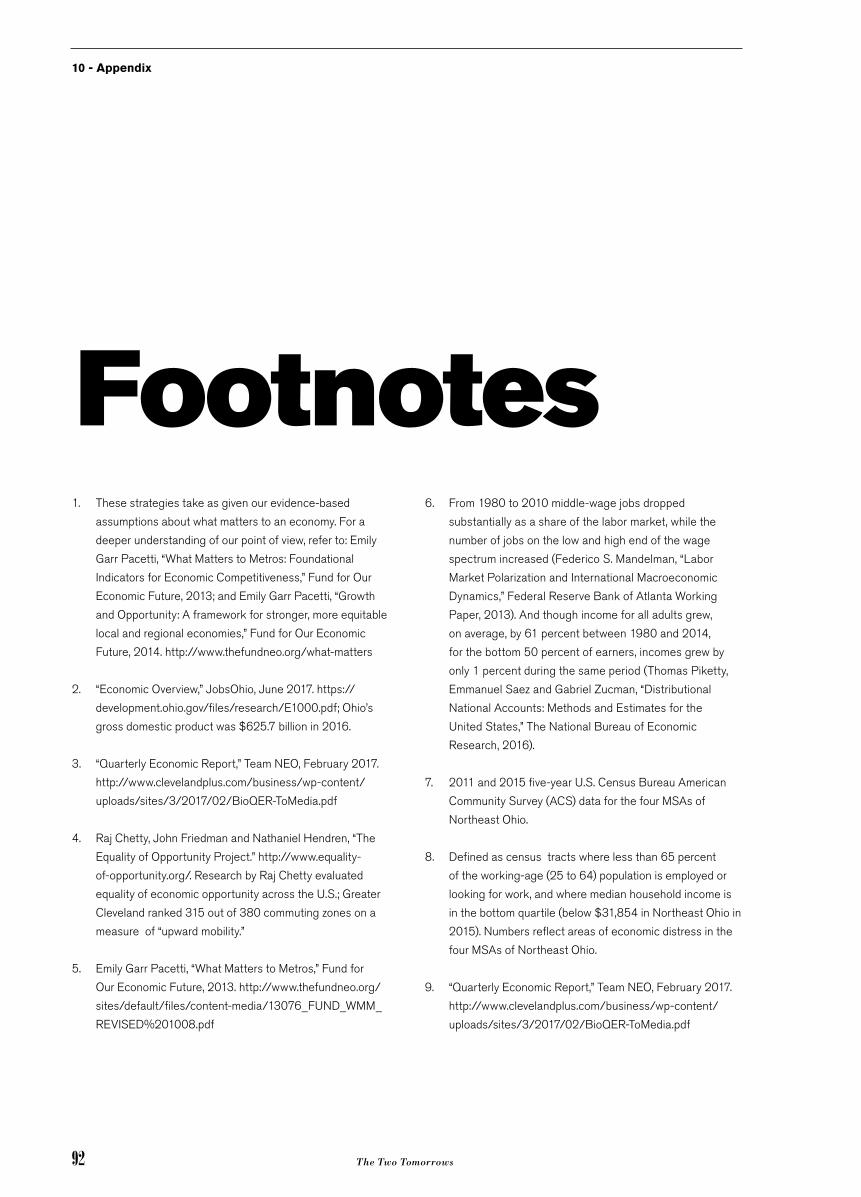
92 The Two Tomorrows
10 - Appendix
Footnotes1. These strategies take as given our evidence-based
assumptions about what matters to an economy. For a
deeper understanding of our point of view, refer to: Emily
Garr Pacetti, “What Matters to Metros: Foundational
Indicators for Economic Competitiveness,” Fund for Our
Economic Future, 2013; and Emily Garr Pacetti, “Growth
and Opportunity: A framework for stronger, more equitable
local and regional economies,” Fund for Our Economic
Future, 2014. http://www.thefundneo.org/what-matters
2. “Economic Overview,” JobsOhio, June 2017. https://
development.ohio.gov/files/research/E1000.pdf; Ohio’s
gross domestic product was $625.7 billion in 2016.
3. “Quarterly Economic Report,” Team NEO, February 2017.
http://www.clevelandplus.com/business/wp-content/
uploads/sites/3/2017/02/BioQER-ToMedia.pdf
4. Raj Chetty, John Friedman and Nathaniel Hendren, “The
Equality of Opportunity Project.” http://www.equality-
of-opportunity.org/. Research by Raj Chetty evaluated
equality of economic opportunity across the U.S.; Greater
Cleveland ranked 315 out of 380 commuting zones on a
measure of “upward mobility.”
5. Emily Garr Pacetti, “What Matters to Metros,” Fund for
Our Economic Future, 2013. http://www.thefundneo.org/
sites/default/files/content-media/13076_FUND_WMM_
REVISED%201008.pdf
6. From 1980 to 2010 middle-wage jobs dropped
substantially as a share of the labor market, while the
number of jobs on the low and high end of the wage
spectrum increased (Federico S. Mandelman, “Labor
Market Polarization and International Macroeconomic
Dynamics,” Federal Reserve Bank of Atlanta Working
Paper, 2013). And though income for all adults grew,
on average, by 61 percent between 1980 and 2014,
for the bottom 50 percent of earners, incomes grew by
only 1 percent during the same period (Thomas Piketty,
Emmanuel Saez and Gabriel Zucman, “Distributional
National Accounts: Methods and Estimates for the
United States,” The National Bureau of Economic
Research, 2016).
7. 2011 and 2015 five-year U.S. Census Bureau American
Community Survey (ACS) data for the four MSAs of
Northeast Ohio.
8. Defined as census tracts where less than 65 percent
of the working-age (25 to 64) population is employed or
looking for work, and where median household income is
in the bottom quartile (below $31,854 in Northeast Ohio in
2015). Numbers reflect areas of economic distress in the
four MSAs of Northeast Ohio.
9. “Quarterly Economic Report,” Team NEO, February 2017.
http://www.clevelandplus.com/business/wp-content/
uploads/sites/3/2017/02/BioQER-ToMedia.pdf
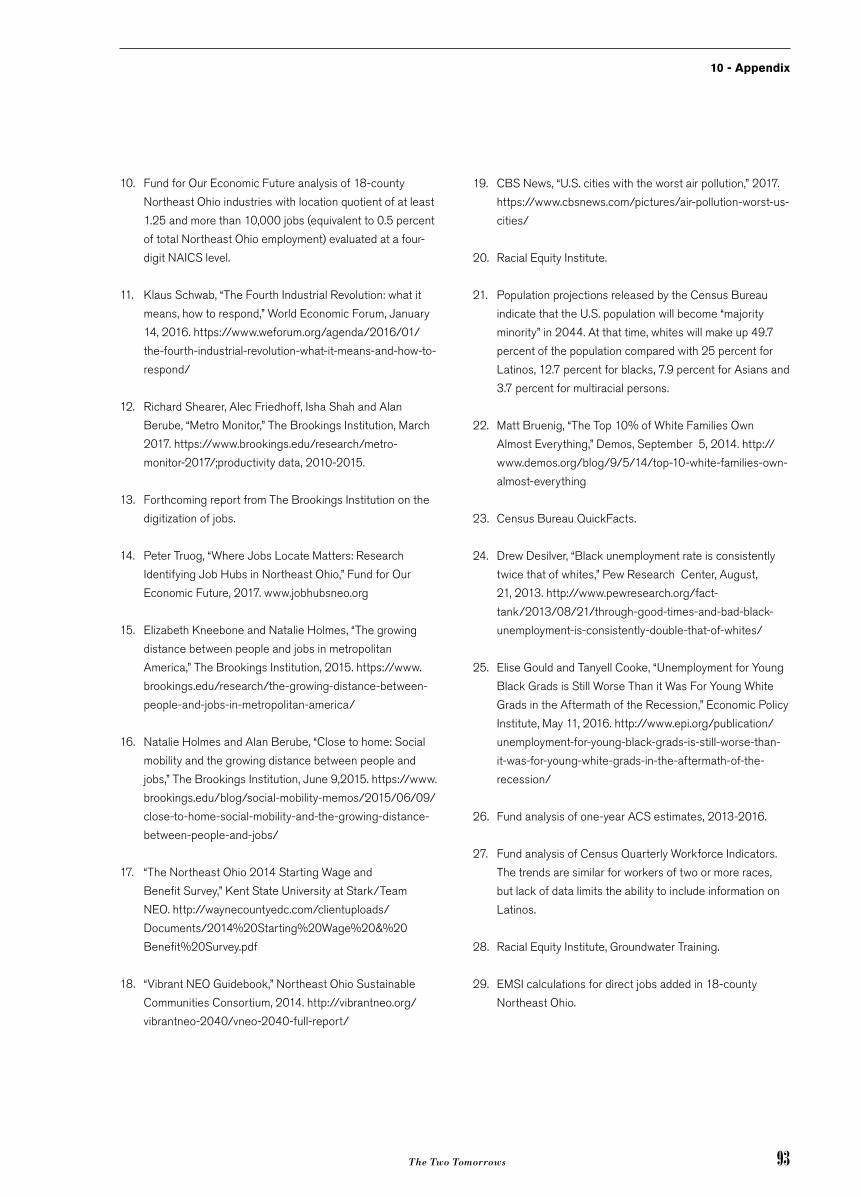
93The Two Tomorrows
10 - Appendix
10. Fund for Our Economic Future analysis of 18-county
Northeast Ohio industries with location quotient of at least
1.25 and more than 10,000 jobs (equivalent to 0.5 percent
of total Northeast Ohio employment) evaluated at a four-
digit NAICS level.
11. Klaus Schwab, “The Fourth Industrial Revolution: what it
means, how to respond,” World Economic Forum, January
14, 2016. https://www.weforum.org/agenda/2016/01/
the-fourth-industrial-revolution-what-it-means-and-how-to-
respond/
12. Richard Shearer, Alec Friedhoff, Isha Shah and Alan
Berube, “Metro Monitor,” The Brookings Institution, March
2017. https://www.brookings.edu/research/metro-
monitor-2017/;productivity data, 2010-2015.
13. Forthcoming report from The Brookings Institution on the
digitization of jobs.
14. Peter Truog, “Where Jobs Locate Matters: Research
Identifying Job Hubs in Northeast Ohio,” Fund for Our
Economic Future, 2017. www.jobhubsneo.org
15. Elizabeth Kneebone and Natalie Holmes, “The growing
distance between people and jobs in metropolitan
America,” The Brookings Institution, 2015. https://www.
brookings.edu/research/the-growing-distance-between-
people-and-jobs-in-metropolitan-america/
16. Natalie Holmes and Alan Berube, “Close to home: Social
mobility and the growing distance between people and
jobs,” The Brookings Institution, June 9,2015. https://www.
brookings.edu/blog/social-mobility-memos/2015/06/09/
close-to-home-social-mobility-and-the-growing-distance-
between-people-and-jobs/
17. “The Northeast Ohio 2014 Starting Wage and
Benefit Survey,” Kent State University at Stark/Team
NEO. http://waynecountyedc.com/clientuploads/
Documents/2014%20Starting%20Wage%20&%20
Benefit%20Survey.pdf
18. “Vibrant NEO Guidebook,” Northeast Ohio Sustainable
Communities Consortium, 2014. http://vibrantneo.org/
vibrantneo-2040/vneo-2040-full-report/
19. CBS News, “U.S. cities with the worst air pollution,” 2017.
https://www.cbsnews.com/pictures/air-pollution-worst-us-
cities/
20. Racial Equity Institute.
21. Population projections released by the Census Bureau
indicate that the U.S. population will become “majority
minority” in 2044. At that time, whites will make up 49.7
percent of the population compared with 25 percent for
Latinos, 12.7 percent for blacks, 7.9 percent for Asians and
3.7 percent for multiracial persons.
22. Matt Bruenig, “The Top 10% of White Families Own
Almost Everything,” Demos, September 5, 2014. http://
www.demos.org/blog/9/5/14/top-10-white-families-own-
almost-everything
23. Census Bureau QuickFacts.
24. Drew Desilver, “Black unemployment rate is consistently
twice that of whites,” Pew Research Center, August,
21, 2013. http://www.pewresearch.org/fact-
tank/2013/08/21/through-good-times-and-bad-black-
unemployment-is-consistently-double-that-of-whites/
25. Elise Gould and Tanyell Cooke, “Unemployment for Young
Black Grads is Still Worse Than it Was For Young White
Grads in the Aftermath of the Recession,” Economic Policy
Institute, May 11, 2016. http://www.epi.org/publication/
unemployment-for-young-black-grads-is-still-worse-than-
it-was-for-young-white-grads-in-the-aftermath-of-the-
recession/
26. Fund analysis of one-year ACS estimates, 2013-2016.
27. Fund analysis of Census Quarterly Workforce Indicators.
The trends are similar for workers of two or more races,
but lack of data limits the ability to include information on
Latinos.
28. Racial Equity Institute, Groundwater Training.
29. EMSI calculations for direct jobs added in 18-county
Northeast Ohio.

94 The Two Tomorrows
10 - Appendix
30. Bureau of Economic Analysis; peer economies represent
average annual growth rate of Baltimore, Buffalo,
Cincinnati, Detroit, Milwaukee and Pittsburgh MSAs,
2012 – 2016.
31. Fund analysis of 2016 EMSI data.
32. Richard Shearer, Alec Friedhoff, Isha Sha, and Alan
Berube, “Metro Monitor,” The Brookings Institution, March
2017. https://www.brookings.edu/research/metro-
monitor-2017/; Canton falls outside of the 100 largest
metros.
33. JumpStart.
34. Approximate region-wide living wage estimate using
University of Washington Center for Women’s Welfare
county-based Self-Sufficiency Standard.
35. Mark Muro, Siddharth Kulkami and David M. Hart,
“America’s Advanced Industries: New Trends,” The
Brookings Institution, August 4, 2016. https://www.
brookings.edu/research/americas-advanced-industries-
new-trends/
36. BioEnterprise.
37. Fund analysis of EMSI data.
38. JumpStart.
39. As of 2016, sourced from EMSI.
40. Amy Liu and Mark Muro, “What Amazon’s HQ2 Wish List
Signals About the Future of Cities,” Harvard Business
Review, September 8, 2017. https://hbr.org/2017/09/
what-amazons-hq2-wish-list-signals-about-the-future-of-
cities
41. ACS 2007 three-year estimates and 2015 five-year
population estimates for 18-county Northeast Ohio.
42. Ibid.
43. As measured by Brookings Metro Monitor.
44. Source: Fund analysis of EMSI data.
45. Amy Liu, “Remaking Economic Development: The Markets
and Civics of Continuous Growth and Prosperity,” The
Brookings Institution Metropolitan Policy Program,
Metropolitan Policy Program, 2016, page 13. https://
www.brookings.edu/research/remaking-economic-
development-the-markets-and-civics-of-continuous-
growth-and-prosperity/
46. “Quarterly Economic Report,” Team NEO, February 2017.
http://www.clevelandplus.com/business/wp-content/
uploads/sites/3/2017/02/BioQER-ToMedia.pdf
47. U.S. International Trade Administration, SelectUSA Stats,
Foreign Direct Investment In the United States, July 2017
data. https://www.selectusa.gov/selectusa-stats
48. U.S. Department of Commerce, “The Foreign Direct
Investment in the United States: Update to 2013 Report,”
June 2016.
49. “Quarterly Economic Report,” Team NEO, September
2016. http://www.clevelandplus.com/business/wp-
content/uploads/sites/3/2016/09/16116_TeamNEO_
QER_Sept2016.pdf
50. 2017 manufacturing employment in 18-county Northeast
Ohio, from Team NEO.
51. MAGNET.
52. Fund analysis of EMSI data.
53. Mark Muro, “Where the robots are,” The Brookings
Institution, August 14, 2017. https://www.brookings.edu/
blog/the-avenue/2017/08/14/where-the-robots-are/
54. Emily Garr Pacetti, “What Matters to Metros,” Fund for
Our Economic Future, 2013. http://www.thefundneo.org/
sites/default/files/content-media/13076_FUND_WMM_
REVISED%201008.pdf
55. JumpStart. https://www.jumpstartinc.org/about/results/
56. Jessica Davis, “McKesson acquires CoverMyMeds for $1.1
Billion,” Healthcare IT News, January 27, 2017. http://
www.healthcareitnews.com/news/mckesson-acquires-
covermymeds-11-billion

95The Two Tomorrows
10 - Appendix
57. Brad Feld, “Startup Communities: Building an
Entrepreneurial Ecosystem in Your City,” John Wiley
& Sons, 2012, pages 25 – 29.
58. Data scorecard in this report.
59. Valerie Wilson and William M. Rodgers III, “Black-white
wage gaps expand with rising wage inequality” Economic
Policy Institute, September 19, 2016. https://www.epi.org/
publication/black-white-wage-gaps-expand-with-rising-
wage-inequality/
60. Kevin Alin, Peter Truog, “Race, Equity and Inclusion: How
Cleveland Generates Income” (working title), Fund for Our
Economic Future, forthcoming.
61. “Aligning Opportunities in Northeast Ohio: A Resource to
Aid in Addressing the Demand and Supply Imbalance in
the Region’s Workforce,” Team NEO, 2017. http://www.
clevelandplus.com/teamneo/portal/industry-insights-
materials/workforce-trends-reports/
62. Living wage estimate for a family of one adult and one
child or two adults with no children living in the Cleveland
MSA, as provided by the University of Washington Center
for Women’s Welfare county-based Self-Sufficiency
Standard.
63. “The Present and Future of Older Industrial Cities,” The in
front of Brookings Institution Metropolitan Policy Program,
presented November 7-8, 2017, in Cleveland and Warren,
Ohio.
64. The Mahoning Valley Manufacturers Coalition. http://www.
industryneedsyou.com/about-us/mvmc/
65. “Aligning Opportunities in Northeast Ohio: A Resource to
Aid in Addressing the Demand and Supply Imbalance in
the Region’s Workforce,” Team NEO, 2017. http://www.
clevelandplus.com/teamneo/portal/industry-insights-
materials/workforce-trends-reports/
66. BioEnterprise.
67. James J. Kemple, “Career Academies: Long-Term Impacts
on Work, Education, and Transitions to Adulthood,” MDRC,
June 2008. https://www.mdrc.org/sites/default/files/
full_50.pdf
68. “U.S. Labor Department Announces $10.4M in Grants
to Expand, Expedite Aprrenticeships in 51 States and
Territories, and District of Columbia,” U.S. Department of
Labor, 2016. https://www.dol.gov/newsroom/releases/
eta/eta20160602-0
69. Merrilea Mayo, Jamai Blivin, Innovate + Educate, analysis
of skills data including: John E. Hunter and Ronda F.
Hunter, “Validity and Utility of Alternative Predictors of Job
Performance,” Psychological Bulletin 96 (1984), 72-98.
70. Fund analysis of EMSI data.
71. “Contingent Workforce: Size, Characteristics, Earnings,
and Benefits,” Charles A. Jeszeck to The Honorable Patty
Murray and The Honorable Kirsten Gillibrand, April 20,
2015. http://www.gao.gov/assets/670/669899.pdf
72. Steven L. Dawson, “Make Bad Jobs Better: Forging
a ‘Better Job Strategy,’” The Pinkerton Papers, The
Pinkerton Foundation, June 2016. http://www.
thepinkertonfoundation.org/paper/make-bad-jobs-better-
forging-a-better-jobs-strategy
73. D’Vera Cohn, Gretchen Livingston, Wendy Wang, “After
Decades of Decline, A Rise in Stay-at-Home Mothers,”
Pew Research Center, 2014. http://www.pewsocialtrends.
org/2014/04/08/after-decades-of-decline-a-rise-in-stay-
at-home-mothers/
74. “Redefining Workforce Development in Northeast Ohio:
How National WorkAdvance Demonstration Made Local
Impact,” Fund for Our Economic Future, 2016. http://www.
thepinkertonfoundation.org/paper/make-bad-jobs-better-
forging-a-better-jobs-strategy
75. Data scorecard in this report.
76. Lincoln Quillian , Devah Pager, Ole Hexel, Arnfinn
H. Midtbøen, “The Persistence of Racial Discrimination:
A Meta-Analysis of Field Experiments in Hiring,” Linco
Proceedings of the National Academy of Sciences Sep
2017
77. James W. Guest “Using Evidence to Drive Hiring and
Investment,” Career STAT Case Study 2016. https://
nationalfund.org/wp-content/uploads/2017/08/Mercy-
Case-Study_Final_2017-08-02.pdf

96 The Two Tomorrows
10 - Appendix
78. Emily Garr Pacetti, “The Geography of Jobs: The
Increasing Distance Between Jobs and Workers in
Northeast Ohio and Why it Matters for Future Growth,”
Fund for Our Economic Future, 2016. http://www.
thefundneo.org/sites/default/files/GEOReport-FNL2.pdf
79. Western Reserve Land Conservancy. “Case Study:
Cuyahoga County,” Western Reserve Land Conservancy.”
https://www.wrlandconservancy.org/whatwedo/
casestudy-cuyahoga/
80. Peter Truog, “Where Jobs Locate Matters: Research
Identifying Job Hubs in Northeast Ohio,” Fund for Our
Economic Future, 2017. www.jobhubsneo.org
81. Fund analysis of Elizabeth Kneebone and Natalie Holmes,
“The growing distance between people and jobs in
metropolitan America,” The Brookings Institution, 2015.
https://www.brookings.edu/research/the-growing-
distance-between-people-and-jobs-in-metropolitan-
america/
82. Center for Neighborhood Technology. http://www.cnt.org/
tools/housing-and-transportation-affordability-index
83. “The Northeast Ohio 2014 Starting Wage and
Benefit Survey,” Kent State University at Stark/Team
NEO, http://waynecountyedc.com/clientuploads/
Documents/2014%20Starting%20Wage%20&%20
Benefit%20Survey.pdf
84. Peter Truog, “Where Jobs Locate Matters,” Fund for Our
Economic Future, 2017. www.jobhubsneo.org
85. The demand for sites is based on project requests
received by Team NEO and the supply is based on listed
inventory in Team NEO’s site database.
86. “Vibrant NEO 2040,” Northeast Ohio Sustainable
Communities Consortium, 2014. http://vibrantneo.org/
vibrantneo-2040/vneo-2040-full-report/
87. Ruth Simon, “U.S. Cities Battle Each Other for Jobs
With $45 Billion in Incentives,” The Wall Street Journal,
March 16, 2017. https://www.wsj.com/articles/u-s-
cities-battle-each-other-for-jobs-with-45-billion-in-
incentives-1489675343
88. Fund analysis of Elizabeth Kneebone and Natalie Holmes,
“The growing distance between people and jobs in
metropolitan America,” The Brookings Institution, 2015.
https://www.brookings.edu/research/the-growing-
distance-between-people-and-jobs-in-metropolitan-
america/
89. Based on Google Transit data for residents commuting
from the Central neighborhood of Cleveland to Solon, a
suburb approximately 18 miles southeast of Cleveland in
Cuyahoga County that is one of the fastest growing job
hubs in the region. See example in: Emily Garr Pacetti,
“The Geography of Jobs,” Fund for Our Economic Future,
2016.
90. Commute time and car ownership data from PERE and
PolicyLink National Equity Atlas, 2014.
91. Carol Caruso, Tim Cosgrove, Nathanael Jonhenry, Greg
Browning, Nancy Lesic and Steve Luttner, “Public Transit
in Ohio: A Review of Public Policy Challenges and
Opportunities,” Prepared for the Fund for Our Economic
Future, 2017.
92. Timothy Magaw, “Q&A: Akshai Singh, organizer,
Clevelanders for Public Transit,” Crain’s Cleveland
Business, December 9, 2017. http://www.crainscleveland.
com/article/20171209/news/145041/qampa-akshai-
singh-organizer-clevelanders-public-transit
93. Carol Caruso, Tim Cosgrove, Nathanael Jonhenry, Greg
Browning, Nancy Lesic and Steve Luttner, “Public Transit
in Ohio: A Review of Public Policy Challenges and
Opportunities,” Prepared for the Fund for Our Economic
Future, 2017.
94. Ibid.
95. Peter Truog, “Where Jobs Locate Matters,” Fund for Our
Economic Future, 2017. www.jobhubsneo.org
96. Richey Piiparinen, Jim Russell and Charlie Post, “The
Fifth Migration: A Study of Cleveland Millennials,” Urban
Publications, 2016. https://engagedscholarship.csuohio.
edu/cgi/viewcontent.cgi?article=2339&context=urban_
facpub

97The Two Tomorrows
10 - Appendix
97. “Who’s On Board 2016,” TransitCenter, 2016. http://
transitcenter.org/wp-content/uploads/2016/07/
TransitCenter-WOB-2016.pdf
98. Peer economies include Baltimore, Buffalo, Cincinnati,
Detroit, Milwaukee and Pittsburgh MSAs. All GMP data
from the Bureau of Economic Analysis.
99. Employment data sourced from Quarterly Workforce
Indicators Explorer using first-quarter totals from each
year at firms 0-5 years old. Peer economy average based
on Cincinnati, Detroit, Columbus, Indianapolis, Buffalo,
Baltimore, Chicago, Milwaukee and Pittsburgh MSAs.
100. Brookings analysis of ACS public-use microdata and the
University of Washington Center for Women’s Welfare
county-based Self-Sufficiency Standard.
101. Ibid.
102. Fund analysis of Census Bureau 2012-2016 Quarterly
Workforce Indicator data.
103. Fund analysis of 2011-2015 five-year ACS data.