the twin crises: immigration and infrastructure edwin s
TRANSCRIPT

THE TWIN CRISES: ImmIgRaTIoN aNd INfRaSTRuCTuRE • Edwin S. Rubenstein
2
The Twin CrisesImmigration and Infrastructure
By Edwin S. RuBEnStEin
This article highlights the role of immi-gration in depreciating and driving up the cost of maintaining, improving, and
expanding infrastructure in the U.S. Fifteen different categories of public infrastructure are covered:
airports•bridges •dams •drinking water •energy (national power grid) •hazardous waste •hospitals •navigable waterways •public parks and recreation •rail, public schools •border security •solid waste •mass transit •water and sewer systems. •
Infrastructure and immigration? That’s an odd couple. Immigration policy has been debated for years, but the debate usually fo-cuses on border security, amnesty, and wheth-er illegal alien workers are really needed to do the jobs that Americans “won’t do.”
Immigration’s impact on public infra-structure is rarely discussed.
Until the past few months, infrastructure policy was itself on the back burner, surfac-ing only when a bridge or levee collapsed, but generally of interest to civil engineers and policy wonks.
How things change! Today, infrastructure spending is widely seen as a key lifeline for a sinking economy. The lion’s share of Pres-ident-elect Obama’s stimulus package will fund road and mass transit projects, school
construction, port expansions, and alternative energy projects.
Yes, our infrastructure is in trouble. The American Society of Civil Engineers’ 2005 Report Card assigned an overall grade of D to the 15 infrastructure categories.1 Grades were selected on the basis of physical condition and capacity following a traditional grading scale (for example, if 77 percent of our roads are in good condition or better, the roads would be given a grade of C).
But if money were the problem, there would be no problem. Since 1982, capital spending on public infrastructure has in-creased by 2.1 percent per year above the inflation rate. Over this period, governments have spent $3.1 trillion (in today’s dollars) to build transportation infrastructure, and an-other $3.8 trillion to maintain and operate it. Last year, we spent 50 percent more, after ad-justing for inflation, on highway construction than we did a quarter of a century ago. Yet over this period, highway miles increased by only 6 percent, while U.S. population grew by 31 percent—half of it due to immigration.
The “demand” for highway infrastruc-ture, as measured by population growth, grew six times faster than the “supply” of highway infrastructure.
Bottom line: Our infrastructure is “crum-bling” because population growth has over-whelmed the ability of government to produc-tively spend the vast sums it already devotes to infrastructure.
All types of infrastructure are under stress because of immigration.
Public schools are a prime example. Although immigrants account for about 13 percent of the U.S. population, they are
Introduction

3
THE SoCIal CoNTRaCT: aN ExCluSIvE REpoRT
21 percent of the school-age population. In California, a whopping 47 percent of the school-age population consists of immigrants or the children of immigrants. Some Los Angeles schools are so crowded that they have lengthened the time between classes to give students time to make their way through crowded halls. Los Angeles’ school construc-tion program is so massive that the Army Corps of Engineers was called in to manage it.
This is a boom time for hospital construc-tion. Sixty percent of hospitals are either building new facilities or planning to do so. But we have a two-tier hospital system in the U.S. Hospitals in poor areas—that serve primarily uninsured immigrants and Medicaid patients—cannot afford to upgrade their facilities. The uncompensated costs are
killing them. In California, 60 emergency departments (EDs) have closed to avoid the uncompensated costs of their largely illegal alien caseloads.
Immigrants may not use any more water than other people. But they dispro-portionately settle in parts of the country where water is in short supply—and their sheer numbers have overwhelmed conserva-tion efforts. Cities like San Antonio, El Paso, and Phoenix could run out of water in 10 to 20 years. San Diego’s water company has resorted to a once unthinkable option: recy-cling toilet water for drinking.
National parks along the southern border are scarred by thousands of unauthor-ized roads and paths used by illegal aliens crossing into the U.S. Their fires, trash, and
Edwin S. RubenStein, president of ESR Research, economic consultants, has 25 years of experience as a business researcher, financial analyst, and economics journalist. Mr. Rubenstein joined the Hudson Institute, a public policy think tank headquar-tered in Indianapolis, and served as director of research from 1997–2002. While at Hudson he wrote proposals and conducted research on a wide array of topics, including workforce development, the impact of AIDS on South Africa’s labor force, Boston’s “Big Dig” the economic impact of transportation infrastructure, and the future of the private water industry in the United States.As a journalist, Mr. Rubenstein was a contributing editor at Forbes Magazine and economics editor at National Review, where his “Right Data” column was featured for more than a decade. His televised appearances include Firing Line, Bill Moyers, McNeil-Lehrer, CNBC, and Debates-Debates. He is the author of two books: From the Empire State to the Vampire State: New York in a Downward Transition (with Herbert London) and The Right Data. Mr. Rubenstein also served as an adjunct fellow at the Manhattan Institute where he was principal investigator in the institute’s ongoing analysis of New York state’s budget and tax structure. He also published a newsletter devoted to economic statistics and
contributed regularly to The City Journal, the Manhattan Institute’s quarterly publication. From 1980 to 1986 he was senior economist at W.R. Grace & Co. where he directed studies of government waste and inefficiency for the Grace Commission.From 1978 to 1980 he was a municipal bond analyst for Moody’s Investors Service where he was also editor of the Bond Survey, a weekly review of the municipal bond market. He served as senior quantitative analyst for the Office of the Mayor of New York City from 1973 to 1978. His writings have appeared in the Wall Street Journal, the New York Times, Harvard Business Review, Investor’s Business Daily, and Newsday. He is a regular contributor to the Social Contract and VDARE.com.Mr. Rubenstein has a B.A. in economics from Johns Hopkins, and an M.A. in public finance from Columbia University.
About the Author

THE TWIN CRISES: ImmIgRaTIoN aNd INfRaSTRuCTuRE • Edwin S. Rubenstein
4
local tax money into infrastructure. When public support falters, infrastructure users are usually hit with higher tolls, higher transit fares, higher water bills, and other usage-re-lated fees. As a last resort, many governments sell or lease entire highways, water systems, parks, and other infrastructure systems to private companies.
There is no end to the financial chicanery that infrastructure junkies will employ to support their habit. Wall Street veteran Felix Rohatyn recently proposed this “novel solu-tion” to the problem2: That is no solution; it is a recipe for another debacle a la sub-prime mortgages.
The prognosis is not good. In August 2008 the Census Bureau projected that U.S. population will be 433 million in 2050—an increase by 135 million, or 44 percent, from current levels. Eighty-two percent of the in-crease will be from new immigrants and their U.S.-born children.
The brutal reality is that no conceivable infrastructure program can keep pace with that kind of population growth. The tradi-tional “supply-side” response to America’s infrastructure shortage—build, build, build—is dead, dead, dead. Demand reduction is the only viable way to close the gap between the supply and demand of public infrastructure.
Immigration reduction must play a role. ■
EndnotesAmerican Society of Civil Engineers. 1. 2005 Report Card. ASCE News, Vol. 30, No. 3, March 2005.Felix Rohatyn and Everett Ehrlich, “A 2. New Bank to Save Our Infrastructure,” New York Review of Books, October 9, 2008. http://www.nybooks.com/articles/21873.
vandalism have despoiled thousands of acres of pristine parkland.
“Although private investors have successfully built new roads in places such as Poland and Spain, they have not done so extensively in the U.S. But a National Infra-structure Bank could redirect pri-vate efforts away from refinancing old facilities—as in the case of Chicago’s Skyway—to building new ones.
According to our plan, most of the funds the federal government now spends on ex-isting programs (along with many of those program’s experts and facilities) would be transferred to the bank, which could not only
finance the projects but also resell the loans it makes to investors in capital markets, much as other assets are rebundled for investors. The receipts from these sales would allow a new round of lending, giving the bank an im-pact far in excess of its initial capitalization.”
The traditional response to these prob-lems was to throw more federal, state, and
In August 2008 the Census Bureau projected that U.S. population will be 433 million in 2050—an increase by 135 million, or 44 percent, from current levels. Eighty-two percent of the increase will be from new immigrants and their U.S.-born children.... The brutal reality is that no conceivable infrastructure program can keep pace with that kind of population growth.

5
THE SoCIal CoNTRaCT: aN ExCluSIvE REpoRT
What a difference a year makes! Years of rising passenger volumes, the shift to smaller, regional jets, and
the modest expansion in airport capacity produced a perfect storm in 2007. It was the worst for airline delays since the Bureau of Transportation Statistics started keeping com-prehensive data 13 years earlier.
Enter 2008. Buffeted by soar-ing oil prices, a weak economy, and excess capac-ity, U.S. airlines are cutting flights to levels not seen since 2002, when travel fell sharply after the 9/11 at-tacks. U.S. airports of every size—from LaGuardia to Oakland—will be affected as airlines cut flights. By year’s end, ap-proximately 100 U.S. communities will lose regular commercial air service alto-gether, a number that may double next year, according to the Air Transport Association.1
Overall the cuts will reduce flights by U.S. carriers from 11 percent to 12 percent, industry analysts estimate. U.S. airlines are selling off hundreds of older, less efficient planes, so the airline traffic is unlikely to grow sharply again even if oil prices stay down and the economy rebounds.
Fewer flights will not necessarily allevi-ate the pressure on airport infrastructure. Most of the discontinued flights are among
small market airports where capacity was already too high. The large hub airports may see more connecting flights as direct service is terminated. Just seven such locations—Harts-field-Jackson Atlanta International Airport, Chicago’s O’Hare International Airport, Phila-delphia International Airport, Newark Liberty International Airport, Houston’s George Bush
Intercontinental Airport, and New York City’s La-Guardia and John F. Kennedy air-ports—accounted for 72 percent of delays last year. The delays will undoubtedly rise in 2008.
Airport ca-pacity is not the only aviation in-frastructure issue requiring atten-tion. The nation’s air traffic control system, NextGen, which currently
relies on ground-based radar, needs upgrad-ing. A satellite-based navigation, surveillance, and networking system is scheduled for adop-tion between now and 2025. NextGen would use global positioning technology to deter-mine where a particular aircraft is at any mo-ment, enabling aircraft to take off and land in closer proximity to one another and thereby boost the number of flights per hour.
Protecting airports from terrorist attack and screening incoming international pas-sengers are infrastructure issues we discuss below.
Aviation by the Numbers
Aviation Infrastructure
19,990 total airports (2006)604 airports certified for planes carrying more than 9 passengers (2006)8,225 commercial passenger and cargo planes (2005)224,352 private and business planes (2005)9,701,709 total aircraft take-offs (2004)655.1 million paying air passengers (2004)58.5 million air passengers leaving the U.S. (excludes Canada)0.605 fatalities per 100 million aircraft miles (2006)
aviation Infrastructure Spending (a)2005 estimate: $29.9 billion ($101.11 per capita)2050 Spending projections (b)$44.3 billion: at current population trends$38.4 billion: at 50-percent reduction in immigration$29.9 billion: at zero population growth
Notes: a. Capital, operation, and maintenance spending by all levels of government. b. Assumes per capita spending remains at 2005 levels.Sources: Congressional Budget Office, American Society for Civil Engineers, Bureau of Transportation Statistics, Pew Research.
Section 1

THE TWIN CRISES: ImmIgRaTIoN aNd INfRaSTRuCTuRE • Edwin S. Rubenstein
6
than large airliners. But two such jets impose roughly twice the infrastructure costs—and yet the same amount of revenue—as a large jet carrying the same number of passengers.
The FAA has proposed switching from the current flat fee per passenger structure to a cost-based mechanism that would contain provisions for congestion pricing. General aviation, which includes scheduled cargo flights, charter flights, sightseeing flights, and recreational flights, has also been singled out by federal air agency, as it is responsible for at least 11 percent of air traffic costs yet pays only about 3 percent of the taxes that go into the federal aviation trust fund.
Illegal Immigration by air
They cross the southern border secretive-ly at remote places. They sail in jury-rigged boats from Cuba. They fly in under the radar and land in the desert. At least that is how most Americans believe illegal aliens enter the U.S.
In fact, a sizable number may arrive on regularly scheduled flights from their home countries. Evidence for this view was assem-bled by University of Pennsylvania demog-rapher Daniel R. Vining in the early 1980s. Vining focused on one component of the net inflow of persons to the United States: com-mercial airline passengers.2
The official U.S. government tally of arriving and departing air passengers consis-tently shows that more people fly in each year than fly out. When Vining looked at the data in the late 1970s, he found the excess to be about 1 million. In the 1990s the annual excess averaged 3.7 million. From 2000 to 2006, the latest available year of data, it was 3.9 million.
Interestingly, while the number of inter-national passengers rose more than 4-fold since then, the percentage difference between arriving and departing international passen-gers, which Vining called the “retention rate,” has hardly changed: it was 7.8 percent in the 1970s, 7.7 percent in the 1990s, and 6.7 percent
Overarching everything is money. Capital spending on aviation infrastructure currently runs about $14.4 billion per year. According to the Federal Aviation Administration (FAA) and other sources, annual investment of $18 billion—about $4 billion above the current level for airports and air traffic control—is needed to maintain performance given the expected growth in demand.
Airport infrastructure projects are gener-ally funded by two sources. First is the federal government through the Airport and Airway Trust Fund—a dedicated funding source based on fuel taxes and other user fees. Sec-ond is by the airports through the passenger facility charges that are collected on every passenger at commercial airports controlled by public agencies, along with landing fees, parking fees, and other charges for the use of airport facilities.
The flat per-passenger fee presents a problem at a time when airlines are shifting to smaller regional jets that seat 50 to 90 passen-gers. Smaller jets are more likely to be filled, and thus more profitable for the airlines,
Stranded passengers as a result of flight delays or cancellations overcrowd our nation’s airports.

7
THE SoCIal CoNTRaCT: aN ExCluSIvE REpoRT
from 2000 to 2006. The constancy implies that the impact of commercial air travel on U.S. immigration has risen in lock step with the number of airline passengers coming into the country.
In 2006, the gap was 3.5 million, with 63.0 million arrivals and 59.5 million departures. The gap exceeds even the largest estimates of net immigration into the United States.
What gives?Vining found a systematic undercount of
departing air passengers: “The source of the implausibly large difference between arrivals and departures in USIATS [U.S. International Air Travel Statistics] appears to be an undercount of departures on charter flights.”
He attributed the undercount to the rela-tive laxity of the Immigration and Naturaliza-tion Service (INS) in collecting paperwork from departing passengers:
“While INS assures that the I-92 forms are filed out properly on all flights arriving in the United States, both chartered and sched-uled, because all arriving pas-sengers must proceed through immigration and customs and because INS is careful that their own counts tally with those turned in on the I-92 form by the air carrier, it is only a passive receptor of the forms on departing flights…. Thus the… general lack of vigilance on the part of INS… could cause a significant number of departing passengers …. to go unrecorded in USIATS.”
The paperwork problem still exists, only now it is a major security issue:
“Unresolved weaknesses in DHS’s long-standing system for tracking visitors’ arrivals and departures (based on Form I-94) include,
among others, noncollection of many departure forms and an in-ability to match departure forms to arrivals. As a result, there is no accurate list of overstays.”3 “Weaknesses in the overstay tracking system may hamper efforts to monitor potentially suspicious aliens who enter the country legally. Although the vast majority of visitors come only for business or pleasure, the few who are potential terrorists or terrorist supporters could present a threat to domestic security…. ““… Overstays who settle here in large numbers can affect domestic security because they (like other illegal immigrants) are able to ob-tain jobs and security badges with fraudulent identity documents, thus gaining access to critical infrastructure locations, such as airports, or special events, like the Super Bowl—making efforts to se-cure these venues more difficult.”
Regarding airport security, the Govern-ment Accounting Office (GAO) chillingly notes: ”
“…overstays with fraudulently obtained badges were found at 25 of 26 airports examined.”
The U.S. Department of Homeland Se-curity (DHS) estimates that one-third of all illegal aliens are overstays, that is, individuals who entered legally but stayed past the time allowed on their visa. It is not clear whether the overstay figure includes citizens of so-called “visa waiver” countries, who are al-lowed to enter the U.S. without visas.
Overstays come in as tourists, or business-men, or students. Many arrive on commercial airlines. They may not look or sound like the quintessential illegal border crosser. That could make them all the more dangerous.

THE TWIN CRISES: ImmIgRaTIoN aNd INfRaSTRuCTuRE • Edwin S. Rubenstein
8
general aviation airportsIn the U.S., there are more than 19,000 to-
tal airports, including publicly and privately owned facilities. Only about 450 serve regu-larly scheduled commercial passenger flights. The remainder consists of general aviation (GA) facilities: airports, heliports, and sea-plane bases.
GA airports differ widely with respect to their traffic levels and infrastructure. Those near major metropolitan areas house hundreds of planes and have con-trol towers that can orchestrate more than 1,000 flights per day. Rural GA airports are often “uncontrolled” because they have no operating control tower. They may see less than 50 flights per day, mostly from planes housed at the airport.
Because GA facilities are relatively open compared to commercial airports, they pose different security risks. The threat is not so much to GA infrastructure itself, but from ter-rorists seeking to steal or hijack planes housed at these airports to attack critical infrastruc-ture or other high-profile targets. GA facilities could themselves be at risk if, for example, a plane carrying business leaders, such as cor-porate CEOs, is targeted.
It is widely known that some of the 9/11 hijackers trained in small airplanes housed in GA airports. Subsequent legislation requires the Transportation Security Administration to conduct background checks of all foreign aliens applying for flight training on aircraft weighing more than 12,500 pounds and to provide security training for flight school employees.
Since 9/11, regulatory actions have fo-cused mainly on airspace restrictions around the nation’s capital, vetting GA pilots, and
more recently, charter and lease customers. Physical security of GA airports and planes has been left to aircraft owners and pilots, airport operators, and local authorities. While this less-than-rigorous approach is welcomed by the GA industry, it is a concern to many security experts.
The Weakest linkSince 9/11, airline security infrastructure
has increased dramatically. Bag scanning sys-tems, metal detectors, and elaborate machines to detect explosive substances are mandated by federal law. Enormous sums have been spent screening passengers and their bags. We all feel safer, albeit more inconvenienced.
Are we was a safe as we think? Approxi-mately 60 percent of all U.S. air cargo flies on passenger planes, but only about 5 percent is required to undergo screening for danger-ous items. While the cargo screening gap is a dangerous security oversight in passenger aviation, it reflects an even larger threat in the cargo industry itself.
In reality, cargo aircraft could be more de-structive than passenger airliners due to their size and fuel capacity. Cargo planes also carry packages that are subject to minimal screen-ing, and they are operated in a less intensely screened area of the airport. Yet cargo security infrastructure is routinely excluded from anti-terrorism legislation. ■
Endnotes
American Society of Civil Engineers, 2008. 1. Daniel R. Vining, Jr., “Net Migration 2. by Commercial Air: A Lower Bound on Total Net Migration to the United States,” Research in Population Economics 4: 333-50, 1982.Government Accounting Office, “Overstay 3. Tracking A Key Component of Homeland Security and a Layered Defense,” May 2004. http://www.gao.gov/new.items/d0482.pdf.

9
THE SoCIal CoNTRaCT: aN ExCluSIvE REpoRT
Bridge Infrastructure
In August 2007, a horrific incident forced the American public and the nation’s lead-ers to take a close look at the state of the
country’s highway bridges. The collapse of the eight-lane bridge in Minneapolis carry-ing Interstate-35W over the Mississippi took the lives of 13 people and injured more than 100 others. Although the 40-year-old steel structure had been considered “structurally deficient” since 1990, engineers with the Min-nesota Department of Transportation did not believe that the bridge was in danger of imminent failure.
Mary E. Peters, the U.S. Secretary of Transportation, spoke for most of us when, at a news conference after the disaster, she de-clared that “Bridges in America should not fall down.” In fact, bridges do collapse—and at greater rates than you might think. Some 1,500 U. S. bridges collapsed between 1966 and 2005, according to the American Society of Civil Engineers (ASCE).1 But more than 60 percent of these failures are traceable to soil erosion around bridges dur-ing floods. Ship collisions, overloads, design flaws, corrosion, and poor maintenance are among other causes. Unanticipated bridge traffic, which could arguably be blamed on immigration, does not seem to be a contribut-ing factor.
More than 70,000 bridges are rated struc-turally deficient like the span that collapsed in
Minneapolis. They carry an average of more than 300 million vehicles per day.2 While it is unclear how many of them pose actual safety risks, structurally deficient bridges are closed or restricted to light vehicles because of their deteriorated structural components. Another bridge classification—the functionally obso-lete bridge—is described by ASCE as having older design features that make it unable to safely accommodate current traffic volumes,
vehicle sizes, and weights.
The news about bridges is not all bad, how-ever. Another report—the Bureau of Transportation Statistics’ (BTS) Condition of U.S. Highway Bridges: 1990–2007—indi-cated that nearly 42 percent of all high-way bridges were classified as struc-turally deficient
17 years ago. By mid-August 2007, however, the combined number of structurally defi-cient and functionally obsolete bridges had decreased to 25.6 percent of all bridges, even as the total number of bridges increased by nearly 5 percent to approximately 600,000 structures, the BTS report noted.3
As of 2003, 27.1 percent of the nation’s bridges (160,570) were structurally deficient or functionally obsolete. In that year, however, one in three urban bridges—a much higher rate than the national average—was in those categories.
Do immigrants use highway bridges at
Section 2
In August 2007, the collapse of the eight-lane bridge in Minneapolis carrying Interstate-35W over the Mississippi River took the lives of 13 people and injured more than 100 others.

THE TWIN CRISES: ImmIgRaTIoN aNd INfRaSTRuCTuRE • Edwin S. Rubenstein
10
greater rates than natives? Probably not. But given the role of immigration in U.S. popula-tion growth, it is not unreasonable to expect that immigrants and their U.S.-born children account for a disproportionate share of the rise in urban bridge traffic.
It would cost $9.4 billion a year for 20 years to repair all substandard bridges ac-cording to the latest estimate, made in 2005, by ASCE.4 In a separate report, the Federal Highway Administration says meeting the backlog of needed bridge repairs would take at least $55 billion.5
That was before the Minneapolis disaster. State bridge inspections in the wake of
the I-35W collapse have uncovered additional structural deficiencies, raising estimated costs of a national bridge makeover. Colorado, for example, identified 125 major bridges in need of major repair, at a cost of $1.4 billion. New Jersey is moving funds from other road proj-ects in order to spend $605 on bridge repairs this year, up from $96 million last year. Nine other states are issuing bonds—taking on debt—raising taxes, hiking fees, or shifting funds from other road projects.6
Meanwhile, federal funding is in decline.
Federal Highway trust fund disbursements fell by $3.2 billion in FY 2008 and are expected to fall further because Americans are driving less.
The administration is also demanding that Congress show more discipline, citing
thousands of special projects, or earmarks, in highway bills that do not reflect the real priorities. The best known among them was the $223 million “Bridge to Nowhere” in Alaska. That provision even-tually faltered, but about $24 billion—a little less than 8 percent of the
total—in the last highway bill was still de-voted to projects singled out by lawmakers for funding.
Shrinking revenues and credit market turmoil will inevitably reduce the funds available for bridges and other infrastruc-ture projects. Reducing the demand for such projects—by population and immigration controls—may be the best alternative.
Immigration’s fiscal Impact
Federal motor fuel taxes generate most of the money available for bridge construction and repair. As described in the highway sec-tion, the gas tax does not yield enough rev-enue to fund needed infrastructure improve-ments. Tax rates have not changed since 1993, and with the economy in recession, a gas tax hike is even more unlikely today.
Of course, the feds could share other tax revenues with state transportation depart-
600,000 bridges in the U.S. (2007)12.6 percent of bridges classified as “structurally deficient” by the Federal Highway Administration (2007)300 million vehicles cross structurally deficient bridges daily$223 million cost of “Bridge to Nowhere” in Alaska (not funded)8.0 percent of the 2006 highway bill earmarked for “pork” projects.
Spending Required to Repair All “Structurally Deficient” Bridges2007: $188 billion (a) ($636 per capita)
2050 projections (b):$279 billion: at current population trends$241 billion: at 50-percent reduction in immigration$188 billion: at zero population growth
Notes: a. ASCE estimate.b. Assumes per capita spending requirements are at 2007 levels.
Sources: Congressional Budget Office, U. S. Department of Transportation, Texas Transportation Institute, American Society of Civil Engineers, Pew Foundation.
Bridges by the Numbers

11
THE SoCIal CoNTRaCT: aN ExCluSIvE REpoRT
ments. The problem is that 98 percent of our bridges (and 97 percent of our roads) are owned by state and local governments, and these governments have often used past in-creases in federal transportation aid merely to replace their own infrastructure spending.
It is clearly a matter of priorities: Politi-cally popular programs like Medicaid and education have crowded out infrastructure. The numbers tell the story:
In 1960, at the height of President Eisen-hower’s commitment to the interstate system, federal infrastructure spending accounted for nearly 12 percent of all non-defense expendi-tures. By 2006, infrastructure’s share was just 3.5 percent. Meanwhile, education and social programs usurped more than 33 percent of non-defense spending in 2006, up from 21 percent in 1960.
Put differently, in 1960, the federal government spent about half as much on infrastructure as it spent on education and means-tested programs; by 2006, it spent only one-tenth as much on infrastructure as on those programs.
Immigration played a major role in this process. Immigrants are poorer, pay less tax, and are more likely to receive public benefits than natives. It follows that the government’s ability to finance discretionary outlays like bridge upgrades and repair is adversely impacted by immigrants—and this negative will increase as the share of immigrants in the population increases.
There is surprisingly little objective re-search on the fiscal burden imposed by immi-grants. The best study is still The New Ameri-cans, the National Research Council’s (NRC) 1997 study of immigration’s economic and demographic impact. The NRC staff analyzed federal, state, and local government expen-ditures on programs such as Medicaid, Aid to Families with Dependent Children (now TANF, Temporary Assistance for Needy Families), and Supplemental Security Income (SSI), as well as the cost of educating immi-grants’ foreign- and native-born children. The
NRC also estimated the average immigrant household’s share of police and fire protec-tion, public works, recreation, higher educa-tion, and municipal assistance.
NRC found that immigrant households receive an average $13,326 in federal benefits while paying $10,664 in federal taxes, that is, they generate a fiscal deficit of $2,682 (1996 dollars) per household. In 2007 dollars, this deficit is $3,408 per household.
The fiscal damage is even more acute at the state and local level. Public education, at a cost of $7,737 per immigrant household, accounts for nearly half of what immigrants currently receive from state and local govern-ments. Means-tested welfare programs rank second, accounting for about one-fifth of all immigrant-related spending by state and local governments. States are required to contribute to as many as 60 different federal means-test-ed programs, including Medicaid and TANF.
The NRC study found that state and local benefits received by the average immigrant household exceed the amount of state and local taxes paid by such households by $4,398 (2007 dollars).
Thus, the average immigrant household generates a total (federal, state, and local) fiscal deficit of $7,806 ($3,408 + $4,398.) This is the net subsidy immigrant households receive from households headed by U.S. natives. There are currently about 36 million immigrants living in about 9 million households, so the aggregate deficit attributable to immigrants comes to $70.3 billion ($7,806 x 9 million.)
Bottom line: Immigrants could deplete the amount of public funds available for infrastructure by as much as $70 billion per year.
California Bridges Falling Down?
California is the immigration capital of the U.S. In 2007, the state’s nearly 10 million immigrants accounted for nearly 28 percent of the state’s population. New York state is a distant second with 4.1 million immigrants
THE TWIN CRISES: ImmIgRaTIoN aNd INfRaSTRuCTuRE • Edwin S. Rubenstein
12
(22 percent of the state’s population).While there is no proof, there is ample
circumstantial evidence that California’s im-migrants are crowding out its infrastructure. In 2004, for example, the state transferred $3.1 billion from the transportation trust fund to the general fund—which finances social pro-grams for immigrants and other economically disadvantaged individuals. That same year, a civil engineer from Modoc, California, was quoted as follows:
“California’s diversion of funds has almost halted the bridge replacement program in most jurisdictions, including our shaky wooden truss bridge with a 3-ton load limit, that provides the only access to a hundred square miles of land, people, and forests. Ever tried to take a 12-ton fire engine over a 3-ton bridge?”7
This news item is also from 2004:“A chunk of the Richmond-San Ra-fael Bridge fell into the bay yester-day afternoon, forcing the closure of a lane and causing major traffic tie-ups in the county that lasted for hours. The 3-foot-wide, 1-foot long hole opened along the trestle section of the bridge exposing the bay below. The span has been bedeviled by holes in recent years. Opened in 1956, the decks on the span have never been replaced and are showing signs of age.”8
As was this: “The Victoria Avenue Bridge, which dates to 1928, will be retro-fitted to withstand an earthquake of magnitude 7.4 if the City Coun-cil approves the $9 million project. The bridge was not built to handle a major earthquake and has dete-riorated over the years. “The work must be done,” said Councilman
Art Gage, who lives nearby and drives across the bridge several times a day. “It’s a little scary looking,” he said of the span. “You see the concrete cracked everywhere.”9
Perhaps we should not be surprised at the following factoid: 38 of the nation’s 50 most heavily trafficked bridges and overpass-es deemed structurally deficient are in South-ern California. Of those, 32 are in Los Angeles County, five in Orange County, and one in Riverside County.10
Drivers in the three Southern California counties alone make more than 27 million crossings on structurally deficient bridges each day.
The Role of Illegal aliens
Before Minneapolis, there was Katrina. The 2005 hurricane weakened bridge infra-
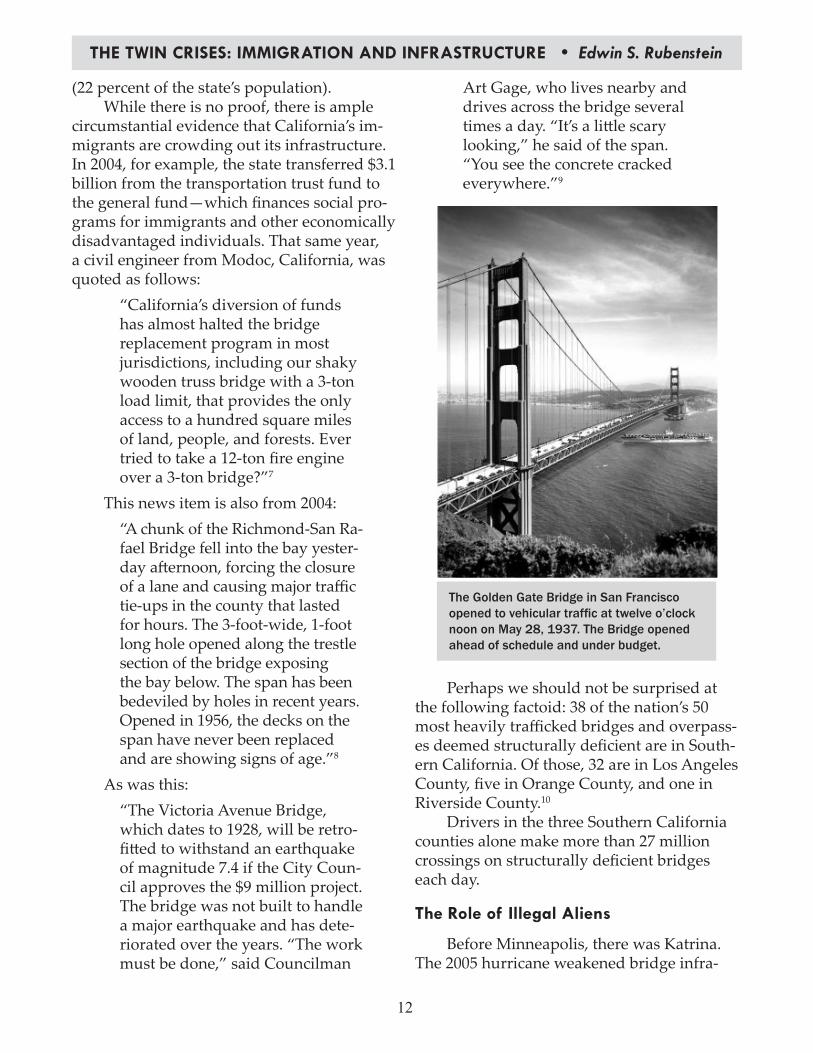
The Golden Gate Bridge in San Francisco opened to vehicular traffic at twelve o’clock noon on May 28, 1937. The Bridge opened ahead of schedule and under budget.

13
THE SoCIal CoNTRaCT: aN ExCluSIvE REpoRT
structure throughout the Mississippi delta. Within a year of that disaster, the Mississippi Department of Transportation (MDOT) spent more than $1 billion on infrastructure projects in south Mississippi, including 90 bridges.
At the top of MDOT’s to-do list were two spans washed away by the hurricane: the bridge over Biloxi Bay and the one at Bay of St. Louis. Those spans were in need of dire re-pair well before Katrina. Understandably, the locals did not care who worked on the bridges as long as the structures were completed on time and were safe to drive on. Apparently MDOT did not care either.
Last year, the owner of Tarrasco Steel, a company that supplied workers on the Biloxi Bay Bridge, was arrested and charged with hiring immigrants on projects in three states. Federal immigration agencies found that most Tarrasco employees were using bogus Social Security numbers. Far worse: they lacked valid welding certifications attesting to their competence for the job. Seventy-seven work-ers were arrested.11
According to an Immigration and Cus-toms Enforcement press release, the Tarrasco probe was a Critical Infrastructure Protection investigation, which “are generally predi-cated on the threat to national security posed by unauthorized workers employed in criti-cal infrastructure-related facilities.”12
The terrorism threat is far less than the
danger of a catastrophic infrastructure failure due to cheap—and incompetent—alien labor. ■
Endnotes
http://pubs.asce.org/magazines/1. CEMag/2008/Issue_01-08/article1.htm. http://findarticles.com/p/articles/mi_2. qn4176/is_20070803/ai_n19440687.http://pubs.asce.org/magazines/3. CEMag/2008/Issue_01-08/article1.htm.http://www.asce.org/files/pdf/4. reportcard/2005_Report_Card-Full_Report.pdf.http://findarticles.com/p/articles/mi_5. qn4176/is_20070803/ai_n19440687.http://www.usatoday.com/news/6. nation/2008-07-24-bridges_N.htm. http://www.asce.org/files/pdf/7. reportcard/2005_Report_Card-Full_Report.pdf.Marin Independent Journal, 8. April 24, 2004. The Press Enterprise9. , [San Bernardino], December 7, 2004. http://www.freerepublic.com/focus/f-10. news/1875585/posts.http://www.accessmylibrary.com/coms2/11. summary_0286-31779382_ITM.http://www.accessmylibrary.com/coms2/12. summary_0286-31779382_I .
Fire and emergency rescuers sift through the wreckage of the Minneapolis bridge shortly after it col-lapsed into the Mis-sissippi River during rush hour traffic. Some 1,500 U. S. bridges col-lapsed between 1966 and 2005, according to the American Soci-ety of Civil Engineers (ASCE).

THE TWIN CRISES: ImmIgRaTIoN aNd INfRaSTRuCTuRE • Edwin S. Rubenstein
14
83,000 dams listed in the government’s national inventory of dams (2007)3,200 dams classified as “unsafe” (2007)80 percent increase in unsafe dams from 1998 to 200715,000 miles of levees in the u.S. (2007)$60,000 cost-per-mile of assessing a levee’s hydrologic condition
Spending Required to Rehabilitate u.S. dams 2007: $36 billion (a) ($119 per capita)
2050 projections (b)$ 53.3 billion: at current population trends$46.2 billion: at 50-percent reduction in immigration$36.0 billion: at zero population growth
Notes: a. american Society of Civil Engineers estimate.b. assumes per-capita spending requirements are at 2007 levels.
Sources: American Society of Civil Engineers, Pew Research Center.
Dams and Levees by the Numbers
Dams and Levees
Catastrophic Midwestern floods in June 2008 drew national attention to a part of the American infrastructure that
often goes unnoticed—the physical barriers that hold back water. Dam and levee failures occurred up and down the Mississippi wa-tershed, inundating cities and cropland with water and raw sewage. The Federal Emer-gency Management Agency (FEMA), the Army Corps of Engineers, and a myriad of other state and federal agen-cies assessed the damage —and will pre-sumably draft recommenda-tions aimed at preventing a recurrence.
We have been here be-fore.
After the last devastating floods in the Midwest 15 years ago, a committee of experts commissioned by the Clinton Administra-tion issued a 272-page report recommending a more uniform approach to managing the Mississippi and its tributaries, including giv-ing the Army Corps of Engineers principal responsibility for many of the levees.
The committee chairman, Gerald E. Galloway, a former brigadier general with the Corps of Engineers, says that few of the recommended changes were made. Once the floodwaters receded from the land, the infra-structure program was forgotten.1
Similarly, after Hurricane Katrina destroyed the levee at Lake Pontchartrain in 2005, Con-gress set up a program to inventory and in-spect levees. But the legislation failed to pro-vide enough money to do this. According to the Army Corps of Engineers, the “geotechni-cal conditions of the levees or the hydrologi-cal conditions of the areas to be protected” could cost as much as $60,000 for each mile of
levee, or $100 million just for the 1,600 miles of levees that protect Califor-nia’s Central Valley region.
Regard-ing the nation’s roughly 15,000 miles of levees, “one of the fundamental problems is that there is a lack of good information about where all the levees are
and what level of protection they are sup-posed to provide,” noted Mark Ogden, presi-dent of the Association of State Dam Safety Officials (ASDSO), in 2007.2
There is no silver bullet. Even if the post-Katrina legislation had been fully funded and complied with, there still would have been flooding in 2008—but with considerably less damage, according to Dr. Galloway.
Whose Dam Responsibility? It would be unthinkable for a state to
build its highways without regard to where
Section 3

15
THE SoCIal CoNTRaCT: aN ExCluSIvE REpoRT
neighboring states were building theirs. To prevent this, the entire interstate highway system is owned and managed by the federal government. Similarly, mass transit systems are usually run by city governments, and electricity generation in a city or metropolitan area is usually the responsibility of one pri-vate, albeit publicly regulated, utility.
By contrast, responsibility for the na-tion’s dams and levees is spread willy-nilly across many entities. Of the more than 83,000 dams listed in the Army Corps of Engineer’s National Inventory of Dams (NID), nearly 56 percent are privately owned. Some are owned by state or local governments or private utili-ties, and fewer than 5 percent are owned by the federal government—although the federal share includes high-profile structures such as the Hoover and Grand Coulee dams.3
A fairly short stretch of river might have dams and levees built and operated by private individuals; corporations, towns, or other governmental entities. Some are inspected and certified by federal authorities as meeting their standards, while others fall through the cracks—figuratively and literally.
An estimated 86 percent of NID dams are monitored by state regulatory programs, programs that are often understaffed and un-derfunded. In some states, each full-time dam safety official must monitor more than 1,000 structures. Alabama, the only state without a dam safety program, does not have a single full-time employee dedicated to dam safety regulation despite the fact that the state has more than 2,000 dams on the NID list, ASDSO data indicate.
Many states are either unwilling or un-able to force dam owners to make needed repair. In Indiana, for example, four dams were damaged by the 2008 floods. Although the state’s Department of Natural Resources (DNR) had repeatedly warned their owners —in some cases for more than 10 years—that the structures were deficient, no fines or other sanctions were imposed. DNR officials say
half of the state’s 1,100 dams need work. Indi-ana initiated legal action against dam owners only 15 to 20 times in the past five years, a DNR spokesman says. 4
Similar derelictions of responsibility have been reported in other states.
At the same time, state dam safety bud-gets and federal grants have been declining. In May 2007, an ASDSO spokesman testified that funding for state assistance grants has “been creeping downward for the past five years.” One particularly dramatic example: the 12 percent drop in a single year—2003 to 2004—from approximately $33 million to ap-proximately $29 million.5
A coordinated flood control system is essential. Building up a levee over one stretch of waterway pushes more water to the oppo-site shore and downstream, with potentially damaging consequences. While the Upper Midwest has wrestled with a hodge-podge of dams and levees for decades, the lower por-tions of the Mississippi have a more standard-ized system of protection.
The north-south flood control gap is rooted in history. After an enormous flood in 1927, the southern portion of the river was declared part of a flood control project area and ordered to have levees designed and in-spected by the Corps of Engineers. That flood spared the Upper Mississippi, and—given the enormous cost of levee building—left those in the north out of the equation. People there kept building on their own. Their descendants now suffer the consequences.
The Condition of u.S. damsMore than 3,200 dams were classified as
“unsafe” in 2007—meaning that their defi-ciencies leave them more susceptible to fail-ure. This figure has increased by as much as 80 percent since 1998, according to a spokes-man of the ASDSO. Moreover, the distribu-tion of unsafe dams is skewed toward several states—Ohio has 825, Pennsylvania 325, and New Jersey 193. The actual number of unsafe

THE TWIN CRISES: ImmIgRaTIoN aNd INfRaSTRuCTuRE • Edwin S. Rubenstein
16
dams is potentially much higher, because some states do not report statistics on such dams.6
In its latest infrastructure Report Card, ASCE assigns a grade of D to dams, noting that: “While federally owned dams are in good condition, and there have been mod-est gains in repair, the number of identified as unsafe is increasing at a faster rate than those being repaired.”
Age is a factor. At present, an estimated 30 percent of NID structures have reached their design life of 50 years; within a decade, 1,700 more NID structures will surpass that 50-year mark, according to the 2005 Congres-sional Research Service report. While older federal dams are well maintained, structures regulated by states and localities are often al-lowed to deteriorate until disaster strikes.
It is estimated that $10.1 billion is needed over the next 12 years to address structural
deficiencies in all critical non-federal dams—dams that pose a direct risk to human life should they fail.7 In November, the House passed the Dam Rehabilitation and Repair Act of 2007. The legislation would provide a little more than $200 million over five years for the repair, rehabilitation, or removal of publicly owned dams that are structurally deficient. This is only a fraction of what is needed to fix all unsafe dams in the nation.
ASCE puts an upbeat spin on it: “Although the measure represents only a “modest amount of mon-ey” toward the billions of dollars needed to fix all unsafe dams in the nation, it will be a good first step—if it becomes law—in creat-ing a dedicated funding source for dam safety similar to that in other federal infrastructure funding programs.”8
Will the 2008 floods loosen Congressional purse strings? Stay tuned.
Immigration and dams: California
California is not the Midwest. The state’s extensive network of dams was built to cope with too little, rather than too much, water. But the expense and potential dangers posed by dams are as daunting.
The Golden State has long struggled with two basic—and conflicting—facts. More than 70 percent of its surface water flow occurs in the northern third of the state, but the major-ity of its population lives in its more arid cen-tral and southern regions. Compounding the problem, the state’s rainfall tends to occur in the winter; summers are usually dry. Ensur-ing an adequate, year-round water supply for the state’s expanding population has spurred numerous efforts to convey water long dis-tances.
The first north-south water system, the Los Angeles Aqueduct, was completed in 1913. In 1941, the Colorado River Aqueduct
Hoover Dam, when it was completed in 1935, was both the world’s largest electric-power gen-erating station and the world’s largest concrete structure.

17
THE SoCIal CoNTRaCT: aN ExCluSIvE REpoRT
began lifting water and transporting it across 242 miles of desert to southern California. In 1973, the biggest water project of them all, dubbed the California State Water Project, was completed. At a cost of more than $2 bil-lion, it was the largest public works project ever undertaken by a single state.
Thanks to immigration, the demand for water now exceeds the California State Water Project’s capacity. Governor Schwarzeneg-ger’s “solution” is to build more dams and reservoirs. In particular, the Guv is pitching a $6 billion reservoir at a location called Sites in the Antelope Valley near Sacramento. Others are not so sure, claiming that there will not be enough surplus water to fill the new dam. Moreover, the dam would contribute ad-versely to global climate change. Although en-ergy would be produced as water is released, since water must be pumped uphill to it, Sites would end up consuming more energy than it makes. Nearly one-fifth of California’s electricity already is used to collect, store, and transport water.
There is an alternative: Reduce per-capita water usage. But this would require terminat-ing water subsidies to corporate agriculture— something the governor would never sup-port. His aversion to immigration controls on seasonal farm workers is similarly designed to coddle big agriculture.
In fact, the entire Sites project is an exer-cise in special-interest legislation. Big corpo-rations and construction companies benefit, while taxpayers lose their shirts. No wonder that the California State Department of Water Resources, the state agency that has been run-ning the numbers on the Site project for the past seven years, has not released a feasibility study. It simply does not like the results.
Even if no new dams were constructed, immigration will increase the number of Cali-fornia dams that pose a safety hazard. That is because the urban sprawl and development that accompanies it bring homes and busi-nesses closer to dams built in what were once remote locations. Dam safety officials refer to
the situation “hazard creep.”One thing is certain: Absent a decline in
immigration, the water supply infrastructure in southern California will be increasingly inadequate and dangerous.
Dams at the Southern Border?
For most of its length, the Rio Grande is a narrow, unimpressive river—completely dry for parts of year along much of its length. In a word, it is not a candidate for new dam infra-structure. But the flow of illegal immigrants over its banks has been large enough to get the locals thinking about it.
In 2007, a group of mayors from Texas border towns called for sections of the river to be dammed as a deterrent to illegal immi-grants.9 The mayors want to deepen and wid-en the natural border with Mexico through a series of low dams—making it too hazardous to cross. They say the dams, together with beefed-up border patrols and electronic sur-veillance, would be much more cost-effective than a fence.
The Bush Administration’s response has been to start construction of hundreds of miles of security fence along the border. It is not clear whether anyone in Washington, D.C., compared the cost/benefit ratios of the two proposals.
When Immigrants Built Dams: New York State
For the first two hundred years of its existence, New York City relied on local sources for its water. Residents drew water from private wells or from a large Manhattan pond called the Collect. The Hudson and East rivers were too brackish to be used for drink-ing water. As the city’s population grew, the quality of well water deteriorated.
By the 1830s, it became clear that the city could never obtain sufficient drinking water from sources in Manhattan alone. A plan to draw water from the Croton River, a tribu-tary of the Hudson, was approved. By 1842, the Croton dam and 41 miles of what became

THE TWIN CRISES: ImmIgRaTIoN aNd INfRaSTRuCTuRE • Edwin S. Rubenstein
18
known as the Croton Aqueduct was success-fully transporting water from upstate to the city.10
Within decades, the demand for water exceed-ed the system’s maximum for safe operations. A new Croton aqueduct and dam was constructed, and the city went on to tap even more distant watersheds. The dam could not have been constructed without the masonry and artistic skills of Italian immi-grants—many of whom were brought over specifi-cally for that purpose.
“The great achieve-ment of Italian manual labor in Westchester is the New Croton Dam, in Cortlandt. It was started in 1892 and was regarded at the time of its comple-tion, in 1907, as the eighth wonder of the world. By any standards, it is an impressive structure: huge blocks of granite taken from nearby quarries rise in a taper-ing curve to a height of 290 feet on a foundation sunk a 124 feet below the riverbed. A decorative corniced border runs along the top layer of blocks between two of the three buttresses and under the concrete road where motorists can get out, lean on the silver-painted guardrail, and take in the view.
The great dam spans 2,500 feet in all, looming over the Croton Gorge and a small county park with scattered maples and ever-greens far below. It holds back 32 billion gallons, whose overflow, released gradually over a series
of steps into a thousand-foot spillway, runs under a huge steel arch and then comes thundering
down into the gorge in three stages, with natural outcrop-pings of rock to break its fall, throwing up mist, rainbows, and a fresh organic smell.”11
The New Croton Dam story is instructive—both as to the changed esthet-ics of public infrastructure and the changed quality of U.S. immigrants. ■
EndnotesMonica Davey, 1.
“Call For Change Ignored, Levees Remain Patchy,” New York Times, June 22, 2008, p. 1.American Society of Civil Engineers, “The 2. Infrastructure Crisis,” Civil Engineering Magazine, January 2008.Congressional Research Service, 3. Aging Infrastructure: Dam Safety, September 2005.Heather Gillers, “State: Dams were 4. Faulty,” Indianapolis Star, June 16, 2008, p.1.Federal Emergency Management Agency, 5. Dam Safety and Security in the United States: A Progress Report on the National Dam Safety Program, September 2006.American Society of Civil Engineers, “The 6. Infrastructure Crisis,” Civil Engineering Magazine, January 2008.American Society of Civil Engineers, 2005 7. Report Card.American Society of Civil Engineers, 8. January 2008.http://news.bbc.co.uk/2/hi/americas/7093779.9. stm.American Society of Civil Engineers, 10. Civil Engineering, November/December 2002. 11. New Yorker Magazine, November 13, 1978.
The New Croton Dam, completed in 1907, is often called “the eighth wonder of the world.”

19
THE SoCIal CoNTRaCT: aN ExCluSIvE REpoRT
Americans take electricity for granted. We do not worry about “generation capacity” or the “power grid” until
the lights dim or air con no longer clicks on. But people who do think about these things see dark days ahead. “Thirty years ago, America had the best electri-cal utility grid system in the world,” says Otto Lynch, the chair of the American Soci-ety of Civil En-gineers’ (ASCE) Structural Engineering Institute. The problem is that while the country has the same system today, “it’s not the best anymore.”
The nation’s electric power grid is aging. Power lines with an expected life of 50 years are still in use 80 years after installation, and wooden poles that should have been replaced after 30 years are rendering as much as 20 additional years of service, Lynch notes. And this system is facing new challenges as the population grows, industrial activity increas-es, and the demand for power rises.1
The need for more generating capacity was starkly demonstrated by an electricity shortage in California in the first half of 2000, the most severe energy crisis in the U.S. for many years. This was followed in August 2003 by the most extensive blackout in U.S.
Electricity Infrastructure Section 4
history, affecting 50 million people across a wide swathe of the northeastern U.S. and southern Canada.
Without additional resources, many parts of the nation, especially California, the
Rocky Moun-tain states, New England, Texas, the Southwest, and the Mid-west, could again fail to meet the de-mand for pow-er, warns the North Ameri-can Electric Re-liability Corpo-ration (NERC) of Princeton, New Jersey.2 While pro-
longed blackouts are expected to be rare, the power grid would be less capable of handling unexpected events, such as extreme weather or the sudden outage of a major plant.
When NERC surveyed 230 bulk power system users, owners, and operators in 2007, ranked first among the technical concerns listed in the survey was the “aging infrastruc-ture and limited new construction.”
The problem: Too many people
Why haven’t electric utilities built suf-ficient supply? Many factors can be cited as explanations, but a good place to start is at the source of all power: electric generators. They are costly and must be sized accord-ing to the population served. Here are the
Electricity by the Numbers
16,924 electric utility generators in the u.S. (2007)2.5 billion tons electric industry Co2 emissions (2006)49 percent coal’s share of the nation’s electric industry fuel (2007)3 percent renewable (biomass, wind, solar, geothermal) share of electricity fuel (2007)$5.1 billion annual cost of complying with federal environmental regulations5 to 10 added cost factor of putting overhead power lines underground
Electric distribution Spending 2005: $15 billion ($50.73 per capita)2050 projections (a)$22.2 billion: at current population trends$19.3 billion: at 50-percent reduction in immigration$16.4 billion: at zero population growth immigration
Note: a. assumes per-capita spending remains at 2005 levels.
Sources: Edison Electric Institute, Pew Foundation Research.

THE TWIN CRISES: ImmIgRaTIoN aNd INfRaSTRuCTuRE • Edwin S. Rubenstein
20
ballpark figures:“The purchase price of electric generators is something like $1 per watt. Coal plants may cost more, nuclear plants will cost a lot more, while natural gas turbines cost perhaps half of this. Let’s use $1 per watt as the basis for some very simple calculations. As a rule of thumb, utilities need about 1,000 watts of capacity for one person. This means that for every person who moves into the ser-vice area of an electrical utility, the utility must spend about $1,000 in capital costs for the purchase of new electric generators. (This does not include fuel and other operat-ing costs, nor does it include the costs of expanding the electrical distribution system that conveys electricity to the consumer. This is simply the cost of purchasing and installing the hardware that generates the electricity.)”3
If a million people are added to the U.S. population, then utilities must come up with another $1 billion for a billion watts (one gigawatt) of new electric generators. If 142 million are added—the expected population growth between now and 2050—utilities must come with an added $142 billion just to keep generator capacity at recommended per-capita levels.
The dilemma facing utilities is perhaps best appreciated at the individual customer level. If a utility’s population base is growing by 1 percent per year, then every person in the service area must pay an additional one percent of $1,000, or $10. This is the per-per-son cost of generators needed to keep capac-ity at the recommended 1,000-watt per-capita level.
The U.S. population is growing at 1 percent per year, on average. In areas of high immigration, higher rates are not unusual. If
a utility’s population base is growing at, say, 3 percent per year, then every man, woman, and child in the service area must pay an additional $30 per year to fund new generat-ing plants. That is $120 a year for a family of four.
If bonds are used to finance the genera-tors, the annual costs may triple.
These numbers suggest why, in recent decades, electric utilities in high immigra-tion areas of the U.S. have been reluctant to purchase new generating capacity. They do not want to hit customers with rate hikes of this magnitude. In many locations utilities were not allowed to pass these costs on to customers.
Is 1,000 watts per person too much? Little by little, Americans are learning to
conserve power. Case in point: California’s per-capita electric-ity demand actually decreased 5 percent during the 20 years before the electricty crisis hit, from a carrying capacity of 7,292 kwh in 1979 to 6,952 kwh in 1999.
Let’s assume that the “rule of thumb” for genera-
tor capacity in California also dropped by 5 percent, or from 1,000 to 950 watts
per person. Where would that have left the state’s utilities?
Answer: Still behind the curve. That is because the state’s population
grew by 43 percent, or more than 8 times the decline in per-capita demand, over the same period (1979 to 1999). Rate hikes in excess of $1,600 per year for a family of four would have been required to maintain per-capita generator capacity at recommended levels over that period of time. That is obviously unthinkable—even in a deregulated market.

21
THE SoCIal CoNTRaCT: aN ExCluSIvE REpoRT
The resulting energy shortage was, by com-parison, easier to accept.4
Bottleneck Ahead: the Power GridIf you generate power, will they receive
it? At one time this was a silly question. The U.S. had the most extensive power grid in the world, full of redundancies that insured un-interrupted power flow. Those days are over. ASCE’s latest infrastructure Report Card was decidedly pessimistic on the U.S. power grid:
“The U.S. power transmission system is in urgent need of mod-ernization. Growth in electric-ity demand and investment in new power plants has not been matched by investment in new transmission facilities. Main-tenance expenditures have de-creased 1 percent per year since 1992. Existing transmission fa-cilities were not designed for the current level of demand, resulting in an increased number of ‘bottle-necks’ which increase costs to consumers and elevate the risk of blackouts.”5
Problems with the U.S. power grid have been apparent for most of this decade. The ex-tensive blackout of August 2003, for instance, started with a shorted-out power line in a remote area of Ohio. The subsequent event plunged approximately 50 million people into darkness from New York City to Toledo, Ohio, and from Ottawa to Windsor, Ontario.
The cascading disaster demonstrated just how fragile our interconnected power system is. The electrical grid across America relies heavily on individual power lines and did not possess the redundancy needed to cope with the Ohio breakdown. It was, according to Otto Lynch, a “perfect example of a bottleneck…. They lose a single line and it caused a cata-strophic failure.”
Making matters worse, attempts to pro-vide such redundancy through new infra-
structure are often stymied by the not-in-my-backyard (NIMBY) reflex. During the 1990s, American Electric Power, of Columbus, Ohio, proposed a new transmission line to serve Virginia and West Virginia. Construction of the line, which crossed several areas of federal land, took just two years. But the approval process lasted 14 years.
This is not an isolated incident: politi-cians and regulators in one state or region often will not allow expansion of the power grid for fear of angering their constituents or activist groups.
The electric power grid is arguably in worse shape than electric generation infra-structure. This is not surprising, given the possibility that urban and suburban sprawl —the area over which electricity must be conveyed—is growing faster than the overall demand for electricity. By displacing residents from central cities, immigration could well be a contributing factor.
California’s Energy debacle
The California power crisis was trig-gered by a fundamental imbalance between the growing demand for power and stagnant power supply. It can be argued that the state’s accommodative policy toward illegal im-migrants was a major factor behind demand growth. At the same time, state regulation artificially reduced electricity supply.
The energy crisis was characterized by a combination of extremely high prices and rolling blackouts lasting from May 2000 to September 2001. Due to price controls, utility companies were paying more for electricity than they were allowed to charge custom-ers, forcing the bankruptcy of Pacific Gas and Electric and the public bail out of Southern California Edison. This led to a shortage in energy and subsequently to the blackouts.
California’s energy regulations did not allow utilities to hedge against future price hikes by purchasing forward contracts. This gave energy suppliers enormous leverage

THE TWIN CRISES: ImmIgRaTIoN aNd INfRaSTRuCTuRE • Edwin S. Rubenstein
22
over their utility customers. By keeping their capacity low relative to demand, suppliers could effectively hold the state hostage by shutting down their plants for “maintenance” in order to tip the demand-supply balance in their favor. These critical shutdowns often oc-curred for no other reason than to force utili-ties to purchase electricity on the “spot mar-ket,” where private suppliers could charge astronomical rates.6
Middleman wholesalers such as Enron exacerbated the crisis. In a market technique known as megawatt laundering, for example, Enron bought up electricity in California when prices were low to sell out of state, creating shortages. In some instances, En-ron deliberately timed the out-of-state sales to create congestion and drive up prices in California.
Under California’s bizarre regulatory regime, utilities no longer owned their own generators. They thus had no incentive to continue funding demand side management programs as a means of avoiding generator costs. The California Energy Commission esti-mates that Demand Side Management (DSM) programs helped reduce California’s electric-ity loads by about 10,000 MW, the equivalent of 20 medium-sized power plants. California was the U.S. leader in energy efficiency. Dur-ing the nineties, power consumption in the U.S. grew at 2.2 percent per year, more than twice the annual growth in the nation’s popu-lation, and 0.7 percentage points higher than California’s growth rate.7
Could demand reduction have prevented the crisis? Not a chance. As noted, California’s population growth more than offset the re-duction in per-capita electricity demand. Bottom line: California’s flawed energy deregulation scheme only masked the primary culprit─explosive population growth.
Green Electricity? Al Gore wants the U.S. to generate 100
percent of its electricity from zero-carbon en-
ergy sources within a decade. This is achiev-able, he claims, because the cost of power from renewable sources, like wind and solar, has been rapidly reduced in recent years while fossil fuel prices have skyrocketed.
Further technological advances could oblit-erate the cost advantage of conventionally produced electricity altogether, making green power both economically and environmen-tally optimal.
Reality check, please. Fossil fuels are used in 71 percent of
U.S. electricity production, led by coal (49 percent), natural gas (20 percent) and oil (2 percent). Nuclear power underlies 19 percent of electric output, and hydropower 7 percent. That leaves the carbon free renewables—wind, solar, geothermal, and biomass—at 3 percent.8
The inexorable reality is that a 90-some fold increase in renewable energy infrastruc-ture would be required to realize Gore’s goal. This in inconceivable, especially given the unfunded needs of existing (conventional) power plants.
If any place is capable of going 100-per-
Former Vice President Al Gore

23
THE SoCIal CoNTRaCT: aN ExCluSIvE REpoRT
cent green, it is California. The state is well endowed with wind and solar energy sourc-es. Hydropower already constitutes about 15 percent of California’s in-state production—more than twice the national average. And over the past three decades Californians have managed to keep their per-capita energy us-age, already the lowest on the nation, essen-tially flat, even as energy use per-capita rose 50 percent in the rest of the country.
But population growth overwhelmed the good wrought by efficiency and green electricity initiatives. Carbon emissions from the Golden State are higher than ever.
Gore should learn from California’s experience, and add population—and immi-gration—control to his green agenda.
Indeed, anyone concerned about the sus-tainability of America’s power grid should make immigration control a top priority.
The Terrorist Threat When the largest power failure in U.S.
history struck the U.S. and Canada in August 2003, terrorism was among the initially sus-pects. That fear proved unfounded—but the vulnerability of the power grid to attack is real and has not been adequately addressed since 9/11.
Although nuclear plant security has been the focus of most anti-terrorism efforts in the energy space, Al-Qaeda and other terror-ist groups are known to have considered all power facilities as possible targets. Extremist groups around the world often attack power lines.
Cyber attacks against the programs that orchestrate power plant operations would be equally disruptive. According to Richard Clarke, a former National Security Council member, a Chinese general has said they would reach out through cyberspace and turn off our electric power grids before any conflict with the United States.9
Increased surveillance, employee back-ground checks, strengthened physical bar-riers, computer firewalls, are all part of the
standard anti-terrorism response. Immigra-tion policy should be on the list also: All the 9/11 terrorists entered the country legally – some as students, some as “tourists.” 10 ■
EndnotesAmerican Society of Civil Engineers, 1. January 2008.North American Electric Reliability 2. Corporation, 2007 Long-Term Reliability Assessment, October 2007.http://www.thesocialcontract.com/pdf/3. eleven-four/xi-4-267.pdf.Carrying Capacity, 4. http://www.carryingcapacity.org/aa1.html.American Society of Civil Engineers, 2005.5. Wikepedia.6. Ahmad Faruqui, et al.,“Analyzing 7. California’s Power Crisis,” The Energy Journal, October 2001. http://www.entrepreneur.com/tradejournals/article/80073666.html.Edison Electric Institute, 8. http://www.eei.org/industry_issues/industry_overview_and_statistics/nonav_key_facts/index.htm.“Asymmetric Cyber Threat,” 9. The Washington Times, November 13, 2007. http://lists.jammed.com/ISN/2007/11/0062.html.http://www.vdare.com/rubenstein/070425_10. nd.htm.

THE TWIN CRISES: ImmIgRaTIoN aNd INfRaSTRuCTuRE • Edwin S. Rubenstein
24
Section 5
Hazardous Waste Removal Infrastructure
The term “hazardous waste” refers to substances that have the potential to increase deaths or serious illnesses, or
to pose a hazard to human health when im-properly stored, transported, or otherwise disposed of. Most hazardous wastes are the unwanted by-products of industrial process-es. Some are generated by small businesses in cities and towns—for example, dry cleaners, auto repair shops, and extermina-tors. Hospitals and power plants also contribute to the hazardous waste disposal problem.
Legislation aimed at clean-ing up hazardous waste was first enacted in December 1980. The Comprehensive Environ-mental Response, Compensation, and Li-ability Act (CERCLA, or Superfund) initially targeted 400 high-priority hazardous waste sites for clean up.
CERCLA was enacted in the wake of the discovery of toxic waste dumps such as Love Canal and Times Beach in the 1970s. It allows the Environmental Protection Agency (EPA) to clean up such sites and to compel respon-sible parties to perform cleanups or reimburse the government for EPA-lead cleanups.
Since its inception nearly 30 years ago, the Superfund Trust Fund has received more than $40 billion to support hazardous waste cleanups. Billions more were appropriated to clean up leaking underground storage tanks and brownfield sites. States have also contrib-uted billions to hazardous waste clean-ups.
Progress toward cleaning up toxic chemi-cals and other hazardous substances has been “sluggish,” according to the American Society of Civil Engineers (ASCE). Monies allocated to the Superfund have declined steadily since 1998, and currently represent a 40-percent re-duction in real purchasing power from 1980s levels.
Meanwhile, the number of contaminated sites on the National Priorities List (NPL) —EPA’s official record of the most hazardous sites in the nation—has increased to 1,500. An additional 20,000 sites need to be cleaned up but are not on the NPL because they fall under the assessment of other federal cleanup programs, according to the Congressional Research Service.2
BrownfieldsAbandoned industrial properties where
expansion or re-development is complicated by environmental concerns are called “brown-field sites” in environmental parlance. While less severely contaminated than Superfund sites, the sheer number of them—600,000 ac-cording to one estimate—s troubling.
Brownfield sites are usually located in a city’s industrial sections or on mountains containing abandoned factories, commercial buildings, or other previously polluting op-erations. Small brownfields also may be found in many older residential neighborhoods. For example, dry cleaning establishments or gas stations that produced high levels of subsur-face contaminants during prior operations, and the land they occupied, might sit idle as brownfields.
Many contaminated brownfield sites

25
THE SoCIal CoNTRaCT: aN ExCluSIvE REpoRT
38.3 million tons of hazardous waste generated (2005)1,500 contaminated sites on the Environmental protection agency’s (Epa) National priorities list (2006)16,191 number of businesses and industrial facilities that generate more than 1 kg (1.1 tons) of hazardous waste per month (2005)11.2 percent of hazardous waste shipped out of state (2005)40.0 percent reduction in inflation adjusted Superfund spending since 1987 (2005)600,000 possible brownfield properties (contaminated sites too small for Supefund)42 percent of Hispanics supporting environmental regulations (2003)
Superfund Spending (a)FY 2007: $1.3 billion ($4.29 per capita)
2050 projections (a)$1.9 billion: at current population trends$1.7 billion: at 50 percent reduction in immigration$1.3 billion: at zero population growth
Note: a. Projections assume per-capita spending stays at 2007 levels and U.S. population grows per the Pew Research Center’s February 2008 forecast1
Sources: Office of Management and Budget (FY 2009 budget), Environmental Protection Agency, american Society of Civil Engineers.
Hazardous Waste by the Numbers
sit unused for decades because the cost of cleaning them to safe standards is more than the land would be worth after redevelopment. However, redevelopment of brownfield sites has become more common in the first decade of the 21st century, as developable land grows less available in highly populated areas.
Infrastructure Supply v. Infrastructure demand
ASCE’s 2005 Report Card gave the na-tion’s hazardous waste cleanup infrastructure
a D. This grade has been disputed, however:“While the nation’s financial com-mitment to cleaning up hazardous waste sites might have earned a poor grade from ASCE, the infra-structure needed to conduct those cleanups is in much better shape,” explains David Case, the execu-tive director of the Environmental Technology Council, a trade asso-ciation based in Washington, D.C., representing the hazardous waste industry.3
“Companies have the equipment, the trained personnel, and the capacity” to conduct Superfund cleanups, brownfield redevelopments, and other private-sector environmental projects, Case says. But the demand—in the form of public or private funding for such cleanups—is inadequate. Indeed, Case believes that “There are more people able to do the cleanups than there are people willing to pay for the cleanup work.”
The hazardous waste remediation in-dustry has invested billions of dollars in acquiring modern equipment, training per-sonnel, and obtaining the neces-sary permits to conduct environmen-tal clean-ups, but the industry has encountered reduced state and federal funding for
such programs “across the board for the past eight years,” says Case.
public Support Slipping
Public support for cleaning up hazard-ous waste dumps has declined in recent years, according to public opinion surveys. A slow-ing economy, terrorism, health care costs, and drug abuse have displaced environmental concerns in the minds of most Americans.
Attitudes toward environmental activism vary greatly with race and ethnicity, however.
For more than two decades the Gallup

THE TWIN CRISES: ImmIgRaTIoN aNd INfRaSTRuCTuRE • Edwin S. Rubenstein
26
and Eagleton polls have asked if environ-mental protection should be a priority even if it might reduce economic growth. In March 2003, less than half (47 percent) of those surveyed nationally said it should. In March 2000, 70 percent responded in favor of the environment; in March 1990, 71 percent chose environmental protection over economic growth.
Even in 1992, when U.S. unemployment spiked at 7.5 percent, 58 percent chose the environment.
An important finding of these surveys is that middle-aged, white, college-educated males are the strongest proponents of envi-ronmental protections. This group is the core of the American po-litical mainstream, a group that elected officials cannot afford to ignore—at least for the next few years.
Among all whites, 68 percent supported environmental regu-lations in 2003. The corresponding figures for blacks, Hispanics, and Asians, were 49 percent, 42 percent, and 38 percent, respectively.4
In 1990, blacks, Hispanics, and Asians constituted 24 percent of the U.S. population. In 2000, they made up 28 percent population. By 2050, today’s minorities will be a majority.
Immigrants and their U.S.-born children will account for 82 percent of U.S. population growth between now and 2050. Most of the foreign-born come from countries in which environmental conditions are far worse than anything found here.
Implication: Demographic changes stem-ming from immigration will put nearly 40 years of U.S. environmental progress at risk.
Importing Hazardous Waste from mexicoThe North American Free Trade Agree-
ment (NAFTA), the U.S.-Mexican-Canadian agreement that went into effect in 1994, affects the management of hazardous waste. The trade agreement considers hazardous waste a “good” that is accordingly free from all international restrictions. Although the Gen-eral Agreement on Tariffs and Trade (GATT) allows countries to restrict entry of a good if it is “necessary to protect human, animal, or plant life or health,” NAFTA also recognized the La Paz agreement—an earlier U.S.-Mexico agreement that waived this right.
In particular, the 1983 La Paz agree-ment states that if Mexico requires hazardous waste generated by maquiladora industries in
northern Mexico to be returned to the U.S., then the U.S. has to ac-cept it for disposal and treatment. Moreover, Mexico is allowed to keep U.S. solid waste out because it lacks adequate infrastruc-ture for disposal.
Maquiladoras are U.S.-owned factories operating in Mexico. Their waste by-prod-
ucts typically start as chemicals in the United States that are shipped to the Mexican plant. Nearly 3,000 such factories line Mexico’s northern border.
How much Mexican waste comes into the U.S.? Good question.
U.S. environmental officials cannot say how much of the waste is trucked in each year, which chemicals are transported in most often, or where the hazardous Mexican waste is dumped in the U.S. This lack of data, com-pounded by spotty inspections, has hampered regulatory efforts at the state and national levels. It also has undermined scrutiny of ma-jor waste importers because there is almost no way for the public to know who these compa-nies are without sorting through thousands of forms.
YEAR TONS
1991 5,7791992 6,8261993 9,8361994 10,5131995 8,5101996 6,9831997 11,057
Source: Environmental protection agency, Region vI and Ix, HaZTRaKS database, 1998.
Imports of Hazardous Waste fromMexico into the U.S., 1991-1997

27
THE SoCIal CoNTRaCT: aN ExCluSIvE REpoRT
Some environmentalists and border regu-lators even suggest that terrorists could take advantage of the limited inspections to shuttle dangerous materials into the United States.
“The federal government really hasn’t done its job in terms of hav-ing people on the border to check (hazardous cargo),” says Steve Owens, director of the Arizona Department of Environmental Quality. “We see it not only as an environmental issue but a security risk.”5
From 1995 to 2002, the government tracked hazardous waste imports. EPA’s Haztraks database registered the amount and kinds of waste, such as heavy metals and solvents, coming into the U.S. from Mexico and also noted where the waste was treated or disposed.
EPA operated Haztraks with its own staff and contract workers who were paid $250,000 per year. In 2003, budget cuts ter-minated the program. Today, EPA relies on a $30,000-a-year program that is much smaller in scope and administered by the Border Compliance Assistance Center, a nonprofit educational group. The center hires a private contractor in Virginia to replicate some of the data entry capabilities that EPA lost. It started compiling numbers on cross-border hazardous waste in early 2007. By the time the center’s computerized figures are made public, they are several months old and riddled with uncertainties.
The state of California is trying to fill the data gap. Crews from the California Depart-ment of Toxic Substances Control check inbound trucks as they queue up for hazard-ous waste inspections at Otay Mesa—the busiest hazardous waste entry port on the U.S. border. The inspectors actually check the contents of barrels of waste against the infor-mation contained in truckers’ manifests.
As a result, more and more waste haul-ers are avoiding California.
“It’s kind of the hazardous waste version of undocumented folks coming across the border,” Steve Owens, director of Arizona the Arizona Department of Envi-ronmental Quality, said. “When they tighten up the borders for hazardous waste entry (in Califor-nia), importers are going to come through Arizona because our borders aren’t controlled.”
Arizona, New Mexico, and Texas rely on U.S. Customs and Border Patrol officials to in-spect imports of toxic waste. But those agents are focused on illegal immigrants and drug traffickers. Border officials typically inspect a very small percentage of hazardous waste shipments, according to a 2005 report by the Commission for Environmental Cooperation, which is sanctioned by the governments of the United States, Canada, and Mexico. The report described the current controls as inef-fective and inconsistent.6
Endnoteshttp://pewresearch.org/pubs/729/united-1. states-population-projectionsforecast.Congressional Research Service, 2. Superfund: Overview and Selected Issues, May 2006.American Society of Civil Engineers, 2008.3. Michael R. Greenberg, “Is Public Support 4. for Environmental Protection Decreasing: An analysis of U.S. and New Jersey Data,” Environmental Health Perspectives, February 2004. http://findarticles.com/p/articles/mi_m0CYP/is_2_112/ai_114559343/print?tag=artBody;col1.Mike Lee, “U.S. Lacks Good Data on 5. Hazardous Materials Trucked from Mexico,” San Diego Union-Tribune, June 12, 2006. http://www.signonsandiego.com/news/mexico/tijuana/20060612-9999-1n12waste.html. Mike Lee, “U.S. Lacks Good Data on 6. Hazardous Materials Trucked from Mexico,” San Diego Union-Tribune, June 12, 2006.
THE TWIN CRISES: ImmIgRaTIoN aNd INfRaSTRuCTuRE • Edwin S. Rubenstein
28
Hospital Infrastructure
Hundreds of infants born to Hispanic immigrants who moved to the New Orleans area after Hurricane Katrina
to work on reconstruction have placed addi-tional strains on the region’s health infrastruc-ture, the New York Times reports. According to the Times, much of the state-financed Charity Hospital system, which provided care to most of the uninsured and low-income residents in the area, remains closed.
The two local health units that are administered by the Louisiana Department of Health and Hospitals from Jan-uary through mid-November admitted more than 1,200 pregnant women, the majority of whom were Hispanic. “Before [Hurricane Katrina], only 2 percent were Hispanic; now 96 percent are Hispanic,” Beth Perriloux, head nurse at the state health and hospi-tals clinic in Metairie, La., said…. Many Hispanic women do not have private health insurance and cannot afford to pay for prenatal care or delivery services, and nonemergency Medicaid is not available to undocumented immi-grants or legal immigrants who have been in the country for fewer than five years….”1
New Orleans suffered a unique natural disaster. The stress placed on its hospital system is increasingly common, however. Hospitals throughout the country have been inundated by uninsured immigrant. The financial strain has affected the quality of medical services, forced hospitals to close clinics and emergency rooms, and put infra-structure expansion plans on hold.
Immigration v. Hospitals Immigrants are disproportion-
ately employed in low-wage jobs, small firms, and service or trade jobs that are less likely to offer health benefits. More than 46 percent of foreign-born noncitizens were uninsured in 2006—three times the uninsurance rate of native-born persons (15 percent). Most of the
growth of the uninsured population is due to immigration: Over the 1994 to 2006
period, immigrants accounted for 55 percent of the increase.2
Although recent im-migrants are the most likely to be uninsured,
even the oldest immi-grant cohorts—those who ar-
rived prior to 1970—are nearly twice as likely to be uninsured than natives.
Legal immigrants are eligible for Medicaid, the federal insurance pro-gram for the indigent, after five years in the U.S. Although illegal immigrants are barred from medical benefits except for emergency room care, their U.S.-born children are entitled to the full gamut of services. An estimated 3 million such “an-chor babies” are living in the U.S.
Medicaid spending on behalf of immigrants has increased far more rapidly
than the amounts paid for native-born recipi-ents.
Hospitals are required to care for Med-icaid beneficiaries as a condition for receiv-ing federal tax exemptions. This is a financial burden for hospitals, however, because Med-icaid reimbursements do not cover the full cost of services. Medicaid underpaid hospitals by $11.3 billion in 2006, up from $2.6 billion in 2000. This translates a payment of 86 cents
Section 6

29
THE SoCIal CoNTRaCT: aN ExCluSIvE REpoRT
5,747 hospitals in the united States (2006)$607.4 billion total expenses of all u.S. hospitals (2006)35.4 million inpatient admissions in 2006118.4 million emergency room visits (2006)5.6 days average length of inpatient stay (2006)2.0 days reduction in average inpatient stay, 1981-200612 million+ uninsured immigrants in the u.S. (2006)92 percent immigrant share of uninsured population growth, 1998-2003
Hospital Infrastructure Spending (a)2005 estimated: $41.0 $billion ($135 per capita)
2050 Spending projections (b)$60.7 billion: at current population trends$52.6 billion: at 50-percent reduction in immigration$41.0 billion: at zero population growth
Notes:a. value of hospitals and clinics under construction in the fourth quarter of 2007. b. assumes per-capita construction spending remains at 2007 levels.
Sources: american Hospital association, Health facilities
Management, Employee Benefit Research Institute, Pew Research Center.
Hospitals by the Numbers
for every dollar spent by hospitals caring for Medicaid patients in 2006.3
Uncompensated health care costs have created a two-tier hospital system. Treat-ment at “safety net” hospitals—that is, those catering primarily to immigrants and other Medicaid patients—lags behind that offered at facilities that do not treat large numbers of such patients:
“Hospitals with high percent-ages of Medicaid patients had worse perfor-mance in 2004 and had sig-nificantly smaller improve-ment over time than those with low per-centages of Medic-aid patients. Hospitals with low percentages of Medicaid patients improved composite acute myo-cardial infarction performance by 3.8 percentage points vs. 2.3 percentage points for those with high percentages…. Larger per-formance gains at hospitals with low percentages of Medicaid patients were also seen for heart failure (difference of 1.4 percent-age points, P = 0.04) and pneu-monia (difference of 1.3 percent-age points, P <.001). Over time, hospitals with high percentages
of Medicaid patients had a lower probability of achieving high-per-formance status.”4
uninsurance v. Infrastructure This is a boom time for hospital con-
struction. A record $41 billion in hospitals and clinics was under construc-tion in the fourth quarter of 2007. Despite the credit crunch and recession fears, medical infrastructure construction growth is expect-ed to continue in the low double digits through 2009.5
There are several reasons for the building boom: obsolete facilities, new technology that improves the efficiency and quality of hospi-
tal care, and seismic code changes that require replacing buildings in California. Overarch-ing everything is the aging of the baby-boom generation.
Abut three-fifths of hospitals of surveyed by the American Hospital Association (AHA) in October 2007 either had projects under con-struction or planned to initiate construction of new projects within three years.
Unfortunately, many hospitals cannot afford to replace inferior facilities. They are deterred by the double whammies of rising uninsured case loads and declining federal reimbursement rates for Medicaid patients, which provide 60 percent of the income re-
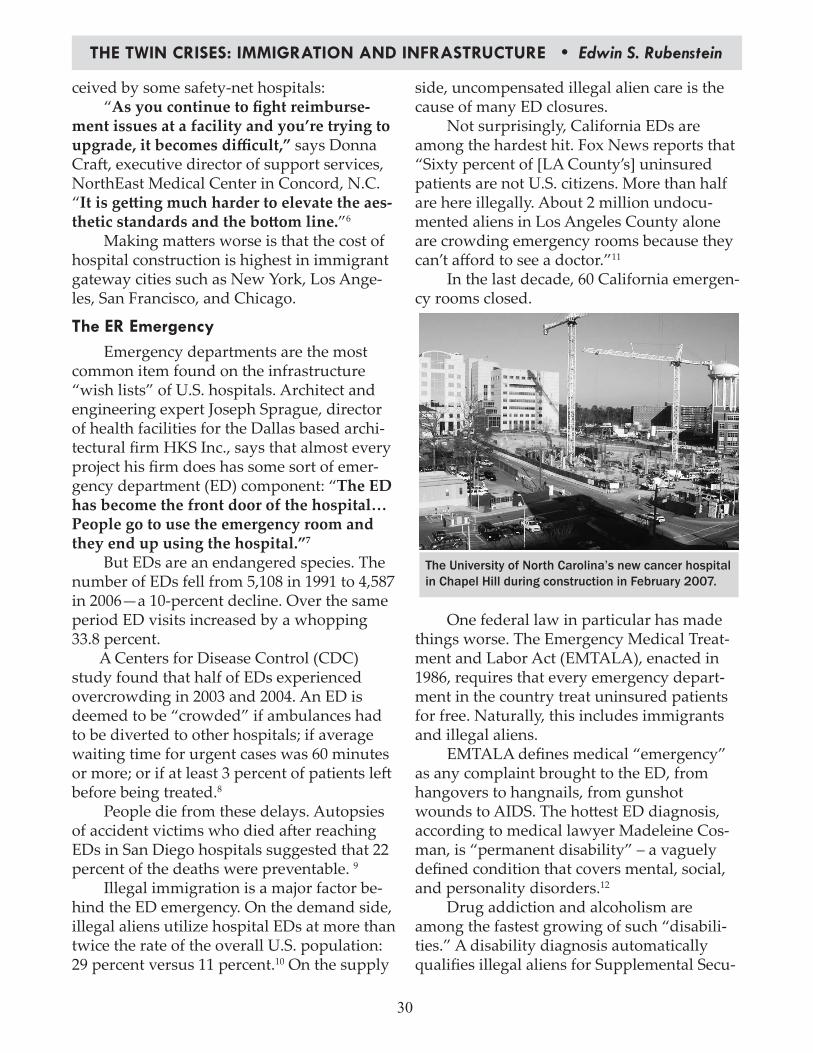
THE TWIN CRISES: ImmIgRaTIoN aNd INfRaSTRuCTuRE • Edwin S. Rubenstein
30
ceived by some safety-net hospitals:“As you continue to fight reimburse-
ment issues at a facility and you’re trying to upgrade, it becomes difficult,” says Donna Craft, executive director of support services, NorthEast Medical Center in Concord, N.C. “It is getting much harder to elevate the aes-thetic standards and the bottom line.”6
Making matters worse is that the cost of hospital construction is highest in immigrant gateway cities such as New York, Los Ange-les, San Francisco, and Chicago.
The ER Emergency Emergency departments are the most
common item found on the infrastructure “wish lists” of U.S. hospitals. Architect and engineering expert Joseph Sprague, director of health facilities for the Dallas based archi-tectural firm HKS Inc., says that almost every project his firm does has some sort of emer-gency department (ED) component: “The ED has become the front door of the hospital…People go to use the emergency room and they end up using the hospital.”7
But EDs are an endangered species. The number of EDs fell from 5,108 in 1991 to 4,587 in 2006—a 10-percent decline. Over the same period ED visits increased by a whopping 33.8 percent. A Centers for Disease Control (CDC) study found that half of EDs experienced overcrowding in 2003 and 2004. An ED is deemed to be “crowded” if ambulances had to be diverted to other hospitals; if average waiting time for urgent cases was 60 minutes or more; or if at least 3 percent of patients left before being treated.8
People die from these delays. Autopsies of accident victims who died after reaching EDs in San Diego hospitals suggested that 22 percent of the deaths were preventable. 9
Illegal immigration is a major factor be-hind the ED emergency. On the demand side, illegal aliens utilize hospital EDs at more than twice the rate of the overall U.S. population: 29 percent versus 11 percent.10 On the supply
side, uncompensated illegal alien care is the cause of many ED closures.
Not surprisingly, California EDs are among the hardest hit. Fox News reports that “Sixty percent of [LA County’s] uninsured patients are not U.S. citizens. More than half are here illegally. About 2 million undocu-mented aliens in Los Angeles County alone are crowding emergency rooms because they can’t afford to see a doctor.”11
In the last decade, 60 California emergen-cy rooms closed.
One federal law in particular has made things worse. The Emergency Medical Treat-ment and Labor Act (EMTALA), enacted in 1986, requires that every emergency depart-ment in the country treat uninsured patients for free. Naturally, this includes immigrants and illegal aliens.
EMTALA defines medical “emergency” as any complaint brought to the ED, from hangovers to hangnails, from gunshot wounds to AIDS. The hottest ED diagnosis, according to medical lawyer Madeleine Cos-man, is “permanent disability” – a vaguely defined condition that covers mental, social, and personality disorders.12
Drug addiction and alcoholism are among the fastest growing of such “disabili-ties.” A disability diagnosis automatically qualifies illegal aliens for Supplemental Secu-
The University of North Carolina’s new cancer hospital in Chapel Hill during construction in February 2007.

31
THE SoCIal CoNTRaCT: aN ExCluSIvE REpoRT
rity Income, a federally funded cash transfer payment.
Fines of up to $50,000 are imposed on hospitals refusing to treat ED patients—even when the attending physician examines and declares the patient’s illness or injury to be a non-emergency. Lawyers and special interest groups are granted more authority than doc-tors in these matters.
EMTALA was supposed to make EDs more accessible to the uninsured. Talk about unintended consequences!
“Not only did this unfunded mandate contribute to the closure of numerous emergency depart-ments and trauma centers, it also created a perverse incentive for hospitals to tolerate emergency department crowding and divert ambulances while continuing to accept elective admissions. Rather than improving access to emer-gency care, EMTALA diminished it.”13
Hospitals Strike Back Illegal aliens enter the U.S. medical
system via the EDs. Their ED stays are usually short, albeit costly in the aggregate. Some-times things go horribly awry, however.
Case in point: Luis Alberto Jimenez. Mr. Jimenez, working as a gardener in Stuart, Florida, suffered devastating injuries in a car crash with a drunken Floridian. Martin Me-morial Hospital saved his life, but the crash’s impact on his brain left Jimenez incapacitated. After failing to find a rehabilitation center willing to accept an uninsured patient, the hospital kept him as a ward for years at a cost of $1.5 million.
Medicaid does not cover long term care for illegals. Neither does the state of Florida. Martin Memorial originally had no recourse except to keep Mr. Jimenez as a long-term care patient. He became essentially a boarder at the hospital, wheeling around the hallways
and hanging out with the nurses. Over time, Mr. Jimenez became depressed, exhibiting anti-social habits such as spitting, yelling out, kicking, and defecating on the floor.
What happened next set the stage for a continuing legal battle: Martin Memorial leased an air ambulance for $30,000 and flew Mr. Jimenez back to his home country of Gua-temala. U.S. immigration authorities were not consulted and played no role in his transfer.
Prior to the transfer, the hospital contact-ed Guatemalan authorities. Eventually a letter from the Guatemalan health minister arrived, assuring Martin Memorial that his country was prepared to care for Mr. Jimenez.
Martin Memorial is not alone. Medical deportations are happening with varying frequency and varying degrees of patient consent throughout the country. No govern-ment agency tracks them, but a recent New York Times article provides snapshots of the phenomenon: 96 medical deportations at St. Joseph hospital in Phoenix, Arizona; 6 to 8 patients repatriated from Broward County Medical Center in Ft. Lauderdale, Florida; 10 flown to Honduras from Chicago hospi-tals since early 2007; some 87 cases involving Mexican illegals deported by San Diego area hospitals.14
There is enough medical deportation traffic to sustain at least one transportation company. MexCare, founded six years ago to service this niche, is headquartered in Califor-nia but connects hospitals throughout the U.S.

THE TWIN CRISES: ImmIgRaTIoN aNd INfRaSTRuCTuRE • Edwin S. Rubenstein
32
with a network of 28 hospitals and treatment centers in Latin America.
Hospital administrators view these as costly, burdensome transfers that force them to shoulder responsibility for failures of the U.S. immigration system. Medical deporta-tions are a last resort—designed to free up beds for ill U.S. citizens. In the long run, these transfers prevent an even worse scenario: financial insolvency and closure of a commu-nity’s hospital.
Martin Memorial is being groomed as a test case by the pro-immigration lobby. Per-haps the hospital should sue the U.S. Depart-ment of Homeland Security. ■
Endnotes
“Infants Born To Hispanic Immigrants 1. In New Orleans Straining City’s Health Infrastructure,” Medical News Today, December 13, 2006. http://www.medicalnewstoday.com/articles/58704.php.Employment Benefits Research Institute, 2. http://papers.ssrn.com/sol3/papers.cfm?abstract_id=1226382.American Hospital Association, 3. http://www.aha.org/aha/content/2007/pdf/07-medicare-shortfall.pdf.Rachel M. Werner, et al., “Comparison 4. of Change in Quality of Care Between Safety-Net and Non-Safety Net Hospitals,” Journal of the American Medical Association, May 2008. http://jama.ama-assn.org/cgi/content/5. abstract/299/18/2180.
Health Facilities Management, 6. 2008 Hospital Building Report, February 2008. http://hhnmag.com/ashe/facilities/pdfs/hfmbuildprpt.pdf.http://hhnmag.com/ashe/facilities/pdfs/7. hfmbuildprpt.pdf.http://hhnmag.com/ashe/facilities/pdfs/8. hfmbuildprpt.pdf.Centers for Disease Control, 9. Staffing, Capacity, and Ambulance Diversion in Emergency Departments: United States, 2003-04, September 27, 2006. 9. “Crisis Seen in Nation’s ER Care,” By David Brown, Washington Post, June 15, 2006. FAIR, “Illegal Immigration and 10. Public Health.” http://www.fairus.org/site/PageServer?pagename=iic_immigrationissuecenters64bf“11. L.A. Emergency Rooms Full of Illegal Immigrants,” March 18, 2005. http://www.foxnews.com/story/0,2933,150750,00.html.Madeleine Pelner Cosman, “Illegal Aliens 12. and American Medicine,” Journal of American Physicians and Surgeons, Spring 2005.Arthur L. Kellermann, “13. Crisis in the Emergency Department,” New England journal of Medicine, September 28, 2006 http://content.nejm.org/cgi/content/full/355/13/1300.Deborah Sontag, “Immigrants Facing 14. Deportation by U.S. Hospitals,” New York Times, August 3, 2008. http://www.nytimes.com/2008/08/03/us/03deport.html.