the true cost of motion picture - sovietunit.net · the true cost of motion picture piracy to...
TRANSCRIPT

The True Cost of Motion PicturePiracy to 'the, U .5. Econo,my
By Stephen E. Siwek
'v~(
~
Institute For Policy Innovation
SEPTEMBER 2006
Institute for Policy Innovation: Policy Report #186 Th e True Cost of Motion Picture Piracy to the U.S. Economyi
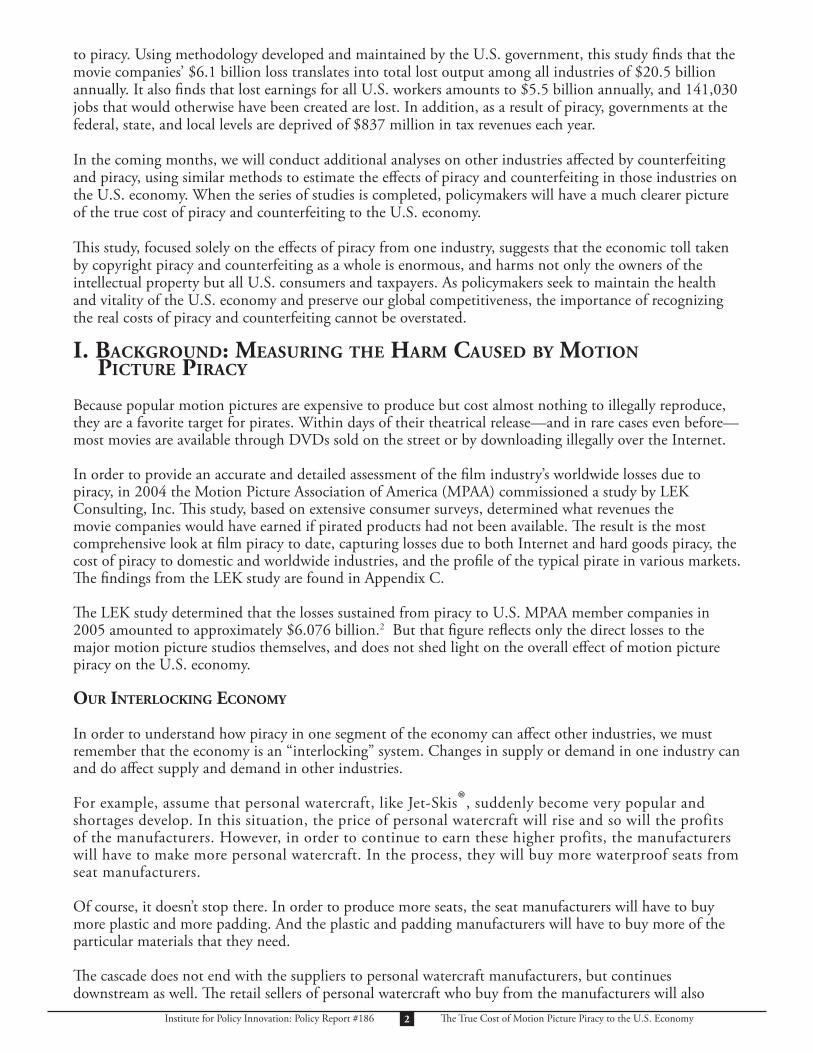
EXECUTIVE SUMMARY
Synopsis: Motion picture piracy costs the fi lm industry billions of dollars in lost revenue, but this is only a fraction of its impact on the total U.S. economy. Combining the lat-est data on worldwide movie piracy with multipliers from a respected U.S. government model, this study concludes that motion picture piracy costs American workers signifi -cant losses in jobs and earnings, and costs governments enormous lost tax revenue.
It is obvious that copyright piracy and counterfeiting harm the intellectual property owner, who loses the revenue that would have been gained had the legitimate product been purchased. But that is only part of the story. Piracy and counterfeiting also cause signifi cant and measurable harm to the overall economy, directly aff ecting upstream suppliers and downstream purchasers, with a cascading eff ect that includes lost output, lost earnings, lost jobs, and lost tax revenues.
In order to inform policymakers of the true magnitude of piracy’s ripple eff ect, this paper estimates the impact of piracy in one industry—the motion picture industry—on the overall U.S. economy. Using the RIMS II mathematical model maintained by the U.S. Bureau of Economic Analysis (BEA), this analysis estimates the impact of motion picture piracy on economic output, jobs, personal income, and tax revenues. It is the fi rst of a series of papers that will provide a comprehensive estimate of the overall impact of piracy and counterfeiting.
Th is study utilizes, as a starting point, the lost revenue fi gures from a recent and comprehensive world-wide consumer research study conducted by LEK Consulting and released in May 2006 by the Motion Picture Association of America (MPAA). According to the LEK study, MPAA studios lost $6.1 billion to piracy in 2005.
Applying the RIMS II tool to the LEK loss fi gures reveals that the true cost of movie piracy to the U.S. economy is far more than $6.1 billion. Instead, the comprehensive estimate of losses reveals that:
• Motion picture piracy now results in total lost output among all U.S. industries of $20.5 billion annually. Output includes revenue and related measures of economic performance.
• Motion picture piracy costs U.S. workers $5.5 billion annually in lost earnings. Of this amount, $1.9 billion would have been earned by workers in the motion picture industries while $3.6 billion would have been earned by workers in other U.S. industries.
• Motion picture piracy costs jobs. Absent piracy, 141,030 new jobs would have been added to the U.S. economy. Of this total, 46,597 jobs would have been created in the motion picture industries while 94,433 jobs would have been added in other industries.
• Motion picture piracy costs governments at all levels $837 million in lost tax revenue. Ab-sent piracy, an additional $147 million in corporate income taxes from motion picture corporations, $91 million in other taxes on motion picture production or sales, and $599 million in personal income taxes from employees would have been paid annually to fed-eral, state and local governments.
Th e true cost of motion picture piracy far exceeds its impact on the movie producers themselves, and harms not only the owners of the intellectual property but also all U.S. consumers and taxpayers. As policymakers seek to maintain the health and vitality of the U.S. economy and preserve our global competitiveness, it is imperative that government and industry work together to combat this growing problem.
Institute for Policy Innovation: Policy Report #186 Th e True Cost of Motion Picture Piracy to the U.S. Economyii
TABLE OF CONTENTS
Introduction . . . . . . . . . . . . . . . . . . . . . . . . . . . . . . . . . . . . . . . . . . . . . . . . . . . . . . . . . . . . . . . . . . . . . . . 1 I. Background: Measuring the Harm Caused by Motion Picture Piracy . . . . . . . . . . . . . . . . . . . . . . . 2
Our Interlocking Economy . . . . . . . . . . . . . . . . . . . . . . . . . . . . . . . . . . . . . . . . . . . . . . . . . . . . . 2 Th e RIMS II Model . . . . . . . . . . . . . . . . . . . . . . . . . . . . . . . . . . . . . . . . . . . . . . . . . . . . . . . . . . . 4
II. Methodology: Piracy Losses to Motion Picture Production, Distribution, and Exhibition . . . . . . 5
Production Losses . . . . . . . . . . . . . . . . . . . . . . . . . . . . . . . . . . . . . . . . . . . . . . . . . . . . . . . . . . . . . 5 Th eatrical Exhibition Losses . . . . . . . . . . . . . . . . . . . . . . . . . . . . . . . . . . . . . . . . . . . . . . . . . . . . 6 Home Video Distribution Losses . . . . . . . . . . . . . . . . . . . . . . . . . . . . . . . . . . . . . . . . . . . . . . . . . 6 Th e Applicable RIMS II Multipliers . . . . . . . . . . . . . . . . . . . . . . . . . . . . . . . . . . . . . . . . . . . . . . 6
III. Findings: Th e Impact of Motion Picture Piracy on the Overall Economy . . . . . . . . . . . . . . . . . . . 8
Total Lost Output, Employment, and Earnings from Movie Piracy . . . . . . . . . . . . . . . . . . . . . . 8 Direct Lost Employment and Earnings . . . . . . . . . . . . . . . . . . . . . . . . . . . . . . . . . . . . . . . . . . . . 9 Motion Picture Piracy: Lost Tax Revenues . . . . . . . . . . . . . . . . . . . . . . . . . . . . . . . . . . . . . . . . 11
Conclusion . . . . . . . . . . . . . . . . . . . . . . . . . . . . . . . . . . . . . . . . . . . . . . . . . . . . . . . . . . . . . . . . . . . . . . . 13
Appendix A—Motion Picture Industry Multipliers . . . . . . . . . . . . . . . . . . . . . . . . . . . . . . . . . . . . . . . 14 Appendix B—Determining Tax Losses . . . . . . . . . . . . . . . . . . . . . . . . . . . . . . . . . . . . . . . . . . . . . . . . . 17 Appendix C—Conclusions of the LEK Study . . . . . . . . . . . . . . . . . . . . . . . . . . . . . . . . . . . . . . . . . . . . 20
Endnotes . . . . . . . . . . . . . . . . . . . . . . . . . . . . . . . . . . . . . . . . . . . . . . . . . . . . . . . . . . . . . . . . . . . . . . . . 28 About the Author . . . . . . . . . . . . . . . . . . . . . . . . . . . . . . . . . . . . . . . . . . . . . . . . . . . . . . . . . . . . . . . . . . 28 About the Institute for Policy Innovation . . . . . . . . . . . . . . . . . . . . . . . . . . . . . . . . . . . . . . . . . . . . . . . 28
© 2006 Institute for Policy Innovation
IPI Policy Reports are published by the Institute for Policy Innovation (IPI), a non-profi t public policy organization.
NOTE: Nothing written here should be construed as an attempt to infl uence the passage of any legislation before Congress. Th e views expressed in this publica-tion are the opinions of the authors, and do not necessarily refl ect the view of the Institute for Policy Innovation or its directors.
Direct inquiries to: Institute for Policy Innovation 1660 S. Stemmons Freeway, Suite 475 Lewisville, TX 75067
(972) 874-5139 (Voice) Email: [email protected](972) 874-5144 (FAX) Internet Web site: www.ipi.org

Institute for Policy Innovation: Policy Report #186 Th e True Cost of Motion Picture Piracy to the U.S. Economy
INTRODUCTION
It is well-known that rampant piracy and counterfeiting of desirable products such as movies, recorded music, software, pharmaceuticals, and name-brand and designer consumer goods harm the bottom lines of the companies that produce these products. Because of the innovative and creative nature of our economy, U.S. companies are particularly vulnerable.
Companies work diligently to protect their products, employing civil enforcement, utilizing technology, and forming industry coalitions—as companies have in the U.S. through the United States Chamber of Commerce’s Coalition Against Counterfeiting and Piracy (CACP)—to increase understanding of the scope of the problem and drive greater government-wide eff orts to address this threat. Ultimately, however, given the global nature of the problem and its criminal character, government must play a crucial role in combating piracy and counterfeiting, and insisting on the enforcement of intellectual property rights as part of agreements with our trading partners.
Unfortunately, there has been little reliable economic information available to U.S. policymakers to assist them in balancing the importance of enforcing intellectual property rights against other priorities. To begin to address that problem, I published last year Engines of Growth: Economic Contributions of the U.S. Intellectual Property Industries,1 which examined the contributions to the U.S. economy of the “IP industries”—industries that rely most heavily on copyright or patent protection to generate revenue, employ and compensate workers, and contribute to growth. Th e study found, among other things, that these IP industries are the most important growth drivers in the U.S. economy, contributing nearly 40% of the growth achieved by all U.S. private industry and nearly 60% of the growth of U.S. exportable products. It also found that the IP industries are responsible for one-fi fth of the total U.S. private industry’s contribution to GDP and two-fi fths of the contribution of U.S. exportable products and services to GDP.
But if the IP industries are worth protecting because of their contributions to the U.S. economy, policymakers still need sound information on the impact of piracy and counterfeiting on the U.S. economy to enable them to gauge the appropriate level of resources to deploy against the problem. To be sure, many industries cite statistics on piracy or counterfeiting losses specifi c to them, and some overall estimates of losses due to piracy and counterfeiting periodically surface in the media. But there is noticeably little data that reliably estimates the total economic impact piracy and counterfeiting have on the U.S. economy—including the impact on tax revenue, job creation, and economic output.
Th is study is a fi rst step in this direction. It concentrates solely on movie piracy, taking as its starting point a recent comprehensive analysis that found that the major U.S. movie companies lost $6.1 billion in 2005
THE TRUE COST OF
MOTION PICTURE PIRACY
TO THE U.S. ECONOMY
by Stephen E. Siwek
1
Institute for Policy Innovation: Policy Report #186 Th e True Cost of Motion Picture Piracy to the U.S. Economy
to piracy. Using methodology developed and maintained by the U.S. government, this study fi nds that the movie companies’ $6.1 billion loss translates into total lost output among all industries of $20.5 billion annually. It also fi nds that lost earnings for all U.S. workers amounts to $5.5 billion annually, and 141,030 jobs that would otherwise have been created are lost. In addition, as a result of piracy, governments at the federal, state, and local levels are deprived of $837 million in tax revenues each year.
In the coming months, we will conduct additional analyses on other industries aff ected by counterfeiting and piracy, using similar methods to estimate the eff ects of piracy and counterfeiting in those industries on the U.S. economy. When the series of studies is completed, policymakers will have a much clearer picture of the true cost of piracy and counterfeiting to the U.S. economy.
Th is study, focused solely on the eff ects of piracy from one industry, suggests that the economic toll taken by copyright piracy and counterfeiting as a whole is enormous, and harms not only the owners of the intellectual property but all U.S. consumers and taxpayers. As policymakers seek to maintain the health and vitality of the U.S. economy and preserve our global competitiveness, the importance of recognizing the real costs of piracy and counterfeiting cannot be overstated.
I. BACKGROUND: MEASURING THE HARM CAUSED BY MOTION PICTURE PIRACY
Because popular motion pictures are expensive to produce but cost almost nothing to illegally reproduce, they are a favorite target for pirates. Within days of their theatrical release—and in rare cases even before—most movies are available through DVDs sold on the street or by downloading illegally over the Internet.
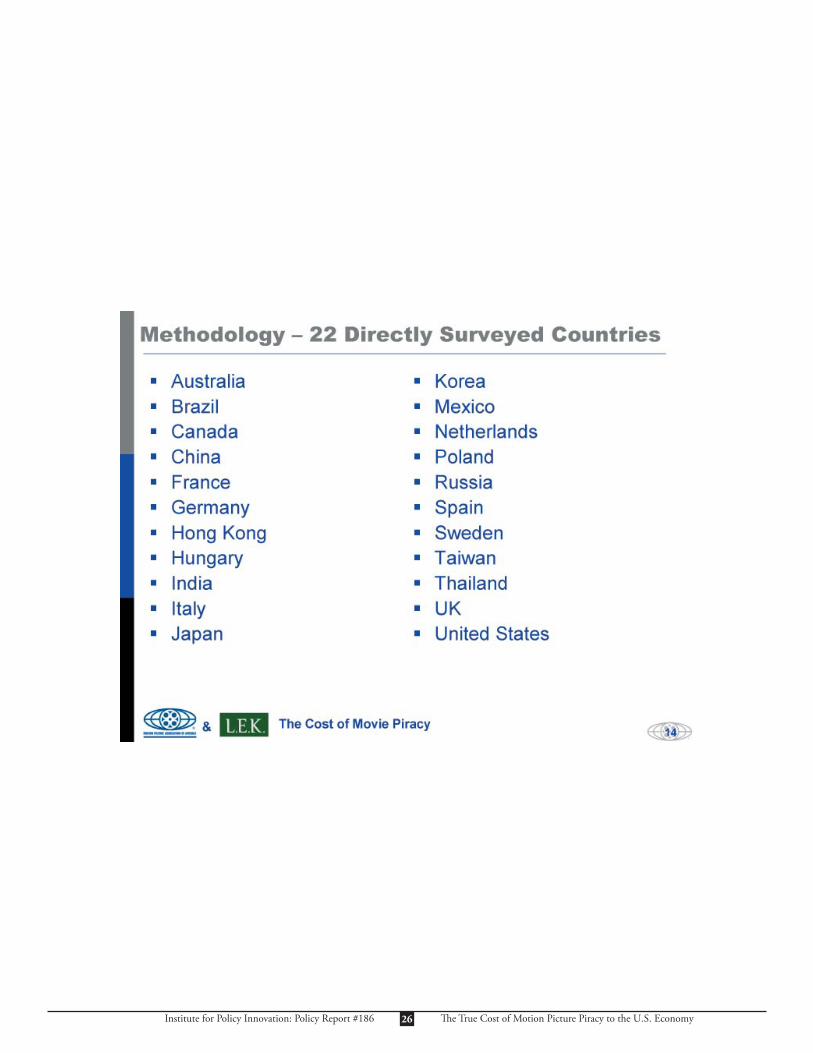
In order to provide an accurate and detailed assessment of the fi lm industry’s worldwide losses due to piracy, in 2004 the Motion Picture Association of America (MPAA) commissioned a study by LEK Consulting, Inc. Th is study, based on extensive consumer surveys, determined what revenues the movie companies would have earned if pirated products had not been available. Th e result is the most comprehensive look at fi lm piracy to date, capturing losses due to both Internet and hard goods piracy, the cost of piracy to domestic and worldwide industries, and the profi le of the typical pirate in various markets. Th e fi ndings from the LEK study are found in Appendix C.
Th e LEK study determined that the losses sustained from piracy to U.S. MPAA member companies in 2005 amounted to approximately $6.076 billion.2 But that fi gure refl ects only the direct losses to the major motion picture studios themselves, and does not shed light on the overall eff ect of motion picture piracy on the U.S. economy.
OUR INTERLOCKING ECONOMY
In order to understand how piracy in one segment of the economy can aff ect other industries, we must remember that the economy is an “interlocking” system. Changes in supply or demand in one industry can and do aff ect supply and demand in other industries.
For example, assume that personal watercraft, like Jet-Skis®, suddenly become very popular and shortages develop. In this situation, the price of personal watercraft will rise and so will the profits of the manufacturers. However, in order to continue to earn these higher profits, the manufacturers will have to make more personal watercraft. In the process, they will buy more waterproof seats from seat manufacturers.
Of course, it doesn’t stop there. In order to produce more seats, the seat manufacturers will have to buy more plastic and more padding. And the plastic and padding manufacturers will have to buy more of the particular materials that they need.
Th e cascade does not end with the suppliers to personal watercraft manufacturers, but continues downstream as well. Th e retail sellers of personal watercraft who buy from the manufacturers will also
2

Institute for Policy Innovation: Policy Report #186 Th e True Cost of Motion Picture Piracy to the U.S. Economy
be able to earn more money by raising prices or increasing volume. In their wake, specialty stores that customize personal watercraft or sell parts also stand to benefi t.
Th ese kinds of interactions among industries are captured in input-output tables. Input-output tables measure the interrelationships that exist among diff erent industries. With this information, one can then estimate what impact a specifi c change in one industry will have on other industries.
What is true for personal watercraft is equally true for motion pictures. If the revenue generated by making motion pictures increases (in this case, not by higher demand but by a decrease in piracy), movie companies will make more movies, invest in higher quality, broader distribution or more marketing, or some combination of these activities in order to capture more profi ts. [See Sidebar “A Decrease In Piracy Expands Production”]
As more movies are made, or more is invested in making, marketing and distributing movies, the people and companies that supply movies will make more money. Th ese include, for example, ad agencies, who sell more copy to newspapers and television promoting the fi lms, and the newspapers and television stations that attract the increased revenue.
Th e benefi ts fl ow downstream as well. Video retailers, for example, will sell and rent more titles. Movie theaters will sell more tickets and more popcorn. Corn growers earn more profi ts, and can buy more farm equipment. And so on.
3
A DECREASE IN PIRACY EXPANDS PRODUCTION
Th e LEK study estimated the losses sustained by the U.S. motion picture industry as a result of global piracy. In this study, we estimate the gains to U.S. industries, to U.S. workers and to U.S. national, state and local governments that would occur absent those piracy losses. Th is analysis can be viewed either as an estimate of the damages sustained by the U.S. as a result of piracy in the past year or as an estimate of the gains that could be realized in the future if global piracy were substantially curtailed.
One way to characterize the LEK study is that it measures the increased demand for legitimate U.S. fi lm products that would be observed throughout the world if piracy did not exist. Th e increased demand for U.S. motion pictures is quantifi ed on a market-by-market basis in the LEK study and valued at the legitimate prices now in eff ect for motion pictures in each geographic market. Th e LEK study provides ample proof that suffi cient demand for legitimate U.S. fi lms now exists to justify the expansion in motion picture production and employment that is quantifi ed subsequently in this study.
From the supply side perspective, we assume that the market for legitimate motion picture production and distribution would remain intensely competitive as it is today. We see little reason to assume the alternative: that absent piracy, motion picture producers would (or even could) cease to compete with each other.
We also assume that with a larger potential market for legitimate fi lms, profi t-seeking fi lm producers could readily expand their production schedules to off er additional fi lms or more expensive fi lms or both. Th e motion picture industry does not face many of the production bottlenecks that might limit the ability of other industries to satisfy increased demand for their products.1 More importantly, motion picture producers would likely seek to exploit the expansion of the market for legitimate U.S. fi lms, not only by creating more fi lms but also by increasing the audience appeal of each fi lm through the use of more marketing, for example.
Indeed, as a general matter, we would expect profi t-seeking producers to spend more on creative inputs the larger the potential market for the fi lm. Higher quality inputs, in turn should increase the production’s share of revenue from the market and increased share is more valuable in a larger market.2 Because of these considerations, motion picture producers could (and as competitors, clearly would) attempt to meet the increased demand for legitimate U.S. fi lms through a variety of strategies. Th ese strategies might involve the production of more fi lms or , investment in higher quality, broader distribution or more marketing, or some combination of these activities . Precisely because of this fl exibility, however, there is little reason to believe that supply side constraints would inhibit the U.S. motion picture industry from satisfying even a signifi cant increase in the demand for its products.
1 For example, the motion picture industry could expand its production eff orts to other locations and could commit to use less well known actors, directors, writers and special eff ects fi rms.
2 Wildman, S., and Siwek, S., International Trade in Films and Television Programs, Ballinger Publishing co., 1988. Pages 68-70.
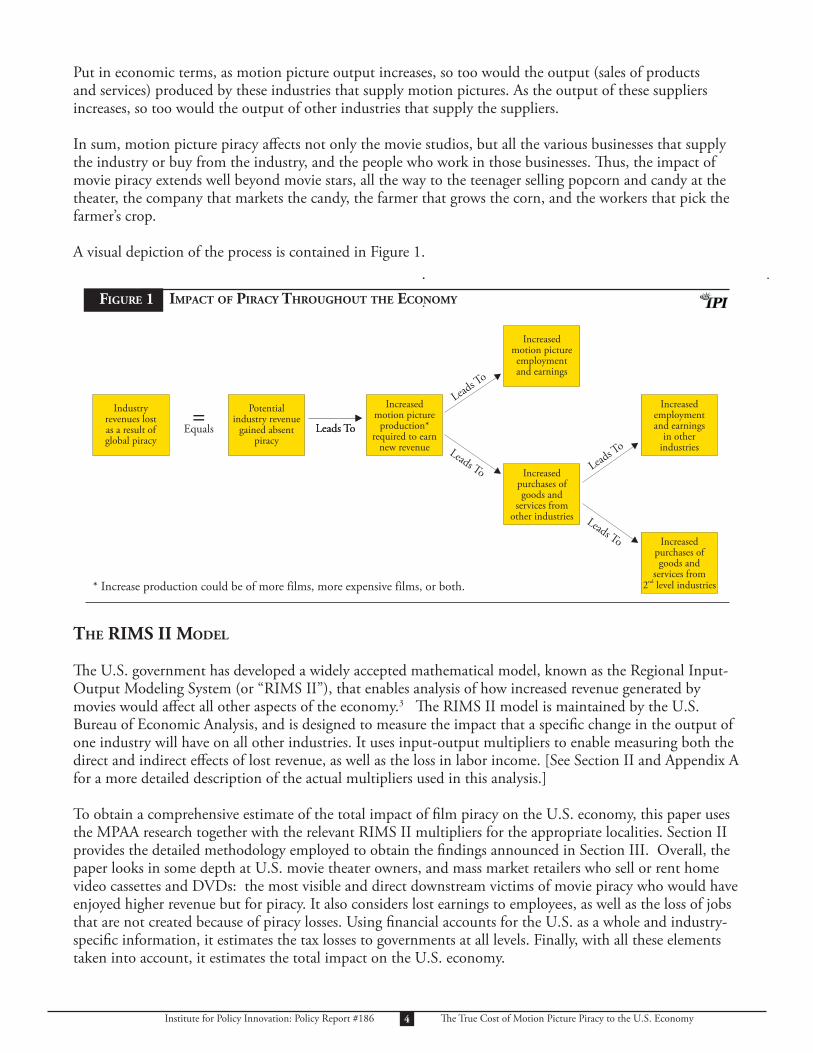
Put in economic terms, as motion picture output increases, so too would the output (sales of products and services) produced by these industries that supply motion pictures. As the output of these suppliers increases, so too would the output of other industries that supply the suppliers.
In sum, motion picture piracy aff ects not only the movie studios, but all the various businesses that supply the industry or buy from the industry, and the people who work in those businesses. Th us, the impact of movie piracy extends well beyond movie stars, all the way to the teenager selling popcorn and candy at the theater, the company that markets the candy, the farmer that grows the corn, and the workers that pick the farmer’s crop.
A visual depiction of the process is contained in Figure 1.
THE RIMS II MODEL
Th e U.S. government has developed a widely accepted mathematical model, known as the Regional Input-Output Modeling System (or “RIMS II”), that enables analysis of how increased revenue generated by movies would aff ect all other aspects of the economy.3 Th e RIMS II model is maintained by the U.S. Bureau of Economic Analysis, and is designed to measure the impact that a specifi c change in the output of one industry will have on all other industries. It uses input-output multipliers to enable measuring both the direct and indirect eff ects of lost revenue, as well as the loss in labor income. [See Section II and Appendix A for a more detailed description of the actual multipliers used in this analysis.]
To obtain a comprehensive estimate of the total impact of fi lm piracy on the U.S. economy, this paper uses the MPAA research together with the relevant RIMS II multipliers for the appropriate localities. Section II provides the detailed methodology employed to obtain the fi ndings announced in Section III. Overall, the paper looks in some depth at U.S. movie theater owners, and mass market retailers who sell or rent home video cassettes and DVDs: the most visible and direct downstream victims of movie piracy who would have enjoyed higher revenue but for piracy. It also considers lost earnings to employees, as well as the loss of jobs that are not created because of piracy losses. Using fi nancial accounts for the U.S. as a whole and industry-specifi c information, it estimates the tax losses to governments at all levels. Finally, with all these elements taken into account, it estimates the total impact on the U.S. economy.
Institute for Policy Innovation: Policy Report #186 Th e True Cost of Motion Picture Piracy to the U.S. Economy4
FIGURE 1
Industryrevenues lostas a result ofglobal piracy
Increasedmotion picture
production*required to earn
new revenue
Potentialindustry revenue
gained absentpiracy
Increasedpurchases ofgoods and
services fromother industries
Increasedmotion pictureemploymentand earnings
Increasedemploymentand earnings
in otherindustries
Increasedpurchases ofgoods and
services from2 level industries
nd
=Equals Leads To
Leads To
Leads To Leads To
Leads To
* Increase production could be of more films, more expensive films, or both.
Leads To
IMPACT OF PIRACY THROUGHOUT THE ECONOMY

Institute for Policy Innovation: Policy Report #186 Th e True Cost of Motion Picture Piracy to the U.S. Economy
II. METHODOLOGY: PIRACY LOSSES TO MOTION PICTURE PRODUCTION, DISTRIBUTION, AND EXHIBITION
Th e study by LEK is the most comprehensive look at fi lm piracy to date, capturing losses due to both Internet and hard goods piracy, the cost of piracy to domestic and worldwide industries, and the profi le of the typical pirate in various markets. Th e fi ndings from the LEK study are presented in this paper in Appendix C.
However, for the reasons explained above, the LEK fi gure of $6.1 billion in lost revenue does not provide a full picture of the eff ects of movie piracy. In particular, it does not include losses sustained directly by “downstream” industries like motion picture theatrical exhibitors or the video industry legitimately selling or renting U.S. motion pictures to consumers.4 In addition, the LEK fi gures do not include all of the secondary and tertiary losses sustained by the many U.S. industries that would have supplied inputs directly to the motion picture industry, the industry’s direct suppliers, or to the suppliers of those direct suppliers.
PRODUCTION LOSSES
Th e fi rst step in the analysis is to quantify the direct losses to the motion picture industry in terms of production, distribution, and exhibition.
As shown in Table 1, the LEK study determined that in 2005, MPAA member companies worldwide lost $6.076 billion in sales as a result of pirate activities. Of this total, U.S. market losses amounted to $1.311 billion while non-U.S. market losses sustained by U.S. companies totaled $4.765 billion.5
5
TABLE 1 MOTION PICTURE INDUSTRY DIRECT LOSSES DUE TO PIRACY, 2005
U.S. Motion Picture/Video Industries: NAICS 512100 *
Part One: Worldwide Losses of U.S. Production/Distribution Industries Plus U.S. Losses to U.S. Th eatrical Exhibition Industries.
Billions of U.S. Dollars
Global Piracy Losses to U.S. MPAA Production/Distribution: $6.076
U.S. Piracy Loss to U.S. Exhibition
U.S. Consumer Spending Loss (Th eatrical) $0.670
Est. U.S. Consumer Loss to MPAA Memco $0.630
Less: U.S. Prod./Dist. Loss (Th eatrical) $0.253
Equals: Net U.S. Exhibition Loss (Th eatrical) $0.377 $0.377
Sub-total Piracy Losses (Part One) $6.453
* NAICS 512100 - Motion Picture and Video Industries includes production, distribution, theatrical exhibition and post-production.

Institute for Policy Innovation: Policy Report #186 Th e True Cost of Motion Picture Piracy to the U.S. Economy
Signifi cantly, the losses sustained by MPAA member companies do not refl ect sales at the retail (consumer) level. In the motion picture industry, the major producer/distributors typically share gross retail revenues with theatrical exhibitors (theater owners), home video retailers, and others. Th is is part of the reason that retail losses resulting from pirate activities are much higher than losses to the movie studios alone. In its study, LEK estimated that the worldwide consumer spending loss to the motion picture industry worldwide resulting from all motion picture piracy in 2005 was $18.186 billion. In the U.S. alone, lost consumer spending amounted to $2.724 billion.6
THEATRICAL EXHIBITION LOSSES
Th e LEK study reports that, of the total consumer spending loss reported for the U.S. market ($2.724 billion), approximately $670 million represented theatrical revenues lost to piracy (Table 1). Th e study also estimates that about $630 million of the $670 million represented theatrical revenues for MPAA member fi lms in the U.S. that were lost to piracy.7 However, this fi gure of $630 million represents lost value to both U.S. theatrical exhibitors and to MPAA producer/distributors. Since these losses to the MPAA producer/distributors have already been captured in the global piracy loss estimate of $6.076 billion, it is necessary to extract the remaining lost U.S. theatrical margin from the overall U.S. exhibition loss of $630 million.
As refl ected in Table 1, the MPAA study reports that approximately $253 million of the $630 million lost U.S. theatrical revenues to MPAA members has already been counted as part of the global piracy losses to the same companies.8 As a result, the remaining U.S. piracy loss at the exhibition level can be estimated at $377 million ($630 million less $253 million). As shown in Table 1, this fi gure, when combined with the global loss fi gure to U.S. producer/distributors of $6.076 billion, yields total piracy losses to the motion picture and theatrical exhibition industries of $6.453 billion.
HOME VIDEO DISTRIBUTION LOSSES
As noted, retailers that sell or rent motion pictures and videos directly to consumers also sustain lost profi ts as a direct consequence of the actions of pirates.
As shown in Table 2,9 the LEK study estimated that the total U.S. consumer loss sustained by fi rms that sell or rent MPAA produced cassettes, DVDs, or other home video products was $1.932 billion in 2005. Of this amount, approximately $1.058 billion represented MPAA member company revenue losses that have already been counted within the global MPAA member loss estimate of $6.076 billion. As a result, the net losses to U.S. retailers of MPAA member cassettes, DVDs, and other home video products were $874 million in 2005.
To summarize, based on the best and most recent data available, we have determined that worldwide motion picture piracy causes a loss of $6.453 billion to the U.S. motion picture production, distribution, and exhibition industries, and a loss of $874 million to U.S. retail industries. Th ese numbers comprise some (but not all) of the inputs necessary to determine the total cost of motion picture piracy on the U.S. economy.
THE APPLICABLE RIMS II MULTIPLIERS
Even the direct losses computed above reveal only a portion of the impact of motion picture piracy on the U.S. economy. Other losses must also be derived and estimated using the multipliers from the RIMS II model.
Th e RIMS II model contains fi ve types of multipliers for many U.S. industries. For each industry, there are three “Final Demand” multipliers for output, earnings, and employment and two “Direct-Eff ect” multipliers for “direct” earnings and employment. Th e Final Demand multipliers tell us the total eff ects of movie piracy on the output, earnings, and employment of all U.S. industries. Th e Direct Eff ects multipliers tell us the specifi c eff ects on the motion picture industry. Our analysis uses all fi ve types of multipliers.
6

Institute for Policy Innovation: Policy Report #186 Th e True Cost of Motion Picture Piracy to the U.S. Economy
Th e RIMS II model defi nes industries based on the North American Industry Classifi cation System (NAICS), a classifi cation system maintained by the U.S. Government that contains increasing level of specialty within each classifi cation. Th e U.S. Motion Picture and Video Industries are classifi ed in NAICS 5121, and include the production and exhibition of motion pictures.
A total of fi ve multipliers were acquired from the Bureau of Economic Analysis for NAICS 5121. Th ese were the three Final Demand multipliers related to output, earnings (of workers), and employment and the two Direct Eff ect multipliers also related to earnings (of workers) and employment. Because the majority of people directly employed in motion picture production are employed in California and New York, all fi ve multipliers are reported for the states of California and New York. A detailed discussion of the reasons for this determination is found in Appendix A.10
Diff erent multipliers were chosen to apply to the retailing of motion picture cassettes and DVDs. Th at is because in the U.S., the industries that distribute cassettes and DVDs to consumers are far less geographically concentrated than the industries that produce motion pictures. In order to obtain a representative data sample for retail movie distribution, we used multipliers for eight states: California, New York, Texas, Ohio, Pennsylvania, Illinois, Florida, and New Jersey.11 In this study, it is assumed that the retail industry multipliers for these eight states appropriately and reasonably capture the economic relationships that exist for the U.S. motion picture retailing sector as a whole.
More detailed information on the RIMS II multipliers used in this analysis may be found in Appendix A.
7
TABLE 2 MOVIE RETAIL TRADE LOSSES DUE TO PIRACY, 2005
U.S. Motion Picture/Video Industries, Retail Trade: NAICS 44-45 *
Part Two: U.S. Losses of U.S. Retail Industries that Sell or Rent Motion Pictures/Video Products.
U.S. Piracy Losses to U.S. Retail industriesBillions of U.S.
Dollars
U.S. MPAAConsumer
Loss Less
U.S. MPAAMemco
Loss Equals
Net U.S. MPAARetailLoss
Rental $0.522 $0.172 $0.350
Sell-Th rough $1.116 $0.724 $0.392
PPV/VOD $0.294 $0.162 $0.132
Total $1.932 $1.058 $0.874 $0.874
Sub-Total Piracy Losses (Part Two) $0.874
* NAICS 44-45 includes all industries engaged in retailing merchandise, generally without transformation, and rendering services to the sale of merchandise.

III. FINDINGS: THE IMPACT OF MOTION PICTURE PIRACY ON THE OVERALL ECONOMY
As detailed below, using the LEK results and the appropriate RIMS II multipliers, we have determined that motion picture and video piracy exact a heavy toll not only on the U.S. motion picture industry, but the overall U.S. economy as well. Movie piracy causes $20.5 billion annually in total lost output among all industries, $5.5 billion annually in lost earnings for all U.S. workers and 141,030 jobs that would otherwise have been created. In addition, as a result of piracy, governments at the federal, state, and local levels are deprived of $837 million in tax revenues each year.
Figure 2, entitled Motion Picture Piracy Impacts by Sector, summarizes the fi ndings described in detail below.
TOTAL LOST OUTPUT, EMPLOYMENT, AND EARNINGS FROM MOVIE PIRACY
To produce industry-specifi c estimates of the impacts of piracy on the U.S. economy, the motion picture industry’s estimated losses from piracy are combined with the appropriate multipliers. Th e three “Final Demand” estimates of the overall impact of piracy on U.S. industries are reported in Table 3.
As shown in Table 3, as a result of piracy, the motion picture and theatrical exhibition industries have lost direct output (sales) of $6.452 billion in 2005. Using the relevant industry multipliers, this “direct” loss is converted into an estimate of the total loss in U.S. output. Th is total loss fi gure was $18.56 billion.12 In addition, the “direct” loss sustained by U.S. motion picture retailers ($874 million) would add an additional $1.923 billion to the total loss in U.S. output. As a result, the full impact of motion picture piracy on U.S. output in 2005 was an overall loss of $20.5 billion.
With regard to lost earnings for U.S. workers, the comparable loss fi gures are $4.954 billion that stem from the losses sustained by the motion picture production and theatrical distribution industries and $587 million from the losses of retail distributors of cassettes and DVDs. Th us, the total loss in earnings to workers in 2005 was $5.5 billion.
Finally, in terms of losses in employment that would have been created, the eff ects of piracy on the motion picture industries in NAICS 5121 cost the United States 120,085 jobs and the eff ects on U.S. retail
MOTION PICTURE PIRACY IMPACTS BY SECTORFIGURE 2
U.S. motion pictureproduction and
distribution firms
U.S. theatricalexhibition firms
U.S. video rentaland retail firms
I. Piracy Loss
II. Resulting Impacts
A. Lost Output of U.S. Industries
B. Lost U.S. Employment
C. Lost Earnings of U.S. Workers
$6.076 billion $0.377 billion
$6.453 billion
$18.562 billion
120,085 Jobs
$4,954.73 billion
$0.874 billion
$0.874 billion
$1.923 billion
20,945 Jobs
$0.587 billion
Global Piracy Loss U.S. Piracy Loss U.S. Piracy Loss
= $7.327 billion
= $20.484 billion
= 141,030 Jobs
= $5,421.1 billion
Total
Institute for Policy Innovation: Policy Report #186 Th e True Cost of Motion Picture Piracy to the U.S. Economy8
Institute for Policy Innovation: Policy Report #186 Th e True Cost of Motion Picture Piracy to the U.S. Economy
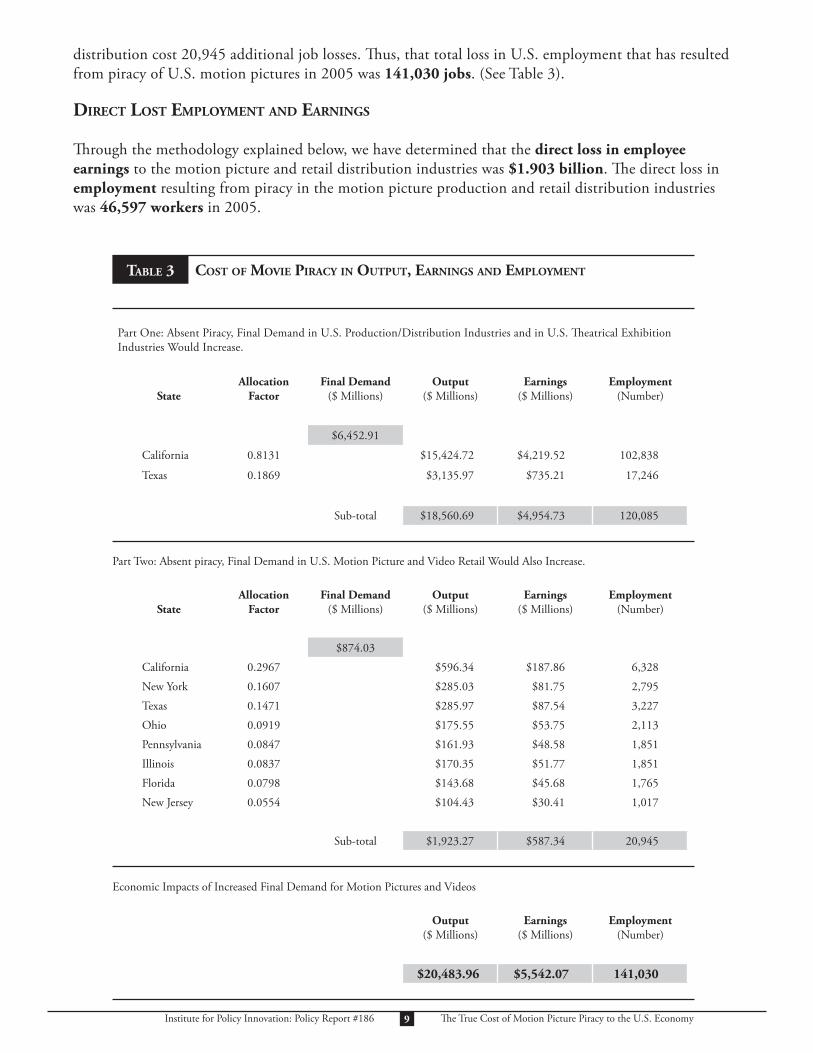
distribution cost 20,945 additional job losses. Th us, that total loss in U.S. employment that has resulted from piracy of U.S. motion pictures in 2005 was 141,030 jobs. (See Table 3).
DIRECT LOST EMPLOYMENT AND EARNINGS
Th rough the methodology explained below, we have determined that the direct loss in employee earnings to the motion picture and retail distribution industries was $1.903 billion. Th e direct loss in employment resulting from piracy in the motion picture production and retail distribution industries was 46,597 workers in 2005.
9
TABLE 3 COST OF MOVIE PIRACY IN OUTPUT, EARNINGS AND EMPLOYMENT
Part One: Absent Piracy, Final Demand in U.S. Production/Distribution Industries and in U.S. Th eatrical Exhibition Industries Would Increase.
StateAllocation
FactorFinal Demand
($ Millions)Output
($ Millions)Earnings
($ Millions)Employment
(Number)
$6,452.91
California 0.8131 $15,424.72 $4,219.52 102,838
Texas 0.1869 $3,135.97 $735.21 17,246
Sub-total $18,560.69 $4,954.73 120,085
Part Two: Absent piracy, Final Demand in U.S. Motion Picture and Video Retail Would Also Increase.
StateAllocation
FactorFinal Demand
($ Millions)Output
($ Millions)Earnings
($ Millions)Employment
(Number)
$874.03
California 0.2967 $596.34 $187.86 6,328
New York 0.1607 $285.03 $81.75 2,795
Texas 0.1471 $285.97 $87.54 3,227
Ohio 0.0919 $175.55 $53.75 2,113
Pennsylvania 0.0847 $161.93 $48.58 1,851
Illinois 0.0837 $170.35 $51.77 1,851
Florida 0.0798 $143.68 $45.68 1,765
New Jersey 0.0554 $104.43 $30.41 1,017
Sub-total $1,923.27 $587.34 20,945
Economic Impacts of Increased Final Demand for Motion Pictures and Videos
Output($ Millions)
Earnings($ Millions)
Employment(Number)
$20,483.96 $5,542.07 141,030

Institute for Policy Innovation: Policy Report #186 Th e True Cost of Motion Picture Piracy to the U.S. Economy
Th e RIMS II model also generates Direct Eff ects multipliers that can be used to derive the lost earnings and employment eff ects in those industries that are directly aff ected by the assumed change in Final Demand, in this case, the U.S. motion picture and retail distribution industries.
As shown in Table 4, the total loss in employee earnings for the motion picture and retail distribution industries was $1.903 billion. Th is value is only 34.3 percent of the total losses in employee earnings ($5.5 billion) reported previously. Th us, about two-thirds of the total lost earnings to U.S. workers that result from motion picture piracy can be attributed to workers in industries other than the motion picture production and retail industries.
10
TABLE 4 MOVIE INDUSTRY DIRECT LOSSES TO EMPLOYMENT AND EARNINGS, 2005
Part One: Absent Piracy, the Direct Eff ects of Increased Final Demand on U.S. Production/Distribution Industries and on U.S. Th eatrical Exhibition Industries Would Increase.
State
TotalEmployment
(Number)
DirectEmployment
(Number)
TotalEarnings
($ Millions)
DirectEarnings
($ Millions)
California 102,838 28,587 $4,219.52 $1,352.85
Texas 17,246 5,549 $735.21 $262.35
Sub-total 34,136 $4,954.73 $1,615.19
Part Two: Absent Piracy, the Direct Eff ects of Increased Final Demand on the U.S. Motion Picture and Video Retail Industries Would Also Increase.
State
TotalEmployment
(Number)
DirectEmployment
(Number)
TotalEarnings
($ Millions)
DirectEarnings
($ Millions)
California 6,328 3,612 $187.86 $87.59
New York 2,795 1,816 $81.75 $43.91
Texas 3,227 1,874 $87.54 $43.33
Ohio 2,113 1,259 $53.75 $26.46
Pennsylvania 1,851 1,129 $48.58 $24.00
Illinois 1,851 1,094 $51.77 $23.99
Florida 1,765 1,057 $45.68 $23.54
New Jersey 1,017 619 $30.41 $15.03
Sub-total 12,461 $287.86
Direct Eff ects of Increased Final Demand for Motion Pictures and Videos
Total DirectEmployment
(Number)
Total DirectEarnings
($ Millions)
46,597 $1,903.05

Institute for Policy Innovation: Policy Report #186 Th e True Cost of Motion Picture Piracy to the U.S. Economy
Also, as reported in Table 4, the direct loss in employment resulting from piracy in the motion picture production and retail distribution industries was 46,597 workers in 2005. Th is total is only 33 percent of the total lost employment from piracy (141,030) reported above. As with earnings, approximately two-thirds of the U.S. employment that is lost as a consequence of motion picture piracy occurs in industries other than the motion picture production and retail industries.
MOTION PICTURE PIRACY: LOST TAX REVENUES
In total, motion picture piracy costs governments at all levels, conservatively, $837 million in lost tax revenue annually.
Th e RIMS II model cannot be used to generate multipliers for the tax payments that would have been made by employees and corporations if motion picture piracy had been reduced. For this reason, the analysis of the tax eff ects of piracy losses in this study makes use of fi nancial accounts for the U.S. as a whole and of industry-specifi c information on components of the value added by the motion picture industry. Th e techniques for analyzing tax losses are described in Appendix B.
In the motion picture industry, the economic consequences of piracy are not limited to companies and workers. Piracy also reduces the taxes that would otherwise be paid by U.S. corporations and U.S. citizens. Th e tax eff ects of piracy result from changes in corporate output, corporate income and in the taxable income of U.S. workers. See Figure 3.
In this analysis, it is generally assumed that the U.S. average tax rates calculated by reference to the national accounts can also apply to the industry-by-industry data that are shown in Table 5.
11
MOTION PICTURE PIRACY TAX EFFECTSFIGURE 3
Increasedmotion picture
production*required to earn
new revenue
Increasedpurchases ofgoods and
services fromother industries
Increasedmotion pictureemploymentand earnings
Increasedemploymentand earnings
in otherindustries
Increasedpurchases ofgoods and
services from2 level industries
nd
Leads To
Leads To Leads To
Leads To
Leads To
Leads To
Leads To
Leads To
Increasedincome taxes
paid by motionpicture
employees
Increasedincome taxes
paid byemployees in
other industries
Not Estimated:
Corporate taxespaid by other
industries
Not Estimated:
Corporate taxespaid by 2 level
industries
nd
Corporationincome taxes
paid by motionpicture firms
Production taxespaid by motion
picture firms
* Increase production could be of more films, more expensive films, or both.
Institute for Policy Innovation: Policy Report #186 Th e True Cost of Motion Picture Piracy to the U.S. Economy12
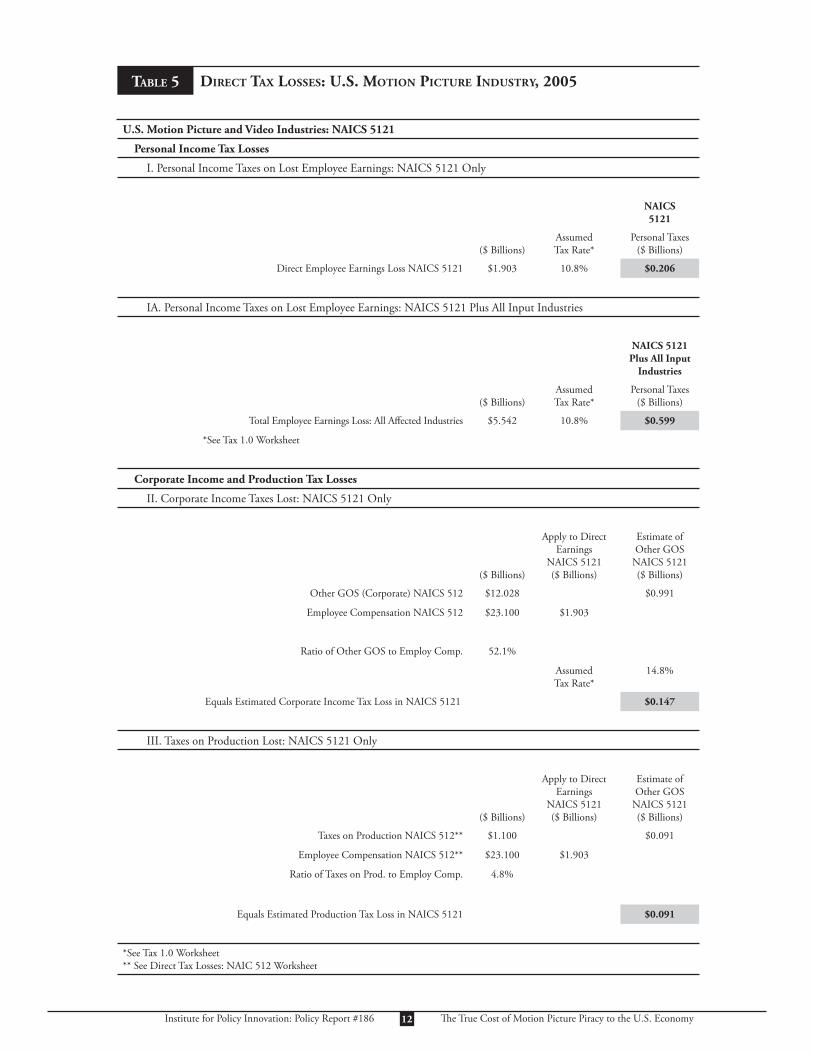
TABLE 5 DIRECT TAX LOSSES: U.S. MOTION PICTURE INDUSTRY, 2005
U.S. Motion Picture and Video Industries: NAICS 5121
Personal Income Tax Losses
I. Personal Income Taxes on Lost Employee Earnings: NAICS 5121 Only
NAICS5121
($ Billions)AssumedTax Rate*
Personal Taxes($ Billions)
Direct Employee Earnings Loss NAICS 5121 $1.903 10.8% $0.206
IA. Personal Income Taxes on Lost Employee Earnings: NAICS 5121 Plus All Input Industries
NAICS 5121Plus All Input
Industries
($ Billions)AssumedTax Rate*
Personal Taxes($ Billions)
Total Employee Earnings Loss: All Aff ected Industries $5.542 10.8% $0.599
*See Tax 1.0 Worksheet
Corporate Income and Production Tax Losses
II. Corporate Income Taxes Lost: NAICS 5121 Only
($ Billions)
Apply to Direct Earnings
NAICS 5121($ Billions)
Estimate ofOther GOS
NAICS 5121($ Billions)
Other GOS (Corporate) NAICS 512 $12.028 $0.991
Employee Compensation NAICS 512 $23.100 $1.903
Ratio of Other GOS to Employ Comp. 52.1%
AssumedTax Rate*
14.8%
Equals Estimated Corporate Income Tax Loss in NAICS 5121 $0.147
III. Taxes on Production Lost: NAICS 5121 Only
($ Billions)
Apply to Direct Earnings
NAICS 5121($ Billions)
Estimate ofOther GOS
NAICS 5121($ Billions)
Taxes on Production NAICS 512** $1.100 $0.091
Employee Compensation NAICS 512** $23.100 $1.903
Ratio of Taxes on Prod. to Employ Comp. 4.8%
Equals Estimated Production Tax Loss in NAICS 5121 $0.091
*See Tax 1.0 Worksheet** See Direct Tax Losses: NAIC 512 Worksheet
Institute for Policy Innovation: Policy Report #186 Th e True Cost of Motion Picture Piracy to the U.S. Economy
In Table 5, the various national and industry specifi c tax rates described in Appendix B are applied to the Motion Picture industry. Th e direct loss in Motion Picture and Video employee earnings reported in Table 5 is $1.903 billion. But taking into account all input industries to the motion picture industry, the value for total employee earnings in all U.S. industries that are lost as result of motion picture piracy was $5.542 billion.
As shown in Table 5, the total direct tax losses attributable to motion picture industry piracy in 2005 were $206 million in personal income taxes, $147 million in corporate income taxes and $91 million in taxes on production. However, as also shown in Table 3, the personal income tax losses that result from piracy for employees in the movie industry and in all movie input industries combined is $600 million per year. In total, motion picture piracy costs governments at all levels, conservatively, $837 million in lost tax revenue annually.
CONCLUSION
Motion picture and video piracy exact a heavy toll not only on the U.S. motion picture industry, but the overall U.S. economy as well: $20.5 billion annually in total lost output among all industries, $5.5 billion annually in lost earnings for all U.S. workers and 141,030 jobs that would otherwise have been created are lost. In addition, as a result of piracy, governments at the federal, state, and local levels are deprived of $837 million in tax revenues each year.
Th ese fi gures suggest that the true costs of copyright piracy are enormous, and harm not only the owners of the intellectual property but all U.S. consumers and taxpayers. As policymakers seek to maintain the health and vitality of the U.S. economy and preserve our global competitiveness, it is imperative that government and industry work together to help combat this growing problem. It is no longer acceptable to consider counterfeiting and piracy just another cost of doing business.
13

Institute for Policy Innovation: Policy Report #186 Th e True Cost of Motion Picture Piracy to the U.S. Economy
APPENDIX A—MOTION PICTURE INDUSTRY MULTIPLIERS Th e estimates in this report are based on an analytical framework known as an input-output (“I-O”) table. For every industry in the economy, an I-O table shows the distribution of the inputs purchased and the outputs sold. Using this framework, the U.S. Bureau of Economic Analysis (BEA) has developed a method for estimating I-O multipliers. Using multipliers, it is possible to measure not only the direct eff ects of piracy (i.e., the lost 1st round of output) but also the indirect eff ects (i.e., the lost 2nd and subsequent rounds of output) as piracy reduces the need for inputs from factor suppliers in other industries. In addition, the BEA’s multipliers also consider the “induced” economic eff ects that arise from the piracy-driven loss in labor income that is borne by workers in the legitimate industries and which results in a consequent decrease in household consumption.
In this analysis, the multipliers used to estimate the full eff ects of motion picture piracy were derived using the BEA’s Regional Input-Output Modeling System or (“RIMS II”). Th e RIMS II model produces industry-specifi c “fi nal demand” multipliers for output (in dollars), employment (in numbers of employees) and earnings of those employees (in dollars). Th e RIMS II model also provides industry-specifi c “direct eff ects” multipliers for employment and earnings.
DEFINING REGIONS BY INDUSTRY
Th e RIMS II model produces industry-specifi c fi nal demand and direct eff ects multipliers. However, the RIMS II model is fundamentally a regional model that estimates multipliers within a pre-defi ned geographic area. Th us, for example, an analyst might be given the task of estimating the economic eff ects of building a new sports stadium within a given metropolitan region. In this example, the analyst would fi rst pre-specify the relevant metropolitan region for which the RIMS II model should be calibrated. Subsequently the analyst would select the relevant industry multipliers to be derived within that region. Th e pre-specifi cation of a region directly aff ects the RIMS II multipliers because, all else equal, the smaller the region, the greater the chance that that necessary inputs will be obtained from outside the region. When inputs are obtained from outside the pre-specifi ed region in RIMS II, they may no longer “count” as in-region eff ects of the initial change in fi nal demand. Th us, with a narrowly defi ned area, the indirect economic eff ects of a given change in fi nal demand might be too low.
Th is study diff ers from the more typical RIMS II analysis in that the economic eff ects of motion picture piracy are clearly not focused on one or a few small geographic areas. According to the latest Economic Census., in 2002 the U.S. Motion Picture and Video Industries (NAICS 5121) employed workers in 44 diff erent states. While the California motion picture industry did employ the largest share of these workers, the state’s industry still employed less than half (40.9 percent) of all employees in NAICS 5121. Moreover, the California movie industry is not even fully centered in the Los Angeles metropolitan area. Th e same economic census reported that in 2002, there were 10,191 workers employed in NAICS 5121 in the San Jose-San Francisco-Oakland, Calif., Combined Statistical Area. Th e annual payroll for these workers in 2002 was $659 million. If this study had only attempted to measure the economic eff ects of movie piracy in the Los-Angeles Metropolitan Region, it would have ignored 59 percent of the industry’s employees who do not work in California and well over 10,000 industry employees who do not work in Los Angeles.
MULTIPLIERS FOR THE NAICS 5121 INDUSTRIES
In view of these considerations, a decision was made to acquire statewide RIMS II multipliers for estimating the total costs of motion picture piracy for the U.S. economy. However, in view of the particular signifi cance of the state of California for the U.S. Motion Picture and Video Industries, a further analysis was conducted to determine the appropriate state or states for which these multipliers should be applied. A review of the motion picture industry’s employment levels on a state-by-state basis revealed that in 2002 only two states —California and New York —employed 50.3 percent of all U.S. workers in NAICS 5121. In addition, for the
14

Institute for Policy Innovation: Policy Report #186 Th e True Cost of Motion Picture Piracy to the U.S. Economy
six-digit NAICS 512111, the Motion Picture and Video production industries, the states of California and New York employed 73.4 percent of all employees. For these reasons, the fi nal multipliers used to analyze the motion picture and video industries in NAICS 5121 were multipliers for California and New York. (See Multiplier 1.0 Movies).
As shown in Multiplier 1.0 Movies, a total of fi ve multipliers were acquired from the Bureau of Economic Analysis for NAICS 5121. Th e three Final Demand multipliers related to output, earnings (of workers) and employment. Th e two Direct Eff ect multipliers also related to earnings (of workers) and employment. In Multiplier 1.0 Movies, the fi ve multipliers are reported for the states of California and New York.
MULTIPLIERS FOR U.S. RETAILERS OF HOME VIDEO PRODUCTS
As noted previously, motion picture piracy aff ects other U.S. industries in addition to the industries that are classifi ed in NAICS 5121. In particular, U.S. retailers of video cassettes and DVDs face reduced sales and lower profi ts as a result of pirate activities that occur in the United States. However, the inter-industry relationships that aff ect these industries diff er from the inter-industry relationships that exist in the motion picture industry. As a result, the multipliers that apply to the retailing of motion picture cassettes and DVDs
15
TABLE A Multiplier 1.0 Movies
U.S. Motion Picture/Video Industries: NAICS 512100
Final Demand Multipliers for Primary States*
Output:
California 2.9398
New York 2.6002
Earnings:
California 0.8042
New York 0.6096
Employment:
California 19.6
New York 14.3
Direct Eff ect Multipliers for Primary States*
Earnings:
California 3.1190
New York 2.8024
Employment:
California 3.5974
New York 3.1080
* In the 2002 Census, California and New York collectively employed 50.3% of all employees in NAICS 512100. California employed 81.31% of this subtotal while New York employed 18.69%. California and New York also employed 73.4% of all employees in NAICS 512111, which is Motion Picture and Video Production.

Institute for Policy Innovation: Policy Report #186 Th e True Cost of Motion Picture Piracy to the U.S. Economy
should also diff er from the multipliers that were calculated for NAICS 5121. In this study, the economic eff ects of piracy on U.S. motion picture retailers are measured Using multipliers for U.S. retail trade (NAICS 44-45). Th ese multipliers are provided in Multiplier 1.1 Movies.
Th e fi ve multipliers reported in Multiplier 1.1 Movies are each shown for eight states: California, New York, Texas, Ohio, Pennsylvania, Illinois, Florida and New Jersey. In the U.S., the industries that distribute cassettes and DVDs to consumers are far less geographically concentrated than the industries that produce motion pictures. For example, Blockbuster, Inc. operated 5,696 stores in the United States in 2005. Th ese stores were located in all 50 states, the District of Columbia and the U.S. territories of Guam, Puerto Rico and the Virgin Islands. Nevertheless, all states are not equal even with regard to home video sales and rental services. In 2002 the U.S. Census Bureau calculated state-by-state fi gures for the number of U.S. establishments and paid employees in NAICS 45122 – Prerecorded Tape, Compact Disk and Record Stores. For both establishments and employment, eight states were responsible for 49.1 percent of the U.S. totals within this industry. Th ose states were the eight states shown in Multiplier 1.1 Movies. In this study, it is assumed that the retail industry multipliers for these eight states appropriately and reasonably capture the economic relationships that exist for the U.S. motion picture retailing sector as a whole.
16
TABLE B Multiplier 1.1 Movies
U.S. Motion Picture/Video Industries: Retail Trade NAICS 44-45
Final Demand Multipliers for Primary States*
States Output Earnings Employment
California 2.2996 0.7244 24.4
New York 2.0293 0.5820 19.9
Texas 2.2242 0.6809 25.1
Ohio 2.1855 0.6692 26.3
Pennsylvania 2.1873 0.6562 25.0
Illinois 2.3286 0.7077 25.3
Florida 2.0600 0.6549 25.3
New Jersey 2.1566 0.6280 21.0
Direct Eff ect Multipliers for Primary States*
States Earnings Employment
California 2.1477 1.7520
New York 1.8618 1.5392
Texas 2.0205 1.7222
Ohio 2.0312 1.6773
Pennsylvania 2.0238 1.6387
Illinois 2.1579 1.6914
Florida 1.9406 1.6689
New Jersey 2.0227 1.6420
* In the 2002 Census, the top eight states for establishments and employment in NAICS 45122—Prerecorded Tape, Compact Disk and Record Stores, were responsible for 50% of the total establishments and employment in NAICS 45122 for the U.S. as a whole.
Institute for Policy Innovation: Policy Report #186 Th e True Cost of Motion Picture Piracy to the U.S. Economy
APPENDIX B—DETERMINING TAX LOSSES
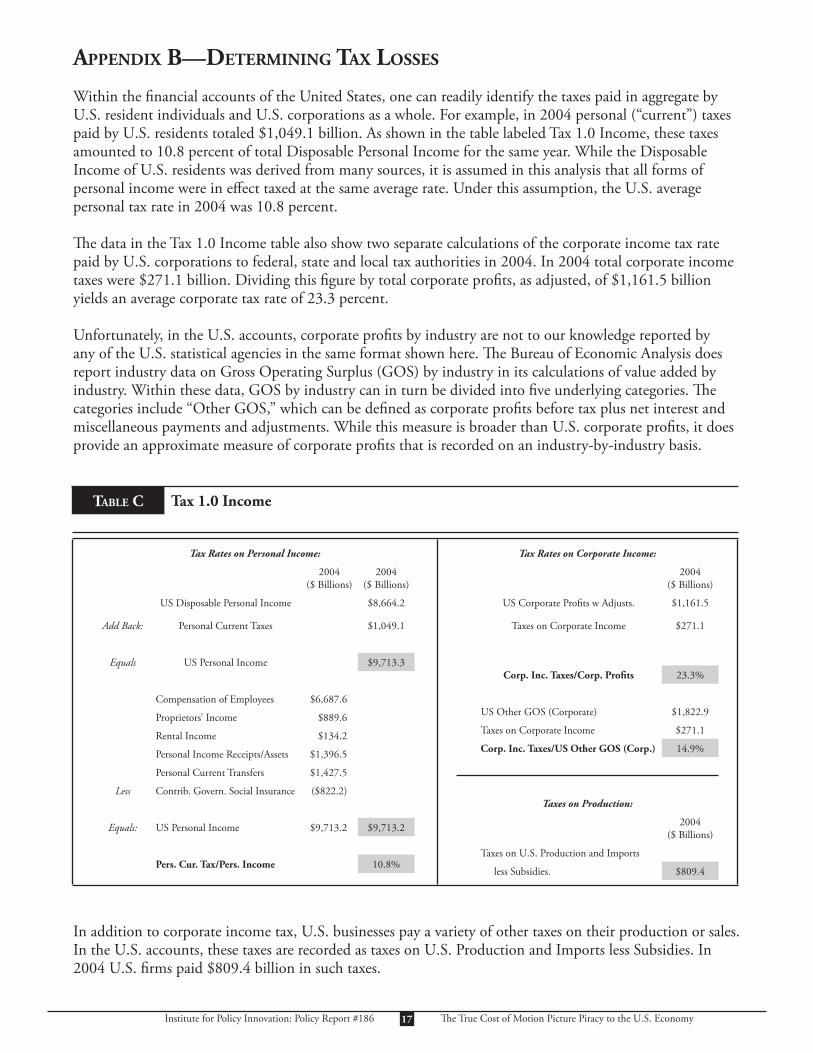
Within the fi nancial accounts of the United States, one can readily identify the taxes paid in aggregate by U.S. resident individuals and U.S. corporations as a whole. For example, in 2004 personal (“current”) taxes paid by U.S. residents totaled $1,049.1 billion. As shown in the table labeled Tax 1.0 Income, these taxes amounted to 10.8 percent of total Disposable Personal Income for the same year. While the Disposable Income of U.S. residents was derived from many sources, it is assumed in this analysis that all forms of personal income were in eff ect taxed at the same average rate. Under this assumption, the U.S. average personal tax rate in 2004 was 10.8 percent.
Th e data in the Tax 1.0 Income table also show two separate calculations of the corporate income tax rate paid by U.S. corporations to federal, state and local tax authorities in 2004. In 2004 total corporate income taxes were $271.1 billion. Dividing this fi gure by total corporate profi ts, as adjusted, of $1,161.5 billion yields an average corporate tax rate of 23.3 percent.
Unfortunately, in the U.S. accounts, corporate profi ts by industry are not to our knowledge reported by any of the U.S. statistical agencies in the same format shown here. Th e Bureau of Economic Analysis does report industry data on Gross Operating Surplus (GOS) by industry in its calculations of value added by industry. Within these data, GOS by industry can in turn be divided into fi ve underlying categories. Th e categories include “Other GOS,” which can be defi ned as corporate profi ts before tax plus net interest and miscellaneous payments and adjustments. While this measure is broader than U.S. corporate profi ts, it does provide an approximate measure of corporate profi ts that is recorded on an industry-by-industry basis.
In addition to corporate income tax, U.S. businesses pay a variety of other taxes on their production or sales. In the U.S. accounts, these taxes are recorded as taxes on U.S. Production and Imports less Subsidies. In 2004 U.S. fi rms paid $809.4 billion in such taxes.
17
TABLE C Tax 1.0 Income
Tax Rates on Personal Income:
2004($ Billions)
2004($ Billions)
US Disposable Personal Income $8,664.2
Add Back: Personal Current Taxes $1,049.1
Equals US Personal Income $9,713.3
Compensation of Employees $6,687.6
Proprietors’ Income $889.6
Rental Income $134.2
Personal Income Receipts/Assets $1,396.5
Personal Current Transfers $1,427.5
Less Contrib. Govern. Social Insurance ($822.2)
Equals: US Personal Income $9,713.2 $9,713.2
Pers. Cur. Tax/Pers. Income 10.8%
Tax Rates on Corporate Income:
2004($ Billions)
US Corporate Profi ts w Adjusts. $1,161.5
Taxes on Corporate Income $271.1
Corp. Inc. Taxes/Corp. Profi ts 23.3%
US Other GOS (Corporate) $1,822.9
Taxes on Corporate Income $271.1
Corp. Inc. Taxes/US Other GOS (Corp.) 14.9%
Taxes on Production:
2004($ Billions)
Taxes on U.S. Production and Imports
less Subsidies. $809.4

Institute for Policy Innovation: Policy Report #186 Th e True Cost of Motion Picture Piracy to the U.S. Economy18
TABLE D TAX 2.0
U.S. Motion Picture and Video Industries: NAICS 5121
Personal Income Tax Losses
I. Personal Income Taxes on Lost Employee Earnings: NAICS 5121 Only
NAICS5121
($ Billions)AssumedTax Rate*
Personal Taxes($ Billions)
Direct Employee Earnings Loss NAICS 5121 $1.903 10.8% $0.206
IA. Personal Income Taxes on Lost Employee Earnings: NAICS 5121 Plus All Input Industries
NAICS 5121Plus All Input
Industries
($ Billions)AssumedTax Rate*
Personal Taxes($ Billions)
Total Employee Earnings Loss: All Aff ected Industries $5.542 10.8% $0.599
*See Tax 1.0 Worksheet
Corporate Income and Production Tax Losses
II. Corporate Income Taxes Lost: NAICS 5121 Only
($ Billions)
Apply to Direct Earnings
NAICS 5121($ Billions)
Estimate ofOther GOS
NAICS 5121($ Billions)
Other GOS (Corporate) NAICS 512 $12.028 $0.991
Employee Compensation NAICS 512 $23.100 $1.903
Ratio of Other GOS to Employ Comp. 52.1%
AssumedTax Rate*
14.8%
Equals Estimated Corporate Income Tax Loss in NAICS 5121 $0.147
III. Taxes on Production Lost: NAICS 5121 Only
($ Billions)
Apply to Direct Earnings
NAICS 5121($ Billions)
Estimate ofOther GOS
NAICS 5121($ Billions)
Taxes on Production NAICS 512** $1.100 $0.091
Employee Compensation NAICS 512** $23.100 $1.903
Ratio of Taxes on Prod. to Employ Comp. 4.8%
Equals Estimated Production Tax Loss in NAICS 5121 $0.091
*See Tax 1.0 Worksheet** See Direct Tax Losses: NAIC 512 Worksheet

Institute for Policy Innovation: Policy Report #186 Th e True Cost of Motion Picture Piracy to the U.S. Economy
In Tax 2.0, we fi rst show the methodology used to estimate the personal income taxes that would have been paid by U.S. employees on their increased earnings if there had been no motion picture piracy. Th e table shows the estimation of tax losses on both the direct earnings of motion picture employees and on the total earnings of all aff ected employees. In both cases, the assumed average personal tax rate of 10.8% is applied to the industry earnings derived from the RIMS II model. As shown in Table 2, lost personal income taxes for motion picture industry employees alone were $0.205 billion. For all industry employees, lost personal income taxes were $0.599 billion.
In Tax 2.0, we also provide the methodologies used to measure the corporate income taxes and taxes on production that would have been paid by the U.S. motion picture industry absent piracy. In the corporate tax calculations, we fi rst calculate the ratio of “Other” Gross Operating Surplus (“OGOS”) to Employee Compensation for NAICS 512, a broader industry measure than that of the U.S. motion picture industry (NAICS 5121). In 2004, this ratio was 52.1%. Applying this ratio to the lost motion picture earnings estimate of $0.991 billion yields lost corporate income taxes in the amount of $0.147 billion.
Similarly, with regard to taxes on production, we fi rst derive the ratio of production taxes to employee compensation in the broader industry category of NAICS 512. Using this ratio, we then estimate these taxes as $0.091 billion.
19

Institute for Policy Innovation: Policy Report #186 Th e True Cost of Motion Picture Piracy to the U.S. Economy20
APPENDIX C—CONCLUSIONS OF THE LEK STUDY

Institute for Policy Innovation: Policy Report #186 Th e True Cost of Motion Picture Piracy to the U.S. Economy21
Institute for Policy Innovation: Policy Report #186 Th e True Cost of Motion Picture Piracy to the U.S. Economy22
Institute for Policy Innovation: Policy Report #186 Th e True Cost of Motion Picture Piracy to the U.S. Economy23
Institute for Policy Innovation: Policy Report #186 Th e True Cost of Motion Picture Piracy to the U.S. Economy24

Institute for Policy Innovation: Policy Report #186 Th e True Cost of Motion Picture Piracy to the U.S. Economy25
Institute for Policy Innovation: Policy Report #186 Th e True Cost of Motion Picture Piracy to the U.S. Economy26

Institute for Policy Innovation: Policy Report #186 Th e True Cost of Motion Picture Piracy to the U.S. Economy27
ENDNOTES
1. http://nbcumv.com/corporate/Engines_of_Growth.pdf2. See LEK Final Loss Estimates. 3. http://bea.gov/bea/regional/rims/4. Blockbuster, Inc., for instance, operated 5,696 U.S. stores providing in-home rental and retail movie entertainment to U.S. consumers in 2005. Blockbuster
Inc., U.S. SEC Form 10-K, for the year ending 12/31/05, page 1. Absent piracy, the additional profi ts on motion picture sales and rental revenues that would have been earned by Blockbuster and by other U.S. retailers constitute additional losses to the U.S. economy. Note, however, that this additional loss is limited to the lost margin that the retail outlet would have been earned on the sale. Th e “cost” of the sale has already been counted among the sales lost by the motion picture producers.
5. See LEK Final Loss Estimates. 6. See LEK Final Loss Estimates. 7. Th e remaining $40 million in U.S. theatrical losses were sustained by non-MPAA and foreign fi lm producers and by their U.S. exhibitors. 8. Th e MPAA study reports that in the U.S., MPA member companies lost a total of $1.311 billion in 2005. Of this total, $253 million refl ected theatrical losses
while nearly $900 million were lost home video sales and rentals. 9. Th is study focuses only on the piracy losses of U.S. fi rms. As a result, it does not measure losses of non-U.S. fi lm producer/distributors, non-U.S. theatrical ex-
hibitors or non-U.S. retailers of home video products. 10. Note that, while the BEA does publish industry multipliers for the U.S. as a whole, this analysis conservatively makes no use of these U.S. multipliers. Had they
been used, the output and employment eff ects shown in this study would have been even higher than what we report.11. 3,431 out of 6,987 establishments and 30,742 out of 62,647 employees in NAICS 45122 were located in the eight states listed above. 12. Note the total loss in fi nal demand is allocated among the listed states on the basis of each state’s industry employment. 13. U.S. Department of Commerce, U.S. Census Bureau, 2002 Economic Census: Information-San Jose-San Francisco-Oakland, CA, Combined Statistical Area.
Information Sector, NAICS 5121. 14. U.S. SEC, Form 10-K, for the fi scal year ended December 31, 2005, Blockbuster, Inc., pages 10-11. 15. 3,431 out of 6,987 establishments and 30,742 out of 62,647 employees in NAICS 45122 were located in the eight states listed above. 16. In these fi gures, corporate profi ts have been adjusted to refl ect changes in inventory valuation and capital consumption.
ABOUT THE AUTHOR
Stephen E. Siwek is a principal with Economists, Inc., and is a specialist in fi nancial and cost analysis. Mr. Siwek has particular expertise in the economic analysis of regulated utilities including telecommunications, electric, gas and postal service providers. He has testifi ed as an expert witness in more than forty proceedings before federal and state regulatory authorities. Mr. Siwek’s consulting specialties also include analysis of economic damages in commercial litigation and antitrust. He has evaluated damage claims in litigation involving telecommunications companies, media fi rms, airlines, consumer products providers and industrial corporations. Mr. Siwek also has substantial consulting and research experience in international trade. In the international area, Mr. Siwek has focused particularly on the media and software industries. He is co-author (with Steven S. Wildman) of International Trade in Films and Television Programs, American Enterprise Institute/Ballinger Publishing Company and International Trade in Computer Software, Quorum Books (with Harold Furchtgott-Roth). Mr. Siwek has also published annual studies of the “Copyright Industries” in the U.S. economy on behalf of the International Intellectual Property Alliances.
ABOUT THE INSTITUTE FOR POLICY INNOVATION (IPI)Th e Institute for Policy Innovation (IPI) is a nonprofi t, non-partisan educational organization founded in 1987. IPI’s purposes are to conduct research, aid development, and widely promote innovative and nonpartisan solutions to today’s public policy problems. IPI is a public foundation, and is supported wholly by contributions from individuals, businesses, and other non-profi t foundations. IPI neither solicits nor accepts contributions from any government agency.
IPI’s focus is on developing new approaches to governing that harness the strengths of individual choice, limited government, and free markets. IPI emphasizes getting its studies into the hands of the press and policy makers so that the ideas they contain can be applied to the challenges facing U.S. today.