the trend in long-term unemployment and characteristics of ... · the trend in long-term...
TRANSCRIPT

The Trend in Long-Term Unemployment and Characteristics of Workers Unemployed for Two Years or More
Gerald Mayer Analyst in Labor Policy
March 24, 2014
Congressional Research Service
7-5700 www.crs.gov
R41559
The Trend in Long-Term Unemployment
Congressional Research Service
Summary One of the characteristics of the recession that officially began in the United States in December 2007 and ended in June 2009 was the unprecedented rise in long-term unemployment. The long-term unemployed are often defined as workers who have been unemployed for more than six months. But, many unemployed workers have been looking for work for more than a year or for two years or more.
As the national unemployment rate increased during and after the 2007-2009 recession, so did the unemployment rate for workers unemployed for more than 26 weeks. In April 2010, the unemployment rate for workers unemployed for more than 26 weeks reached 4.5%, which was the highest rate recorded since BLS began collecting data on long-term unemployment in 1948. As the national unemployment rate has fallen, so has the unemployment rate for persons unemployed for more than 26 weeks. From April 2010 to December 2013, the unemployment rate for persons looking for work for more than six months fell from 4.5% to 2.5%. During the months leading up to the 2007-2009 recession, the unemployment rate for persons unemployed for more than six months was less than 1.0%.
In January 2011, the unemployment rate for workers who had been unemployed for more than a year reached 2.3%. By December 2013, the rate had fallen to 1.4%. The unemployment rate for workers unemployed for two years or more peaked in September 2011, at 1.3%. By December 2013, the rate had fallen to 0.8%. For both groups of long-term unemployed, the unemployment rate in December 2013 was higher than immediately before the 2007-2009 recession.
An analysis of differences in the share of the unemployed who have been unemployed for two or more years shows that in 2013:
• unemployed men were more likely than unemployed women to be out of work for two years or more (12.8% compared to 11.9%);
• older workers were more likely than younger workers to be unemployed for two years or more. While 8.2% of unemployed workers under the age of 35 had been looking for work for two years or more, more than twice that percentage (18.2%) of workers ages 45 and over had been out of work for two years or more.
• the percentage of unemployed workers with a high school degree who have been out of work for two years or more (12.8%) was not statistically different from the percentage of unemployed workers with a bachelor’s degree who have been out of work for two years or more (13.5%);
• married unemployed workers were more likely than unemployed workers who have never been married to be out of work for two years or more (12.9% and 10.9%, respectively); and
• unemployed black workers were more likely than unemployed white workers to have been unemployed for two years or more (14.2% and 11.8%, respectively); on the other hand, unemployed non-Hispanic workers were more likely than unemployed Hispanic workers to have been unemployed for two years or more (12.9% and 10.3%, respectively). Among workers unemployed for two years or more, white workers were older than black workers and non-Hispanic workers were older than Hispanic workers.
The Trend in Long-Term Unemployment
Congressional Research Service
Long-term unemployment rates and the number of long-term unemployed have fallen since peaking after the official end of the 2007-2009 recession. Monthly layoffs and discharges have fallen below their pre-recession levels. The number of jobs has increased since the end of the recession. But, the number of job openings is still below the monthly levels before the recession. The increase in the number of jobs and drop in the number of layoffs and discharges since the end of the recession may contribute to a reduction in the number of long-term unemployed. On the other hand, the slower growth in job openings may slow the hiring of the long-term unemployed. After a recession, as employers hire new workers, those who have been unemployed the longest may be among the last to be hired.
An issue for Congress is whether to reauthorize the Emergency Unemployment Compensation (EUC08) program, which expired at the end of 2013. Another issue may be whether to enact policies that could increase the demand for workers and, therefore, reduce the number of long-term unemployed. Other issues may include whether to adopt policies that may provide greater incentives for employers to hire the long-term employed, create incentives for the long-term unemployed to accept new employment, or ensure that the long-term unemployed have the skills that employers need.
The Trend in Long-Term Unemployment
Congressional Research Service
Contents Introduction ...................................................................................................................................... 1
Overview of Data and Methodology ......................................................................................... 1 The Trend in Long-Term Unemployment ........................................................................................ 2
Reliability of Estimates of the Long-Term Unemployed........................................................... 5 Will the Number of the Very Long-Term Unemployed Rise or Fall?........................................ 6
The Number of Jobs ............................................................................................................ 6 The Number of Unemployed ............................................................................................... 7 The Number of Layoffs and Discharges and the Number of Job Openings ........................ 8
Characteristics of the Very Long-Term Unemployed ...................................................................... 9 Gender ....................................................................................................................................... 9 Age .......................................................................................................................................... 10 Education ................................................................................................................................. 10 Marital Status ........................................................................................................................... 10 Race and Hispanic Origin ........................................................................................................ 11 Citizenship ............................................................................................................................... 11 Industry .................................................................................................................................... 12 Occupation ............................................................................................................................... 12
Figures Figure 1. Unemployment Rates: Total Unemployed and Workers Unemployed for More
than 26 Weeks, January 2007 to December 2013 ......................................................................... 3 Figure 2. Unemployment Rates: Unemployed for More than 52 or 78 Weeks or for Two
Years or More, January 2007 to December 2013 ......................................................................... 4 Figure 3. Monthly Average Number of Unemployed Workers: Total and by
Duration of Unemployment, 2013 ................................................................................................ 6 Figure 4. The Total Number of Unemployed and the Number of Workers Unemployed for
More than 26 Weeks, January 2007 to December 2013 ............................................................... 7 Figure 5. The Number of Workers Unemployed for More than 52 or 78 Weeks or for Two
Years or More, January 2007 to December 2013 ......................................................................... 8 Figure 6. The Monthly Number of Layoffs and Discharges and the Monthly Number of
Job Openings, January 2007 to December 2013........................................................................... 9
Tables Table A-1. Labor Force Characteristics of Persons 16 and Over, Comparison of Calendar
Years 2007 and 2013 ................................................................................................................... 15 Table A-2. Number of Workers Unemployed by Duration of Unemployment, Averages of
Monthly Data, 2013 .................................................................................................................... 15 Table A-3. Characteristics of the Unemployed, Averages of Monthly Data, 2013 ........................ 16
The Trend in Long-Term Unemployment
Congressional Research Service
Appendixes Appendix. Data and Methodology ................................................................................................. 13
Contacts Author Contact Information........................................................................................................... 23

The Trend in Long-Term Unemployment
Congressional Research Service 1
Introduction One of the characteristics of the recession that officially began in December 2007 and ended in June 2009 was the rise in long-term unemployment.1 The long-term unemployed are often defined as workers who have been looking for work for more than six months. But many workers have been looking for work for longer periods. The first part of this report examines the trend in long-term unemployment using four measures of the long-term unemployed: persons who have been looking for work for more than 26 weeks, more than 52 weeks, more than 78 weeks, and for two years or more. In this report, workers who have been unemployed for two or more years are defined as the “very long-term unemployed.”
Because unemployment during the 2007-2009 recession and its aftermath increased more among some groups of workers than others, the second part of the report analyzes selected characteristics of the very long-term unemployed.2
High long-term unemployment rates raise several issues for Congress. One issue is whether to reauthorize the Emergency Unemployment Compensation (EUC08) program.3 Other issues include whether to enact policies (1) to increase the demand for workers to reduce the number of long-term unemployed, (2) to provide greater incentives for employers to hire the long-term employed, (3) to create additional incentives for the long-term unemployed to accept new employment, (4) to ensure that the long-term unemployed have the skills that employers need, and/or (5) to improve the match between the skills of the long-term unemployed and the jobs that are available.4 This report does not address these issues.
Overview of Data and Methodology The analysis in this report is based on data from the monthly Current Population Survey (CPS), which is a household survey conducted by the Bureau of the Census for the Bureau of Labor Statistics (BLS) of the U.S. Department of Labor. The monthly CPS is the source of the national monthly unemployment rate and other labor market information.
1 The 2007-2009 recession was one of the deepest and the longest since the Great Depression of the 1930s. The National Bureau of Economic Research (NBER) dates the beginning and end of recessions. National Bureau of Economic Research, U.S. Business Cycle Expansions and Contractions, available at http://www.nber.org/cycles/cyclesmain.html. For a comparison of long-term unemployment rates during recent recessions, see CRS Report R41179, Long-Term Unemployment and Recessions, by Gerald Mayer and Linda Levine. 2 Table A-1 in the Appendix shows changes in unemployment rates from 2007 to 2013 for persons ages 16 and over in selected demographic groups. 3 CRS Report R41508, Expiring Unemployment Insurance Provisions, by Katelin P. Isaacs. For a discussion of unemployment insurance legislation introduced in the 113th Congress, see CRS Report R42936, Unemployment Insurance: Legislative Issues in the 113th Congress, by Julie M. Whittaker and Katelin P. Isaacs. 4 A 2012 report by the Government Accountability Office (GAO) analyzed how many workers who lost jobs during the 2007-2009 recession received and exhausted UC benefits, the economic circumstances of those who exhausted UC benefits, and the extent to which state unemployment insurance agencies referred those who exhausted UC benefits to income support programs. U.S. Government Accountability Office, Unemployment Insurance: Economic Circumstances of Individuals Who Exhausted Benefits, GAO-12-408, February 2012, available at http://www.gao.gov/assets/590/588680.pdf.
The Trend in Long-Term Unemployment
Congressional Research Service 2
In the CPS, persons are classified as unemployed if they are not working, they actively looked for work in the four weeks before the survey, and they are available for work. The CPS asks unemployed persons how long they have been looking for work.
The first part of the report examines the trend in long-term unemployment, by month, over the period from January 2007 through December 2013. The long-term unemployment rate is the number of long-term unemployed divided by the size of the labor force, where the labor force is the sum of persons who are employed or unemployed.
In this report, the very long-term unemployed are defined as workers who have been unemployed for two years or more. This range is used because, before January 2011, persons who reported that they had been unemployed for more than two years were recorded as having been unemployed for two years; their responses were top coded at two years. Starting in January 2011, the CPS allows respondents to report durations of unemployment of up to five years.5
An analysis of individual characteristics may rely on small sample sizes. Therefore, the second part of the report, which examines selected characteristics of the very long-term unemployed, uses monthly average data for calendar year 2013.
The CPS does not collect information on the number of unemployed workers who have exhausted all available UC benefits. Workers who are counted as unemployed in the CPS may or may not be receiving UC benefits. Conversely, persons who are receiving UC benefits may or may not be counted as unemployed in the CPS. In the CPS, persons are counted as unemployed if they do not have a job, they actively looked for work in the four weeks before they were interviewed, and they are currently available for work.6 Persons receiving UC benefits may not meet the CPS definition of who is unemployed; for example, they may not be looking for work because they are in an approved education or training program. Also, persons receiving UC benefits could fit the CPS definition of someone who is employed; for example, they could be in a work-sharing program.7
The Trend in Long-Term Unemployment The first part of this report compares the national unemployment rate to the long-term unemployment rates for workers who have been unemployed for more than 26 weeks, more than 52 weeks, more than 78 weeks, and two years or more. The four groups of the long-term 5 U.S. Department of Labor, Bureau of Labor Statistics, Changes to Data Collected on Unemployment Duration, available at http://www.bls.gov/cps/duration.htm. Before January 2011, the CPS could report a person as being unemployed for more than two years. In the CPS survey, a household is in the survey for four consecutive months, out of the survey for the next eight months, and then back in the survey for the next four months. The duration of unemployment for individuals in the survey for consecutive months is calculated automatically by adding to the number of weeks unemployed since the previous month. Thus, before January 2011, an individual who was initially coded as being unemployed for two years could have been reported as being unemployed for more than two years. 6 Persons who are not working and are waiting to be called back to a job from which they have been laid off are also counted as unemployed. U.S. Department of Labor, Bureau of Labor Statistics, Labor Force Statistics from the Current Population Survey, available at http://stats.bls.gov/cps. (Hereafter cited as BLS, Labor Force Statistics from the Current Population Survey.) The Appendix provides more detail on the data and methodology used in this report. 7 Under a work sharing plan, also called a short-term compensation program, an employee whose work hours are reduced may receive partial UC benefits. See CRS Report R40689, Compensated Work Sharing Arrangements (Short-Time Compensation) as an Alternative to Layoffs, by Julie M. Whittaker.
The Trend in Long-Term Unemployment
Congressional Research Service 3
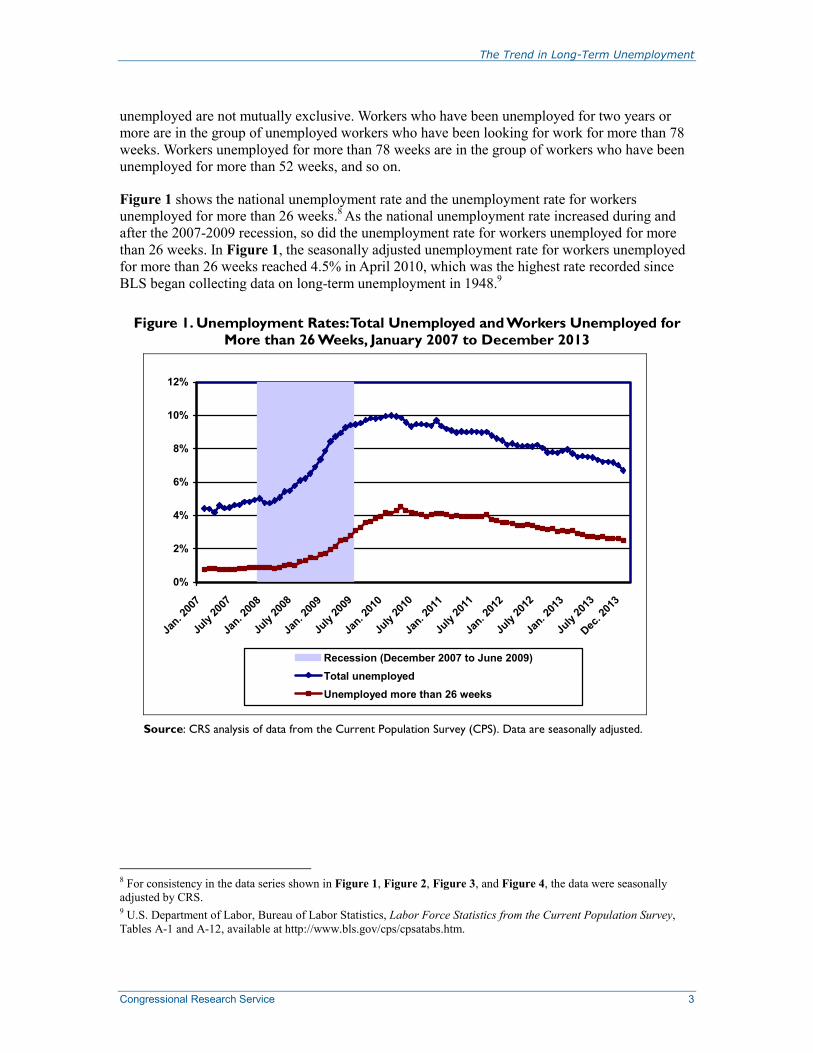
unemployed are not mutually exclusive. Workers who have been unemployed for two years or more are in the group of unemployed workers who have been looking for work for more than 78 weeks. Workers unemployed for more than 78 weeks are in the group of workers who have been unemployed for more than 52 weeks, and so on.
Figure 1 shows the national unemployment rate and the unemployment rate for workers unemployed for more than 26 weeks.8 As the national unemployment rate increased during and after the 2007-2009 recession, so did the unemployment rate for workers unemployed for more than 26 weeks. In Figure 1, the seasonally adjusted unemployment rate for workers unemployed for more than 26 weeks reached 4.5% in April 2010, which was the highest rate recorded since BLS began collecting data on long-term unemployment in 1948.9
Figure 1. Unemployment Rates: Total Unemployed and Workers Unemployed for More than 26 Weeks, January 2007 to December 2013
0%
2%
4%
6%
8%
10%
12%
Jan. 2
007
July
2007
Jan. 2
008
July
2008
Jan. 2
009
July
2009
Jan. 2
010
July
2010
Jan. 2
011
July
2011
Jan. 2
012
July
2012
Jan. 2
013
July
2013
Dec. 2
013
Recession (December 2007 to June 2009)Total unemployedUnemployed more than 26 weeks
Source: CRS analysis of data from the Current Population Survey (CPS). Data are seasonally adjusted.
8 For consistency in the data series shown in Figure 1, Figure 2, Figure 3, and Figure 4, the data were seasonally adjusted by CRS. 9 U.S. Department of Labor, Bureau of Labor Statistics, Labor Force Statistics from the Current Population Survey, Tables A-1 and A-12, available at http://www.bls.gov/cps/cpsatabs.htm.
The Trend in Long-Term Unemployment
Congressional Research Service 4
The seasonally adjusted national unemployment rate in Figure 1 peaked at 10.0% in February 2010, several months after the official end of the 2007-2009 recession.10 As the national unemployment rate has fallen, so has the unemployment rate for persons unemployed for more than 26 weeks. From April 2010 to December 2013, the unemployment rate for persons looking for work for more than six months fell from 4.5% to 2.5%. The rate in December 2013 was higher than the pre-recession rate, however. During the months leading up to the 2007-2009 recession, the unemployment rate for persons unemployed for more than six months was less than 1.0%.
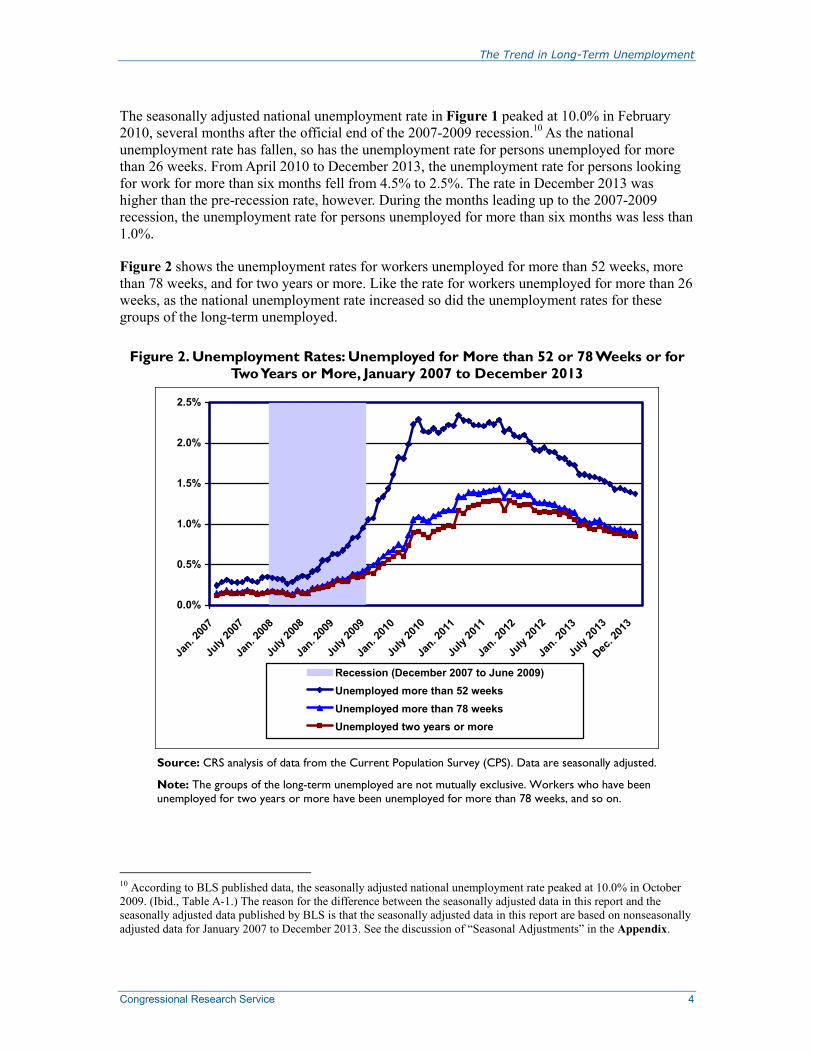
Figure 2 shows the unemployment rates for workers unemployed for more than 52 weeks, more than 78 weeks, and for two years or more. Like the rate for workers unemployed for more than 26 weeks, as the national unemployment rate increased so did the unemployment rates for these groups of the long-term unemployed.
Figure 2. Unemployment Rates: Unemployed for More than 52 or 78 Weeks or for Two Years or More, January 2007 to December 2013
0.0%
0.5%
1.0%
1.5%
2.0%
2.5%
Jan. 2
007
July
2007
Jan. 2
008
July
2008
Jan. 2
009
July
2009
Jan. 2
010
July
2010
Jan. 2
011
July
2011
Jan. 2
012
July
2012
Jan. 2
013
July
2013
Dec. 2
013
Recession (December 2007 to June 2009)Unemployed more than 52 weeksUnemployed more than 78 weeksUnemployed two years or more
Source: CRS analysis of data from the Current Population Survey (CPS). Data are seasonally adjusted.
Note: The groups of the long-term unemployed are not mutually exclusive. Workers who have been unemployed for two years or more have been unemployed for more than 78 weeks, and so on.
10 According to BLS published data, the seasonally adjusted national unemployment rate peaked at 10.0% in October 2009. (Ibid., Table A-1.) The reason for the difference between the seasonally adjusted data in this report and the seasonally adjusted data published by BLS is that the seasonally adjusted data in this report are based on nonseasonally adjusted data for January 2007 to December 2013. See the discussion of “Seasonal Adjustments” in the Appendix.
The Trend in Long-Term Unemployment
Congressional Research Service 5
In January 2011, the unemployment rate for workers who were unemployed for more than a year reached 2.3%. By December 2013, the rate had fallen to 1.4%.
The unemployment rate for workers unemployed for more than a year and a half peaked at 1.4% in September 2011. In December 2013, the rate was at 0.9%.
The unemployment rate for workers unemployed for two years or more also peaked in September 2011, at 1.3%. By December 2013, the rate had fallen to 0.8%.
As with the unemployment rate for workers unemployed for more than six months, each of the unemployment rates shown in Figure 2 was higher at the end of 2013 than during the months immediately preceding the 2007-2009 recession.
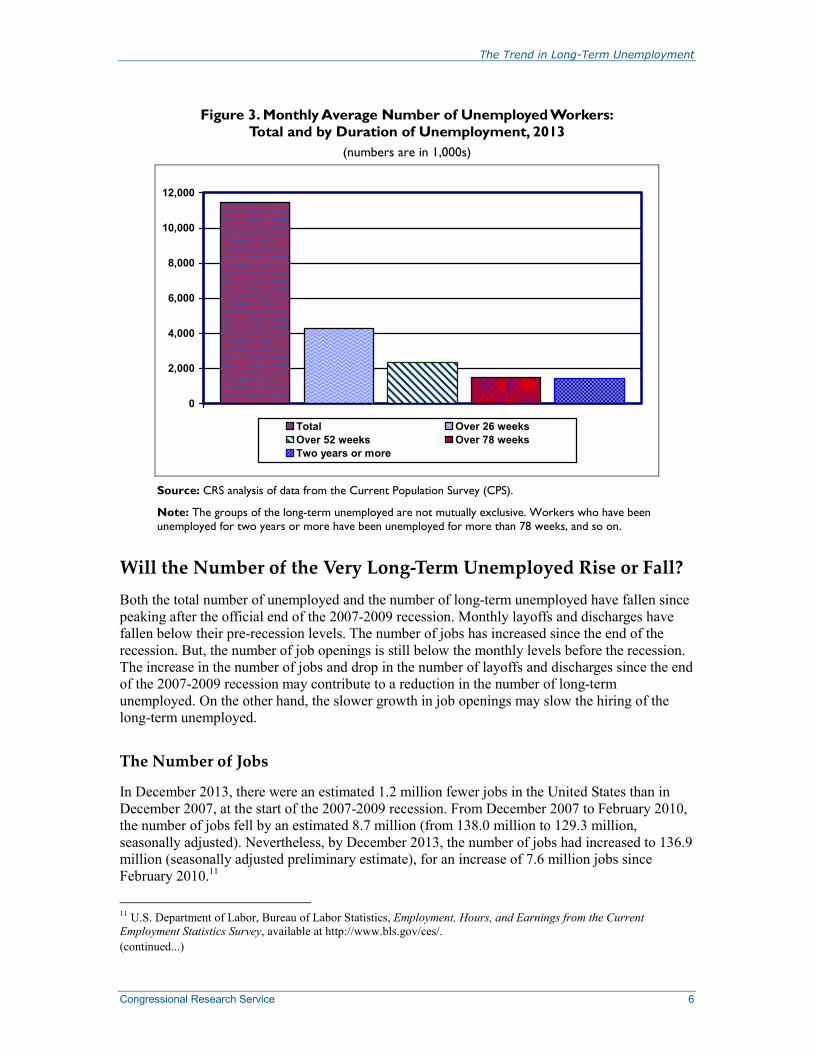
Reliability of Estimates of the Long-Term Unemployed Figure 3 shows the monthly average number of unemployed workers in calendar year 2013 for each of the unemployment rates shown in Figure 1 and Figure 2. In 2013, the monthly average number of unemployed was 11.5 million persons. An estimated 1.5 million persons were unemployed for more than a year and a half, while almost 1.4 million were unemployed for two years or more. This does not necessarily mean, however, that most workers who report that they have been unemployed for more than a year and a half will still be unemployed six months later.
In the CPS, many respondents round off the number of weeks that they have been unemployed. Thus, the estimates of the duration of unemployment from the CPS may not be precise. For example, many workers who report that they have been unemployed for a year may actually have been unemployed for more than a year or less than a year. In 2013, an estimated 631,000 unemployed workers said that they had been out of work for a year. But, only14,000 were recorded as having been unemployed for 51 weeks and only 13,000 were recorded as being out of work for 53 weeks. (See Table A-2 in the Appendix.) Similarly, many respondents who report that they have been unemployed for more than a year and a half or for two years or more may actually have been unemployed for a longer or shorter period.
The Trend in Long-Term Unemployment
Congressional Research Service 6
Figure 3. Monthly Average Number of Unemployed Workers: Total and by Duration of Unemployment, 2013
(numbers are in 1,000s)
0
2,000
4,000
6,000
8,000
10,000
12,000
Total Over 26 weeksOver 52 weeks Over 78 weeksTwo years or more
Source: CRS analysis of data from the Current Population Survey (CPS).
Note: The groups of the long-term unemployed are not mutually exclusive. Workers who have been unemployed for two years or more have been unemployed for more than 78 weeks, and so on.
Will the Number of the Very Long-Term Unemployed Rise or Fall? Both the total number of unemployed and the number of long-term unemployed have fallen since peaking after the official end of the 2007-2009 recession. Monthly layoffs and discharges have fallen below their pre-recession levels. The number of jobs has increased since the end of the recession. But, the number of job openings is still below the monthly levels before the recession. The increase in the number of jobs and drop in the number of layoffs and discharges since the end of the 2007-2009 recession may contribute to a reduction in the number of long-term unemployed. On the other hand, the slower growth in job openings may slow the hiring of the long-term unemployed.
The Number of Jobs
In December 2013, there were an estimated 1.2 million fewer jobs in the United States than in December 2007, at the start of the 2007-2009 recession. From December 2007 to February 2010, the number of jobs fell by an estimated 8.7 million (from 138.0 million to 129.3 million, seasonally adjusted). Nevertheless, by December 2013, the number of jobs had increased to 136.9 million (seasonally adjusted preliminary estimate), for an increase of 7.6 million jobs since February 2010.11
11 U.S. Department of Labor, Bureau of Labor Statistics, Employment, Hours, and Earnings from the Current Employment Statistics Survey, available at http://www.bls.gov/ces/. (continued...)
The Trend in Long-Term Unemployment
Congressional Research Service 7
The Number of Unemployed
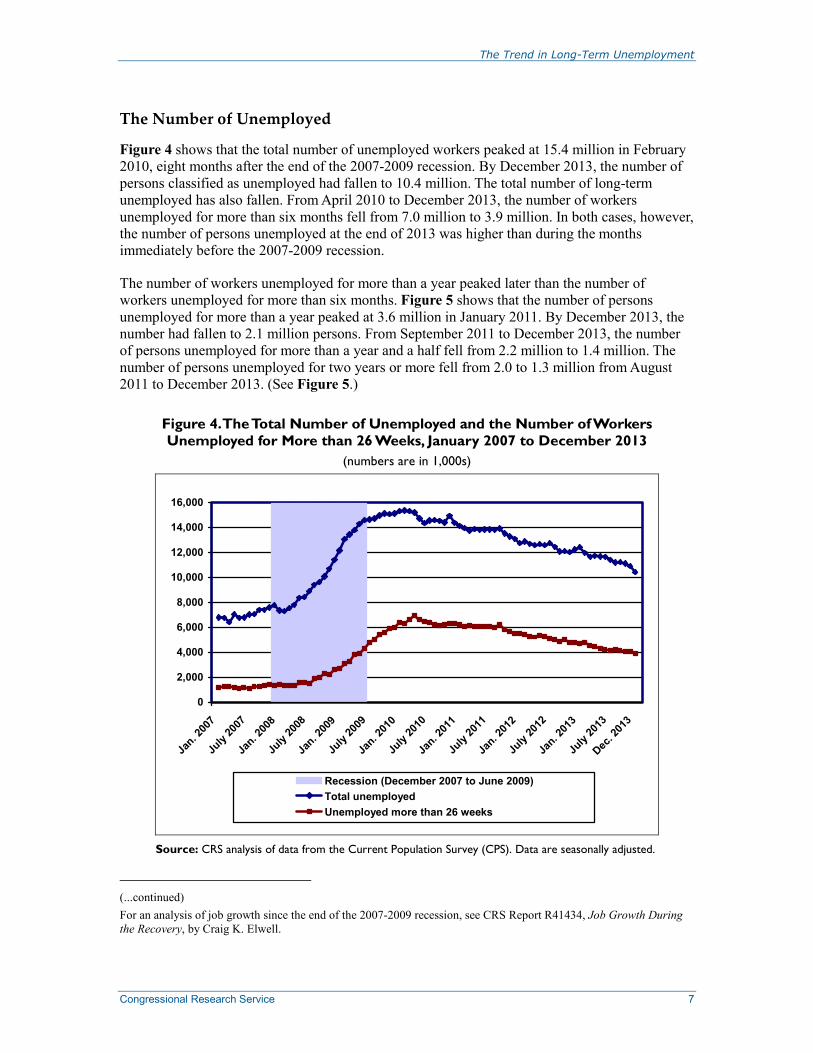
Figure 4 shows that the total number of unemployed workers peaked at 15.4 million in February 2010, eight months after the end of the 2007-2009 recession. By December 2013, the number of persons classified as unemployed had fallen to 10.4 million. The total number of long-term unemployed has also fallen. From April 2010 to December 2013, the number of workers unemployed for more than six months fell from 7.0 million to 3.9 million. In both cases, however, the number of persons unemployed at the end of 2013 was higher than during the months immediately before the 2007-2009 recession.
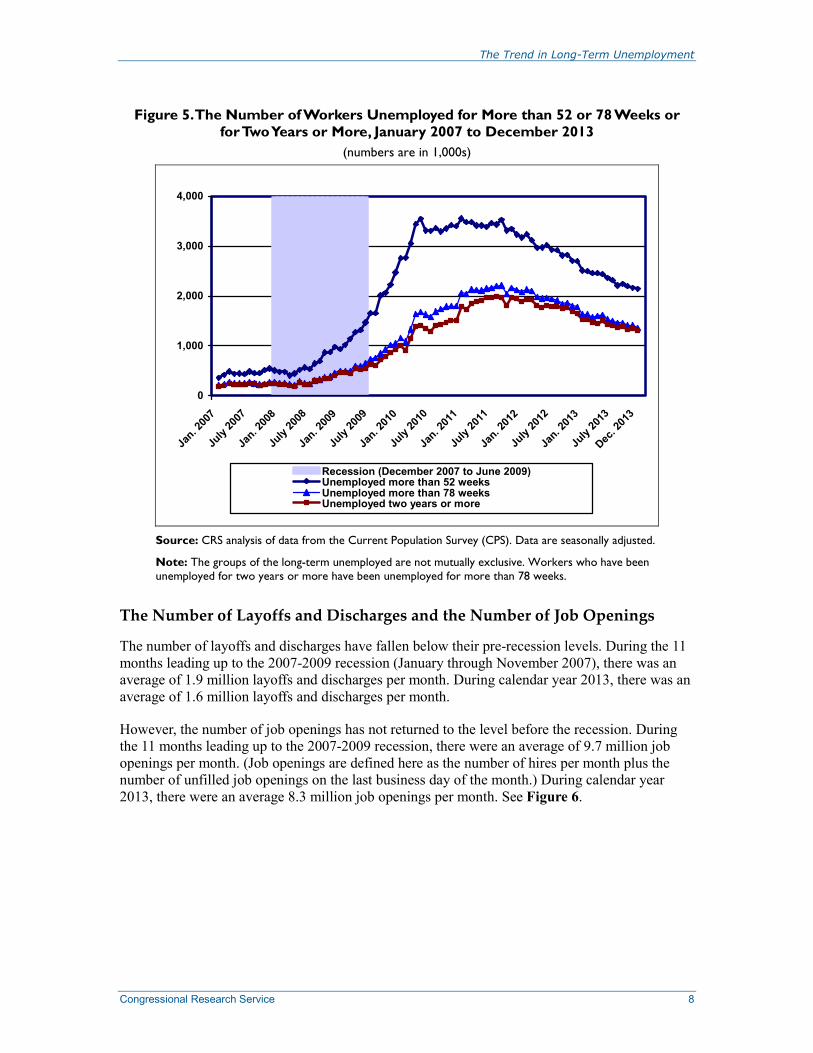
The number of workers unemployed for more than a year peaked later than the number of workers unemployed for more than six months. Figure 5 shows that the number of persons unemployed for more than a year peaked at 3.6 million in January 2011. By December 2013, the number had fallen to 2.1 million persons. From September 2011 to December 2013, the number of persons unemployed for more than a year and a half fell from 2.2 million to 1.4 million. The number of persons unemployed for two years or more fell from 2.0 to 1.3 million from August 2011 to December 2013. (See Figure 5.)
Figure 4. The Total Number of Unemployed and the Number of Workers Unemployed for More than 26 Weeks, January 2007 to December 2013
(numbers are in 1,000s)
0
2,000
4,000
6,000
8,000
10,000
12,000
14,000
16,000
Jan. 2
007
July
2007
Jan. 2
008
July
2008
Jan. 2
009
July
2009
Jan. 2
010
July
2010
Jan. 2
011
July
2011
Jan. 2
012
July
2012
Jan. 2
013
July
2013
Dec. 2
013
Recession (December 2007 to June 2009)Total unemployedUnemployed more than 26 weeks
Source: CRS analysis of data from the Current Population Survey (CPS). Data are seasonally adjusted.
(...continued) For an analysis of job growth since the end of the 2007-2009 recession, see CRS Report R41434, Job Growth During the Recovery, by Craig K. Elwell.
The Trend in Long-Term Unemployment
Congressional Research Service 8
Figure 5. The Number of Workers Unemployed for More than 52 or 78 Weeks or for Two Years or More, January 2007 to December 2013
(numbers are in 1,000s)
0
1,000
2,000
3,000
4,000
Jan. 2
007
July
2007
Jan. 2
008
July
2008
Jan. 2
009
July
2009
Jan. 2
010
July
2010
Jan. 2
011
July
2011
Jan. 2
012
July
2012
Jan. 2
013
July
2013
Dec. 2
013
Recession (December 2007 to June 2009)Unemployed more than 52 weeksUnemployed more than 78 weeksUnemployed two years or more
Source: CRS analysis of data from the Current Population Survey (CPS). Data are seasonally adjusted.
Note: The groups of the long-term unemployed are not mutually exclusive. Workers who have been unemployed for two years or more have been unemployed for more than 78 weeks.
The Number of Layoffs and Discharges and the Number of Job Openings
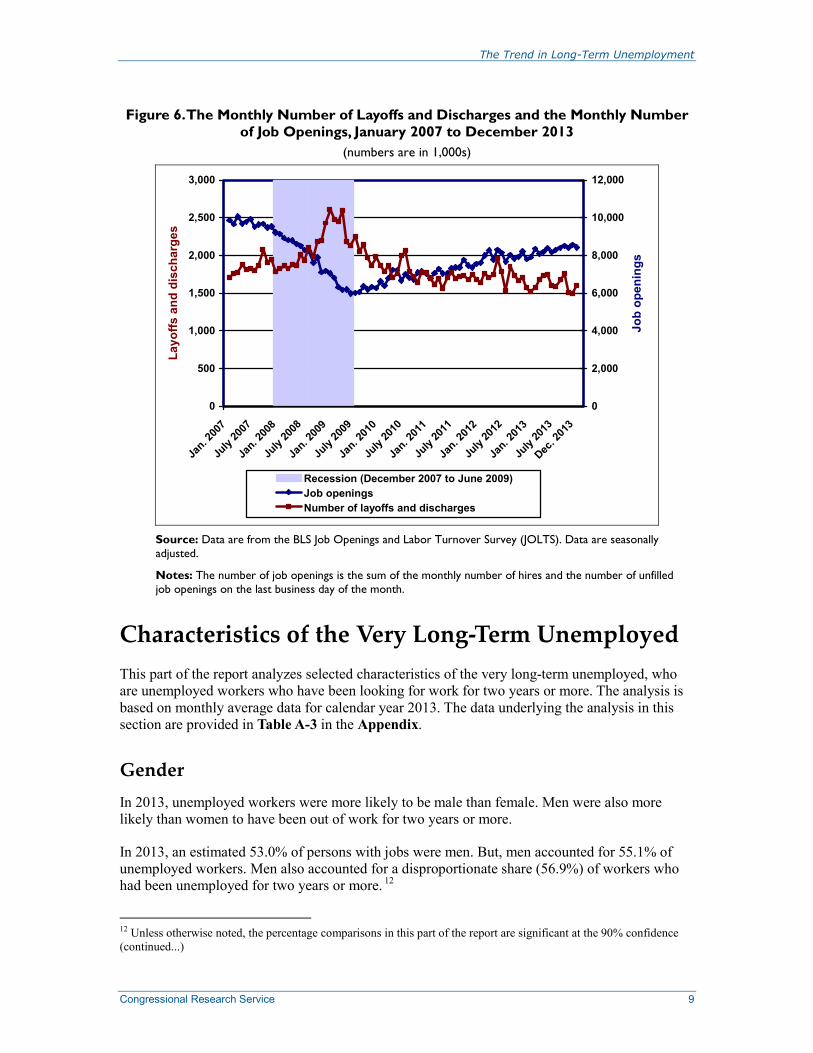
The number of layoffs and discharges have fallen below their pre-recession levels. During the 11 months leading up to the 2007-2009 recession (January through November 2007), there was an average of 1.9 million layoffs and discharges per month. During calendar year 2013, there was an average of 1.6 million layoffs and discharges per month.
However, the number of job openings has not returned to the level before the recession. During the 11 months leading up to the 2007-2009 recession, there were an average of 9.7 million job openings per month. (Job openings are defined here as the number of hires per month plus the number of unfilled job openings on the last business day of the month.) During calendar year 2013, there were an average 8.3 million job openings per month. See Figure 6.
The Trend in Long-Term Unemployment
Congressional Research Service 9
Figure 6. The Monthly Number of Layoffs and Discharges and the Monthly Number of Job Openings, January 2007 to December 2013
(numbers are in 1,000s)
0
500
1,000
1,500
2,000
2,500
3,000
Jan. 2
007
July
2007
Jan. 2
008
July
2008
Jan. 2
009
July
2009
Jan. 2
010
July
2010
Jan. 2
011
July
2011
Jan. 2
012
July
2012
Jan. 2
013
July
2013
Dec. 2
013
Layo
ffs a
nd d
isch
arge
s
0
2,000
4,000
6,000
8,000
10,000
12,000
Job
open
ings
Recession (December 2007 to June 2009)Job openingsNumber of layoffs and discharges
Source: Data are from the BLS Job Openings and Labor Turnover Survey (JOLTS). Data are seasonally adjusted.
Notes: The number of job openings is the sum of the monthly number of hires and the number of unfilled job openings on the last business day of the month.
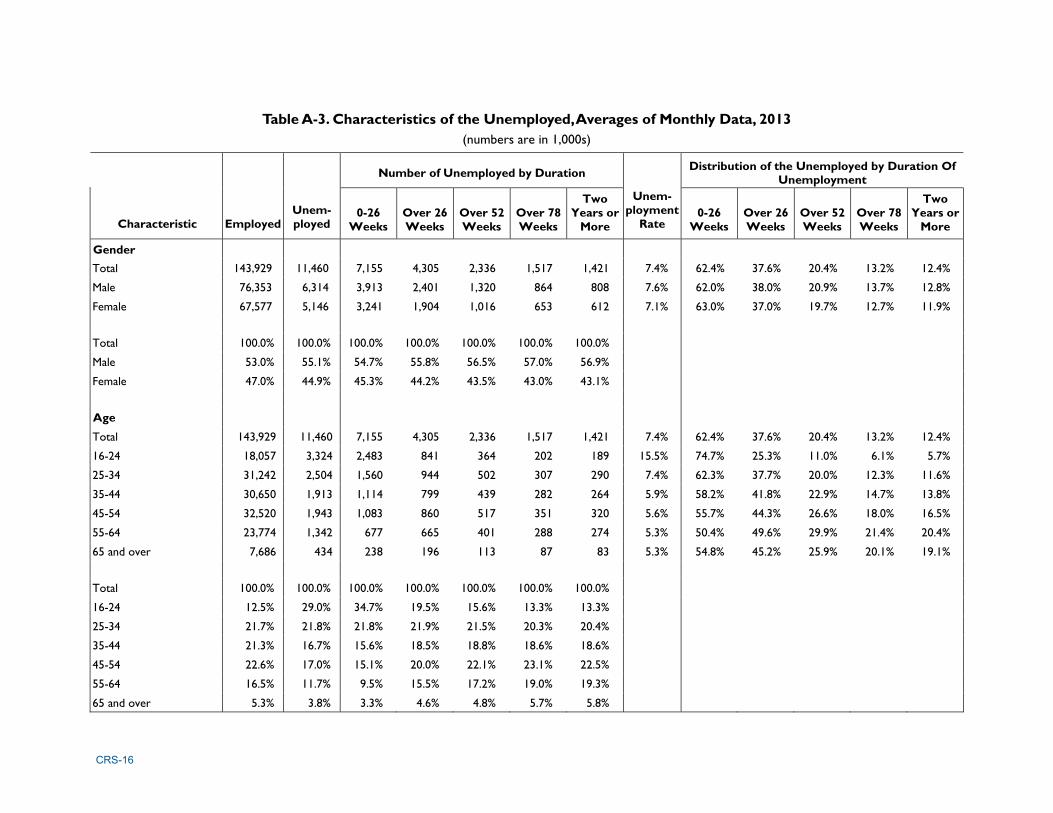
Characteristics of the Very Long-Term Unemployed This part of the report analyzes selected characteristics of the very long-term unemployed, who are unemployed workers who have been looking for work for two years or more. The analysis is based on monthly average data for calendar year 2013. The data underlying the analysis in this section are provided in Table A-3 in the Appendix.
Gender In 2013, unemployed workers were more likely to be male than female. Men were also more likely than women to have been out of work for two years or more.
In 2013, an estimated 53.0% of persons with jobs were men. But, men accounted for 55.1% of unemployed workers. Men also accounted for a disproportionate share (56.9%) of workers who had been unemployed for two years or more. 12
12 Unless otherwise noted, the percentage comparisons in this part of the report are significant at the 90% confidence (continued...)
The Trend in Long-Term Unemployment
Congressional Research Service 10
An estimated 12.4% of unemployed workers had been looking for work for two years or more in 2013. Men were slightly more likely than women (12.8% compared to 11.9%) to have been out of work for two years or more.
Age In 2013, unemployed workers were more likely to be younger than older, but older workers were more likely than younger workers to have been out of work for two years or more.
Although an estimated 34.2% of persons with jobs were under the age of 35 in 2013, approximately half (50.8%) of unemployed workers were under the age of 35. On the other hand, among workers who had been unemployed for two years or more, 33.7% were under the age of 35, while almost half (47.6%) were ages 45 and over.
Among unemployed workers under the age of 35, 8.2% had been unemployed for two years or more. Among unemployed workers ages 45 and over, more than twice that percentage, 18.2%, had been looking for work for two years or more.
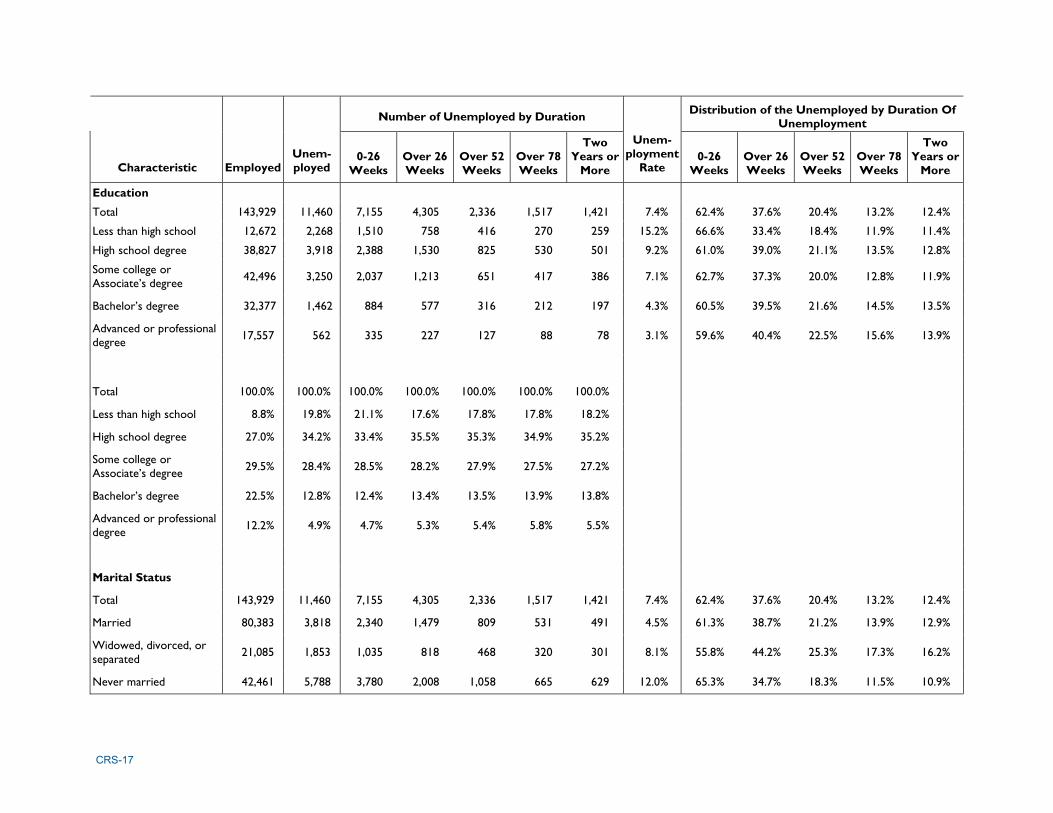
Education In 2013, a majority of unemployed workers had a high school education or less. But, unemployed workers with a high school degree only or with a bachelor’s degree or better were equally likely to have been looking for work for two years or more.
Among persons who had jobs in 2013, 35.8% had a high school education or less. However, among unemployed workers, 54.0% had a high school education or less.
Among unemployed workers, those with a bachelor’s degree (13.5%) were more likely than those with some college (11.9%) or those with less than a high school education (11.4%) to have been looking for work for two years or more. However, the percentage of unemployed workers with a high school education only (12.8%) who had been looking for work for two or more years was not statistically different from the percentage of unemployed workers with a bachelor’s degree (13.5%) or the percentage with an advanced or professional degree (13.9%) who had been looking for work for two years or longer.
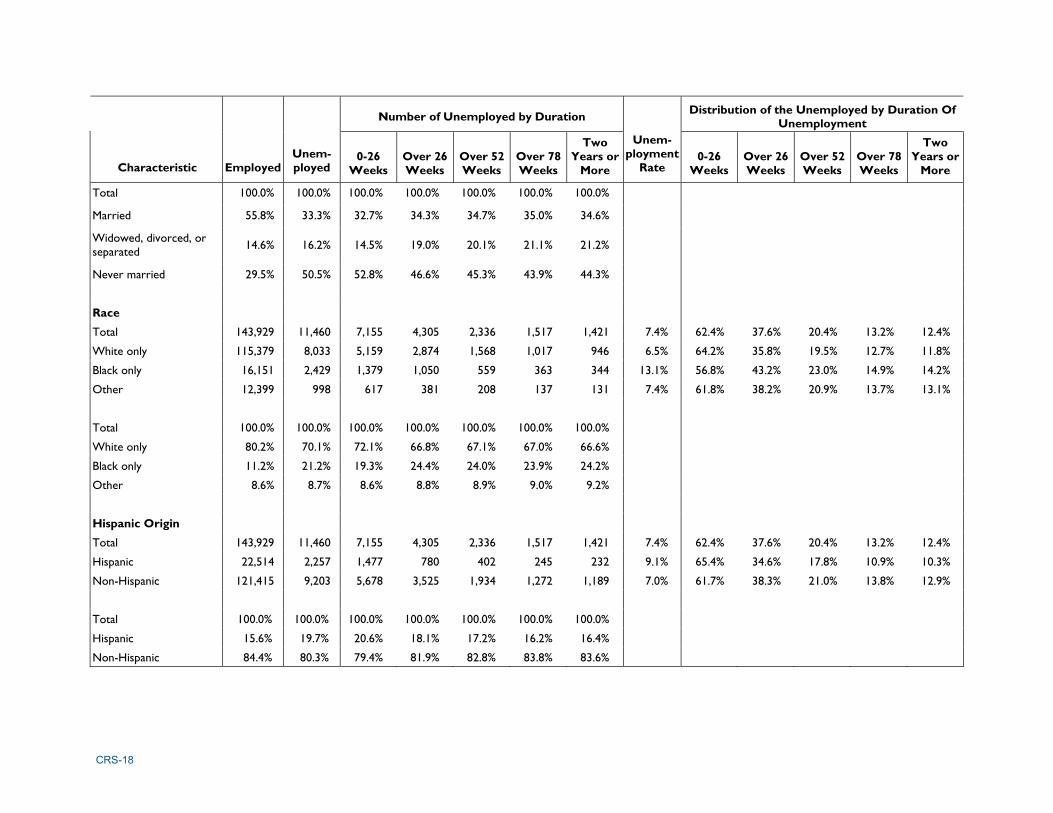
Marital Status In 2013, a disproportionate share of unemployed workers had never been married. But, among unemployed workers, married workers were more likely than workers who had never been married to have been unemployed for two years or more.
In 2013, persons who had never been married accounted for 29.5% of employed workers, but 50.5% of workers who were unemployed.
(...continued) level or better. See the discussion of confidence intervals in the Appendix.
The Trend in Long-Term Unemployment
Congressional Research Service 11
Among unemployed workers, married workers were more likely than workers who had never been married to have been out of work for two years or more (12.9% compared to 10.9%). Similarly, unemployed workers who were widowed, divorced, or separated were more likely than workers who had never been married to have been out of work for two or more years (16.2% compared to 10.9%).
Race and Hispanic Origin In 2013, a disproportionate share of unemployed workers were either black or Hispanic (i.e., their shares of the unemployed were greater than their shares of the employed). Black workers were also more likely than white workers to have been unemployed for two years or more. On the other hand, Hispanic workers were less likely than non-Hispanic workers to have been out of work for two years or longer.
In 2013, while black workers accounted for 11.2% of persons with jobs, they made up 21.2% of unemployed workers. Likewise, while Hispanic workers made up 15.6% of persons with jobs, they accounted for 19.7% of unemployed workers.
Among unemployed workers, a larger percentage of black than white workers had been unemployed for two years or more (14.2% compared to 11.8%). On the other hand, non-Hispanic workers were more likely than Hispanic workers to have been looking for work for two years or longer (12.9% compared to 10.3%).
Among workers unemployed for two years or more, white workers were older than black workers and non-Hispanic workers were older than Hispanic workers. Among white workers unemployed for two years or more, 53.0% were ages 45 and over, compared to 34.0% of black workers. Among non-Hispanic workers unemployed for two years or more, 48.6% were ages 45 and over, compared to 42.9% of Hispanic workers. (These numbers are not shown in Table A-3.)
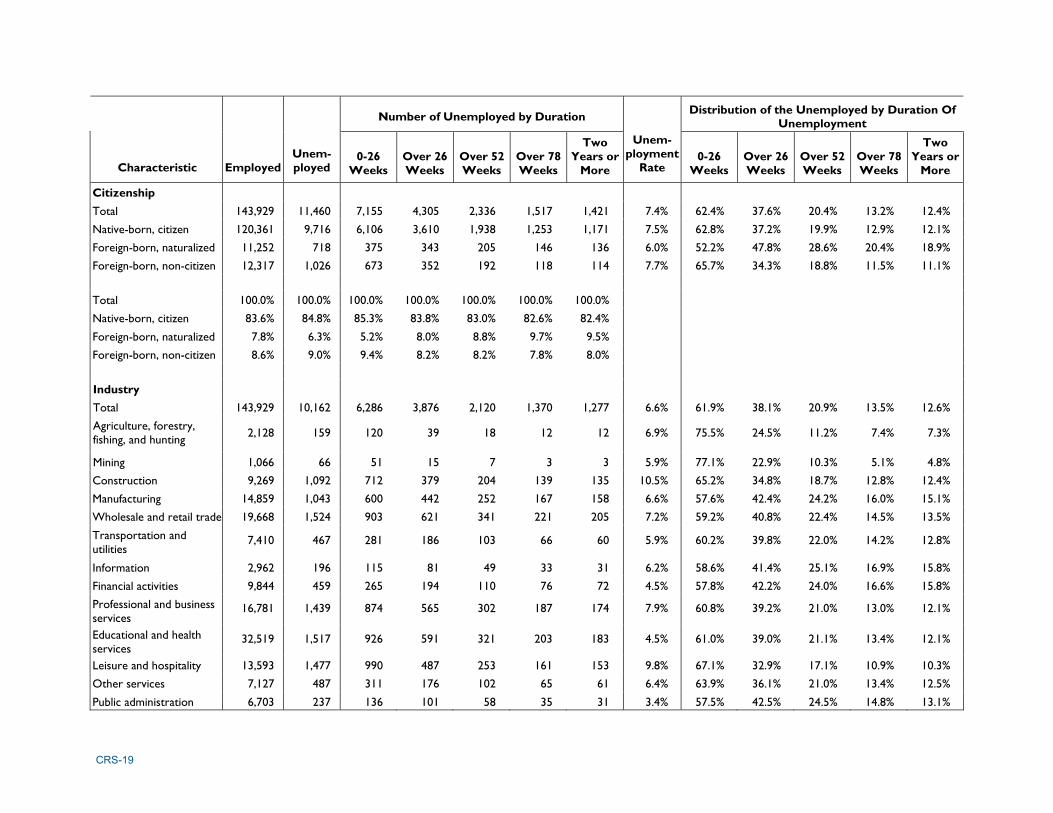
Citizenship In 2013, foreign-born non-U.S. citizens were just as likely as native-born citizens to be unemployed. But, U.S. citizens were more likely than noncitizens to have been looking for work for two years or more.13
While native-born U.S. citizens made up 83.6% of all employed persons in 2013, they accounted for 84.8% of unemployed workers. Similarly, while foreign-born non-U.S. citizens made up 8.6% of employed workers, they accounted for 9.0% of unemployed workers. On the other hand, 7.8% of employed persons were foreign-born, naturalized U.S. citizens, but they were only 6.3% of unemployed workers.
Compared to noncitizens, U.S. citizens were more likely to have been out of work for two or more years. While 12.1% of unemployed native-born citizens and 18.9% of unemployed 13 The CPS asks respondents if they are citizens of the United States. The survey also asks citizens if they were born a U.S. citizen or if they are naturalized citizens. The CPS does not ask noncitizens if they are legal immigrants, nonimmigrants who are in the United States temporarily (e.g., guest workers), or whether they are in the United States without authorization. Therefore, in this report, the definition of noncitizens includes legal immigrants, legal nonimmigrants, and persons in the country without authorization.
The Trend in Long-Term Unemployment
Congressional Research Service 12
naturalized citizens had been looking for work for at least two years, 11.1% of unemployed noncitizens had been looking for work for two years or more.
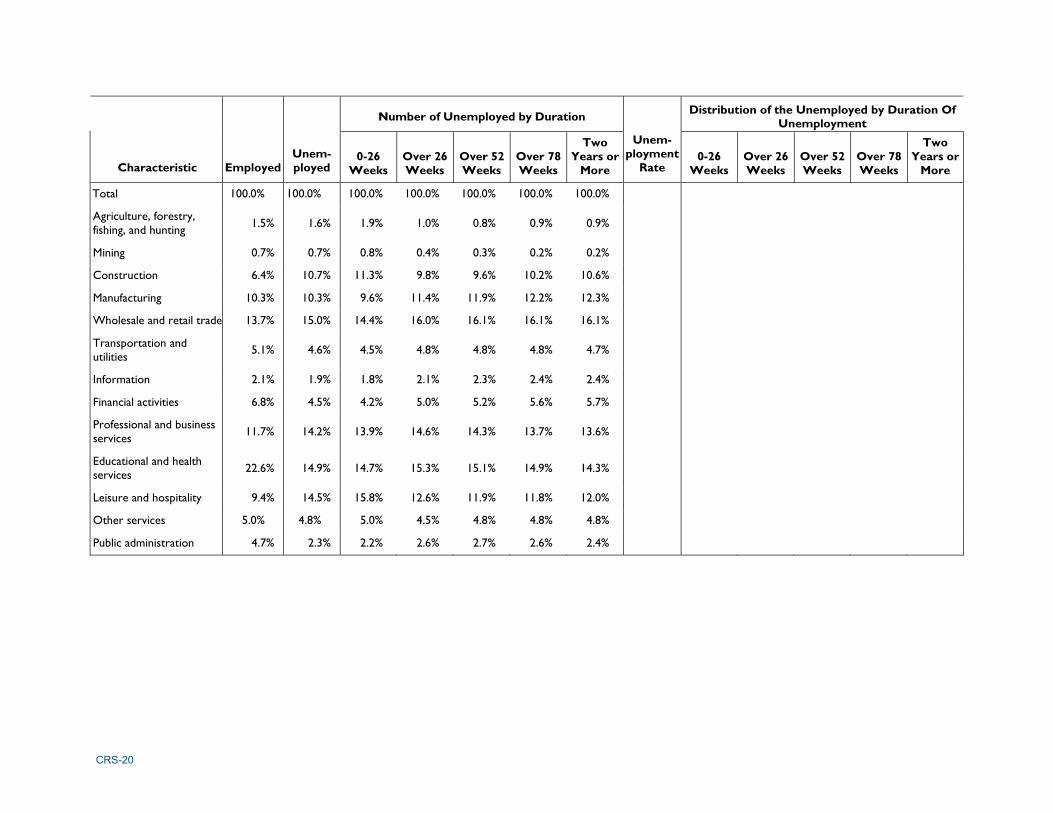
Industry In 2013, a disproportionate share of unemployed workers had been employed in four industries: leisure and hospitality; construction; professional and business services; and wholesale and retail trade. But, none of the workers who had been employed in these industries were more likely than other workers to have been out of work for two years or more.
In 2013, 9.4% of persons with jobs worked in the leisure and hospitality industries, but 14.5% of unemployed workers had worked in these industries. While 12.6% of all unemployed workers had been out of work for two or more years, persons who had been employed in the leisure and hospitality industries were less likely, 10.3%, than other workers to have been looking for work for two years or more.14
Although they were not overrepresented among unemployed workers in 2013, unemployed workers who had worked in two industries—financial activities and manufacturing—were overrepresented among the very long-term unemployed. An estimated 15.8% of unemployed workers who had worked in financial activities had been out of work for two years or more. Similarly, approximately 15.1% of workers who had been employed in manufacturing had been looking for work for two years or longer.
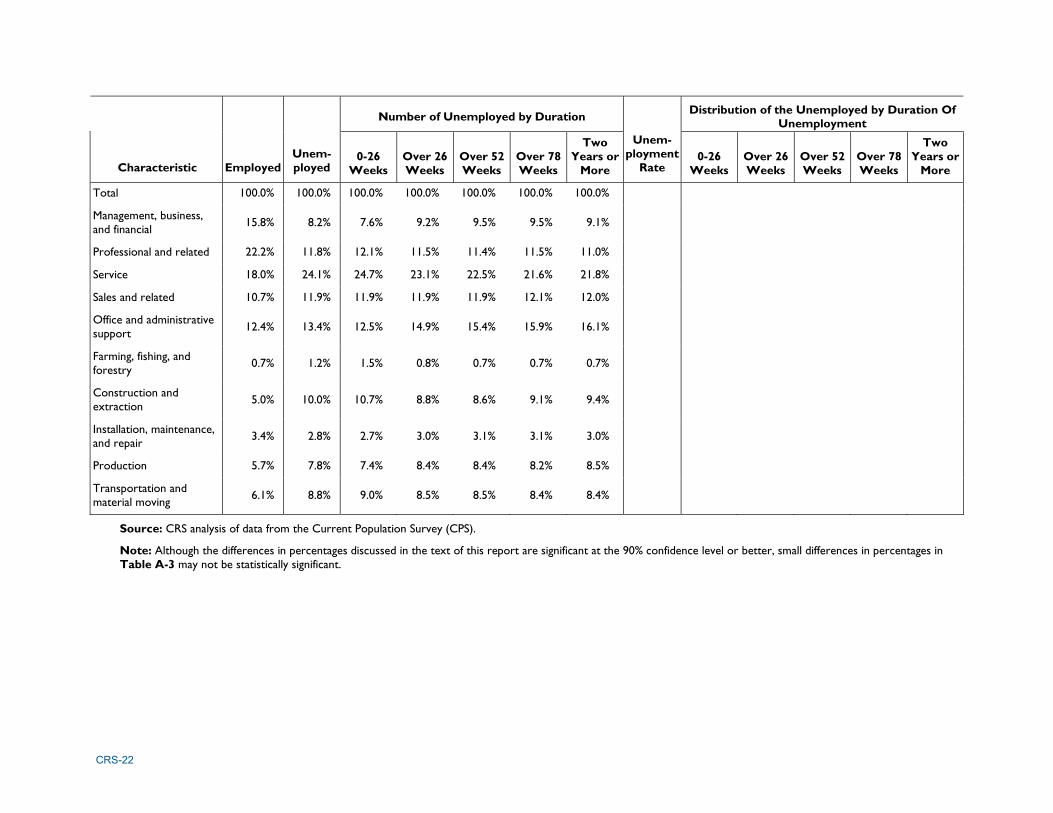
Occupation In 2013, workers in six broad occupational categories were overrepresented among the unemployed. Among these six occupations, only workers who had been employed in “office and administrative support” occupations were overrepresented among workers who had been unemployed for two years or more.
Workers in the following occupations were overrepresented among the unemployed in 2013: services; construction and extraction; transportation and material moving; production; sales and related; and office and administrative support. Although an estimated 12.6% of all unemployed workers had been out of work for two or more years, approximately 15.1% of unemployed workers who had worked in office and administrative support occupations had been looking for work for two years or more. Among unemployed workers who had worked in service occupations, 11.4% had been looking for work for two or more years, which is less than the average of 12.6% for all unemployed workers.
14 In 2013, 12.6% of unemployed workers had been out of work for two or more years. Among unemployed workers who had been employed in the wholesale and retail trades, 13.5% had been looking for work for two years or more. The difference is not statistically significant.
The Trend in Long-Term Unemployment
Congressional Research Service 13
Appendix. Data and Methodology This appendix provides a more detailed description of data and methodology used in this report.
Data The analysis in this report is based on data from the monthly Current Employment Statistics (CES) Survey and the monthly Current Population Survey (CPS).
The CES is a survey of nonfarm establishments conducted by the Bureau of Labor Statistics (BLS). The sample includes approximately 160,000 businesses and government agencies. The survey does not include self-employed persons, agricultural workers, private household workers, unpaid family workers, or persons on active military duty. 15
The CPS is a household survey conducted by the U.S. Bureau of the Census for the Bureau of Labor Statistics (BLS) of the U.S. Department of Labor. The CPS interviews approximately 55,500 households each month.16 The sample for the monthly CPS is representative of the civilian noninstitutional population of the United States. The sample does not include persons living in institutions (such as psychiatric hospitals, nursing homes, or correctional facilities) or persons on active military duty.17
In the CPS, persons are counted as employed if they did any work for pay during the survey week, if they did at least 15 hours of unpaid work in a family-run business, or if they were temporarily absent from their regular job because of illness, vacation, bad weather, industrial dispute, or various personal reasons. Persons are counted as unemployed if they did not have a job, actively looked for work in the four weeks before the survey, and are currently available for work. Persons who are not working and are waiting to be called back to a job from which they have been temporarily laid off are also counted as unemployed.18
In the CPS, “duration of unemployment” is the number of weeks that a person who is classified as unemployed has been looking for work. For someone on layoff, duration of unemployment is the number of weeks since the person was laid off. A period of two weeks or more during which a person is employed or stopped looking for work is considered a break in the continuous period of unemployment.19
The data that are available to public users of the CPS may not be the same as the data available to BLS. In order to protect the confidentiality of persons in the survey, the Census Bureau modifies
15 U.S. Department of Labor, Bureau of Labor Statistics, Employment and Earnings, vol. 58, February 2011, available at http://www.bls.gov/opub/ee/empearn201102.pdf, p. 197. 16 U.S. Department of Labor, Bureau of Labor Statistics, Employment and Earnings, February 2006, p. 192, available at http://www.bls.gov/cps/eetech_methods.pdf. 17 U.S. Census Bureau, Current Population Survey (CPS), available at http://www.census.gov/cps/. 18 BLS, Labor Force Statistics from the Current Population Survey. 19 U.S. Department of Commerce, Census Bureau, Current Population Survey, 2013 Annual Social and Economic (ASEC) Supplement, available at http://www.census.gov/prod/techdoc/cps/cpsmar13.pdf, p. 9-1.
The Trend in Long-Term Unemployment
Congressional Research Service 14
(or “masks”) the age variable in the data available to public users.20 As a result, some estimates produced by public users of the CPS may not match estimates published by BLS.
In this report, estimates of the employed include both wage and salary workers and self-employed persons who work in unincorporated businesses.
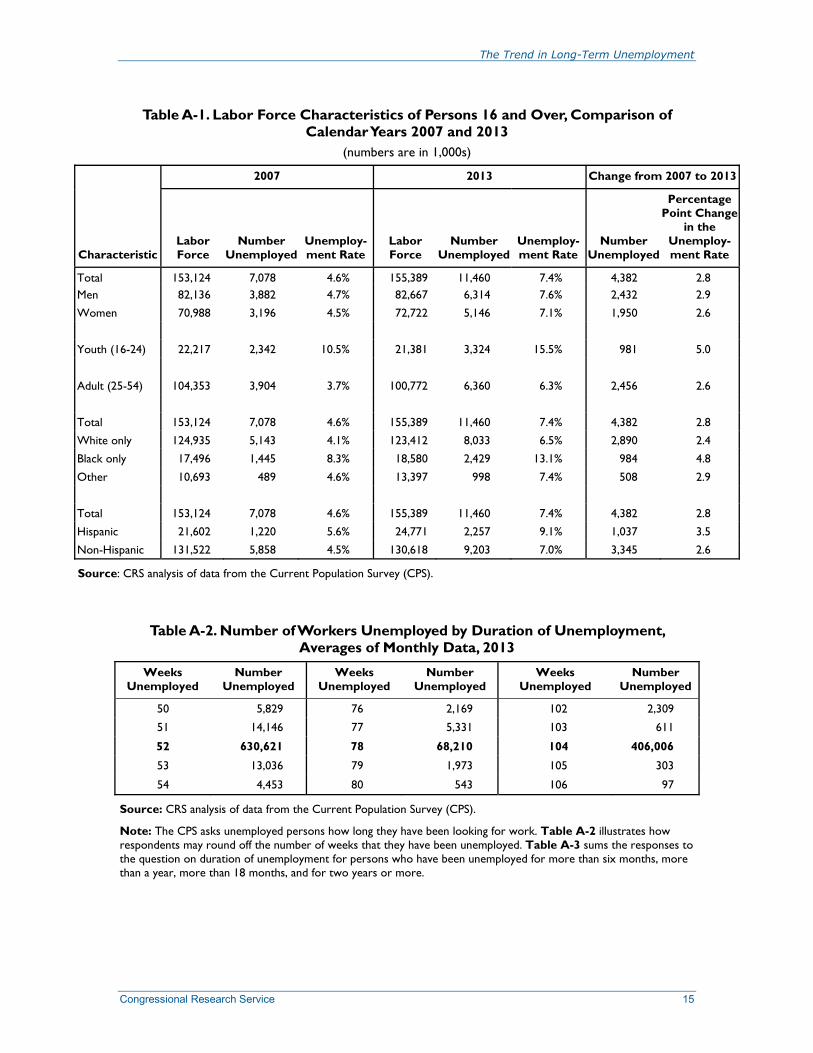
As noted in the introduction, during and after the 2007- 2009 recession, unemployment increased more among some groups of workers than others. Table A-1 shows that, from 2007 to 2013, the unemployment rate increased by 2.9 percentage points among men, but by 2.6 points among women. The unemployment rate increased by 5.0 points among young workers (ages 16 to 24), but by 2.6 points among workers ages 25 to 54. Among black workers, the unemployment rate increased more than among white workers (4.8 versus 2.4 points). Unemployment increased by 3.5 points among Hispanic workers, but by 2.6 points among non-Hispanic workers.
Table A-2 illustrates how respondents in the CPS may round off the number of weeks that they are unemployed. Until January 2011, BLS capped the duration of unemployment at two years. Beginning in January 2011, respondents can report up to five years of unemployment.
Table A-3 provides the data discussed in the second part of the report on the “Characteristics of the Very Long-Term Unemployed.”
20 U.S. Department of Commerce, Census Bureau, Analysis of Perturbed and Unperturbed Age Estimates: 2008, available at http://www.census.gov/cps/user_note_age_estimates.html.
The Trend in Long-Term Unemployment
Congressional Research Service 15
Table A-1. Labor Force Characteristics of Persons 16 and Over, Comparison of Calendar Years 2007 and 2013
(numbers are in 1,000s)
Characteristic
2007 2013 Change from 2007 to 2013
Labor Force
Number Unemployed
Unemploy-ment Rate
Labor Force
Number Unemployed
Unemploy-ment Rate
Number Unemployed
Percentage Point Change
in the Unemploy-ment Rate
Total 153,124 7,078 4.6% 155,389 11,460 7.4% 4,382 2.8Men 82,136 3,882 4.7% 82,667 6,314 7.6% 2,432 2.9
Women 70,988 3,196 4.5% 72,722 5,146 7.1% 1,950 2.6
Youth (16-24) 22,217 2,342 10.5% 21,381 3,324 15.5% 981 5.0
Adult (25-54) 104,353 3,904 3.7% 100,772 6,360 6.3% 2,456 2.6
Total 153,124 7,078 4.6% 155,389 11,460 7.4% 4,382 2.8
White only 124,935 5,143 4.1% 123,412 8,033 6.5% 2,890 2.4
Black only 17,496 1,445 8.3% 18,580 2,429 13.1% 984 4.8
Other 10,693 489 4.6% 13,397 998 7.4% 508 2.9
Total 153,124 7,078 4.6% 155,389 11,460 7.4% 4,382 2.8
Hispanic 21,602 1,220 5.6% 24,771 2,257 9.1% 1,037 3.5
Non-Hispanic 131,522 5,858 4.5% 130,618 9,203 7.0% 3,345 2.6
Source: CRS analysis of data from the Current Population Survey (CPS).
Table A-2. Number of Workers Unemployed by Duration of Unemployment, Averages of Monthly Data, 2013
Weeks Unemployed
Number Unemployed
Weeks Unemployed
Number Unemployed
Weeks Unemployed
Number Unemployed
50 5,829 76 2,169 102 2,309
51 14,146 77 5,331 103 611
52 630,621 78 68,210 104 406,006
53 13,036 79 1,973 105 303
54 4,453 80 543 106 97
Source: CRS analysis of data from the Current Population Survey (CPS).
Note: The CPS asks unemployed persons how long they have been looking for work. Table A-2 illustrates how respondents may round off the number of weeks that they have been unemployed. Table A-3 sums the responses to the question on duration of unemployment for persons who have been unemployed for more than six months, more than a year, more than 18 months, and for two years or more.
CRS-16
Table A-3. Characteristics of the Unemployed, Averages of Monthly Data, 2013 (numbers are in 1,000s)
Characteristic Employed Unem-ployed
Number of Unemployed by Duration
Unem-ployment
Rate
Distribution of the Unemployed by Duration Of Unemployment
0-26 Weeks
Over 26 Weeks
Over 52 Weeks
Over 78 Weeks
Two Years or
More 0-26
Weeks Over 26 Weeks
Over 52 Weeks
Over 78 Weeks
Two Years or
More
Gender Total 143,929 11,460 7,155 4,305 2,336 1,517 1,421 7.4% 62.4% 37.6% 20.4% 13.2% 12.4%
Male 76,353 6,314 3,913 2,401 1,320 864 808 7.6% 62.0% 38.0% 20.9% 13.7% 12.8%
Female 67,577 5,146 3,241 1,904 1,016 653 612 7.1% 63.0% 37.0% 19.7% 12.7% 11.9%
Total 100.0% 100.0% 100.0% 100.0% 100.0% 100.0% 100.0%
Male 53.0% 55.1% 54.7% 55.8% 56.5% 57.0% 56.9%
Female 47.0% 44.9% 45.3% 44.2% 43.5% 43.0% 43.1%
Age
Total 143,929 11,460 7,155 4,305 2,336 1,517 1,421 7.4% 62.4% 37.6% 20.4% 13.2% 12.4%
16-24 18,057 3,324 2,483 841 364 202 189 15.5% 74.7% 25.3% 11.0% 6.1% 5.7%
25-34 31,242 2,504 1,560 944 502 307 290 7.4% 62.3% 37.7% 20.0% 12.3% 11.6%
35-44 30,650 1,913 1,114 799 439 282 264 5.9% 58.2% 41.8% 22.9% 14.7% 13.8%
45-54 32,520 1,943 1,083 860 517 351 320 5.6% 55.7% 44.3% 26.6% 18.0% 16.5%
55-64 23,774 1,342 677 665 401 288 274 5.3% 50.4% 49.6% 29.9% 21.4% 20.4%
65 and over 7,686 434 238 196 113 87 83 5.3% 54.8% 45.2% 25.9% 20.1% 19.1%
Total 100.0% 100.0% 100.0% 100.0% 100.0% 100.0% 100.0%
16-24 12.5% 29.0% 34.7% 19.5% 15.6% 13.3% 13.3%
25-34 21.7% 21.8% 21.8% 21.9% 21.5% 20.3% 20.4%
35-44 21.3% 16.7% 15.6% 18.5% 18.8% 18.6% 18.6%
45-54 22.6% 17.0% 15.1% 20.0% 22.1% 23.1% 22.5%
55-64 16.5% 11.7% 9.5% 15.5% 17.2% 19.0% 19.3%
65 and over 5.3% 3.8% 3.3% 4.6% 4.8% 5.7% 5.8%
CRS-17
Characteristic Employed Unem-ployed
Number of Unemployed by Duration
Unem-ployment
Rate
Distribution of the Unemployed by Duration Of Unemployment
0-26 Weeks
Over 26 Weeks
Over 52 Weeks
Over 78 Weeks
Two Years or
More 0-26
Weeks Over 26 Weeks
Over 52 Weeks
Over 78 Weeks
Two Years or
More
Education
Total 143,929 11,460 7,155 4,305 2,336 1,517 1,421 7.4% 62.4% 37.6% 20.4% 13.2% 12.4%
Less than high school 12,672 2,268 1,510 758 416 270 259 15.2% 66.6% 33.4% 18.4% 11.9% 11.4%
High school degree 38,827 3,918 2,388 1,530 825 530 501 9.2% 61.0% 39.0% 21.1% 13.5% 12.8%
Some college or Associate’s degree 42,496 3,250 2,037 1,213 651 417 386 7.1% 62.7% 37.3% 20.0% 12.8% 11.9%
Bachelor’s degree 32,377 1,462 884 577 316 212 197 4.3% 60.5% 39.5% 21.6% 14.5% 13.5%
Advanced or professional degree 17,557 562 335 227 127 88 78 3.1% 59.6% 40.4% 22.5% 15.6% 13.9%
Total 100.0% 100.0% 100.0% 100.0% 100.0% 100.0% 100.0%
Less than high school 8.8% 19.8% 21.1% 17.6% 17.8% 17.8% 18.2%
High school degree 27.0% 34.2% 33.4% 35.5% 35.3% 34.9% 35.2%
Some college or Associate’s degree 29.5% 28.4% 28.5% 28.2% 27.9% 27.5% 27.2%
Bachelor’s degree 22.5% 12.8% 12.4% 13.4% 13.5% 13.9% 13.8%
Advanced or professional degree 12.2% 4.9% 4.7% 5.3% 5.4% 5.8% 5.5%
Marital Status
Total 143,929 11,460 7,155 4,305 2,336 1,517 1,421 7.4% 62.4% 37.6% 20.4% 13.2% 12.4%
Married 80,383 3,818 2,340 1,479 809 531 491 4.5% 61.3% 38.7% 21.2% 13.9% 12.9%
Widowed, divorced, or separated 21,085 1,853 1,035 818 468 320 301 8.1% 55.8% 44.2% 25.3% 17.3% 16.2%
Never married 42,461 5,788 3,780 2,008 1,058 665 629 12.0% 65.3% 34.7% 18.3% 11.5% 10.9%
CRS-18
Characteristic Employed Unem-ployed
Number of Unemployed by Duration
Unem-ployment
Rate
Distribution of the Unemployed by Duration Of Unemployment
0-26 Weeks
Over 26 Weeks
Over 52 Weeks
Over 78 Weeks
Two Years or
More 0-26
Weeks Over 26 Weeks
Over 52 Weeks
Over 78 Weeks
Two Years or
More
Total 100.0% 100.0% 100.0% 100.0% 100.0% 100.0% 100.0%
Married 55.8% 33.3% 32.7% 34.3% 34.7% 35.0% 34.6%
Widowed, divorced, or separated 14.6% 16.2% 14.5% 19.0% 20.1% 21.1% 21.2%
Never married 29.5% 50.5% 52.8% 46.6% 45.3% 43.9% 44.3%
Race
Total 143,929 11,460 7,155 4,305 2,336 1,517 1,421 7.4% 62.4% 37.6% 20.4% 13.2% 12.4%
White only 115,379 8,033 5,159 2,874 1,568 1,017 946 6.5% 64.2% 35.8% 19.5% 12.7% 11.8%
Black only 16,151 2,429 1,379 1,050 559 363 344 13.1% 56.8% 43.2% 23.0% 14.9% 14.2%
Other 12,399 998 617 381 208 137 131 7.4% 61.8% 38.2% 20.9% 13.7% 13.1%
Total 100.0% 100.0% 100.0% 100.0% 100.0% 100.0% 100.0%
White only 80.2% 70.1% 72.1% 66.8% 67.1% 67.0% 66.6%
Black only 11.2% 21.2% 19.3% 24.4% 24.0% 23.9% 24.2%
Other 8.6% 8.7% 8.6% 8.8% 8.9% 9.0% 9.2%
Hispanic Origin
Total 143,929 11,460 7,155 4,305 2,336 1,517 1,421 7.4% 62.4% 37.6% 20.4% 13.2% 12.4%
Hispanic 22,514 2,257 1,477 780 402 245 232 9.1% 65.4% 34.6% 17.8% 10.9% 10.3%
Non-Hispanic 121,415 9,203 5,678 3,525 1,934 1,272 1,189 7.0% 61.7% 38.3% 21.0% 13.8% 12.9%
Total 100.0% 100.0% 100.0% 100.0% 100.0% 100.0% 100.0%
Hispanic 15.6% 19.7% 20.6% 18.1% 17.2% 16.2% 16.4%
Non-Hispanic 84.4% 80.3% 79.4% 81.9% 82.8% 83.8% 83.6%
CRS-19
Characteristic Employed Unem-ployed
Number of Unemployed by Duration
Unem-ployment
Rate
Distribution of the Unemployed by Duration Of Unemployment
0-26 Weeks
Over 26 Weeks
Over 52 Weeks
Over 78 Weeks
Two Years or
More 0-26
Weeks Over 26 Weeks
Over 52 Weeks
Over 78 Weeks
Two Years or
More
Citizenship
Total 143,929 11,460 7,155 4,305 2,336 1,517 1,421 7.4% 62.4% 37.6% 20.4% 13.2% 12.4%
Native-born, citizen 120,361 9,716 6,106 3,610 1,938 1,253 1,171 7.5% 62.8% 37.2% 19.9% 12.9% 12.1%
Foreign-born, naturalized 11,252 718 375 343 205 146 136 6.0% 52.2% 47.8% 28.6% 20.4% 18.9%
Foreign-born, non-citizen 12,317 1,026 673 352 192 118 114 7.7% 65.7% 34.3% 18.8% 11.5% 11.1%
Total 100.0% 100.0% 100.0% 100.0% 100.0% 100.0% 100.0%
Native-born, citizen 83.6% 84.8% 85.3% 83.8% 83.0% 82.6% 82.4%
Foreign-born, naturalized 7.8% 6.3% 5.2% 8.0% 8.8% 9.7% 9.5%
Foreign-born, non-citizen 8.6% 9.0% 9.4% 8.2% 8.2% 7.8% 8.0%
Industry
Total 143,929 10,162 6,286 3,876 2,120 1,370 1,277 6.6% 61.9% 38.1% 20.9% 13.5% 12.6%
Agriculture, forestry, fishing, and hunting 2,128 159 120 39 18 12 12 6.9% 75.5% 24.5% 11.2% 7.4% 7.3%
Mining 1,066 66 51 15 7 3 3 5.9% 77.1% 22.9% 10.3% 5.1% 4.8%
Construction 9,269 1,092 712 379 204 139 135 10.5% 65.2% 34.8% 18.7% 12.8% 12.4%
Manufacturing 14,859 1,043 600 442 252 167 158 6.6% 57.6% 42.4% 24.2% 16.0% 15.1%
Wholesale and retail trade 19,668 1,524 903 621 341 221 205 7.2% 59.2% 40.8% 22.4% 14.5% 13.5%
Transportation and utilities
7,410 467 281 186 103 66 60 5.9% 60.2% 39.8% 22.0% 14.2% 12.8%
Information 2,962 196 115 81 49 33 31 6.2% 58.6% 41.4% 25.1% 16.9% 15.8%
Financial activities 9,844 459 265 194 110 76 72 4.5% 57.8% 42.2% 24.0% 16.6% 15.8%
Professional and business services
16,781 1,439 874 565 302 187 174 7.9% 60.8% 39.2% 21.0% 13.0% 12.1%
Educational and health services
32,519 1,517 926 591 321 203 183 4.5% 61.0% 39.0% 21.1% 13.4% 12.1%
Leisure and hospitality 13,593 1,477 990 487 253 161 153 9.8% 67.1% 32.9% 17.1% 10.9% 10.3%
Other services 7,127 487 311 176 102 65 61 6.4% 63.9% 36.1% 21.0% 13.4% 12.5%
Public administration 6,703 237 136 101 58 35 31 3.4% 57.5% 42.5% 24.5% 14.8% 13.1%
CRS-20
Characteristic Employed Unem-ployed
Number of Unemployed by Duration
Unem-ployment
Rate
Distribution of the Unemployed by Duration Of Unemployment
0-26 Weeks
Over 26 Weeks
Over 52 Weeks
Over 78 Weeks
Two Years or
More 0-26
Weeks Over 26 Weeks
Over 52 Weeks
Over 78 Weeks
Two Years or
More
Total 100.0% 100.0% 100.0% 100.0% 100.0% 100.0% 100.0%
Agriculture, forestry, fishing, and hunting 1.5% 1.6% 1.9% 1.0% 0.8% 0.9% 0.9%
Mining 0.7% 0.7% 0.8% 0.4% 0.3% 0.2% 0.2%
Construction 6.4% 10.7% 11.3% 9.8% 9.6% 10.2% 10.6%
Manufacturing 10.3% 10.3% 9.6% 11.4% 11.9% 12.2% 12.3%
Wholesale and retail trade 13.7% 15.0% 14.4% 16.0% 16.1% 16.1% 16.1%
Transportation and utilities 5.1% 4.6% 4.5% 4.8% 4.8% 4.8% 4.7%
Information 2.1% 1.9% 1.8% 2.1% 2.3% 2.4% 2.4%
Financial activities 6.8% 4.5% 4.2% 5.0% 5.2% 5.6% 5.7%
Professional and business services 11.7% 14.2% 13.9% 14.6% 14.3% 13.7% 13.6%
Educational and health services 22.6% 14.9% 14.7% 15.3% 15.1% 14.9% 14.3%
Leisure and hospitality 9.4% 14.5% 15.8% 12.6% 11.9% 11.8% 12.0%
Other services 5.0% 4.8% 5.0% 4.5% 4.8% 4.8% 4.8%
Public administration 4.7% 2.3% 2.2% 2.6% 2.7% 2.6% 2.4%

CRS-21
Characteristic Employed Unem-ployed
Number of Unemployed by Duration
Unem-ployment
Rate
Distribution of the Unemployed by Duration Of Unemployment
0-26 Weeks
Over 26 Weeks
Over 52 Weeks
Over 78 Weeks
Two Years or
More 0-26
Weeks Over 26 Weeks
Over 52 Weeks
Over 78 Weeks
Two Years or
More
Occupation
Total 143,929 10,162 6,286 3,876 2,120 1,370 1,277 6.6% 61.9% 38.1% 20.9% 13.5% 12.6%
Management, business, and financial 22,773 830 475 355 202 131 116 3.5% 57.2% 42.8% 24.3% 15.7% 14.0%
Professional and related 31,900 1,203 758 445 242 157 140 3.6% 63.0% 37.0% 20.1% 13.0% 11.7%
Service 25,957 2,446 1,550 896 477 296 278 8.6% 63.4% 36.6% 19.5% 12.1% 11.4%
Sales and related 15,459 1,212 751 462 251 166 154 7.3% 61.9% 38.1% 20.7% 13.7% 12.7%
Office and administrative support 17,801 1,361 784 578 327 218 205 7.1% 57.6% 42.4% 24.0% 16.0% 15.1%
Farming, fishing, and forestry 966 125 94 30 14 9 9 11.4% 75.6% 24.4% 11.5% 7.2% 7.0%
Construction and extraction 7,131 1,014 673 341 182 124 120 12.4% 66.4% 33.6% 18.0% 12.2% 11.8%
Installation, maintenance, and repair 4,961 283 168 115 66 42 39 5.4% 59.4% 40.6% 23.2% 14.9% 13.7%
Production 8,271 791 465 326 178 113 108 8.7% 58.8% 41.2% 22.5% 14.3% 13.7%
Transportation and material moving 8,711 897 568 329 180 115 107 9.3% 63.3% 36.7% 20.1% 12.8% 12.0%
CRS-22
Characteristic Employed Unem-ployed
Number of Unemployed by Duration
Unem-ployment
Rate
Distribution of the Unemployed by Duration Of Unemployment
0-26 Weeks
Over 26 Weeks
Over 52 Weeks
Over 78 Weeks
Two Years or
More 0-26
Weeks Over 26 Weeks
Over 52 Weeks
Over 78 Weeks
Two Years or
More
Total 100.0% 100.0% 100.0% 100.0% 100.0% 100.0% 100.0%
Management, business, and financial 15.8% 8.2% 7.6% 9.2% 9.5% 9.5% 9.1%
Professional and related 22.2% 11.8% 12.1% 11.5% 11.4% 11.5% 11.0%
Service 18.0% 24.1% 24.7% 23.1% 22.5% 21.6% 21.8%
Sales and related 10.7% 11.9% 11.9% 11.9% 11.9% 12.1% 12.0%
Office and administrative support 12.4% 13.4% 12.5% 14.9% 15.4% 15.9% 16.1%
Farming, fishing, and forestry 0.7% 1.2% 1.5% 0.8% 0.7% 0.7% 0.7%
Construction and extraction 5.0% 10.0% 10.7% 8.8% 8.6% 9.1% 9.4%
Installation, maintenance, and repair 3.4% 2.8% 2.7% 3.0% 3.1% 3.1% 3.0%
Production 5.7% 7.8% 7.4% 8.4% 8.4% 8.2% 8.5%
Transportation and material moving 6.1% 8.8% 9.0% 8.5% 8.5% 8.4% 8.4%
Source: CRS analysis of data from the Current Population Survey (CPS).
Note: Although the differences in percentages discussed in the text of this report are significant at the 90% confidence level or better, small differences in percentages in Table A-3 may not be statistically significant.
The Trend in Long-Term Unemployment
Congressional Research Service 23
Seasonal Adjustments Month-to-month changes in labor force data may be affected by both seasonal and nonseasonal factors. Seasonal factors include regular changes in the weather, holidays, and the opening and closing of schools. Removing changes in unemployment that are due to regular seasonal fluctuations makes it easier to observe cyclical changes in employment (i.e., changes associated with economic expansions and contractions).21
BLS publishes seasonally adjusted data of the total number of unemployed workers and the number of workers unemployed for more than 26 weeks. In this report, the data series shown in Figure 1, Figure 2, Figure 3, and Figure 4 were seasonally adjusted by CRS using procedures developed by the U.S. Census Bureau and used by BLS.22 The seasonal adjustments in this report are based on nonseasonally adjusted data for the same time period; that is, the seven-year period from 2007 through 2013. In some cases, the seasonally adjusted data shown in this report for all unemployed workers and for workers unemployed for more than 26 weeks may not match the seasonally adjusted data published by BLS.
Confidence Levels Estimates based on survey responses from a sample of households have two kinds of error: nonsampling and sampling. Examples of nonsampling error include information that is misreported and errors made in processing collected information. Sampling error occurs because a sample, and not the entire population, of households is surveyed. The difference between an estimate based on a sample of households and the actual population value is known as sampling error. When using sample data, researchers typically construct confidence intervals around population estimates. Confidence intervals provide information about the accuracy of estimated values. With a 90% confidence interval and repeated samples from a population, 90% of intervals will include the average estimate of a population characteristic.
Author Contact Information Gerald Mayer Analyst in Labor Policy [email protected], 7-7815
21 Richard B. Tiller and Thomas D. Evans, Revision of Seasonally Adjusted Labor Force Series in 2009, April 2009, available at http://www.bls.gov/cps/cpsrs2009.pdf, p. 1. 22 U.S. Census Bureau, The X-12-ARIMA Seasonal Adjustment Program, available at http://www.census.gov/srd/www/x12a. The current version of X-12-ARIMA (version 0.3) is available to CRS in statistical software from the SAS Institute.