the transition of the austrian energy system to a … · university of natural resources and life...
TRANSCRIPT
University of Natural Resources and Life Siences, ViennaDepartment of Economics and Social Sciences
Institute of Forest, Environmental, and Natural ResourcePolicy
Institute for Sustainable Economic DevelopmentDepartment of Landscape, Spatial and Infrastructure
SciencesInstitute of Landscape Development, Recreation and
Conservation Planning
THE TRANSITION OF THE AUSTRIAN ENERGY SYSTEM TO A
HIGH PENETRATION OF WIND ENERGY: VISIONS, VALUES
AND COSTS
4. September 2017 IAEE, TU Vienna
Patrick ScherhauferStefan Höltinger
Boris SalakThomas Schauppenlehner
Johannes Schmidt
www.transwind.boku.ac.at

TransWind Presentation| 04.09.2017 | IAEE – TU Vienna
What is the problem?
The acceptance or non-acceptance of a particular renewable energy technology is depended on complex set of
economical incentives, costs, social norms, individual values, preferences, and beliefs at various levels of decision-making.
Wüstenhagen et al. 2007

TransWind Presentation| 04.09.2017 | IAEE – TU Vienna
Research Questions of TransWind
What is the techno-economicalpotential for wind energy in Austria?
What are the decisive patterns of acceptance and non-acceptance?
How are interests, rationales and beliefs embedded in different narratives (stories) about renewable energy?
Market & Socio-politicalAcceptance
Community & Socio-politicalAcceptance

TransWind Presentation| 04.09.2017 | IAEE – TU Vienna
Materials & Methods:A participatory integrated assessment
Triangle based on Wüstenhagen et al. 2007
1 WorldCafé28 semi structured interviews
1 questionnaire3 participatory workshops
with experts from thestakeholder group
6 case studies 4 visualisation courses 8 focus group discussions 8 semi structured interviews with local
stakeholders
Participatory modelling: Techno-economical wind
energy potential

TransWind Presentation| 04.09.2017 | IAEE – TU Vienna
The techno-economical potential:Overview of the modelling steps

TransWind Presentation| 04.09.2017 | IAEE – TU Vienna
The techno-economical potential:Criteria catalogue for the 3 participatory scenarios
scenarios of potential wind turbine sites GIS data-set
min med maxtopological restrictions
Areas above alpine forest line excluded excluded excluded Kilian et al. (1994)maximum slope (degrees) 5.7 8.5 11.3 SRTM DEM 90m
water bodies excluded excluded excluded Corine LC 5offset distance to settlements and infrastructure
settlement areas (m) a 2000 1200 1000 IACSbuildings outside of settlement areas (m) b 1000 750 750 OSM buildings
building land outside of settlement areas (m) 1000 750 750 federal land use plansbuilt-up areas c 300 300 300 federal land use plans
railways 300 300 300 OSMmotorways, primary and secondary roads 300 300 300 OSM
airport public safety zones d 5100 5100 5100 AustroControlpower grid (>110kV) 250 250 250 OSM
suitability of protected areas and offset distancesnational parks (m) no (3000) no (2000) no (1000) CDDA
Natura 2000 -habitats directive sites (m) no (2000) no potentiallyf Natura 2000
Natura 2000 - birds directive sites (m) no (2000) no no Natura 2000
other protected areas (m) e no (2000) no no CDDAimportant birdlife areas no potentiallyf potentiallyf IBAs
major migration routes for wild animals no potentiallyf potentiallyf ACC, Köhler (2005) forest areas no (1000) yesg yes Corine, AFDP
lakes >50ha (m) 3000 1750 1000 Corine LC 512

TransWind Presentation| 04.09.2017 | IAEE – TU Vienna
Spatial distribution of potential areas for wind turbines in the four scenarios
TransWind Presentation| 04.09.2017 | IAEE – TU Vienna
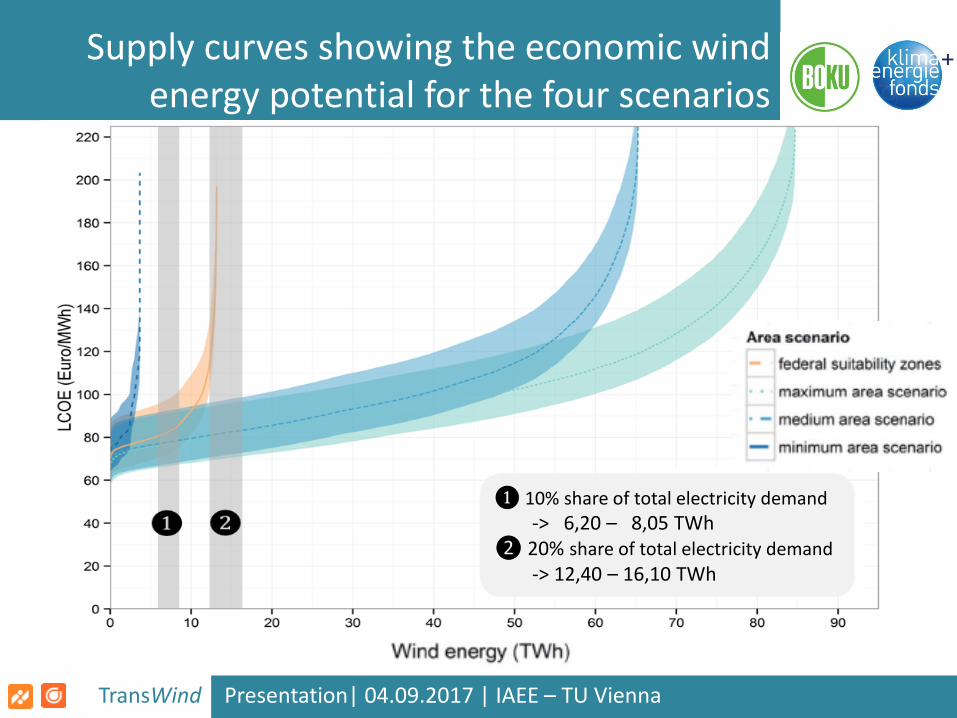
Supply curves showing the economic wind energy potential for the four scenarios
❶ 10% share of total electricity demand-> 6,20 – 8,05 TWh
❷ 20% share of total electricity demand-> 12,40 – 16,10 TWh

TransWind Presentation| 04.09.2017 | IAEE – TU Vienna
Sensitivity analysis

TransWind Presentation| 04.09.2017 | IAEE – TU Vienna
Spatial distribution of optimal wind sites
• Comparison of medium scenario (blue) with federal suitability zones(yellow)
• Wind energy production of 12,4 TWh (= 20% share of wind energy at atotal electricity demand of 62 TWh)

TransWind Presentation| 04.09.2017 | IAEE – TU Vienna
The techno-economical potential:Policy Conclusions
• The already existing suitability zones exclude many optimal sites, which are possible in our medium scenario.
• It is important to harmonize the legal framework conditions fordefining suitable areas for wind energy in Austria. Applying themfor all federal states could avoid economic inefficiencies and reduce wind energy expansion costs.
• The challenge for policy makers will be to find the right balancebetween– limiting wind production to sites with minimal negative effects on
landscape scenery, human health and the environment; and– providing enough potential wind turbine sites to allow the deployment of
wind energy at feasible costs.

University of Natural Resources and Life Siences, ViennaDepartment of Economics and Social Sciences
Institute of Forest, Environmental, and Natural ResourcePolicy
Institute for Sustainable Economic DevelopmentDepartment of Landscape, Spatial and Infrastructure
SciencesInstitute of Landscape Development, Recreation and
Conservation Planning
Many thanks for listening!
Patrick [email protected] Stefan HöltingerBoris SalakThomas SchauppenlehnerJohannes Schmidt
www.transwind.boku.ac.at

TransWind Presentation| 04.09.2017 | IAEE – TU Vienna
Overview of participating organisations in TransWind
group organizationspublic authorities Austrian Ministry for Transport, Innovation and Technology;
Federal Ministry of Science, Research and Economy; Austrian Energy Market Regulator – E-control; Chamber of Labour; Chamber of Commerce
federal state authorities Federal State Government Offices of Burgenland, Lower Austria, Salzburg and Styria; Ombuds Offices for Environmental Protection (Umweltanwaltschaft) of Burgenland, Lower Austria and Styria
wind park developers and operators
Energie Burgenland Windkraft GmbH; EVN Naturkraft GmbH; Ökostrom AG; PÜSPÖK Group; WEB Windenergie AG; Windkraft Simonsfeld AG
environmental and nature conservation groups
Austrian Environmental Umbrella Association (Umweltdachverband); BirdLife Austria; Coordination Centre for the Study and Protection of Bats
others Austrian Power Grid (APG); Austrian Wind Energy Association (IG-Windkraft); the processing and administration centre of the subsidies for eco-electricity (OeMAG)

TransWind Presentation| 04.09.2017 | IAEE – TU Vienna
Mean and range of parameter values for assessing the economic potential
cost element unit mean value range references
capital expenditures EUR kW-1 1675 1600-1900 1, 2, 3, 7
operational expenditures EUR MWh-1 26.4 18.5-34.2 3, 2, 4, 5
lifetime years 20 - 5, 6, 7
discount rate % 5 - 4, 5, 7
References: (1) Arántegui, 2014 (2) Gass et al., 2013 (3) Hantsch et al., 2009 (4) Rehfeldt et al.,
2013 (5) Kost et al., 2013 (6) McKenna et al., 2014; (7) Falkenberg et al., 2014
TransWind Presentation| 04.09.2017 | IAEE – TU Vienna
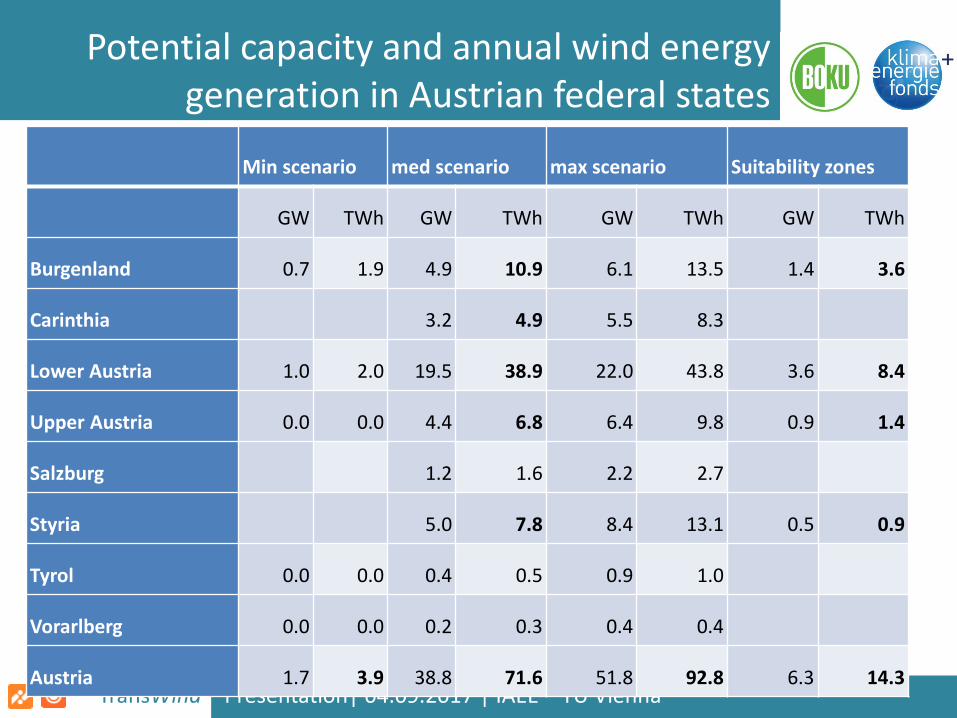
Potential capacity and annual wind energy generation in Austrian federal states
Min scenario med scenario max scenario Suitability zones
GW TWh GW TWh GW TWh GW TWh
Burgenland 0.7 1.9 4.9 10.9 6.1 13.5 1.4 3.6
Carinthia 3.2 4.9 5.5 8.3
Lower Austria 1.0 2.0 19.5 38.9 22.0 43.8 3.6 8.4
Upper Austria 0.0 0.0 4.4 6.8 6.4 9.8 0.9 1.4
Salzburg 1.2 1.6 2.2 2.7
Styria 5.0 7.8 8.4 13.1 0.5 0.9
Tyrol 0.0 0.0 0.4 0.5 0.9 1.0
Vorarlberg 0.0 0.0 0.2 0.3 0.4 0.4
Austria 1.7 3.9 38.8 71.6 51.8 92.8 6.3 14.3