the transcriptional regulator cbp has defined spatial
TRANSCRIPT

The Transcriptional Regulator CBP Has DefinedSpatial Associations within Interphase NucleiKirk J. McManus
1¤, David A. Stephens
2, Niall M. Adams
2, Suhail A. Islam
3, Paul S. Freemont
3*, Michael J. Hendzel
1*
1 Department of Oncology, Cross Cancer Institute, Edmonton, Alberta, Canada, 2 Department of Mathematics, Imperial College London, London, United Kingdom, 3 Division
of Molecular Biosciences, Imperial College London, London, United Kingdom
It is becoming increasingly clear that nuclear macromolecules and macromolecular complexes are compartmentalizedthrough binding interactions into an apparent three-dimensionally ordered structure. This ordering, however, does notappear to be deterministic to the extent that chromatin and nonchromatin structures maintain a strict 3-Darrangement. Rather, spatial ordering within the cell nucleus appears to conform to stochastic rather thandeterministic spatial relationships. The stochastic nature of organization becomes particularly problematic when anyattempt is made to describe the spatial relationship between proteins involved in the regulation of the genome. TheCREB–binding protein (CBP) is one such transcriptional regulator that, when visualised by confocal microscopy, revealsa highly punctate staining pattern comprising several hundred individual foci distributed within the nuclear volume.Markers for euchromatic sequences have similar patterns. Surprisingly, in most cases, the predicted one-to-onerelationship between transcription factor and chromatin sequence is not observed. Consequently, to understandwhether spatial relationships that are not coincident are nonrandom and potentially biologically important, it isnecessary to develop statistical approaches. In this study, we report on the development of such an approach andapply it to understanding the role of CBP in mediating chromatin modification and transcriptional regulation. We haveused nearest-neighbor distance measurements and probability analyses to study the spatial relationship between CBPand other nuclear subcompartments enriched in transcription factors, chromatin, and splicing factors. Our resultsdemonstrate that CBP has an order of spatial association with other nuclear subcompartments. We observe closerassociations between CBP and RNA polymerase II–enriched foci and SC35 speckles than nascent RNA or specificacetylated histones. Furthermore, we find that CBP has a significantly higher probability of being close to its known invivo substrate histone H4 lysine 5 compared with the closely related H4 lysine 12. This study demonstrates thatcomplex relationships not described by colocalization exist in the interphase nucleus and can be characterized andquantified. The subnuclear distribution of CBP is difficult to reconcile with a model where chromatin organization is thesole determinant of the nuclear organization of proteins that regulate transcription but is consistent with a close linkbetween spatial associations and nuclear functions.
Citation: McManus KJ, Stephens DA, Adams NM, Islam SA, Freemont PS, et al. (2006) The transcriptional regulator CBP has defined spatial associations within interphasenuclei. PLoS Comput Biol 2(10): e139. DOI: 10.1371/journal.pcbi.0020139
Introduction
It is now appreciated that the spatial relationships betweenchromatin and nonchromatin structures within the nucleo-plasm are correlated with transcriptional activity. Somegeneral rules are emerging for the organization of chromatinthat are typically cited as evidence for both spatio–temporalorganization of the nucleoplasm and for an underlyingregulated process to establish and maintain spatio–temporalorganization [1,2]. Specifically, chromosomes and regions ofchromosomes segregate differently within the nucleus,depending on whether or not they are rich in potentiallytranscribed genes. This organization has been described as apolar chromosomal organization because the individualinterphase chromosome territories segregate their R-bands(gene rich) into the interior of the nucleoplasm, whereas theirG-bands (gene poor) are gathered against the periphery ofthe nucleus and against the nucleolar surface [3]. Euchroma-tin sequences are further organized such that they maintain aspatial relationship with the predominant nucleoplasmicnonchromatin structure, the splicing factor compartments[4]. Smaller nonchromatin structures, such as promyelocyticleukemia (PML) and Cajal bodies, associate with specificregions of the genome [5–7]. Beyond these rather general
descriptors, our understanding of spatio–temporal regulation
of the genome is limited. Most important, the most obvious
prediction that arises from the molecular characterization of
the RNA polymerase II (RNA PolII) transcriptional machi-
Editor: Ronald Berezney, State University of New York at Buffalo, United States ofAmerica
Received January 26, 2006; Accepted September 8, 2006; Published October 20,2006
A previous version of this article appeared as an Early Online Release on September8, 2006 (DOI: 10.1371/journal.pcbi.0020139.eor).
DOI: 10.1371/journal.pcbi.0020139
Copyright: � 2006 McManus et al. This is an open-access article distributed underthe terms of the Creative Commons Attribution License, which permits unrestricteduse, distribution, and reproduction in any medium, provided the original authorand source are credited.
Abbreviations: ARNA3, active RNA PolII; CBP, CREB–binding protein; EDF,empirical distribution function; FU, 5-fluro-uridine; HDAC, histone deacetylase;HAT, histone acetyltransferase; ICD, inter-centroid distance; Lys, lysine; NCBP, non-CBP; NN, nearest-neighbor; PML, promyelocytic leukemia; RNA PolII, RNApolymerase II
* To whom correspondence should be addressed. E-mail: [email protected] (PSF); [email protected] (MJH)
¤ Current address: Michael Smith Laboratories, University of British Columbia,Vancouver, British Columbia, Canada
PLoS Computational Biology | www.ploscompbiol.org October 2006 | Volume 2 | Issue 10 | e1391271

nery, that genes represent the principal nuclear binding sitefor these proteins, has not been commonly observed despiteobvious attention to the question [8,9].
Careful studies have been performed with 3-D deconvolu-tion microscopy or laser scanning confocal microscopy toexamine the spatial relationships between RNA PolII, sites ofRNA PolII transcription, sequence-specific DNA bindingproteins, and chromatin modifying machinery [8–11]. Forexample, Grande et al. [9] examined the distribution of theglucocorticoid receptor, Oct1, and E2F-1 relative to RNAPolII and found little or no relationship. Similarly, Hendzel etal. [12] examined the relationship between transcriptionfactors involved in chromatin modification and modifiedchromatin. They concluded that chromatin was not definingthe subnuclear localization of these proteins. Coimmunopre-cipitation also does not dictate that molecules colocalize. Forexample, a study of hnRNPs demonstrated to coimmunopre-cipitate also failed to find that these proteins colocalize [13].These proteins are consistently observed to enrich in smallbut abundant foci that are distinct from the larger, less-abundant foci that are commonly observed when tran-scription factors are transiently overexpressed. The latteroften do show colocalization of nuclear proteins that caninteract [14,15]. The failure of the native small nuclear foci tocolocalize has led us to propose that these may be structuresthat are independent of chromatin, perhaps involved in theassembly of macromolecular complexes rather than reflectingsites where they function [14]. Consistent with this hypothesis,foci enriched in the transcription factors Sp1 and Sp3 haverecently been shown to persist through mitosis, where theyare found in the cytoplasm and associate with F-actin ratherthan chromatin [16].
By performing a comprehensive localization analysis forthe transcriptional regulator CREB–binding protein (CBP),we have revealed that, while there may be rules for the spatialorganization of these foci, they are not easily linked tofunction by colocalizing to sites of known activities. Analternative relationship that appears to be related to functionhas been defined for nuclear structures involved in the
expression of protein-coding genes. Structures may showclear spatial relationships that are complimentary, ratherthan coincident. The best characterized of these relationshipsinclude the proximity of the major histocompatibilitycomplex gene cluster to PML bodies [5] and the associationof transcribed genes to splicing factor compartments [4].If we accept the alternative possibility for intranuclear sites
enriched in proteins involved in transcriptional regulation ofRNA PolII–transcribed genes [14], spatial relationships ratherthan spatial colocalization may be an important factor interms of function. This possibility has been introducedpreviously when it was determined that nuclear bodies thatare related in function are often in close spatial proximitywithin the nucleoplasm [17]. When examined by 3-Ddeconvolution microscopy, protein-rich intranuclear sitesinvolved in RNA PolII transcription typically approach theresolution limits of the microscope (;200 nm diameter).Because of their small size, we cannot be sure whether theyrepresent single unified structures or a number of smallersites packed close together. We can, however, make estima-tions about the number of macromolecules present withinthe structure and thus stochiometric relationships in coloc-alization studies. In addition, we know with certainty thatthese foci do not contain one or two copies of the proteinunder study, but comprise hundreds to thousands ofindividual macromolecules [18]. In this context, the failureto observe coenrichment of chromatin proteins or DNA inthese foci may reflect separate functions for these structures.We have previously proposed that such intranuclear foci areinvolved in processes such as the assembly of multiproteincomplexes that can then be released into the surroundingnucleoplasm where they can act directly on their chromatintarget [14,19].In this study, we have extended our earlier studies to
determine whether CBP-enriched nuclear foci have distinctnonrandom spatial associations within the interphase nu-cleus. CBP is a well-defined and important regulator of genetranscription and chromatin structure and has measurablehistone acetyltransferase (HAT) activity in vivo, with a strongpreference for specific lysines (Lys) on histones H3 and H4[18]. Furthermore, CBP is a well-established transcriptionalcoactivator for a large number of DNA binding proteins andis able to associate with an ever-expanding list of nonhistonenuclear proteins. This leads to the attractive hypothesis thatCBP may function as a molecular scaffold that associatesdirectly or indirectly with a variety of proteins simultane-ously, including components of the transcriptional machi-nery and specific histone susbstrates [19]. To test thishypothesis, we have developed a distance-based statisticalmethod that can analyse relationships between intranuclearfoci in terms of interpoint distances (e.g., [20]). This approachis particularly appropriate since no other useful localizinginformation is readily available, the measurements relate toreal distances, and the coordinate system used to calculatedistances is essentially arbitrary, thereby allowing meaningfulcomparisons between individual cells and different batches ofcells. Furthermore, there are a number of available methodsfor summarizing information from the collection of observeddistances, including nearest-neighbor (NN) distances andmean distance to all points; for example, Noordmans et al.analyze voxel-by-voxel data across the entire 3-D image togain understanding of the spatial heterogeneity in signal [21].
PLoS Computational Biology | www.ploscompbiol.org October 2006 | Volume 2 | Issue 10 | e1391272
Synopsis
The cell nucleus is the part of the cell that houses the genome andthe associated machinery that are responsible for its duplication,maintenance, and expression. It has become apparent that theindividual chromosomes that comprise the genome and themachinery that act on the genome and its RNA products areorganized within the nuclear volume. The nature of this organizationhas been difficult to define because simple mapping has shown thatit is not defined by predefined 3-D locations for each component. Inthis study, McManus and colleagues have developed a statisticaltool to facilitate the characterization of spatial relationships, theirrelationship between organization and function, and the identifica-tion of rules defining these relationships. With the specific exampleof the CREB–binding protein, the authors have used this newstatistical tool to determine how the organization of the CREB–binding protein relates to the varying protein–protein complexes,catalytic activity, and functions of the protein. Their resultsdemonstrate that this statistical approach can identify spatialrelationships that cannot be defined by the more simple techniquesemployed to date and can open the door for determining the rulesof nuclear organization.
Characterizing Nuclear Architecture

In contrast, our statistical approach focuses only on the pointpattern corresponding to the identified objects in the image.Using this approach, we find that CBP has a hierarchy ofnonrandom spatial relationships with a subset of nuclearcompartments, including RNA PolII transcription compo-nents and chromatin. We also find that CBP has a significantlyhigher probability of being spatially associated with its knownin vivo substrate, histone H4 Lys 5, compared with the closelyrelated H4 Lys 12. Our results have broader implications inthe context of understanding nuclear organisation, where theunderlying spatial mechanisms are unknown.
Results
Characterization of CBP Distribution Relative to BulkChromatin
To define the properties of nuclear foci enriched in RNAPolII transcription factors, we determined whether or notCBP foci colocalized with reference structures of differingfunction. Our analysis focused on determining whether ornot CBP foci colocalized with euchromatin, sites of dynamicacetylation, sites of RNA PolII transcription, and hetero-chromatin within the nucleoplasm. Figure 1 shows therelationship between CBP and the distribution of genomicDNA. The deconvolved images on the left show the relation-ship between the DNA distribution (red in composite images)and CBP (green in composites) in mouse 10T1/2 embryonicfibroblast cells, while those on the right depict the relation-ship between DNA distribution and CBP distribution inIndian muntjac fibroblast cells. The colour panels showprojected 3-D images. Unlike the DNA distribution, CBP isfound to concentrate in several hundred small foci. We havepreviously shown that enhanced green fluorescent protein–tagged CBP also enriches in small nuclear foci [18,19]. Hence,this distribution is not a consequence of fixation but reflectsthe endogenous distribution of CBP. When line scans areused to compare the concentration of DNA with theconcentration of CBP, CBP is predominantly found inchromatin-depleted regions.
Characterization of CBP Distribution Relative to Sites ofHistone Modifications that Demarcate Euchromatin
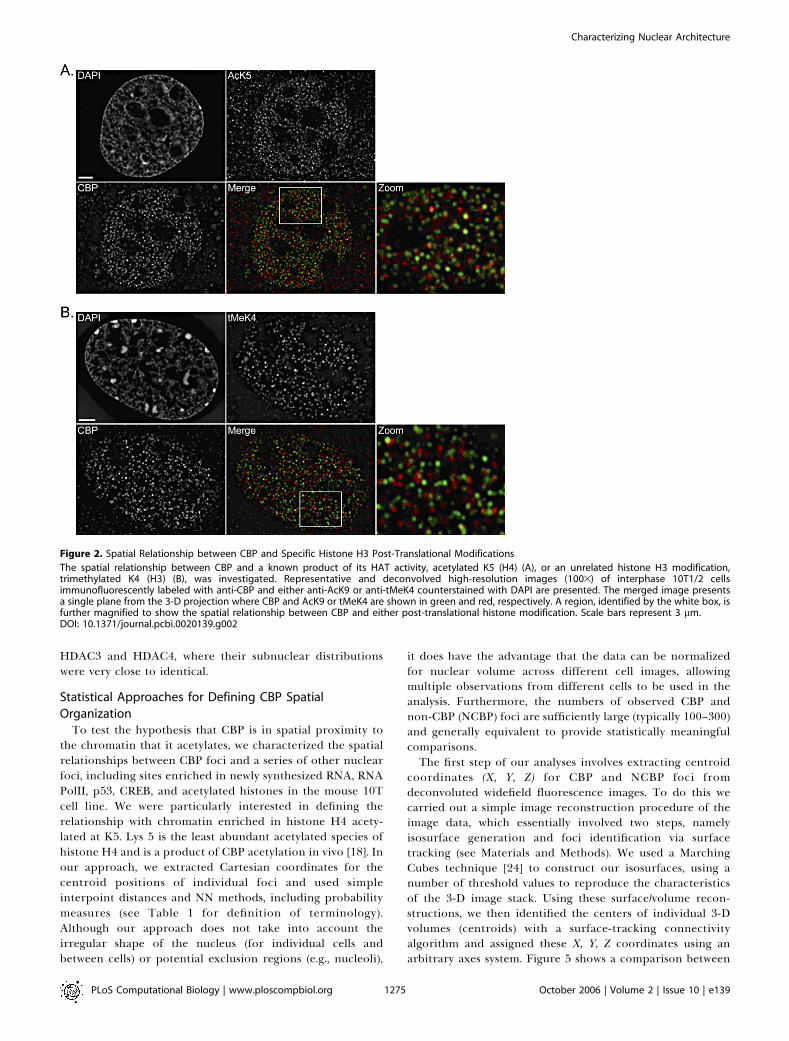
We have previously observed that histone modifications,such as highly acetylated histone H3, are also found in smallnuclear foci that enrich in chromatin-depleted regions of thenucleus. Therefore, one potential explanation for thisdistribution is that it reflects the distribution of transcrip-tionally active or potentiated regions of the genome (i.e.,euchromatic). We have also shown that cells expressing CBPpreferentially show increases in Lys 5 acetylation of histoneH4 [18]. Hence, our results implicated CBP as a histone H4 K5acetyltransferase. Because this modification has a high turn-over rate, continuous HAT activity is required to maintain K5acetylation in these regions of the genome. Consequently, weexpected that CBP would show a high degree of colocalizationwith acetylated K5 in these regions. To address this, weperformed colocalization experiments to determine whetherCBP was associated with regions that were enriched in eitheracetylated histone species or an unrelated control, trimethy-lated Lys 4 (tMeK4) of histone H3. Both histone modificationshave been reported to be associated with transcriptionallyactive/competent regions of the genome. Figure 2A depicts
deconvolved images obtained from these experiments. Asexpected, both antibodies show preferential staining ofnuclei, and, as with CBP, are enriched in several hundredsmall nuclear foci. Surprisingly, when CBP images (green incomposites) are compared with either acetylated K5 ofhistone H4 (red in composites), there are very few exampleswhere these foci colocalize—very few foci show the presenceof both red and green signals (yellow in composite). Rather,most labeled regions of the nucleoplasm contain either red orgreen foci, but not both. This is particularly evident in theimages/regions presented at higher magnification.Although we expected CBP to colocalize with K5, it is
possible that K5 sites are already fully acetylated at the timeof fixation, which would negate any CBP clocalization at thesesites. Nonetheless, we expected that CBP would be associatedwith transcriptionally active/competent regions of the ge-nome, thereby providing the basis for its focal distribution.To further address this possibility, we compared thedistribution of CBP with tMeK4 of histone H3. Thismodification has consistently been found enriched in tran-scriptionally active regions of the genome [22,23]. Figure 2Bcompares the distribution of CBP (green in composites) withtMeK4 (red in composites). As expected, both epitopes areconcentrated in small nuclear foci. When the distribution ofCBP was compared with this modified histone species,however, the results once again revealed very little evidenceof colocalization. Instead, these proteins appeared to beenriched in foci that were distinct from each other. Figure S1shows an example of colocalizing proteins and verifies thatthe failure to observe colocalization is not due to opticalmisalignment.
CBP Distribution Relative to Sites of TranscriptionWhile the colocalization experiments with modified his-
tone species indicated that CBP localization into smallnuclear foci was not determined by euchromatin organiza-tion, it may be that the association of CBP with chromatinmasks the histone epitopes that we used as markers fortranscriptionally active chromatin. Therefore, we again testedwhether or not CBP was predominantly associated withtranscriptionally active regions of the genome. In thisinstance, however, we used antibodies recognizing a halo-genated nucleotide incorporated into nascently synthesizedRNA (Figure 3A) using a brief pulse labeling with fluorour-idine or an antibody recognizing RNA PolII (Figure 3B).While we observed examples of colocalization at the level ofresolution of the fluorescence microscope (see arrows inFigures 3A and 3B), once again the majority of the CBP foci(red in composite images) existed in regions that wereindependent of the presence of newly synthesized RNA(green in Figure 3A composite) or RNA PolII (green in Figure3B composite).
CBP Distribution Relative to CBP-Associated ProteinsWhile the results above are not consistent with a
euchromatin- or transcription-dependent basis to the organ-ization of CBP foci, proteins have been demonstrated tocolocalize within these foci. For example, we have previouslydemonstrated that histone deacetylase-3 (HDAC3) andHDAC4 colocalize at the level of individual foci [15]. It ispossible, therefore, that rather than reflect nuclear siteswhere these proteins carry out their activities, these nuclear
PLoS Computational Biology | www.ploscompbiol.org October 2006 | Volume 2 | Issue 10 | e1391273
Characterizing Nuclear Architecture

foci may be involved in the assembly of multimolecularcomplexes that are then available to function in the localenvironment. To address this, we examined the distributionof CBP relative to proteins that CBP has been previously
shown to directly interact with through coimmunoprecipita-tion experiments. Figure 4 shows examples. Once again,although there were instances of colocalization, these resultsdiffered significantly from our previous experiments with
Figure 1. Spatial Relationship between Endogenous CBP and DNA
Shown here are representative high-resolution (1003) deconvolved images of an interphase 10T1/2 cell (A) and an IM cell (B) immunofluorescentlylabeled with anti-CBP and counterstained with DAPI. A combined image of the single planes is presented as the ‘‘Merge,’’ with the CBP and DNA shownin green and red, respectively. A 3-D projection of the entire nucleus is presented (Proj). The linescan (bottom row) demonstrates that endogenous CBPpreferentially localizes within euchromatin (less intense DAPI signal) or in regions immediately adjacent to intensely staining heterochromatic regions(intense DAPI signal). Scale bars represent 3 lm.DOI: 10.1371/journal.pcbi.0020139.g001
PLoS Computational Biology | www.ploscompbiol.org October 2006 | Volume 2 | Issue 10 | e1391274
Characterizing Nuclear Architecture
HDAC3 and HDAC4, where their subnuclear distributionswere very close to identical.
Statistical Approaches for Defining CBP Spatial
OrganizationTo test the hypothesis that CBP is in spatial proximity to
the chromatin that it acetylates, we characterized the spatialrelationships between CBP foci and a series of other nuclearfoci, including sites enriched in newly synthesized RNA, RNAPolII, p53, CREB, and acetylated histones in the mouse 10Tcell line. We were particularly interested in defining therelationship with chromatin enriched in histone H4 acety-lated at K5. Lys 5 is the least abundant acetylated species ofhistone H4 and is a product of CBP acetylation in vivo [18]. Inour approach, we extracted Cartesian coordinates for thecentroid positions of individual foci and used simpleinterpoint distances and NN methods, including probabilitymeasures (see Table 1 for definition of terminology).Although our approach does not take into account theirregular shape of the nucleus (for individual cells andbetween cells) or potential exclusion regions (e.g., nucleoli),
it does have the advantage that the data can be normalizedfor nuclear volume across different cell images, allowingmultiple observations from different cells to be used in theanalysis. Furthermore, the numbers of observed CBP andnon-CBP (NCBP) foci are sufficiently large (typically 100–300)and generally equivalent to provide statistically meaningfulcomparisons.The first step of our analyses involves extracting centroid
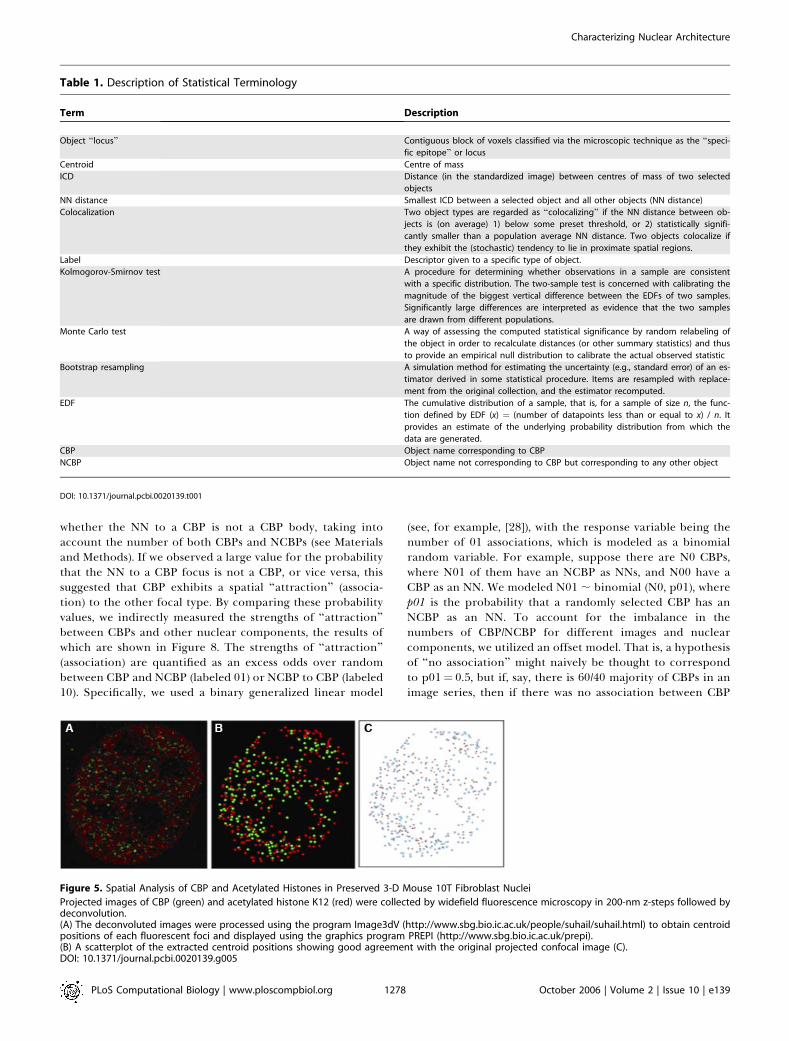
coordinates (X, Y, Z) for CBP and NCBP foci fromdeconvoluted widefield fluorescence images. To do this wecarried out a simple image reconstruction procedure of theimage data, which essentially involved two steps, namelyisosurface generation and foci identification via surfacetracking (see Materials and Methods). We used a MarchingCubes technique [24] to construct our isosurfaces, using anumber of threshold values to reproduce the characteristicsof the 3-D image stack. Using these surface/volume recon-structions, we then identified the centers of individual 3-Dvolumes (centroids) with a surface-tracking connectivityalgorithm and assigned these X, Y, Z coordinates using anarbitrary axes system. Figure 5 shows a comparison between
Figure 2. Spatial Relationship between CBP and Specific Histone H3 Post-Translational Modifications
The spatial relationship between CBP and a known product of its HAT activity, acetylated K5 (H4) (A), or an unrelated histone H3 modification,trimethylated K4 (H3) (B), was investigated. Representative and deconvolved high-resolution images (1003) of interphase 10T1/2 cellsimmunofluorescently labeled with anti-CBP and either anti-AcK9 or anti-tMeK4 counterstained with DAPI are presented. The merged image presentsa single plane from the 3-D projection where CBP and AcK9 or tMeK4 are shown in green and red, respectively. A region, identified by the white box, isfurther magnified to show the spatial relationship between CBP and either post-translational histone modification. Scale bars represent 3 lm.DOI: 10.1371/journal.pcbi.0020139.g002
PLoS Computational Biology | www.ploscompbiol.org October 2006 | Volume 2 | Issue 10 | e1391275
Characterizing Nuclear Architecture

an original image (stacked projection) and the extracted 3-D–centroid points in projection showing good agreement withthe original image and validating our reconstruction proce-dure. Each individual point represents the centroid point ofthe volume attributed to individual CBP-enriched foci andacetylated histone K12–enriched foci shown as a scatterplot(Figure 5). Other approaches for confocal image reconstruc-tion and spot detection have also been reported [21]. Thenext stage of our approach was to compute NN distancesbetween CBP and NCBP foci. We then carried out pairwisecomparisons of these NN distance distributions. Our analysisuses the two-sample Kolmogorov-Smirnov test for point-wiseequality of distribution functions (for example, see [25]). Thistest is preferable to the simpler Mann-Whitney two-sampletest for equality of medians, as it is more powerful fordetecting small differences underlying distributions, althoughthe Mann-Whitney test is a feasible alternative. To accountfor nuclei sizes, all distance measurements are on a stand-ardized scale relative to the maximum interobject distancewithin a nucleus.
Examples of these pairwise comparisons are given in Figure6 and Figure S1. To assess the validity of our approach indealing with multiple observations from different cells, we
compared CBP–CBP distances from different batches of 10Tfibroblasts and found no significant difference between thesedistributions, which supports the validity of our approach(unpublished data). Figure 6A graphically presents the NNdistance distributions for acetylated K5 of histone H4 withacetylated K12 of histone H4. Both distributions areremarkably similar with no significant differences observed,suggesting that CBP is as close to sites enriched in bothacetylated lysines. In contrast, a comparison between the NNdistance-based distributions of 5-fluro-uridine (FU), identify-ing nascent mRNA transcripts and active RNA PolII (ARNA3)shows significant differences (Figure 6C). CBP is on averagecloser to sites enriched in active RNA PolII than sitesenriched in nascent transcripts. However, for all the FUpairwise comparisons we did note a small sample of closeassociation to CBP (Figure 6D), which could reflect sites ofactive transcription.From our NN distance distributions, we could compute
median distances as a way of comparing associations of sitesenriched in CBP with sites enriched in other NCBPcomponents (Figure 7). These distances can be interpretedas estimated median NN distances with defined uncertaintyintervals for each comparison; here the 95% confidence
Figure 3. Spatial Relationship between CBP and Transcription
The spatial relationship between CBP and transcription, as identified by FU incorporation in nascent RNA transcripts (A) or immunofluorescent labelingof RNA PolII (8WG16) (B), was investigated. Representative and deconvolved high-resolution images (1003) of interphase 10T1/2 cellsimmunofluorescently labeled with anti-CBP and either anti-FU or anti-8WG16 counterstained with DAPI are presented. The merged image presentsa single plane from the 3-D projection where CBP and FU or 8WG16 are shown in green and red, respectively. A region, identified by the white box, isfurther magnified to show the spatial relationship between CBP and either post-translational histone modification. Scale bars represent 3 lm.DOI: 10.1371/journal.pcbi.0020139.g003
PLoS Computational Biology | www.ploscompbiol.org October 2006 | Volume 2 | Issue 10 | e1391276
Characterizing Nuclear Architecture

intervals for the median distance were estimated usingbootstrap resampling. This general type of procedure hasbeen much used in many fields of application, includingbiology (for example, see [26]), and involves random relabel-ing of objects, and recalculation of the test statistic, for alarge number of bootstrap resamples, in order to gain anunderstanding of the variability of the statistic. For example,if an image contains N ¼ N0 þ N1 objects, with N0 labeled 0(CBP) and N1 labeled 1 (nuclear component), we maycompute a summary statistic T that is informative about thepositive or negative spatial association between object types.We used the median interobject distance between the nuclearcomponent and CBP computed over all images in theexperiment. Suppose that, for the original data, the summarystatistic is observed to be T¼ t*. To obtain a standard error oruncertainty interval for the statistic, we formed a pseudo-dataset by resampling with replacement N0 objects from thelist of objects labeled 0, and then inspected the NN distancesfor this new set of pseudodata to form a new pseudo–summary statistic, t1. We then repeated this exercise B timesto form a sample of pseudostatistics t1,. . ., tB, and reported thestandard error (or 95% central range) derived from thissample as the estimated uncertainty measure for the
summary statistic concerned. A similar method, in a similarapplication, was used by Knowles et al. [27]; see also thediscussion below.The results in Figure 7 are shown as boxplots with median
NN distance to CBP for different nuclear components shownin ascending order. The scale of these are relative to themaximal possible distance measured across all images and donot reflect actual distances; this standardization is necessaryas the images were produced at different magnifications.Interestingly, we observe three apparent groupings with onegroup of ‘‘closer’’ CBP associations comprising active/inactivePolII and SC35 pre-mRNA splicing sites. A middle groupingcomprises known and putative CBP binding proteins,including CREB and phosphorylated p53 (Ser9 and Ser20).Surprisingly, the final group which shows higher median NNdistances and therefore less ‘‘close’’ associations, comprisesthe acetylated histones H4 (Lys 5, Lys 12, and Lys 14) and sitesof nascent mRNA transcripts.
Comparison of Different CBP–NCBP Spatial DistributionsTo compare quantitatively between different CBP and
NCBP associations as well as between different cells and celllines, we used a simple probability model to determine
Figure 4. Spatial Relationship between CBP and Regulators of Transcription
The spatial relationship between CBP and CREB/CREM (A) and phosphorylated serine 9 of p53 (B) was investigated. Representative and deconvolvedhigh-resolution images (1003) of interphase 10T1/2 cells immunofluorescently labeled with anti-CBP and either anti-CREB/CREM or anti-p53(phosS9)counterstained with DAPI are presented. The merged image presents a single plane from the 3-D projection where CBP and CREB/CREM or p53(phosS9)are shown in green and red, respectively. A region, identified by the white box, is further magnified to show the spatial relationship between CBP andeither post-translational histone modification. Scale bars represent 3 lm.DOI: 10.1371/journal.pcbi.0020139.g004
PLoS Computational Biology | www.ploscompbiol.org October 2006 | Volume 2 | Issue 10 | e1391277
Characterizing Nuclear Architecture
whether the NN to a CBP is not a CBP body, taking intoaccount the number of both CBPs and NCBPs (see Materialsand Methods). If we observed a large value for the probabilitythat the NN to a CBP focus is not a CBP, or vice versa, thissuggested that CBP exhibits a spatial ‘‘attraction’’ (associa-tion) to the other focal type. By comparing these probabilityvalues, we indirectly measured the strengths of ‘‘attraction’’between CBPs and other nuclear components, the results ofwhich are shown in Figure 8. The strengths of ‘‘attraction’’(association) are quantified as an excess odds over randombetween CBP and NCBP (labeled 01) or NCBP to CBP (labeled10). Specifically, we used a binary generalized linear model
(see, for example, [28]), with the response variable being thenumber of 01 associations, which is modeled as a binomialrandom variable. For example, suppose there are N0 CBPs,where N01 of them have an NCBP as NNs, and N00 have aCBP as an NN. We modeled N01 ; binomial (N0, p01), wherep01 is the probability that a randomly selected CBP has anNCBP as an NN. To account for the imbalance in thenumbers of CBP/NCBP for different images and nuclearcomponents, we utilized an offset model. That is, a hypothesisof ‘‘no association’’ might naively be thought to correspondto p01¼ 0.5, but if, say, there is 60/40 majority of CBPs in animage series, then if there was no association between CBP
Table 1. Description of Statistical Terminology
Term Description
Object ‘‘locus’’ Contiguous block of voxels classified via the microscopic technique as the ‘‘speci-
fic epitope’’ or locus
Centroid Centre of mass
ICD Distance (in the standardized image) between centres of mass of two selected
objects
NN distance Smallest ICD between a selected object and all other objects (NN distance)
Colocalization Two object types are regarded as ‘‘colocalizing’’ if the NN distance between ob-
jects is (on average) 1) below some preset threshold, or 2) statistically signifi-
cantly smaller than a population average NN distance. Two objects colocalize if
they exhibit the (stochastic) tendency to lie in proximate spatial regions.
Label Descriptor given to a specific type of object.
Kolmogorov-Smirnov test A procedure for determining whether observations in a sample are consistent
with a specific distribution. The two-sample test is concerned with calibrating the
magnitude of the biggest vertical difference between the EDFs of two samples.
Significantly large differences are interpreted as evidence that the two samples
are drawn from different populations.
Monte Carlo test A way of assessing the computed statistical significance by random relabeling of
the object in order to recalculate distances (or other summary statistics) and thus
to provide an empirical null distribution to calibrate the actual observed statistic
Bootstrap resampling A simulation method for estimating the uncertainty (e.g., standard error) of an es-
timator derived in some statistical procedure. Items are resampled with replace-
ment from the original collection, and the estimator recomputed.
EDF The cumulative distribution of a sample, that is, for a sample of size n, the func-
tion defined by EDF (x) ¼ (number of datapoints less than or equal to x) / n. It
provides an estimate of the underlying probability distribution from which the
data are generated.
CBP Object name corresponding to CBP
NCBP Object name not corresponding to CBP but corresponding to any other object
DOI: 10.1371/journal.pcbi.0020139.t001
Figure 5. Spatial Analysis of CBP and Acetylated Histones in Preserved 3-D Mouse 10T Fibroblast Nuclei
Projected images of CBP (green) and acetylated histone K12 (red) were collected by widefield fluorescence microscopy in 200-nm z-steps followed bydeconvolution.(A) The deconvoluted images were processed using the program Image3dV (http://www.sbg.bio.ic.ac.uk/people/suhail/suhail.html) to obtain centroidpositions of each fluorescent foci and displayed using the graphics program PREPI (http://www.sbg.bio.ic.ac.uk/prepi).(B) A scatterplot of the extracted centroid positions showing good agreement with the original projected confocal image (C).DOI: 10.1371/journal.pcbi.0020139.g005
PLoS Computational Biology | www.ploscompbiol.org October 2006 | Volume 2 | Issue 10 | e1391278
Characterizing Nuclear Architecture

and NCBP, we would obtain an estimate of p01 near to 40/100¼ 0.4, and might infer a negative association which is notsupported in reality. The offset model uses the followingformula for p01:
ln ðp01 = ð1 � p01ÞÞ ¼ a offset ð1Þ
where offset ¼ ln (N01/N00). An estimate of a reveals thenature of the association; a. implies positive association, anda, implies negative association.
In the plots, the zero point of the vertical axis correspondsto a random spatial association. Values above this pointindicate an association stronger than expected by chance,and is therefore indicative of association. The figure alsoincludes 95% confidence intervals for each probability.Interestingly, all NCBP foci show differing strengths of CBPassociation above random apart from acetylated K12 ofhistone H4 and to some extent, FU. In contrast, the highestprobability for CBP association is exhibited by acetylated K5of histone H4. This is of particular significance given that theboxplots of median distances between K5 and K12 are similar(Figure 7), as are their NN distance distributions (Figure 6A).
Discussion
In previous studies, we have demonstrated a strongcorrelation between CBP expression and the amount ofhistone H4 acetylated at Lys 5 [18]. Lys 5 is the last acetylationsite used on histone H4 and, consequently, is the leastabundant of histone H4 acetylations found primarily in the
tetra-acetylated form of H4 [29–31]. The linear relationshipbetween CBP expression and the amount of nuclearacetylated Lys 5 [18] and the rapid turnover of this acetylatedspecies of histone H4 [32] prompted us to examine whetherCBP was specifically enriched in the same regions ofchromatin that are acetylated at Lys 5. Surprisingly, wefound that this was not the case. Rather, foci enriched in CBPappear to exist independently of the chromatin that itacetylates, which is consistent with the hypothesis that HATsexist in structures that are independent of their chromatinbinding sites [14,33,34], perhaps as a mechanism to facilitatethe assembly of chromatin-modifying complexes. However, itis worth noting that there is no consensus for the functionalsignificance of CBP or other nuclear foci, which are oftenfound as aggregates associated with an insoluble nuclearfraction. It has been argued that such aggregates may act asstorage domains or sites for complex macromolecularassembly or even modifications (reviewed in [30]). Further-more, it has been shown that the majority of componentsinvolved in gene expression are dynamic, with potentiallyonly a small fraction of the total pool of factors active at anyone time (reviewed in [31]). Despite these caveats, little isknown about the overall spatial relationships of nuclear fociand, in particular, CBP foci. We wanted to test the hypothesisthat CBP foci occur preferentially near sites of CBP activityand find out whether there existed a hierarchy of spatialrelationships between CBP foci and other nuclear fociinvolved in transcription and histone modification.
Figure 6. Distribution Plots of NN Distances for NCBP Foci to CBP
EDF and density plots are shown for pairwise comparison of NN distances (see text and Table 2 for details). The density plot represents densityestimates of the NN distance distribution (NCBP to CBP) for nuclear components taken pairwise. KS is the p-value in the Kolmogorov-Smirnov test, whileMW refers to the Mann-Whitney statistic.(A) EDF plot comparing acetylated Lys5 (K5) and Lys12 (K12) of histone H4. No statistical difference is observed, suggesting that CBP is as close to bothK5 and K12 foci.(B) Density distribution plot for the same pairwise comparisons showing a similar trend as in (A).(C) EDF plot comparing NN distances for CBP to FU and ARNA3. The FU foci distribution is significantly different from the ARNA3 foci, suggesting thatCBP is closer to PolII than to nascent mRNA transcripts. Note the shape of the FU distribution at smaller CBP NN distances, indicating that asubpopulation of FU foci lie close to CBP foci.(D) Density distribution plot for the same comparison. Note the bimodal distribution for FU, indicating a population of FU foci that lie closer to CBP thanactive PolII and could represent sites of active transcription.DOI: 10.1371/journal.pcbi.0020139.g006
PLoS Computational Biology | www.ploscompbiol.org October 2006 | Volume 2 | Issue 10 | e1391279
Characterizing Nuclear Architecture

To examine this, we analysed the spatial associations of focienriched in CBP within the mouse 10T cell line withcomponents of the transcriptional machinery as well as sitesof specific chromatin modification. Using a new statisticalapproach, we find that CBP has a hierarchy of nonrandomspatial relationships with a subset of nuclear compartmentsmaintaining a nonrandom spatial proximity to the chromatinthat it preferentially acetylates in vivo. Of particular interestis the comparison of CBP proximity to foci enriched inacetylated H4 Lys 12 with acetylated H4 Lys 5. In terms of NNdistance measurements, CBP appears equally close to bothsites. However, what is surprising is that when a probabilitymeasure is made on the likelihood of being proximal to eithersite, a striking difference is observed. We find that CBP has asignificantly greater chance of being close to acetylated H4Lys 5 than Lys 12, despite acetylated Lys 12 being moreabundant within the genome. We also examined the spatialrelationships with a number of additional proteins, includingRNA PolII species, sites of RNA transcription, phosphory-lated species of p53, and CREB. Each of these nuclear targetsare expected to colocalize with CBP if the foci enriched inCBP merely reflect sites of chromatin association rather thannuclear structures that are independent of sites of actionwithin chromatin. Interestingly, with the exception of K12acetylation, all of the studied examples of nuclear proteinsexhibit spatial relationships that are higher than expectedfrom randomly arranged structures. In addition, there arevarying degrees of ‘‘affinity’’ between the NCBP foci and the
CBP-enriched foci. From these measurements, there doesappear to be a hierarchy of association for CBP foci, which isreflecting an underlying functional organisation. However,these data also suggest for the first time that spatialcolocalization within the nucleus may not be a completemeasure of functional interdependence, and that a measureof likelihood of association may be more revealing. This isperhaps not surprising given the crowded nature of theinterchromosomal space, but it does underlie the need formore quantitative estimates in determining functionalassociations. Although current methods cannot distinguishbetween functional relationships that drive spatial arrange-ments versus underlying organisation leading to specificfunctional outcomes, this study does provide a first attempt atdefining observed spatial arrangements within interphasenuclei. It also provides a foundation for the further study ofother well-defined nonchromatin nuclear foci (e.g., PMLbodies) and compartments (e.g., chromosomes and nucleoli).Furthermore, our NN distance approach will significantlyextend the possibilities of analysing spatial associations onsmaller scales that result from improvements in opticalimaging techniques.Developing quantitative methods to understand spatial
relationships within interphase nuclei has become animportant area of study given that strict colocalizationanalysis, when applied using the highest resolutions obtain-able with fluorescence microscopy, often fail to providemeaningful information. Rather, a number of studies haveindicated that spatial proximity rather than spatial colocal-ization may be important in regulating genome function. Forexample, highly acetylated chromatin [12], some transcrip-
Figure 7. Boxplot of Median NN Distances for Different Nuclear
Components to CBP Foci
The vertical axis represents relative distances to the maximal possibledistance in microns, with the median distances for each focushighlighted. The box represents the interquartile range of thesedistances. The ‘‘whiskers’’ indicate the 5% and 95% quantiles, anddistances observed outside this range are indicated with circles. Thenuclear foci analysed for NN distances to CBP are: 8WG16, RNA PolII(hypophosphorylated); ARNA3, PolII (hyperphosphorylated); SC35, pre-mRNA splicing speckles; AIM1, Aurora B kinase; CREB, Creb/Cremtranscriptional activator; S9, p53 phosphorylated Ser9; S20, p53phosphorylated Ser20; K14, acetylated Lys14 histone H4; K12, acetylatedLys12 histone H4; K5, acetylated Lys5 histone H4; FU, fluoro-uridine.DOI: 10.1371/journal.pcbi.0020139.g007
Figure 8. Plot of ‘‘Attraction’’ or Association of Different Nuclear
Components with CBP Foci
The vertical axis represents the log of the excess odds ratio overrandomness, with a value of zero equivalent to random association. Thedifferent nuclear body components are labeled as in Figure 3. NCBP‘‘association’’ to CBP is labeled 01, with CBP ‘‘association’’ to NCBPlabeled 10. The bars represent a 95% confidence interval for the meanassociation (see text for further details). Note the significant difference in‘‘probability of association’’ between K5 and K12.DOI: 10.1371/journal.pcbi.0020139.g008
PLoS Computational Biology | www.ploscompbiol.org October 2006 | Volume 2 | Issue 10 | e1391280
Characterizing Nuclear Architecture

tionally active genes [35–37], and the gene-rich R-bandregions of interphase chromosomes [4] have been reportedto be juxtaposed to splicing factor compartments. Similarly,the major histocompatibility complex gene locus maintains aspatial relationship with PML bodies [5], as do active regionsof the genome in general [38]. Other patterns of nuclearorganisation include preferences for chromosomes to occupyspecific regions of the nucleus based on both chromosomesize and the transcriptional capacity of the chromatin [1,39–42]. In these studies, radial positioning has been established asa reliable method to demonstrate nonrandom distributionpatterns. More recently, relative positioning and chromo-some cluster analysis have been used to demonstrate tissuespecificity in these patterns [42], and modelling of chromo-some territory arrangement has suggested that cell type–specific differences are not due solely to nuclear shapedifferences [39]. Radial positioning has also been applied tonuclear compartments with more complex distributionpatterns (e.g., centromeres [43]). However, the ability tocompare distribution patterns for two or more compart-ments simultaneously requires more sophisticated ap-proaches and tools. Such tools are currently not available,and most researchers tend to rely on either pixel overlap offluorescent intensities [8,12,44,45] or on cross-correlationanalysis [9,13,46,47]. Where spatial proximity has beenevaluated, current methods are only able to distinguishrandom from nonrandom relationships, without being ableto quantify and compare multiple spatial relationships [9,48].In this study we have developed an alternative approach forstudying nuclear organisation based on NN distance measure-ments and probability estimates. Our approach is signifi-cantly different from previous studies in that it is object-based, whereas most other studies rely on comparing dual-labeled 3-D images in terms of intensity distributions, withcross-correlation as a measure of overlap compared withrandom. The advantages of an object-based approach is thatit allows some direct spatial measure of specific associationsand allows probability estimates of associations betweendifferent components given the difficulty in delineating suchassociation in a confined nuclear volume.
In summary, we have studied the spatial associations of theCBP transcriptional regulator within interphase nuclei and
have developed statistical approaches for characterizingspatial relationships in terms of distances and probability ofassociation. The clear spatial association of CBP-enrichedfoci to regions of chromatin that are selectively acetylated byCBP in vivo is consistent with CBP-enriched foci playing arole in targeting the enzyme to specific chromatin substratesites. To our knowledge, these data provide the first statisticaldemonstration that spatial proximity rather than spatialoverlap defines a functional relationship between an enzymeand chromatin substrate.
Materials and Methods
Cell culture. IM (male Indian Muntjac Skin Fibroblast) and 10T1/2(C3H mouse embryo fibroblast) cells were cultured in Ham’s F10medium plus 20% fetal bovine serum (FBS) and a-MEM plus 10%FBS, respectively, in a 37 8C incubator with 5% CO2. Cells were platedonto sterilized glass coverslips so that they were 50% to 80%confluent on the following day. Subsequent to fixation for 5 min at 238C with fresh 4.0% paraformaldehyde, cells were permeablized withphosphate-buffered saline (PBS; pH 7.5) containing 0.5% Triton X-100 for 5 min.
Immunofluorescent labeling. Cells were washed twice with PBS andsubjected to sequential series of 30-min incubations with appropriateprimary and secondary antibodies. Wash steps between incubationswere performed consisting of a single wash with PBS containing 0.1%Triton X-100 and two washes with PBS. The primary antibodies usedfall roughly into three distinct classes of molecules: those recognizing(modified) DNA/chromatin, RNA, and transcriptional regulators(including transcription factors and coactivators); and they areindicated in Table 2. Primary antibodies were recognized withappropriate mouse or rabbit secondary antibodies conjugated witheither Alexa-fluor 488 or Cyanin-3 (Cy-3) (Molecular Probes, http://invitrogen.com); and The Jackson ImmunoResearch Laboratories,Inc., http://www.jacksonimmuno.com; respectively). Coverslips weremounted onto slides containing approximately 10 ll of a 90%glycerol-PBS–based medium containing 1 mg/mL parapheylenedi-amine and 0.5 lg/ml DAPI. 8WG16 and ARNA3 were kindly providedby Dr. Charlotte Spencer (University of Alberta, Edmonton, Alberta,Canada), and the CREB antibody was provided by Dr. CynthiaMcMurray (Mayo Clinic, Rochester, Minnesota, United States). Theremaining antibodies were commercial and obtained from thefollowing sources: anti-CBP (C-terminal) (Upstate Biotechnology,Millipore, http://www.upstate.com), anti-BrdU (Sigma, http://www.sig-maaldrich.com), SC-35 (ATCC, http://www.atcc.org), AIM1 (BD Bio-sciences, http://www.bdbiosciences.com), anti-acetylated K5 histoneH4 and anti-acetylated K14 histone H3 (Serotec, http://www.serotec.-com), anti-acetylated K12 histone H4 (Upstate Biotechnology), andp53 S9 and p53 S20 phospho-specific antibodies (Serotec).
RNA labeling. To label nascent transcripts, cycling cells wereincubated with 2 mM FU for 20 min. Cells were fixed and
Table 2. Description of Antibodies and Epitopes
Antibody Epitope Dilution Other
8WG16 RNA PolII (unphosphorylated) 1:500 Recognizes an inactive form of RNA PolII
ARNA3 RNA PolIIA (phosphorylated) 1:200 Recognizes an active form of RNA PolII
FU Fluoro-uridine 1:50 Recognizes FU incorporated into nascently synthesized RNA
CBP aa1736–2179 of CBP 1:200 Recognizes C-terminal domain of CBP [17]
CREB cAMP responsive element binding protein 1:200 Known protein–protein interactions with CBP
SC35 Splicing factor compartment 1:1 Delineates splicing factor compartments
AIM1 Aurora B kinase 1:200 Protein kinase that does not directly interact with CBP (control)
K5 Acetylated K5 (H4) 1:200 Strong in vivo product of CBP HAT activity [17], enriched in euchromatin
K12 Acetylated K12 (H4) 1:2,000 Weaker in vivo product of CBP HAT activity [17]
K14 Acetylated K14 (H3) 1:200 Strong in vivo product of CBP HAT activity [17]
tMeK4 Trimethylated K4 (H3) 1:500 Unrelated histone modification, enriched in euchromatin
S9 p53, phosphorylated serine 9 1:200 Transcription factor (occurs in response to DNA damage)
S20 p53, phosphorylated serine 20 1:200 Transcription factor (occurs in response to DNA damage)
DOI: 10.1371/journal.pcbi.0020139.t002
PLoS Computational Biology | www.ploscompbiol.org October 2006 | Volume 2 | Issue 10 | e1391281
Characterizing Nuclear Architecture

permeabilized as indicated above, and nascent transcripts withincorporated FU were identified with an anti-bromodeoxyuridine(Boehringer, http://www.boehringer-ingelheim.com) primary anti-body at 1:50 that is cross-reactive with FU.
Image acquisition. 3-D optical series (z-series) were collected usinga Zeiss Axioplan 2 digital imaging microscope (Carl Zeiss, http://www.zeiss.com) equipped with a 100 3 (1.4 numerical aperture) plan-apochromat lens and a Coolsnap HQ cooled charge-coupled devicecamera (Roper Scientific, http://www.roperscientific.com). Z-seriesextending above and below individual nuclei were collected at 200-nm intervals with a motorized z-motor. Metamorph version 4.5r9(Universal Imaging, http://www.moleculardevices.com) was employedfor computer-based acquisition of 16-bit images comprising of three(DAPI, Alexa-488, and Cy3) individual channels per image. Compositemontages of collected images were assembled in Adobe Photoshop7.0 (Adobe, http://www.adobe.com).
Image processing and deconvolution. Individual channels fromcollected Z-series were imported into SoftWoRx (Applied Precision,http://www.api.com) and converted into DeltaVision files. Convertedfiles were subjected to maximum likelihood expectation deconvolu-tion processing using a constrained iterative algorithm and theoret-ical optical transfer files generated in SoftWoRx for DAPI (485 nm),Alexa-488 (535 nm), and Cy3 (610 nm). Resulting deconvolved imageswere used in subsequent 3-D modeling. Images were then assembledin Imaris (Bitplane, http://www.bitplane.com), and 3-D projectionimages were generated and saved as 12-bit Tiff files.
3-D image reconstruction. Our procedure for the 3-D reconstruc-tion of the image data essentially involved two steps. Step 1)Generation of isosurfaces. Treating the image stack as a 3-D field ofvalues (R, G, B components), we used and implemented the MarchingCubes algorithm [24] to construct isosurfaces. A number of thresholdvalues (i.e., values of R, G, B components) were used to reproduce thecorrect number of individual bodies or main characteristics of agiven image stack or experimental dataset. This procedure wascarried out for each dataset manually. No statistical evaluation of thethresholding was carried out other than to compare centroidcoordinates at different thresholds, which did not change. Step 2)Foci identification via surface tracking. The results from step 1)resulted in the creation of a series of triangles from the 3-D volumedata. A surface-tracking connectivity program was developed andimplemented to isolate and identify individual bodies within thevolume data. This program takes a triangle as a starting ‘‘seed point’’and marks all other triangles that touch it within neighboring voxels(using a small distance threshold). The resulting group of trianglesthen defines an individual ‘‘body.’’ This procedure is repeated untilall triangles have been grouped into individual bodies. Geometricparameters (e.g., centroid points) for individual bodies are computedfrom the coordinates of the constituting group of triangles.
NN assignment and distances. See Table 1 for details of themathematical terminology. Interpoint distances between centroidswere computed as Euclidean distances. NN distances are on astandardized scale as measured relative to the maximal possible inert-object distance, taking into account variations in nuclei size. Thealgorithm for computing median NN distances from inter-centroidsis as follows. For all objects in each image in a subgroup: 1) computethe collection of inter-centroid distances (ICDs) for all objects; 2) foreach object i compute the smallest ICD Mi (NN distance); and 3)compute the median Mi across the collection of objects.
The label of the NN to each CBP centroid focus was then obtained.In situations where ties were observed for the NN, the tie was brokenrandomly. NN labels were aggregated across all cell images, with everyCBP observed retaining a label identifying the body type of its NN.For each NCBP type, the required probability was estimated as aconstant term in a logistic regression generalized linear model [28],where the binomial response datum for each cell image is the numberof NCBPs that had a CBP as its NN. An offset term was included in thegeneralized linear model for each cell image that accounted for thetotal number of CBPs and NCBPs observed in the image. Analyticconfidence intervals for the log–odds ratio association parameterswere verified using bootstrap resampling. Excess log–odds values
were computed and compared against the same quantities computedunder random relabeling of objects within an image. All computa-tions were conducted in the R and SPLUS statistics systems; R code isavailable from DAS.
Distance-based assessment of CBP spatial organization. In ourprevious studies [5,38], we described the assessment of PML nuclearbody spatial organization in relation to specific genomic loci viastatistical hypothesis tests (specifically, using parametric t tests). Herewe use nonparametric alternatives to these tests, and Monte Carloexact methods (see [26]) to assess statistical significance. Theextracted 3-D coordinates for CBP and NCBP foci were used toprovide empirical distribution functions (EDFs) of NN distances fromeach NCBP focus to the nearest CBP location. Differences betweenthe distributions for different foci were then tested using a two-sample Kolmogorov-Smirnov statistic (e.g., see [25]), utilizing ran-domization procedures (calibration against randomly relabeleddatasets) where necessary, under the assumption that the distributionof NCBP–CBP distances is not different for different foci. Compu-tation of p-values were performed using standard asymptoticreasoning, verified using randomization procedures. See the ex-tended discussion under ‘‘Comparison of Different CBP–NCBPSpatial Distributions’’ in the Results section. Detailed formulae canbe found at http://stats.ma.ic.ac.uk/das01/public_html/BioSPP.
Supporting Information
Figure S1. EDF Plots of NN Distances for NCBP Foci to CBP
Kolmogorov-Smirnov statistics were used to compare EDFs for CBPwith NCBP NN distances, with computation of p-values performedusing standard asymptotic reasoning and verified using random-ization procedures. Each pairwise plot compares the namedcomponents in terms of their NN distances to CBP foci. The labelsfor each NCBP component is as follows: WG16, RNA PolII(hypophosphorylated); ARNA3, PolII (hyperphosphorylated); SC35,pre-mRNA splicing speckles; AIM1, Aurora B kinase; CREB, Creb/Crem transcriptional activator; S9, p53 phosphorylated Ser9; S20,p53 phosphorylated Ser20; K14, acetylated Lys 14 histone H4; K12,acetylated Lys 12 histone H4; K5, acetylated Lys5 histone H4; FU,fluoro-uridine. Distance have been normalised and are thereforerelative distances. The Ks statistic is given in the box and refers tohow significant the observed differences are.
Found at DOI: 10.1371/journal.pcbi.0020139.sg001 (2.8 MB PDF).
Figure S2. Example of Colocalization
HeLa cells were irradiated with 10 Gy, fixed with paraformaldehyde,and stained with antibodies recognizing 53BP1 and phosphorylatedhistone H2AX. 3-D projections of deconvolved image sets are shown.
Found at DOI: 10.1371/journal.pcbi.0020139.sg002 (88 KB JPG).
Acknowledgments
We thank the Journal of Cell Science for providing a Travel Fellowshipto KJM to conduct this collaborative effort, and also Dr. Carol Shielsfor help in the initial stages of the statistical analyses.
Author contributions. KJM, DAS, PSF, and MJH conceived anddesigned the experiments. KJM performed the experiments. KJM,NMA, and SAI analyzed the data. KJM, DAS, NMA, SAI, PSF, and MJHwrote the paper.
Funding. We would like to thank the financial support of theCanadian Institute for Health Research and the Alberta HeritageFoundation for Medical Research for doctoral studentships to KJMand a scholarship to MJH. PSF and SAI would also like to thank theWellcome Trust for funding.
Competing interests. The authors have declared that no competinginterests exist.
References1. Croft JA, Bridger JM, Boyle S, Perry P, Teague P, et al. (1999) Differences in
the localization and morphology of chromosomes in the human nucleus. JCell Biol 145: 1119–1131.
2. Tanabe H, Muller S, Neusser M, von Hase J, Calcagno E, et al. (2002)Evolutionary conservation of chromosome territory arrangements in cellnuclei from higher primates. Proc Natl Acad Sci U S A 99: 4424–4429.
3. Sadoni N, Langer S, Fauth C, Bernardi G, Cremer T, et al. (1999) Nuclear
organization of mammalian genomes. Polar chromosome territories buildup functionally distinct higher order compartments. J Cell Biol 146: 1211–1226.
4. Shopland LS, Johnson CV, Byron M, McNeil J, Lawrence JB (2003)Clustering of multiple specific genes and gene-rich R-bands around SC-35 domains: Evidence for local euchromatic neighborhoods. J Cell Biol 162:981–990.
5. Shiels C, Islam SA, Vatcheva R, Sasieni P, Sternberg MJ, et al. (2001) PML
PLoS Computational Biology | www.ploscompbiol.org October 2006 | Volume 2 | Issue 10 | e1391282
Characterizing Nuclear Architecture

bodies associate specifically with the MHC gene cluster in interphasenuclei. J Cell Sci 114: 3705–3716.
6. Shopland LS, Byron M, Stein JL, Lian JB, Stein GS, et al. (2001) Replication-dependent histone gene expression is related to Cajal body (CB) associationbut does not require sustained CB contact. Mol Biol Cell 12: 565–576.
7. Smith KP, Lawrence JB (2000) Interactions of U2 gene loci and theirnuclear transcripts with Cajal (coiled) bodies: Evidence for PreU2 withinCajal bodies. Mol Biol Cell 11: 2987–2998.
8. Verschure PJ, Van Der Kraan I, Enserink JM, Mone MJ, Manders EM, et al.(2002) Large-scale chromatin organization and the localization of proteinsinvolved in gene expression in human cells. J Histochem Cytochem 50:1303–1312.
9. Grande MA, van der Kraan I, de Jong L, van Driel R (1997) Nucleardistribution of transcription factors in relation to sites of transcription andRNA polymerase II. J Cell Sci 110 (Part 15): 1781–1791.
10. Pendergrast PS, Wang C, Hernandez N, Huang S (2002) FBI-1 can stimulateHIV-1 Tat activity and is targeted to a novel subnuclear domain thatincludes the Tat-P-TEFb–containing nuclear speckles. Mol Biol Cell 13:915–929.
11. van Steensel B, Brink M, van der Meulen K, van Binnendijk EP, WansinkDG, et al. (1995) Localization of the glucocorticoid receptor in discreteclusters in the cell nucleus. J Cell Sci 108 (Part 9): 3003–3011.
12. Hendzel MJ, Kruhlak MJ, Bazett-Jones DP (1998) Organization of highlyacetylated chromatin around sites of heterogeneous nuclear RNAaccumulation. Mol Biol Cell 9: 2491–2507.
13. Mattern KA, van der Kraan I, Schul W, de Jong L, van Driel R (1999) Spatialorganization of four hnRNP proteins in relation to sites of transcription, tonuclear speckles, and to each other in interphase nuclei and nuclearmatrices of HeLa cells. Exp Cell Res 246: 461–470.
14. Hendzel MJ, Kruhlak MJ, MacLean NA, Boisvert F, Lever MA, et al. (2001)Compartmentalization of regulatory proteins in the cell nucleus. J SteroidBiochem Mol Biol 76: 9–21.
15. Fischle W, Dequiedt F, Hendzel MJ, Guenther MG, Lazar MA, et al. (2002)Enzymatic activity associated with class II HDACs is dependent on amultiprotein complex containing HDAC3 and SMRT/N-CoR. Mol Cell 9:45–57.
16. He S, Davie JR (2006) Sp1 and Sp3 foci distribution throughout mitosis. JCell Sci 119: 1063–1070.
17. Schul W, de Jong L, van Driel R (1998) Nuclear neighbours: The spatial andfunctional organization of genes and nuclear domains. J Cell Biochem 70:159–171.
18. McManus KJ, Hendzel MJ (2003) Quantitative analysis of CBP- and P300-induced histone acetylations in vivo using native chromatin. Mol Cell Biol23: 7611–7627.
19. McManus KJ, Hendzel MJ (2001) CBP, a transcriptional coactivator andacetyltransferase. Biochem Cell Biol 79: 253–266.
20. Diggle PJ (2003) Statistical analysis of spatial point patterns. London:Oxford University Press. 148 p.
21. Noordmans HJ, van der Kraan K, van Driel R, Smeulders AW (1998)Randomness of spatial distributions of two proteins in the cell nucleusinvolved in mRNA synthesis and their relationship. Cytometry 33: 297–309.
22. Schneider R, Bannister AJ, Myers FA, Thorne AW, Crane-Robinson C, et al.(2004) Histone H3 lysine 4 methylation patterns in higher eukaryotic genes.Nat Cell Biol 6: 73–77.
23. Santos-Rosa H, Schneider R, Bannister AJ, Sherriff J, Bernstein BE, et al.(2002) Active genes are tri-methylated at K4 of histone H3. Nature 419:407–411.
24. Lorensen WE, Cline HE (1987) Marching cubes: A high resolution 3Dsurface reconstruction algorithm. Comput Graph 21: 163–169.
25. Conover WJ (1999) Practical nonparametric statistics. New York: Wiley.584 p.
26. Manly BFJ (1997) Randomization, bootstrap, and Monte Carlo methods inbiology. London: Chapman and Hall. 424 p.
27. Knowles DW, Ortiz de Solorzano C, Jones A (2000) Analysis of the 3D
spatial organization of cells and subcellular structures in tissue. Farkas DL,Leif RC, editors. Proc SPIE 3921: 66–73.
28. McCullagh P, Nelder JA (1989) Generalized linear models. 2nd edition.London: Chapman and Hall. 511 p.
29. Thorne AW, Kmiciek D, Mitchelson K, Sautiere P, Crane-Robinson C (1990)Patterns of histone acetylation. Eur J Biochem 193: 701–713.
30. Turner BM, O’Neill LP, Allan IM (1989) Histone H4 acetylation in humancells. Frequency of acetylation at different sites defined by immunolabelingwith site-specific antibodies. FEBS Lett 253: 141–145.
31. Zhang K, Williams KE, Huang L, Yau P, Siino JS, et al. (2002) Histoneacetylation and deacetylation: Identification of acetylation and methylationsites of HeLa histone H4 by mass spectrometry. Mol Cell Proteomics 1: 500–508.
32. Zhang DE, Nelson DA (1988) Histone acetylation in chicken erythrocytes.Rates of deacetylation in immature and mature red blood cells. Biochem J250: 241–245.
33. Davie JR, Hendzel MJ (1994) Multiple functions of dynamic histoneacetylation. J Cell Biochem 55: 98–105.
34. Hendzel MJ, Sun JM, Chen HY, Rattner JB, Davie JR (1994) Histoneacetyltransferase is associated with the nuclear matrix. J Biol Chem 269:22894–22901.
35. Moen PT Jr, Smith KP, Lawrence JB (1995) Compartmentalization ofspecific pre-mRNA metabolism: An emerging view. Hum Mol Genet 4:1779–1789.
36. Xing Y, Johnson CV, Dobner PR, Lawrence JB (1993) Higher levelorganization of individual gene transcription and RNA splicing. Science259: 1326–1330.
37. Xing Y, Johnson CV, Moen PT Jr, McNeil JA, Lawrence J (1995) Nonrandomgene organization: Structural arrangements of specific pre-mRNA tran-scription and splicing with SC-35 domains. J Cell Biol 131: 1635–1647.
38. Wang J, Shiels C, Sasieni P, Wu PJ, Islam SA, et al. (2004) Promyelocyticleukemia nuclear bodies associate with transcriptionally active genomicregions. J Cell Biol 164: 515–526.
39. Bolzer A, Kreth G, Solovei I, Koehler D, Saracoglu K, et al. (2005) Three-dimensional maps of all chromosomes in human male fibroblast nuclei andprometaphase rosettes. PLoS Biol 3(5): e157. Available: http://biology.plosjournals.org/archive/1545–7885/3/5/pdf/10.1371_journal.pbio.0030157-L.pdf. Accessed 18 September 2006.
40. Boyle S, Gilchrist S, Bridger JM, Mahy NL, Ellis JA, et al. (2001) The spatialorganization of human chromosomes within the nuclei of normal andemerin-mutant cells. Hum Mol Genet 10: 211–219.
41. Cremer T, Cremer C (2001) Chromosome territories, nuclear architectureand gene regulation in mammalian cells. Nat Rev Genet 2: 292–301.
42. Parada LA, Sotiriou S, Misteli T (2004) Spatial genome organization. ExpCell Res 296: 64–70.
43. Solovei I, Schermelleh L, During K, Engelhardt A, Stein S, et al. (2004)Differences in centromere positioning of cycling and postmitotic humancell types. Chromosoma 112: 410–423.
44. Fuchsova B, Hozak P (2002) The localization of nuclear DNA helicase II indifferent nuclear compartments is linked to transcription. Exp Cell Res279: 260–270.
45. Nielsen JA, Hudson LD, Armstrong RC (2002) Nuclear organization indifferentiating oligodendrocytes. J Cell Sci 115: 4071–4079.
46. Grande MA, van der Kraan I, van Steensel B, Schul W, de The H, et al.(1996) PML-containing nuclear bodies: Their spatial distribution inrelation to other nuclear components. J Cell Biochem 63: 280–291.
47. van Steensel B, van Binnendijk EP, Hornsby CD, van der Voort HT,Krozowski ZS, et al. (1996) Partial colocalization of glucocorticoid andmineralocorticoid receptors in discrete compartments in nuclei of rathippocampus neurons. J Cell Sci 109 (Part 4): 787–792.
48. Bleoo S, Sun X, Hendzel MJ, Rowe JM, Packer M, et al. (2001) Association ofhuman DEAD box protein DDX1 with a cleavage stimulation factorinvolved in 39-end processing of pre-MRNA. Mol Biol Cell 12: 3046–3059.
PLoS Computational Biology | www.ploscompbiol.org October 2006 | Volume 2 | Issue 10 | e1391283
Characterizing Nuclear Architecture