the total economic impact of silver tail systems … consulting the total economic impact of silver...
TRANSCRIPT

A Forrester Total Economic Impact™ Study Prepared For Silver Tail Systems
The Total Economic Impact Of Silver Tail Systems Single-Company Analysis
Project Director: Lauren Hughes
August 2012
Forrester Consulting
The Total Economic Impact Of Silver Tail Systems
Page 1
TABLE OF CONTENTS Executive Summary ................................................................................................................................................................................ 2
Silver Tail Systems Combats Cyberattacks And Fraud .............................................................................................................. 2
Factors Affecting Benefits And Costs ............................................................................................................................................ 4
Disclosures ......................................................................................................................................................................................... 4
TEI Framework And Methodology ..................................................................................................................................................... 5
Analysis .................................................................................................................................................................................................... 7
Interview Highlights ......................................................................................................................................................................... 7
Costs .................................................................................................................................................................................................... 9
Benefits .............................................................................................................................................................................................. 12
Flexibility .......................................................................................................................................................................................... 18
Risk .................................................................................................................................................................................................... 19
Financial Summary .............................................................................................................................................................................. 21
Silver Tail Systems Forensics: Overview ........................................................................................................................................... 23
Appendix A: Total Economic Impact™ Overview ........................................................................................................................... 24
Appendix B: Glossary ........................................................................................................................................................................... 25
Appendix C: Endnotes ......................................................................................................................................................................... 26
© 2012, Forrester Research, Inc. All rights reserved. Unauthorized reproduction is strictly prohibited. Information is based on best available resources. Opinions reflect judgment at the time and are subject to change. Forrester®, Technographics®, Forrester Wave, RoleView, TechRadar, and Total Economic Impact are trademarks of Forrester Research, Inc. All other trademarks are the property of their respective companies. For additional information, go to www.forrester.com.
About Forrester Consulting Forrester Consulting provides independent and objective research-based consulting to help leaders succeed in their organizations. Ranging in scope from a short strategy session to custom projects, Forrester’s Consulting services connect you directly with research analysts who apply expert insight to your specific business challenges. For more information, visit www.forrester.com/consulting.
Forrester Consulting
The Total Economic Impact Of Silver Tail Systems
Page 2
Executive Summary In January 2012, Silver Tail Systems commissioned Forrester Consulting to examine the total economic impact and security benefits enterprises may realize by deploying Silver Tail Systems Forensics enterprise software. The purpose of this study is to provide readers with a framework to evaluate the potential financial impact of Silver Tail Systems Forensics on their organizations.
Silver Tail Systems Combats Cyberattacks And Fraud Online commerce is an integral part of the business model for many companies today, spanning an extremely diverse group of industries and all types of organizations. eCommerce sales continue to grow rapidly, having topped $200 billion in 2011. Forrester expects that online sales will grow from 7% of overall retail sales to close to 9% by 2016.1 As this channel grows, so do the opportunities for cybercrime and fraud by cybercriminals, who are constantly changing their methods of attack. In order to obtain visibility into this threat vector and continually defend against such attacks, companies must try to predict every possible type of fraudulent activity and set up increasingly complex defense mechanisms to combat them. Silver Tail Systems Forensics dynamically identifies threats within an online environment by monitoring traffic between users/IP addresses and websites to look for behavioral anomalies across entire web sessions. This web session intelligence leads to more effective defenses against cyberattacks with a lower level of internal effort.
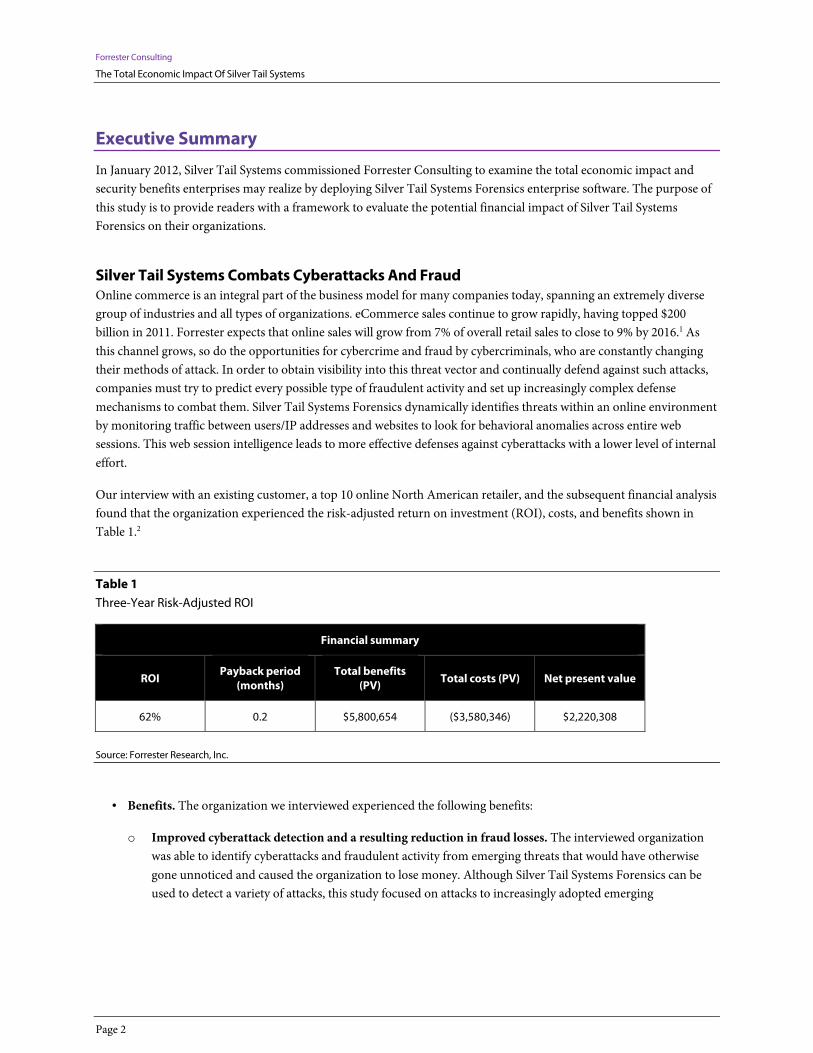
Our interview with an existing customer, a top 10 online North American retailer, and the subsequent financial analysis found that the organization experienced the risk-adjusted return on investment (ROI), costs, and benefits shown in Table 1.2
Table 1 Three-Year Risk-Adjusted ROI
Financial summary
ROI Payback period (months)
Total benefits (PV) Total costs (PV) Net present value
62% 0.2 $5,800,654 ($3,580,346) $2,220,308
Source: Forrester Research, Inc.
• Benefits. The organization we interviewed experienced the following benefits:
o Improved cyberattack detection and a resulting reduction in fraud losses. The interviewed organization was able to identify cyberattacks and fraudulent activity from emerging threats that would have otherwise gone unnoticed and caused the organization to lose money. Although Silver Tail Systems Forensics can be used to detect a variety of attacks, this study focused on attacks to increasingly adopted emerging

Forrester Consulting
The Total Economic Impact Of Silver Tail Systems
Page 3
eCommerce capabilities that are susceptible to cybercrime. We quantified the impact of three kinds of fraud that Forensics prevented:
o Fraud associated with customer acquisition through sweepstakes.
o Fraudulent rebate claims.
o Fraudulent activity in the online marketplace/app store.
For each of these, we captured the financial impact of fraud that was avoided and the cost avoidance facilitated by the use of Silver Tail Systems Forensics to identify the criminal activity so that the organization could prevent it.
o Productivity savings due to visibility. By using Silver Tail Systems Forensics to identify anomalous behavior instead of trying to identify it by collecting, mobilizing, and reconstructing disparate log files after the fact, the interviewed organization was able to realize a significant increase in productivity for its staff. For the purposes of this analysis, we divided this productivity impact into two categories:
o The productivity gain for the security team.
o The productivity savings for the engineering operations team.
For each team, we estimated the total savings based on the number of full-time equivalents (FTEs) needed to perform tasks that Silver Tail Systems Forensics automates.
o Brand preservation. By using Silver Tail Systems Forensics to proactively identify anomalous behavior and take action to stop fraud more quickly, the interviewed organization was better able to preserve its brand integrity. Although we have not quantified the financial impact of this benefit, it is an important additional area to include as we consider the overall impact of Silver Tail Systems Forensics on the organization.
• Costs. The organization we interviewed experienced the following costs:
o Software licensing. The interviewed organization paid an annual software license fee to Silver Tail Systems. The license fee includes support and maintenance.
o Hardware costs. In addition to the software licensing costs, the organization also required four additional servers for the solution.
o Implementation costs. To facilitate implementation, the organization used two network engineers on an hourly basis, which is captured in this cost category.
o Training. Similar to the implementation costs, we calculated the training cost using an hourly rate for the people trained.
o Administration. We include ongoing internal administration for the product in two areas: the cost of resources from the engineering operations team and associated resources on the security team.
Forrester Consulting
The Total Economic Impact Of Silver Tail Systems
Page 4
Factors Affecting Benefits And Costs Table 1 illustrates the risk-adjusted financial results that were achieved by the organization. The risk-adjusted values take into account any potential uncertainty or variance that exists in estimating the costs and benefits, which produces more conservative estimates. The following factors may affect the financial results that an organization may experience:
• Implementation costs will vary based on the size of the organization.
• Training costs will vary based on the current skill set of the team.
• The time to realize benefits may vary based on the amount of customization required to configure Silver Tail Systems Forensics for the customer’s site(s).
• Reduction in fraud losses will vary based on the breadth and scope of the organization’s online businesses.
Disclosures The reader should be aware of the following:
• The study was commissioned by Silver Tail Systems and delivered by the Forrester Consulting group.
• Forrester makes no assumptions as to the potential ROI that other organizations will receive. Forrester strongly advises that readers use their own estimates within the framework provided in the report to determine the appropriateness of an investment in Silver Tail Systems Forensics.
• Silver Tail Systems reviewed and provided feedback to Forrester, but Forrester maintains editorial control over the study and its findings and does not accept changes to the study that contradict Forrester’s findings or obscure the meaning of the study.
• The customer name for the interview was provided by Silver Tail Systems.

Forrester Consulting
The Total Economic Impact Of Silver Tail Systems
Page 5
TEI Framework And Methodology
Introduction From the information provided in the interview, Forrester has constructed a Total Economic Impact™ framework for those organizations considering implementing Silver Tail Systems Forensics. The objective of the framework is to identify the cost, benefit, flexibility, and risk factors that affect the investment decision.
Approach And Methodology Forrester took a multistep approach to evaluate the impact that Silver Tail Systems Forensics can have on an organization (see Figure 1). Specifically, we:
• Interviewed Silver Tail Systems marketing, sales, and consulting personnel and Forrester analysts to gather data relative to Silver Tail Systems Forensics and the marketplace for Silver Tail Systems Forensics.
• Interviewed an organization currently using Silver Tail Systems Forensics to obtain data with respect to costs, benefits, and risks.
• Constructed a financial model representative of the interview using the TEI methodology, with the financial model being populated with the cost and benefit data obtained from interviewing the customer organization.
Figure 1 TEI Approach
Source: Forrester Research, Inc.
Forrester employed four fundamental elements of TEI in modeling the Silver Tail Systems Forensics solution:
1. Costs.
2. Benefits to the entire organization.
3. Flexibility.
4. Risk.
Construct financial model using TEI
framework
Write case study
Perform due diligence
Conduct customer interviews

Forrester Consulting
The Total Economic Impact Of Silver Tail Systems
Page 6
Given the increasing sophistication that enterprises have regarding ROI analyses related to IT investments, Forrester’s TEI methodology serves the purpose of providing a complete picture of the total economic impact of purchase decisions. Please see Appendix A for additional information on the TEI methodology.

Forrester Consulting
The Total Economic Impact Of Silver Tail Systems
Page 7
Analysis
Interview Highlights The interviewed organization is the business unit of a large retail company: a top 10 online retailer in North America. The business unit manages the retailer’s online properties and generates more than $1 billion in annual revenue.
In early 2010, the director of security and his team were spending an excessive amount of time on manual efforts to identify malicious activity on its online properties. While the team had a number of security systems in place to detect fraudulent behavior, the existing systems weren’t able to detect fraud when IP addresses were being processed through a proxy or when domain owners were being masked. So the team engaged in the post-hoc collection, mobilization, and reconstruction of log files.
The director of security determined that this manual effort wasn’t sustainable and began to look into an automated solution that would at a minimum be able to detect:
• Click fraud.
• Bot attacks.
• Potential swinging of votes on social sites.
• Scraping the sites for pricing and inventory.
• Distributed denial-of-service (DDoS) attacks.
• Anomalous behavior associated with emerging threats.
The director looked at both build and buy options. The cost to build such a solution was estimated at more than $7 million, with ongoing expenses of more than $2 million. This was quickly ruled out, as the organization was unable to justify such a high cost for a solution that would require skills not in line with the core competencies of the security team and specialized knowledge that would be difficult to attain and cultivate.
The director then identified a number of third-party options. Ultimately, the interviewed organization selected Silver Tail Systems Forensics software because it was the only offering that met its security requirements, could be integrated with the organization’s managed security services, and could deliver on the requirement that it detect anomalous behavior associated with emerging threats.
The interviewed organization found the following:
• Within 6 hours of deployment, Silver Tail Systems Forensics uncovered malicious behavior on the organization’s websites, including site probing, targeted directory attacks, and site scraping for pricing, which traditional security systems were not able to detect.
• With Silver Tail Systems Forensics, the security team was able to gain visibility for the first time into the entire web session and see every click by every entity (IP or authenticated user) on its websites. The security team

Forrester Consulting
The Total Economic Impact Of Silver Tail Systems
Page 8
quickly realized that other teams, such as engineering operations (the team that monitors website issues) would realize significant benefits from having access to Silver Tail Systems Forensics. The engineering operations team was trained on Silver Tail Systems Forensics and began to use Forensics as the primary tool to monitor anomalous activity on the websites. Similarly, the security team began to use Silver Tail Systems Forensics as its primary tool to investigate anomalous behavior once it had been detected.
• The advanced behavior analytics of Silver Tail Systems Forensics dynamically adjusts to application changes and fluctuations in legitimate customer behavior. It then uses behavioral scoring to identify what is different. As a result, it is very effective at identifying emerging threats.
• Silver Tail Systems provides exceptional support to the interviewed organization, allocating several engineering resources to be available 24x7 during the organization’s holiday season.
Framework Assumptions Table 2 provides the model assumptions that Forrester used in this analysis.
Table 2 Model Assumptions
Ref. Metric Calculation Value
R1 Hours per week 40
R2 Weeks per year 52
R3 Hours per year (M-F, 9-5) 2,080
R4 Hours per year (24x7) 8,736
R5 Security/engineering operations professional fully loaded rate $170,000
R6 Hourly (R5/R3) $85
Source: Forrester Research, Inc.
The discount rate used in the present value (PV) and net present value (NPV) calculations is 10%, and the time horizon used for the financial modeling is three years. Organizations typically use discount rates between 8% and 16% based on their current environment. Readers are urged to consult with their respective company’s finance department to determine the most appropriate discount rate to use within their own organizations.
Forrester Consulting
The Total Economic Impact Of Silver Tail Systems
Page 9
Costs The cost categories included in this financial analysis include costs related to software licensing, hardware, implementation, training, and ongoing administration. The details for each of these categories are described in the following sections.
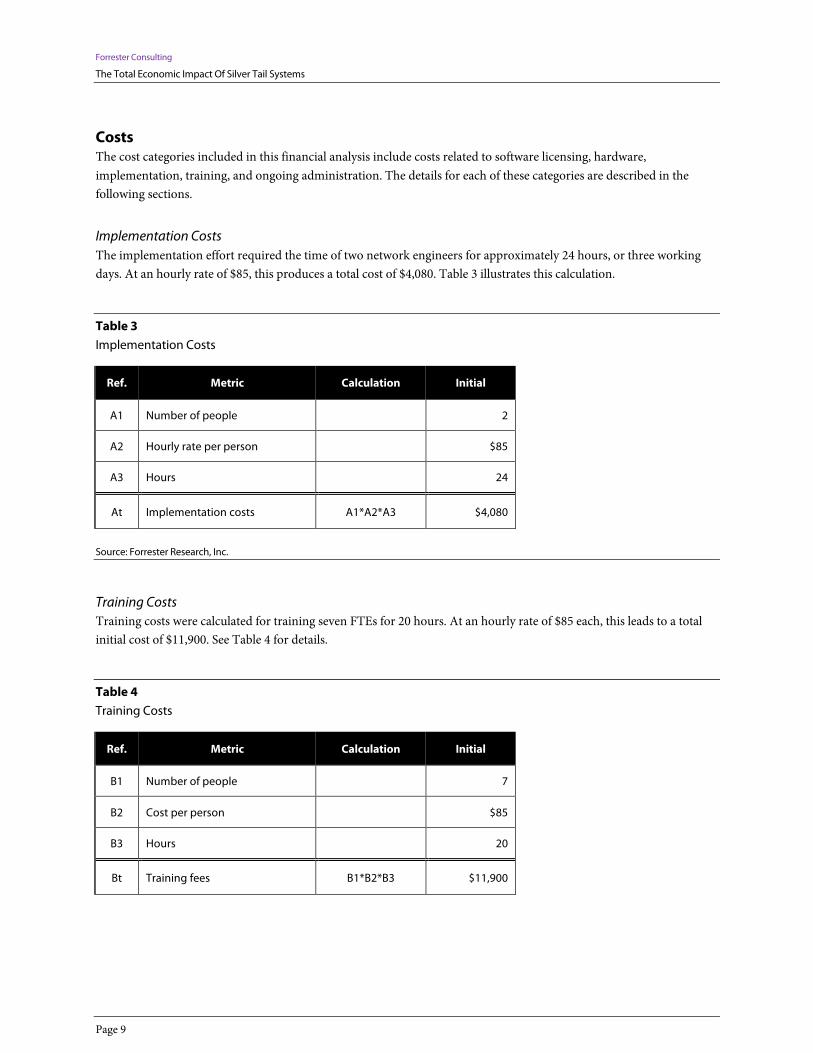
Implementation Costs The implementation effort required the time of two network engineers for approximately 24 hours, or three working days. At an hourly rate of $85, this produces a total cost of $4,080. Table 3 illustrates this calculation.
Table 3 Implementation Costs
Ref. Metric Calculation Initial
A1 Number of people
2
A2 Hourly rate per person
$85
A3 Hours
24
At Implementation costs A1*A2*A3 $4,080
Source: Forrester Research, Inc.
Training Costs Training costs were calculated for training seven FTEs for 20 hours. At an hourly rate of $85 each, this leads to a total initial cost of $11,900. See Table 4 for details.
Table 4 Training Costs
Ref. Metric Calculation Initial
B1 Number of people
7
B2 Cost per person
$85
B3 Hours
20
Bt Training fees B1*B2*B3 $11,900

Forrester Consulting
The Total Economic Impact Of Silver Tail Systems
Page 10
Source: Forrester Research, Inc.
Hardware Costs The hardware costs include four servers at a cost of $7,000 each. This yields a total cost of $28,000 to the organization. The details of this calculation are shown in Table 5 below.
Table 5 Hardware Costs
Ref. Metric Calculation Year 1
C1 Hardware costs
$7,000
C2 Number of units
4
Ct Hardware costs C1*C2 $28,000
Source: Forrester Research, Inc.
Software License Fees The interviewed organization paid an annual software license fee of $1,000,000. The license fee includes support and maintenance.
Table 6 Software License Fees
Ref. Metric Calculation Initial Year 1 Year 2 Year 3
Dt Software license fees
$1,000,000 $1,000,000 $1,000,000
Source: Forrester Research, Inc.
Administrative Costs For The Security Team The administrative costs for the security team involve three staff members who devote approximately 10 hours a week each to working with Silver Tail Systems Forensics. At an hourly rate of $85 each, this leads to a total annual cost of $132,600 associated with the security administration costs. See Table 7 for the details of this calculation.

Forrester Consulting
The Total Economic Impact Of Silver Tail Systems
Page 11
Table 7 Administrative Costs For The Security Team
Ref. Metric Calculation Annual
E1 Number of people
3
E2 Hourly rate per person
$85
E3 Hours per week
10
E4 Weeks per year
52
Et Administrative costs for the security team E1*E2*E3*E4 $132,600
Source: Forrester Research, Inc.
Administrative Costs For The Engineering Operations Team The engineering operations team has four staff members using Silver Tail Systems Forensics for approximately 15 hours a week each. At an hourly rate of $85 each, this leads to an annual cost of $265,200, as shown in Table 8.
Table 8 Administrative Costs For The Engineering Operations Team
Ref. Metric Calculation Annual
F1 Number of people
4
F2 Hourly rate per person
$85
F3 Hours per week
15
F4 Weeks per year
52
Ft Administrative costs for the engineering operations team F1*F2*F3*F4 $265,200
Source: Forrester Research, Inc.
Total Costs Table 9 below summarizes the total costs used in this financial analysis.

Forrester Consulting
The Total Economic Impact Of Silver Tail Systems
Page 12
Table 9 Total Costs
Ref. Cost category Initial Year 1 Year 2 Year 3 Total Present value
At Implementation costs (4,080) 0 0 0 (4,080) (4,080)
Bt Training fees (11,900) 0 0 0 (11,900) (11,900)
Ct Hardware costs (28,000) 0 0 0 (28,000) (28,000)
Dt Software license fees $0 ($1,000,000) ($1,000,000) ($1,000,000) ($3,000,000) ($2,486,852)
Et Administrative costs for security team $0 ($132,600) ($132,600) ($132,600) ($397,800) ($329,757)
Ft Administrative costs for engineering operations team
$0 ($265,200) ($265,200) ($265,200) ($795,600) ($659,513)
Total costs (original) ($43,980) ($1,397,800) ($1,397,800) ($1,397,800) ($4,237,380) ($3,520,102)
Source: Forrester Research, Inc.
Benefits The benefits included in this financial analysis fall into two categories: the benefits associated with productivity savings due to visibility and the benefits associated with lower rates of fraud. Within the productivity benefits, we examined benefits associated with both the engineering operations team and the security team. Within the benefits associated with fraud prevention, we quantified the benefit related to three different types of fraud that were avoided using Silver Tail Systems Forensics. For these three categories, we include one in each year of the analysis to demonstrate that, over the three-year period, the interviewed organization was able to detect and prevent new types of fraud as various attacks by cybercriminals were attempted, identified, and thwarted. Each of the benefit categories quantified in this financial analysis are described in the following sections.
Reduction In Fraud Losses For Customer Acquisition (Sweepstakes Program) In order to understand the savings associated with fraud reduction, we examined three cases of fraud avoidance. In each case, Silver Tail Systems Forensics was able to detect malicious behavior that otherwise would have gone undetected. For the purpose of this study, we calculated the losses the organization would have incurred had it not had Silver Tail Systems Forensics in place.
In the first case, we tracked the progress of a marketing promotion that included a gift card giveaway. On average, we identified six fraudulent wins per hour. As each gift card has a value of $50, this is a loss of $300 per hour for the organization. The program runs for 720 hours, leading to a total loss for this program of $216,000. If we assume that

Forrester Consulting
The Total Economic Impact Of Silver Tail Systems
Page 13
there are a total of 150 promotions of this type per year, and that 10% of those programs are affected by similar levels of fraudulent activity, we see a total annual cost avoidance of $3,240,000 based on the reduction in losses from this kind of fraud. For the purposes of this analysis, we included this cost savings beginning in the first year of the analysis. See Table 10 for details of the calculation.
Table 10 Reduction In Fraud Losses For Customer Acquisition
Ref. Metric Calculation Initial Year 1
G1 Gift card value
$50
G2 Fraudulent gift card wins per hour
6
G3 Total fraud loss per hour H1*H2
$300
G4 Total hours per program
720
G5 Total fraud loss per program H3*H4
$216,000
G6 Total programs
150
G7 Percent of programs affected by fraud
10%
Gt Reduction in fraud losses for customer acquisition H5*H6*H7 $0 $3,240,000
Source: Forrester Research, Inc.
Reduction In Fraud Losses For Rebates/Friendly Fraud The next kind of fraud addressed in this analysis is the fraud associated with false items being bought and sold on the organization’s online marketplace. The interviewed company offers a rebate for transactions on its website, so fraudsters will buy and sell false items in order to obtain this rebate. On average, we estimated that approximately eight types of phony items would be attempted over the course of the year, the average price of these items would be $1,500, and the average volume would be 40 items of each type per month. We estimated a 10% rebate for each item, leading to a total annual savings of $576,000 for the organization. We add this benefit in Year 2 of the analysis. See Table 11 for the details of this calculation.

Forrester Consulting
The Total Economic Impact Of Silver Tail Systems
Page 14
Table 11 Reduction In Fraud Losses For Rebates
Ref. Metric Calculation Annual
H1 Types of phony items posted
8
H2 Average price of phony item
$1,500
H3 Number of each type of phony item sold per month
40
H4 Months per year
12
H5 Total purchases of phony items per year I1*I2*I3*I4 $5,760,000
H6 Rebate percentage
10%
Ht Reduction in fraud losses for rebates I5*I6 $576,000
Source: Forrester Research, Inc.
Figure 2 Fraud In The Online Marketplace
Source: Silver Tail Systems

Forrester Consulting
The Total Economic Impact Of Silver Tail Systems
Page 15
Reduction In Fraud Losses In The Online Marketplace The third kind of fraud addressed in this analysis is the fraud associated with a phony item posted on the organization’s online marketplace. Tens of thousands of customers flooded the website to buy this phenomenal item. Ten resources in the call center spent an average of 80 hours each to address customer complaints. We estimated that this kind of incident occurs 12 times over the course of the year, or approximately once per month. At an internal billing rate of $80 per hour, the customer support savings is equal to $768,000. See Table 12 for the details of this calculation.
Table 12 Reduction In Fraud Losses In The Online Marketplace
Ref. Metric Calculation Annual
I1 Number of call center fraud occurrences
12
I2 Number of call center resources
10
I3 Hours per resource spent responding to fraud (per instance)
80
I4 Total number of hours J1*J2*J3 9,600
I5 Cost per hour
$80
It Reduction in fraud losses in the online marketplace J4*J5 $768,000
Source: Forrester Research, Inc.
Productivity Savings Due To Visibility For The Engineering Operations Team In order to quantify the productivity savings for the engineering operations team, we estimated that using Silver Tail Systems Forensics replaces approximately one-half of an FTE on this team. At a fully loaded annual rate of $170,000, this leads to a savings of $85,000 annually for the organization, as shown in Table 13.

Forrester Consulting
The Total Economic Impact Of Silver Tail Systems
Page 16
Table 13 Productivity Savings Due To Visibility For The Engineering Operations Team
Ref. Metric Calculation Annual
J1 Number of workers (saved)
0.5
J2 Yearly rate per person
$170,000
Jt Productivity savings for the engineering operations team K1*K2 $85,000
Source: Forrester Research, Inc.
Productivity Savings Due To Visibility For The Security Team In order to quantify the productivity savings for the security team, we estimate that the use of Silver Tail Systems Forensics replaces approximately four FTEs on this team. At a fully loaded annual rate of $170,000, this leads to a savings of $680,000 annually for the organization, as shown in Table 14.
Table 14 Productivity Savings Due To Visibility For The Security Team
Ref. Metric Calculation Initial Year 1
K1 Number of workers (saved)
4
K2 Yearly rate per person
$170,000
Kt Productivity savings for security team L1*L2 $0 $680,000
Source: Forrester Research, Inc.
Qualitative Benefit: Brand Preservation In addition to the benefit categories included in the financial analysis, the organization has benefited from an improved ability to protect its brand with Silver Tail Systems Forensics. When the interviewed organization was hit by an attack that involved changing product pages, it saw a resulting negative impact on its brand reputation. However, the organization was able to identify this attack and other attacks quickly and mitigate the overall negative impact.
To illustrate this effect in the marketplace, we can compare similar incidents and their effects. When TJX was hit with a data breach in which 45.7 million credit card numbers were stolen, it incurred not only losses from customer and corporate remediation but also losses from negative brand impact as well as losses of existing customers and future

Forrester Consulting
The Total Economic Impact Of Silver Tail Systems
Page 17
customers. Similarly, when Sony’s PlayStation Network services were hit with a devastating security breach, it estimated that it lost approximately $171 million, including the impact on future profits due to the reputational damage to its brand.
Total Benefits The table below summarizes the total benefits used in this financial analysis.

Forrester Consulting
The Total Economic Impact Of Silver Tail Systems
Page 18
Table 15 Total Benefits
Total benefit cash flows (original estimates)
Ref. Benefit category Initial Year 1 Year 2 Year 3 Total Present value
Gt
Reduction in fraud losses for customer acquisition
0 3,240,000 0 0 3,240,000 2,945,455
Ht Reduction in fraud losses for rebates
0 0 576,000 0 576,000 523,636
It
Reduction in fraud losses in the online marketplace
0 0 0 768,000 768,000 698,182
Jt
Productivity savings for the engineering operations team
0 85,000 85,000 85,000 255,000 211,382
Kt Productivity savings for the security team
0 680,000 680,000 680,000 2,040,000 1,691,059
Total benefits (original) $0 $4,005,000 $1,341,000 $1,533,000 $6,879,000 $6,069,715
Source: Forrester Research, Inc.
Flexibility Flexibility, as defined by TEI, represents an investment in additional capacity or capability that could be turned into business benefit for some future additional investment. This provides an organization with the “right” or the ability to engage in future initiatives but not the obligation to do so. There are multiple scenarios in which a customer might choose to implement Silver Tail Systems Forensics and later realize additional uses and business opportunities. Flexibility would also be quantified when evaluated as part of a specific project (described in more detail in Appendix A).
The interviewed organization has recently invested in Silver Tail Systems Mitigator, a solution that creates alerts and actions to any defined behavior scenarios or threatening sessions in real time. Currently, the organization only uses this software for alerts. It has not integrated it so that it takes action on the site, such as setting up a CAPTCHA or denying a

Forrester Consulting
The Total Economic Impact Of Silver Tail Systems
Page 19
request. A next step for the organization is to do more correlation work on the alerts to determine if it wants to ultimately use alerts to trigger an action on the site.
Risk Forrester defines two types of risk associated with this analysis: implementation risk and impact risk. Implementation risk is the risk that a proposed investment in Silver Tail Systems Forensics may deviate from the original or expected requirements, resulting in higher costs than anticipated. Impact risk refers to the risk that the business or technology needs of the organization may not be met by the investment in Silver Tail Systems Forensics, resulting in lower overall total benefits. The greater the uncertainty, the wider the potential range of outcomes for cost and benefit estimates.
Quantitatively capturing investment and impact risk by directly adjusting the financial estimates results in more meaningful and accurate estimates and a more accurate projection of the ROI. In general, risks affect costs by raising the original estimates, and they affect benefits by reducing the original estimates. The risk-adjusted numbers should be taken as realistic expectations, as they represent the expected values considering risk.
The following implementation risks that affect costs are identified as part of this analysis:
• Implementation costs will vary based on the size of the organization. The interviewed organization needed 50 terabytes of data but had existing storage that it was able to use for this effort. Other organizations may have higher implementation costs.
• The engineering operations and security teams had skilled staff members who were able to quickly learn the Forensics solution. Other organizations may find that more training is required.
The following impact risks that affect benefits are identified as part of the analysis:
• Silver Tail Systems engineers had to conduct custom work for the interviewed organization because it had multiple online properties. With a single sign-on across all of its properties, user integration took longer than anticipated. Time for benefits will vary for organizations based on the amount of custom work that is required.
• Silver Tail Systems identifies anomalous behavior dynamically, making it a very effective tool for detecting emerging threats. An organization’s exposure to emerging threats will vary. As a result, the benefits it sees from a reduction in fraud losses associated with emerging threats will vary.
Table 16 shows the values used to adjust for risk and uncertainty in the cost and benefit estimates. The TEI model uses a triangular distribution method to calculate risk-adjusted values. To construct the distribution, it is necessary to first estimate the low, most likely, and high values that could occur within the current environment. The risk-adjusted value is the mean of the distribution of those points. Readers are urged to apply their own risk ranges based on their own degree of confidence in the cost and benefit estimates.

Forrester Consulting
The Total Economic Impact Of Silver Tail Systems
Page 20
Table 16 Cost And Benefit Risk Adjustments
Costs Low Most likely High Mean
Implementation costs 98% 100% 105% 101%
Training fees 98% 100% 105% 101%
Hardware costs 100% 100% 125% 108%
Software license fees 98% 100% 105% 101%
Administrative costs for the security team 100% 100% 125% 108%
Administrative costs for the engineering operations team 98% 100% 105% 101%
Benefits Low Most likely High Mean
Reduction in fraud losses for customer acquisition 80% 100% 103% 94%
Reduction in fraud losses for rebates and incentives 80% 100% 103% 94%
Reduction in fraud losses in the online marketplace 80% 100% 103% 94%
Productivity savings for the engineering operations team 92% 100% 105% 99%
Productivity savings for the security team 92% 100% 105% 99%
Source: Forrester Research, Inc.
Readers are urged to apply their own risk ranges based on their own degree of confidence in the cost and benefit estimates.

Forrester Consulting
The Total Economic Impact Of Silver Tail Systems
Page 21
Financial Summary The financial results calculated in the Costs and Benefits sections can be used to determine the ROI, NPV, and payback period for the organization’s investment in Silver Tail Systems Forensics. These are shown in Table 17 below.
Table 17 Cash Flow: Non-Risk-Adjusted
Cash flow analysis (original estimates)
Summary Initial Year 1 Year 2 Year 3 Total Present value
Total costs ($43,980) ($1,397,800) ($1,397,800) ($1,397,800) ($4,237,380) ($3,520,102)
Total benefits $0 $4,005,000 $1,341,000 $1,533,000 $6,879,000 $6,069,715
Total ($43,980) $2,607,200 ($56,800) $135,200 $2,641,620 $2,549,613
ROI
72%
Running total ($43,980) $2,563,220 $2,506,420 $2,641,620
Payback period (months)
0.2 0.0 0.0
0.2
Source: Forrester Research, Inc.
Table 18 below shows the risk-adjusted ROI, NPV, and payback period values. These values are determined by applying the risk-adjustment values from Table 16 in the Risk section to the cost and benefits numbers in Tables 9 and 15.

Forrester Consulting
The Total Economic Impact Of Silver Tail Systems
Page 22
Table 18 Cash Flow: Risk-Adjusted
Cash flow analysis (risk-adjusted estimates)
Summary Initial Year 1 Year 2 Year 3 Total Present value
Total costs ($46,380) ($1,421,060) ($1,421,060) ($1,421,060) ($4,309,560) ($3,580,346)
Total benefits $0 $3,802,950 $1,298,790 $1,479,270 $6,581,010 $5,800,654
Total ($46,380) $2,381,890 ($122,270) $58,210 $2,271,450 $2,220,308
ROI
62%
Running total ($46,380) $2,335,510 $2,213,240 $2,271,450
Payback period (months)
0.2 0.0 0.0
0.2
Source: Forrester Research, Inc.

Forrester Consulting
The Total Economic Impact Of Silver Tail Systems
Page 23
Silver Tail Systems Forensics: Overview According to Silver Tail Systems, the company’s software solution allows a business owner to explore the use of his or her site by displaying the usage of the site on a per-page, per-user, or per-IP level. A search interface provides deep access into the activity on the website using any dimension. When suspicious activity is identified, Silver Tail Systems Forensics enables the business user or security analyst to obtain a full understanding of the bad actors and their specific behaviors and how those behaviors differ from legitimate users.
Through web session intelligence, Silver Tail Systems Forensics uses data about every click on the website to create models of what is normal. Two types of behavioral models are created: population-based models and user-specific models. Population-based models show how an individual session is similar to or different from other users’ sessions. User-specific models look deep at an individual user to identify when their behavior differs from their previous behavior.
Silver Tail Systems Forensics also provides alerting and reporting. System-generated alerts will notify security analysts, IT experts, and business owners of particular events on the website. In addition, alerts can be customized to the needs of the website owner. Alerts can be sent through email and short message service or into the website’s workflow system.

Forrester Consulting
The Total Economic Impact Of Silver Tail Systems
Page 24
Appendix A: Total Economic Impact™ Overview Total Economic Impact is a methodology developed by Forrester Research that enhances a company’s technology decision-making processes and assists vendors in communicating the value proposition of their products and services to clients. The TEI methodology helps companies demonstrate, justify, and realize the tangible value of IT initiatives to both senior management and other key business stakeholders.
The TEI methodology consists of four components to evaluate investment value: benefits, costs, risks, and flexibility.
Benefits Benefits represent the value delivered to the user organization — IT and/or business units — by the proposed product or project. Often, product or project justification exercises focus just on IT cost and cost reduction, leaving little room to analyze the effect of the technology on the entire organization. The TEI methodology and the resulting financial model place equal weight on the measure of benefits and the measure of costs, allowing for a full examination of the effect of the technology on the entire organization. Calculation of benefit estimates involves a clear dialogue with the user organization to understand the specific value that is created. In addition, Forrester requires that there be a clear line of accountability established between the measurement and justification of benefit estimates after the project has been completed. This ensures that benefit estimates tie back directly to the bottom line.
Costs Costs represent the investment necessary to capture the value, or benefits, of the proposed project. IT or the business units may incur costs in the form of fully burdened labor, subcontractors, or materials. Costs consider all of the investments and expenses necessary to deliver the proposed value. In addition, the cost category within TEI captures any incremental costs over the existing environment for ongoing costs associated with the solution. All costs must be tied to the benefits that are created.
Risk Risk measures the uncertainty of benefit and cost estimates contained within the investment. Uncertainty is measured in two ways: 1) the likelihood that the cost and benefit estimates will meet the original projections, and 2) the likelihood that the estimates will be measured and tracked over time. TEI applies a probability density function known as “triangular distribution” to the values entered. At minimum, three values are calculated to estimate the underlying range around each cost and benefit.
Flexibility Within the TEI methodology, direct benefits represent one part of the investment value. While direct benefits can typically be the primary way to justify a project, Forrester believes that organizations should be able to measure the strategic value of an investment. Flexibility represents the value that can be obtained for some future additional investment building on top of the initial investment already made. For instance, an investment in an enterprisewide upgrade of an office productivity suite can potentially increase standardization (to increase efficiency) and reduce licensing costs. However, an embedded collaboration feature may translate to greater worker productivity if activated. The collaboration can only be used with additional investment in training at some future point in time. However,
Forrester Consulting
The Total Economic Impact Of Silver Tail Systems
Page 25
having the ability to capture that benefit has a present value that can be estimated. The flexibility component of TEI captures that value.
Appendix B: Glossary Discount rate: The interest rate used in cash flow analysis to take into account the time value of money. Although the Federal Reserve Bank sets a discount rate, companies often set a discount rate based on their business and investment environment. Forrester assumes a yearly discount rate of 10% for this analysis. Organizations typically use discount rates between 8% and 16% based on their current environment. Readers are urged to consult their respective organization to determine the most appropriate discount rate to use in their own environment.
Net present value (NPV): The present or current value of (discounted) future net cash flows given an interest rate (the discount rate). A positive project NPV normally indicates that the investment should be made, unless other projects have higher NPVs.
Present value (PV): The present or current value of (discounted) cost and benefit estimates given at an interest rate (the discount rate). The PV of costs and benefits feed into the total net present value of cash flows.
Payback period: The breakeven point for an investment. This is the point in time at which net benefits (benefits minus costs) equal initial investment or cost.
Return on investment (ROI): A measure of a project’s expected return in percentage terms. ROI is calculated by dividing net benefits (benefits minus costs) by costs.
A Note On Cash Flow Tables The following is a note on the cash flow tables used in this study (see the example table below). The initial investment column contains costs incurred at “time 0” or at the beginning of Year 1. Those costs are not discounted. All other cash flows in Years 1 through 3 are discounted using the discount rate (shown in Framework Assumptions section) at the end of the year. PV calculations are calculated for each total cost and benefit estimate. NPV calculations are not calculated until the summary tables and are the sum of the initial investment and the discounted cash flows in each year.
Table [Example] Example Table
Ref. Category Calculation Initial cost Year 1 Year 2 Year 3 Total
Source: Forrester Research, Inc.

Forrester Consulting
The Total Economic Impact Of Silver Tail Systems
Page 26
Appendix C: Endnotes
1 Source: “US Online Retail Forecast, 2011 To 2016,” Forrester Research, Inc., February 27, 2012.
2 Forrester risk-adjusts the summary financial metrics to take into account the potential uncertainty of the cost and benefit estimates. For more information on Risk, please see page 20.