the top 20 korean multinationals: changes and continued
TRANSCRIPT
page 1 of 45
The Top 20 Korean Multinationals: Changes and Continued Growth of Foreign Investment
Seoul and New York, March 5, 2015
Graduate School of International Studies at Seoul National University in Seoul, and the Columbia Center on Sustainable Investment (CCSI), a joint center of the Columbia Law School and the Earth Institute at Columbia University in New York, are releasing the results of their survey of Korean multinationals today. The survey, conducted during 2014, is part of a long-term study of the rapid global expansion of multinational enterprises (MNEs) from emerging markets.1 The research for this report was conducted in 2014 and covers the period from 2011 to 2013.2
Highlights
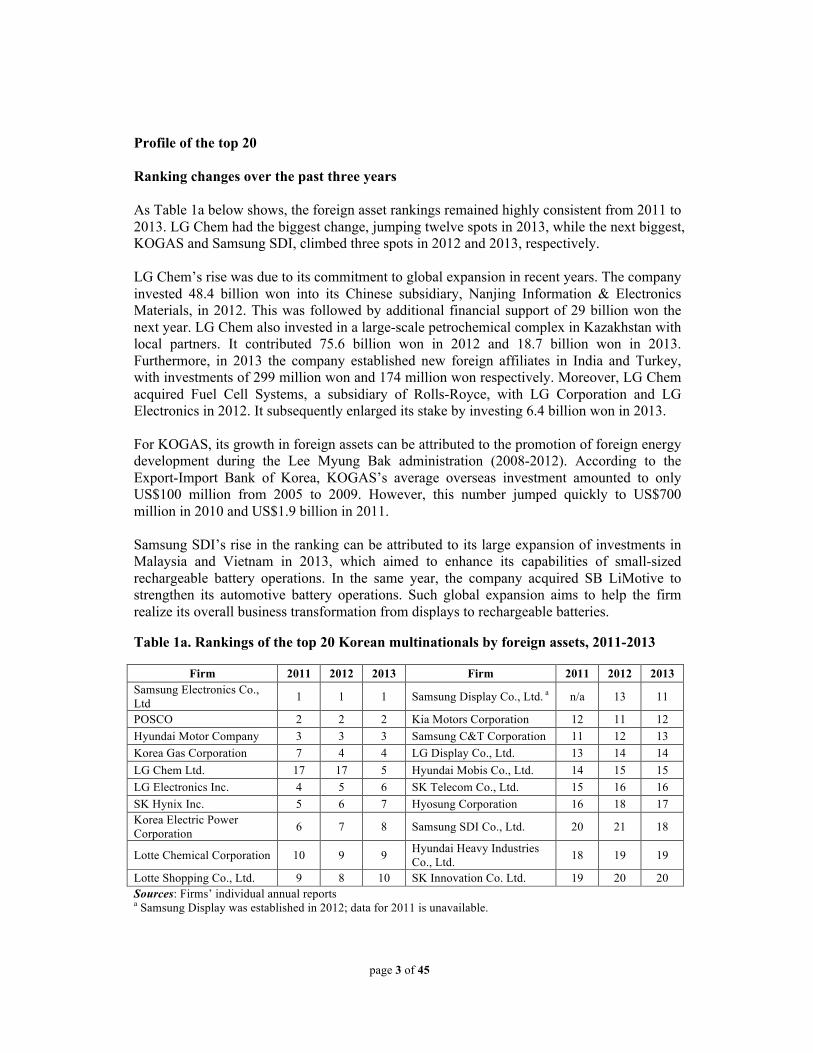
In 2013, the top 20 Korean multinationals, ranked by their foreign assets (See Table 1), jointly held US$68.9 billion assets abroad.3 Most firms were subsidiaries of Korea’s eight leading business groups (or chaebols), including Samsung, POSCO, LG, Hyundai Heavy Industries, Hyundai-Kia Motors, SK, Lotte, and Hyosung Group. Five out of the 20 multinationals were also included in UNCTAD’s “Top 100 non-financial TNCs from developing and transition economies” in 2012.4 The average age of the top 20 firms is about 47 years, which is two times the average age of Korea’s top 1,000 firms (ranked in terms of total assets).
There is a high concentration by the top players in the list in terms of foreign assets. Among the top 20 companies, Samsung Electronics, POSCO, and Hyundai Motor Company ranked in the top three in that order. There was a significant difference between first and second place, with the foreign assets of Samsung Electronics more than doubling that of POSCO. Furthermore, the top five firms together accounted for more than 60% of the foreign assets of the top 20.
��������������������������������������������������������1 Known as the ³Emerging Market Global Players” (EMGP) project, led internationally by CCSI. 2 This paper was prepared by Hwy-Chang Moon and Wenyan Yin, Seoul National University. The international
project named “Emerging Market Global Players,” is led by the Columbia Center on Sustainable Investment of Columbia University and has around 15 participating economies.
3 The exchange rates used to calculate all figures for the years 2011-2013 are those provided by the International Monetary Fund for December 30th for 2011 and 2013, and December 28th for 2012. 4 The five multinationals are Samsung Electronics, Hyundai Motor Company, POSCO, LG Electronics, and Hynix Semiconductor.
page 2 of 45
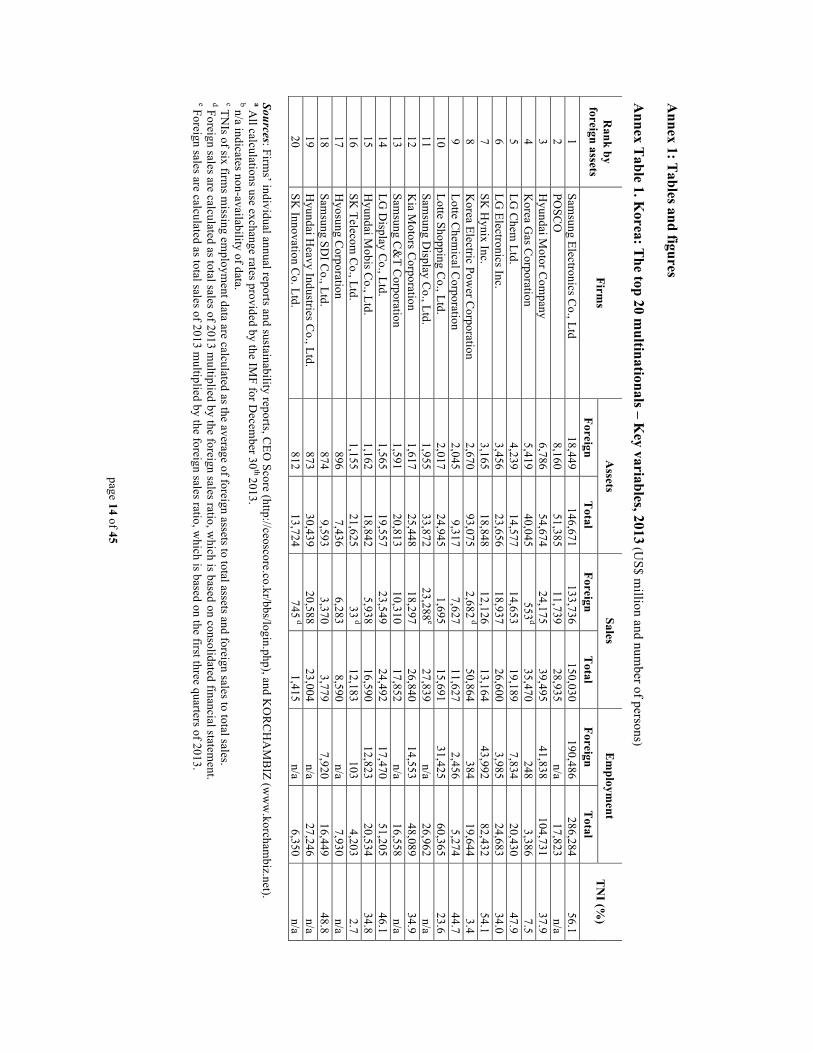
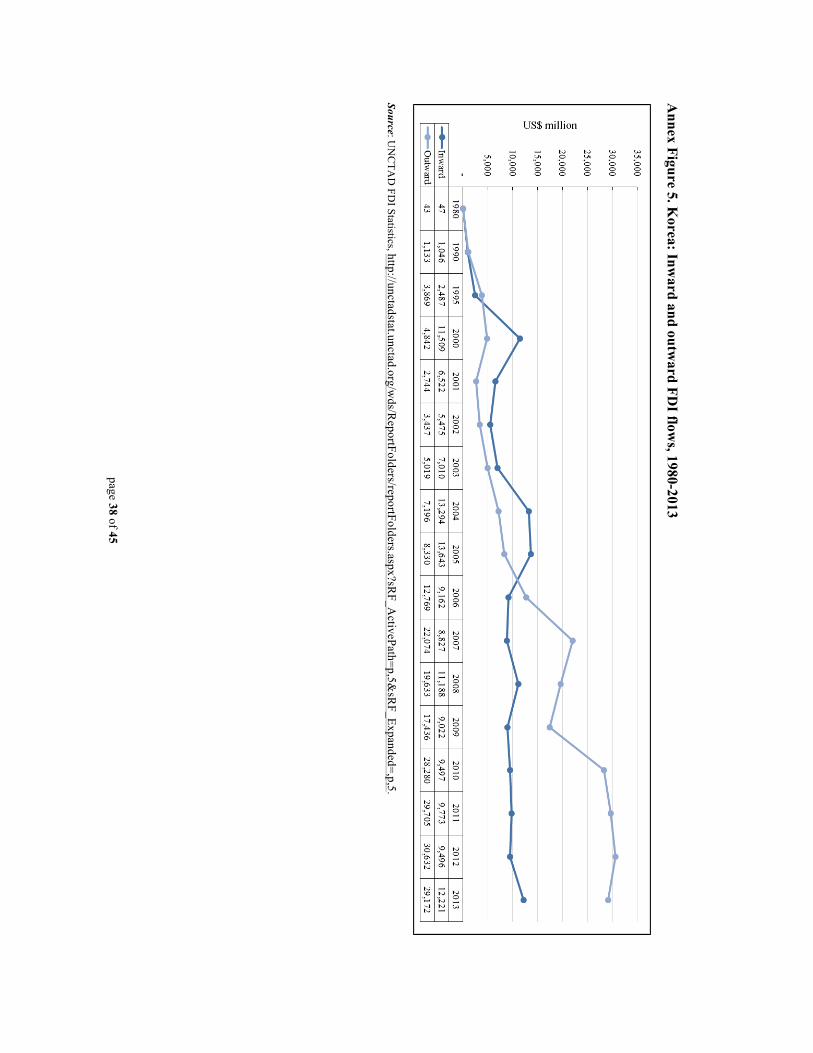
In 2013, the top 20 had US$340 billion in foreign sales (including exports) and 937 foreign affiliates. In terms of employment, 14 of the 20 firms together had 375,517 foreign employees (See Annex Table 1 and Tables 1a, 1b, and 1c for details). The list of top 20 firms includes two state-controlled firms, Korea Gas Corporation (KOGAS) and Korea Electric Power Corporation (KEPCO), with more than 50% of their shares owned by the government. The remaining firms are all non-state-owned. Although the growth rates of foreign assets and foreign sales of the top 20 MNEs decreased slightly in 2013, they still showed continuous overall growth (along with the number of foreign employees) over the three-year period from 2011 to 2013 (See Table 2 and the discussion immediately preceding it for further details). The main objective of outward FDI is to reduce production costs, secure natural resources, and expand foreign markets. After a substantial decline in 2009, Korea’s total outward FDI flow increased for the next three years. However, it faced another decline in 2013 because of sharp reduction in investment in the sectors of mining and professional services (See Annex Figure 5). The outward FDI stock exceeded inward FDI stock for the first time in 2008, and the gap between the two has increased ever since (See Annex Figure 6). Table 1. Rankings of the top 20 Korean multinationals investing abroad, 2013a (USD million)
Rank Name of company Industry Status
(% of state ownership)b
Foreign assetsc
1 Samsung Electronics Co., Ltd. Conglomerate Listed (Nil) 18,449
2 POSCO Conglomerate Listed (Nil) 8,160
3 Hyundai Motor Company Conglomerate Listed (Nil) 6,786
4 Korea Gas Corporation Gas utility Listed (54.56%) 5,419
5 LG Chem Ltd. Conglomerate Listed (Nil) 4,239
6 LG Electronics Inc. Conglomerate Listed (Nil) 3,456
7 SK Hynix Inc. Semiconductors & related devices Listed (Nil) 3,165
8 Korea Electric Power Corporation Electricity Listed (51.10%) 2,670
9 Lotte Chemical Corporation Petrochemicals Listed (Nil) 2,045
10 Lotte Shopping Co., Ltd. Conglomerate Listed (Nil) 2,017
11 Samsung Display Co., Ltd. Display panel Unlisted (Nil) 1,955
12 Kia Motors Corporation Motor vehicles Listed (Nil) 1,617
13 Samsung C&T Corporation Conglomerate Listed (Nil) 1,591
14 LG Display Co., Ltd. Display panel Listed (Nil) 1,565
15 Hyundai Mobis Co., Ltd. Automotive parts Listed (Nil) 1,162
16 SK Telecom Co., Ltd. Telecommunications Listed (Nil) 1,155
17 Hyosung Corporation Conglomerate Listed (Nil) 896
18 Samsung SDI Co., Ltd. Display panel and battery Listed (Nil) 874
19 Hyundai Heavy Industries Co., Ltd. Conglomerate Listed (Nil) 873
20 SK Innovation Co. Ltd. Conglomerate Listed (Nil) 812 Total 68,907 Sources: Firms’ individual annual reports
a The percentage of state ownership shown in parentheses covers direct state holdings as well as indirect holdings through state-controlled enterprises.
b Foreign assets represent the amount of capital investment in foreign affiliates and subsidiaries.
page 3 of 45
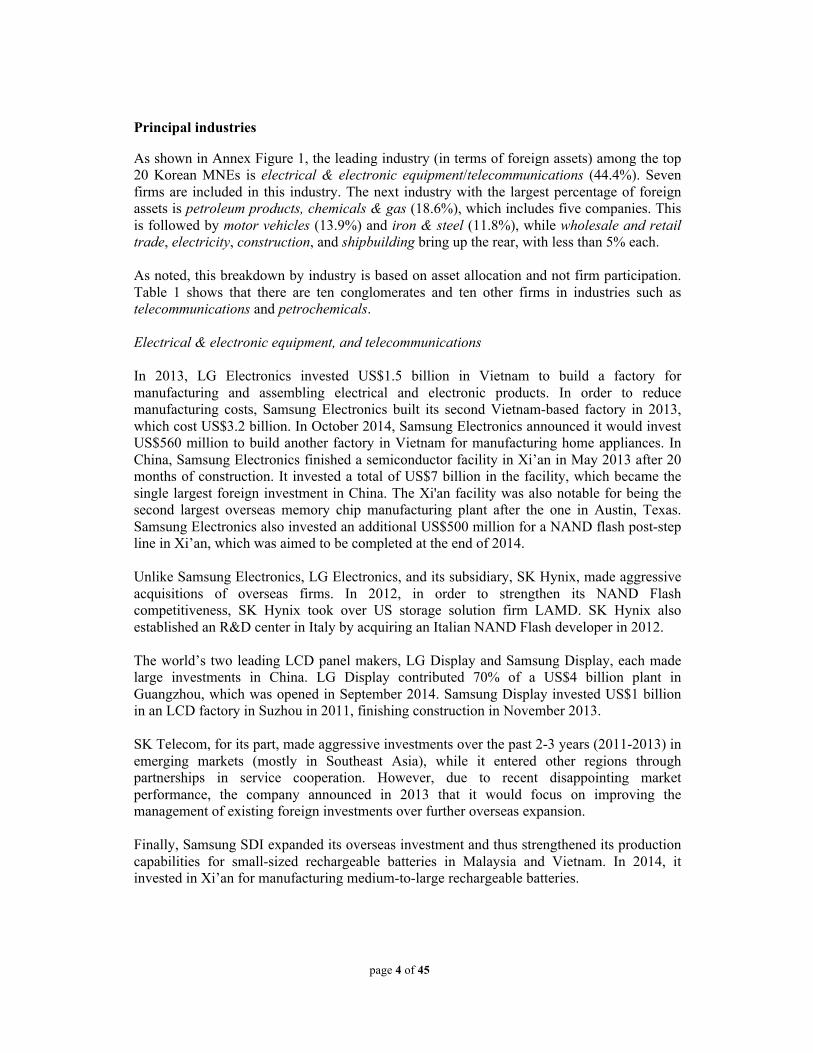
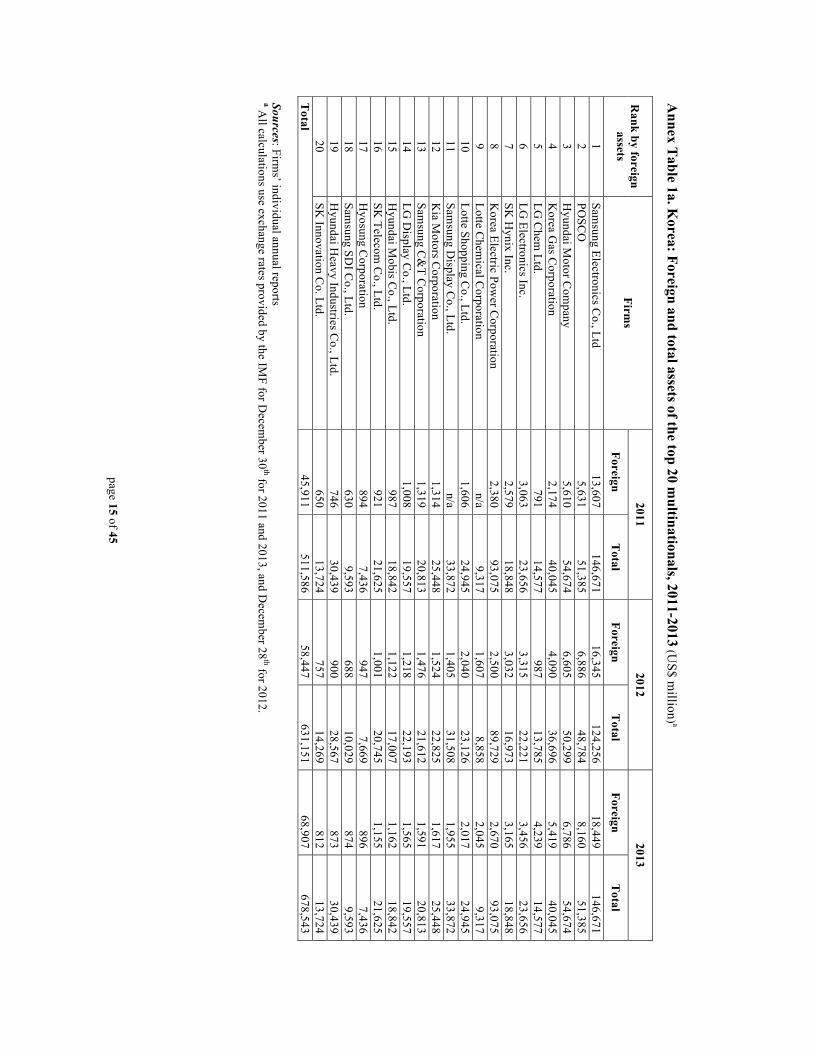
Profile of the top 20 Ranking changes over the past three years As Table 1a below shows, the foreign asset rankings remained highly consistent from 2011 to 2013. LG Chem had the biggest change, jumping twelve spots in 2013, while the next biggest, KOGAS and Samsung SDI, climbed three spots in 2012 and 2013, respectively. LG Chem’s rise was due to its commitment to global expansion in recent years. The company invested 48.4 billion won into its Chinese subsidiary, Nanjing Information & Electronics Materials, in 2012. This was followed by additional financial support of 29 billion won the next year. LG Chem also invested in a large-scale petrochemical complex in Kazakhstan with local partners. It contributed 75.6 billion won in 2012 and 18.7 billion won in 2013. Furthermore, in 2013 the company established new foreign affiliates in India and Turkey, with investments of 299 million won and 174 million won respectively. Moreover, LG Chem acquired Fuel Cell Systems, a subsidiary of Rolls-Royce, with LG Corporation and LG Electronics in 2012. It subsequently enlarged its stake by investing 6.4 billion won in 2013. For KOGAS, its growth in foreign assets can be attributed to the promotion of foreign energy development during the Lee Myung Bak administration (2008-2012). According to the Export-Import Bank of Korea, KOGAS’s average overseas investment amounted to only US$100 million from 2005 to 2009. However, this number jumped quickly to US$700 million in 2010 and US$1.9 billion in 2011. Samsung SDI’s rise in the ranking can be attributed to its large expansion of investments in Malaysia and Vietnam in 2013, which aimed to enhance its capabilities of small-sized rechargeable battery operations. In the same year, the company acquired SB LiMotive to strengthen its automotive battery operations. Such global expansion aims to help the firm realize its overall business transformation from displays to rechargeable batteries. Table 1a. Rankings of the top 20 Korean multinationals by foreign assets, 2011-2013
Firm 2011 2012 2013 Firm 2011 2012 2013 Samsung Electronics Co., Ltd 1 1 1 Samsung Display Co., Ltd. a n/a 13 11
POSCO 2 2 2 Kia Motors Corporation 12 11 12 Hyundai Motor Company 3 3 3 Samsung C&T Corporation 11 12 13 Korea Gas Corporation 7 4 4 LG Display Co., Ltd. 13 14 14 LG Chem Ltd. 17 17 5 Hyundai Mobis Co., Ltd. 14 15 15 LG Electronics Inc. 4 5 6 SK Telecom Co., Ltd. 15 16 16 SK Hynix Inc. 5 6 7 Hyosung Corporation 16 18 17 Korea Electric Power Corporation 6 7 8 Samsung SDI Co., Ltd. 20 21 18
Lotte Chemical Corporation 10 9 9 Hyundai Heavy Industries Co., Ltd. 18 19 19
Lotte Shopping Co., Ltd. 9 8 10 SK Innovation Co. Ltd. 19 20 20 Sources: Firms’ individual annual reports a Samsung Display was established in 2012; data for 2011 is unavailable.
page 4 of 45
Principal industries As shown in Annex Figure 1, the leading industry (in terms of foreign assets) among the top 20 Korean MNEs is electrical & electronic equipment/telecommunications (44.4%). Seven firms are included in this industry. The next industry with the largest percentage of foreign assets is petroleum products, chemicals & gas (18.6%), which includes five companies. This is followed by motor vehicles (13.9%) and iron & steel (11.8%), while wholesale and retail trade, electricity, construction, and shipbuilding bring up the rear, with less than 5% each. As noted, this breakdown by industry is based on asset allocation and not firm participation. Table 1 shows that there are ten conglomerates and ten other firms in industries such as telecommunications and petrochemicals. Electrical & electronic equipment, and telecommunications In 2013, LG Electronics invested US$1.5 billion in Vietnam to build a factory for manufacturing and assembling electrical and electronic products. In order to reduce manufacturing costs, Samsung Electronics built its second Vietnam-based factory in 2013, which cost US$3.2 billion. In October 2014, Samsung Electronics announced it would invest US$560 million to build another factory in Vietnam for manufacturing home appliances. In China, Samsung Electronics finished a semiconductor facility in Xi’an in May 2013 after 20 months of construction. It invested a total of US$7 billion in the facility, which became the single largest foreign investment in China. The Xi'an facility was also notable for being the second largest overseas memory chip manufacturing plant after the one in Austin, Texas. Samsung Electronics also invested an additional US$500 million for a NAND flash post-step line in Xi’an, which was aimed to be completed at the end of 2014. Unlike Samsung Electronics, LG Electronics, and its subsidiary, SK Hynix, made aggressive acquisitions of overseas firms. In 2012, in order to strengthen its NAND Flash competitiveness, SK Hynix took over US storage solution firm LAMD. SK Hynix also established an R&D center in Italy by acquiring an Italian NAND Flash developer in 2012. The world’s two leading LCD panel makers, LG Display and Samsung Display, each made large investments in China. LG Display contributed 70% of a US$4 billion plant in Guangzhou, which was opened in September 2014. Samsung Display invested US$1 billion in an LCD factory in Suzhou in 2011, finishing construction in November 2013. SK Telecom, for its part, made aggressive investments over the past 2-3 years (2011-2013) in emerging markets (mostly in Southeast Asia), while it entered other regions through partnerships in service cooperation. However, due to recent disappointing market performance, the company announced in 2013 that it would focus on improving the management of existing foreign investments over further overseas expansion. Finally, Samsung SDI expanded its overseas investment and thus strengthened its production capabilities for small-sized rechargeable batteries in Malaysia and Vietnam. In 2014, it invested in Xi’an for manufacturing medium-to-large rechargeable batteries.

page 5 of 45
Petroleum products, chemicals & gas South Korea strongly promoted investment in energy during the five years of the Lee Myung Bak administration. KOGAS acquired stakes in Australia, Uzbekistan, and Iraq over the five years from 2008 to 2012, but has performed poorly and is now considering selling some of its current foreign assets. Due to poor profitability of these investments, the current government is reviewing its overseas investments in oil and gas by focusing on the quality of investment over expansion. Lotte Chemical was newly formed in 2012 by merging Honam Petrochemical and KP Chemical. It subsequently expanded overseas into the Chinese and Southeast Asian markets. The company claimed in 2012 that it would invest US$5 billion in Indonesia for a large-scale petrochemical complex, but because of difficulty in buying the land, it is still negotiating with local partners. LG Chem and KPI (Kazakhstan Petrochemical Industries) jointly invested US$4 billion in Atyrau, Kazakhstan, to secure access to low-cost raw materials for producing polyethylene. Rounding out the list, SK Innovation has been looking for new opportunities for overseas investment in energy after selling off three offshore oil fields in Brazil. Recently, it acquired two oil fields in Oklahoma and Texas, becoming the first Korean company to produce shale gas/oil overseas. In 2013, SK Innovation formed a joint venture with China’s largest national oil company, Sinopec, to establish the Wuhan Ethylene Corporation. Motor vehicles Hyundai Motor, third in the ranking, expanded its global factories in emerging markets, particularly China and Brazil. The company finished its third plant in China in 2012 and, in early 2014, announced that it would construct two new plants in Chongqing and Changzhou. Hyundai Motor also opened a US$700 million plant in Sao Paulo in September 2012, in order to expand its presence in Brazil and the Latin American region in general. Kia Motors, twelfth in the ranking, in 2012 announced a plan to invest US$1.6 billion on new equipment and tools for enhancing the production efficiency of WestPoint factory. Kia also decided to invest US$1 billion in 2014 to build a new factory in Mexico to meet the demand of the Americas region. Finally, Hyundai Mobis, fifteenth among the top 20, actively expanded its overseas factories, thanks to the increasing demand for Hyundai and Kia’s automobiles. In 2012, Hyundai Mobis invested US$33 million for building module manufacturing plant in Izmir, Turkey. Construction was completed in September 2013. In 2014, it announced that it would build an automobile lamp plant in the Czech Republic by 2017. With this it hopes to reduce logistics costs while serving the European regional market. Iron and steel POSCO, at number two in the list, actively expanded overseas investment in order to reduce its reliance on the domestic market. In 2012, POSCO took a 15% stake in Gina Rinehart’s iron ore mining project, Roy Hill, for roughly US$1.7 billion. Also that year, it invested
page 6 of 45
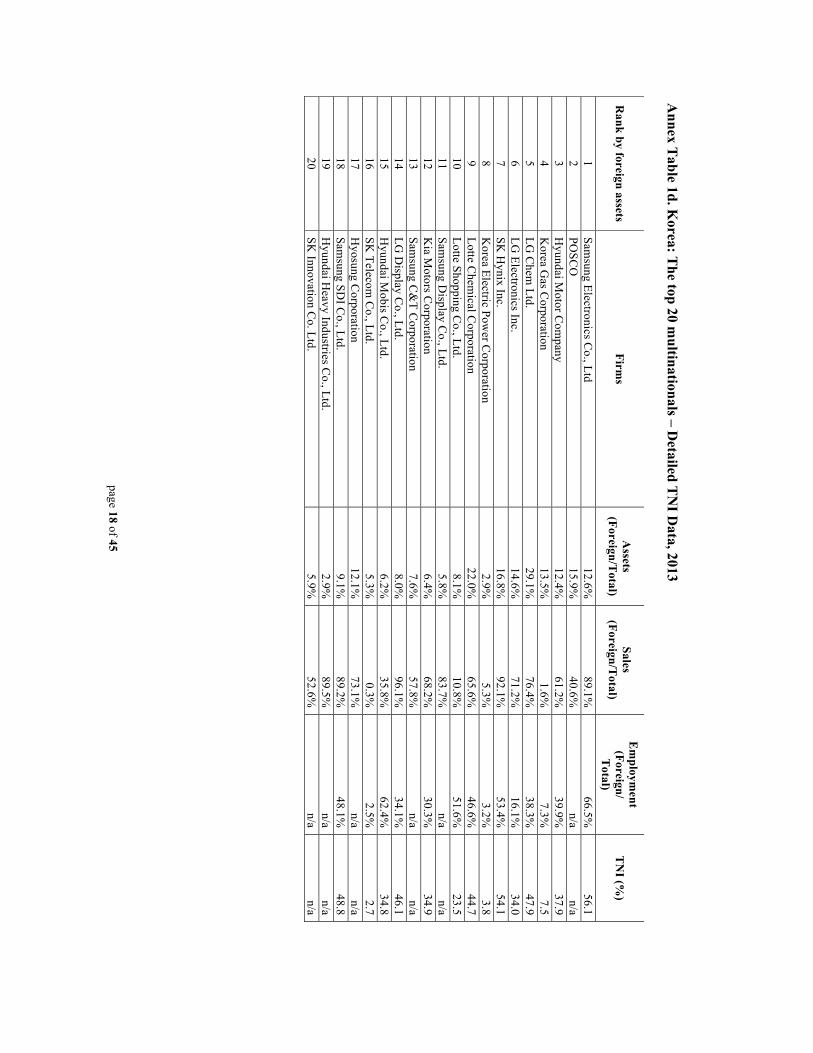
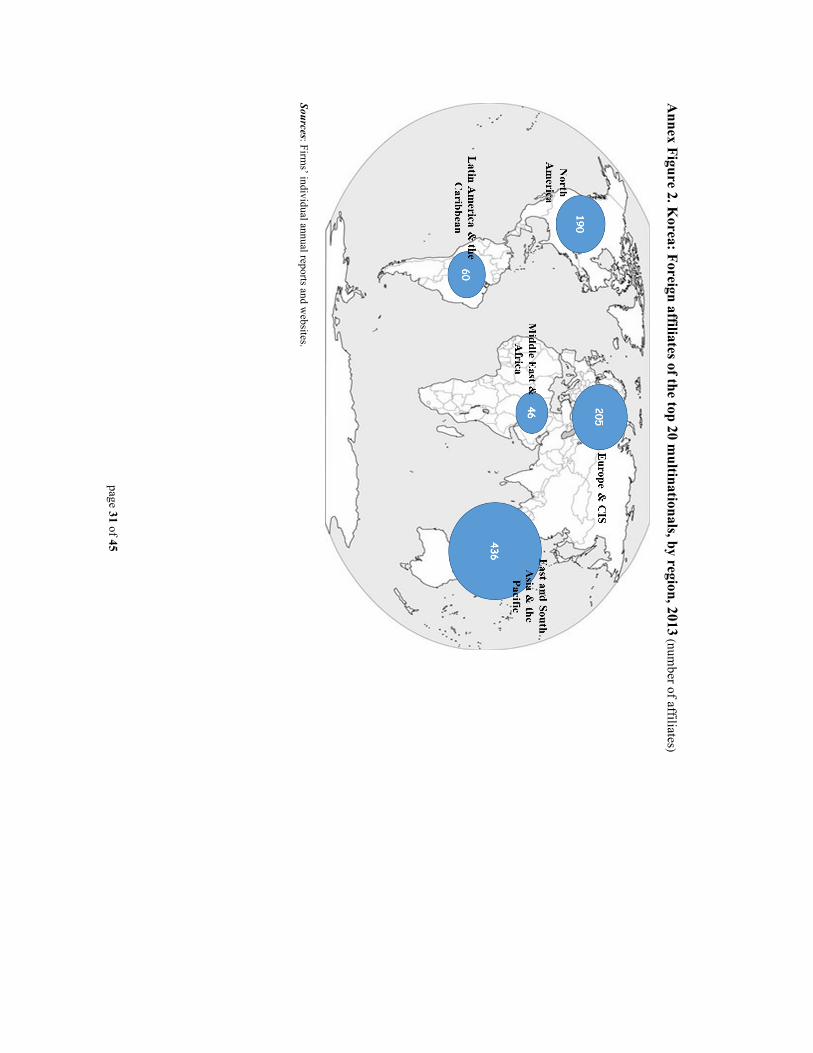
US$12 billion in a project in Odisha, India, which was India’s largest FDI inflow by a single investor at that time. In 2013, POSCO formed a joint venture with Chongqing Iron and Steel Company in China to build a 3-million-ton capacity FINEX integrated steelwork facility. However, these acquisitions have left POSCO with a debt burden and performance deterioration.. Geographic distribution of foreign affiliates Although the geographic distribution of Korean foreign affiliates varies by industry, about half of them are located in East Asia, South Asia, and the Pacific (including Oceania) (46.5%). This is followed by Europe & CIS (21.9%), North America (20.3%), and South America (6.4%). Middle East and Africa is the region with the lowest number at 4.9%. (See Annex Figure 2) Transnationality Index (TNI) TNI is a measure of the internationalization of corporate activity. It is calculated as a simple average of three ratios: foreign assets to total assets, foreign sales to total sales, and foreign employment to total employment (See Annex Table 1d). As foreign employment data for six companies were not available (POSCO, Samsung Display Co., Ltd., Samsung C&T Corp., Hyosung Corp., Hyundai Heavy Industries Co., Ltd., and SK Innovation Co., Ltd.), only 14 multinationals are included in the ranking by TNI scores. Samsung Electronics had the highest TNI at 56.1, followed closely by SK Hynix (54.1) and Samsung SDI (48.8). All of the top three companies belong to the electronics industry. The next three firms in terms of their TNIs have TNIs in the 40s, and belong to either the chemical or electronics industries (LG Chem, 47.9; LG Display, 46.1; and Lotte Chemical, 44.7). The 7th to 11th firms have TNIs in the 20s and 30s. These firms mostly belong to the automobile and wholesale & retail trade industries. KOGAS, KEPCO, and SK Telecommunications ranked in the bottom, with two of the three being state-owned companies. The TNIs of these firms are all lower than 8, which is far lower than the other 11 firms. Ownership and public status Box 1: Common governance structures among the top 20 An important characteristic of Korea’s top 20 multinationals is that most of them belong (or recently belonged) to what are known in Korea as chaebols. A chaebol is a loosely organized family-controlled business group, much like the Japanese keiretsu (formerly zaibatsu). Unlike keiretsus, however, chaebols are not centered on banks. The chaebols were strongly supported by the government in the beginning of Korea’s economic development in the 1960s, and they played a key role in Korea’s emergence as one of the “newly industrialized economies (NIEs).” However, after the 1997 Asian financial crisis, the previously close relationships between the government and chaebols were strained. Chaebols are regarded as the cause of crisis, and barriers to a fair and competitive market system. Therefore, the government strengthened regulations and monitoring of chaebols, and promoted a series of structural reforms for corporate governance. Public support for the chaebol system declined, and as a result, chaebols were forced to become more transparent, operate on a market-based system, and cooperate with small and medium sized enterprises for sustainable and balanced growth. Most of the top 20 firms belong to the following eight chaebols below (in italics): Samsung Group: Samsung Electronics, Samsung SDI, Samsung C&T POSCO Group: POSCO Hyundai Heavy Industries Group: Hyundai Heavy Industries Hyundai-Kia Motors Group: Hyundai Motor, KIA Motors, Hyundai Mobis LG Group: LG Chem, LG Electronics, LG Display

page 7 of 45
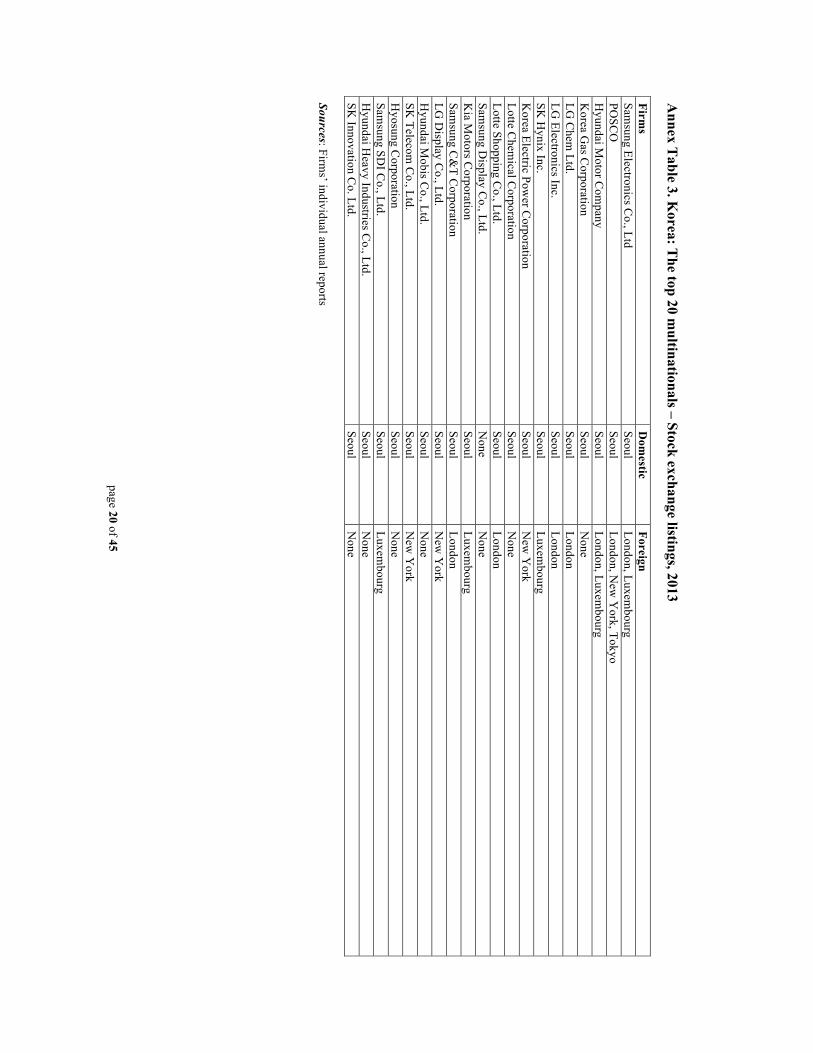
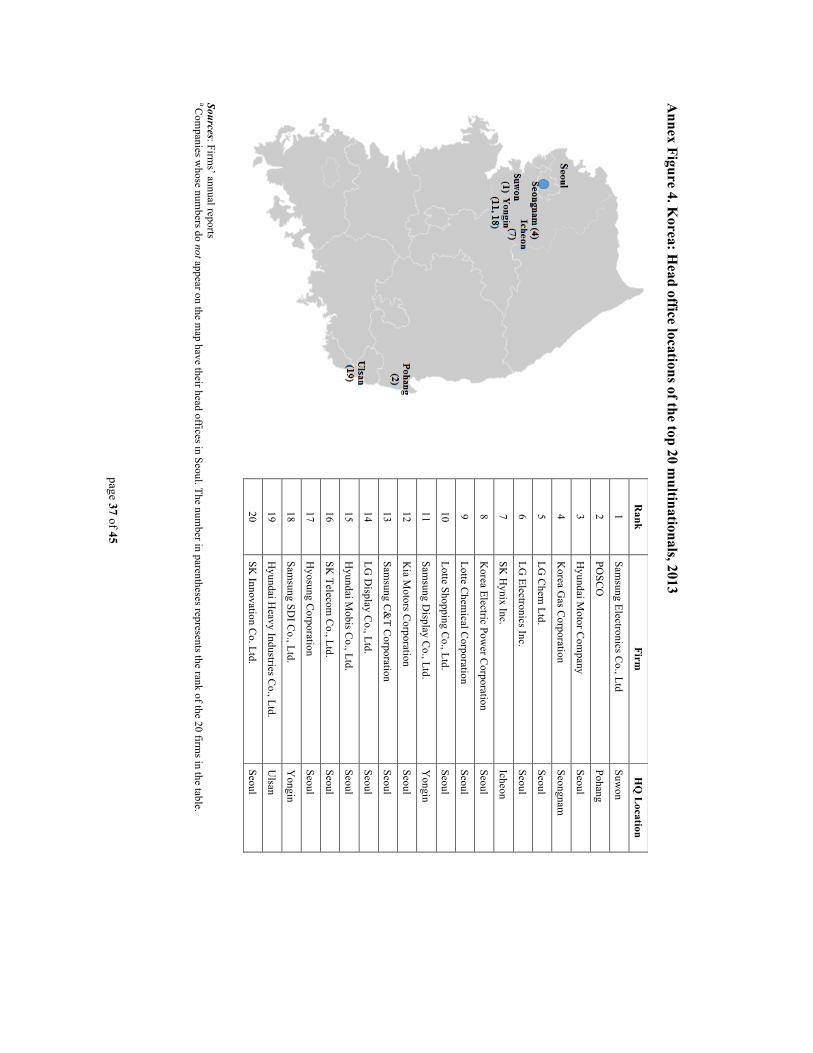
SK Group: SK Hynix, SK Telecom, SK Innovation Lotte Group: Lotte Chemical, Lotte Shopping Hyosung Group: Hyosung Corporation Lotte Chemical was formed when Honam Petrochemical and KP Chemical merged in 2012. Honam Petrochemical started as a state-run firm in 1976 but became a part of Lotte Group in 1979 when it sold half of its shares to Lotte in response to privatization efforts by the Korean government. All of the top 20 multinationals (except Samsung Display) are listed on the Korea Exchange (KRX), with 13 of them also listed on foreign stock exchanges. Among the top 20 firms, two firms (KOGAS and KEPCO) are state-controlled. The major shareholders of KOGAS are the state government (26.15%), KEPCO (20.47%), and the local government (7.94%), totaling 54.56% in public shares. KEPCO has 21.17% direct state ownership with another 29.93% owned indirectly through the Korea Finance Corporation (KoFC), a wholly state-owned enterprise. The remaining 18 firms are privately-owned companies. The average foreign share of ownership for the 20 multinationals is 31.55%. Eleven of the top 20 firms have 30% or higher foreign shareholdings. POSCO (52.9%) and Samsung Electronics (51.0%) have the highest share, with foreign majority ownerships exceeding 50%. Next is Hyundai Mobis (48.1%), followed by Hyundai Motor (43.6%), SK Telecom (43.5%), SK Hynix (42.8%), Kia Motors (33.9%), LG Chem (33.6%), SK Innovation (32.6%), and Hyosung (30.8%). Samsung Display, Samsung SDI, LG Display, KEPCO, and Samsung C&T have foreign shareholdings exceeding 20%, while LG Electronics, Lotte Shopping, and Hyundai Heavy Industries exceed 10%. KOGAS ranked last among the 20 firms at 7.51%. Head office locations Among the 20 multinationals, 13 of the headquarters are located in Seoul and seven in other Korean cities (Annex Figure 4). Of these seven, five are located close to Seoul, with Samsung Electronics in Suwon, SK Hynix in Icheon, KOGAS in Seongnam, and both Samsung Display and Samsung SDI in Yongin. The remaining two are located in the southeast of Korea – POSCO in Pohang and Hyundai Heavy Industries in Ulsan. Official language and nationality of the CEO and top management Korean is the official language at the headquarters of all firms. The nationalities of top management figures are also mostly Korean, but there has been an increasing number of foreigners both in Korea and abroad. Although the language in foreign affiliates depends on the location, most still use Korean as the primary language for communications convenience with headquarters. Headquarters also periodically send top officials or specialists to overseas subsidiaries with foreign managers in order to promote communications and enhance management and control. Drivers of outward FDI There are several motivations for FDI by the top 20 firms. One is to exploit lower labor costs of the host country. China has historically been the key destination for this purpose, but increases in Chinese labor costs over the last few years have prompted Korean firms to shift production to other countries like Vietnam. Samsung Electronics, for example, has already
page 8 of 45
established two plants in Vietnam, and the company has recently announced plans to build another plant of US$560 million in Ho Chi Minh City. Following this trend, LG Electronics and other Korean electronics firms are also making ventures into Vietnam. The second motivation is to seek natural resources. As shown in Annex Figure 1, “petroleum products, chemicals & gas” is the second largest industry in terms of foreign assets among the top 20 firms. As this industry is dependent on natural resources and energy, Korean firms have actively committed to securing natural resources overseas. During the Lee Myung Bak administration, the government promoted overseas investments in the resources and energy field. Because of the poor performance of these investments, however, firms began to reduce or sell off existing shares. Recently, discovery of shale oil in the United States has prompted some leading companies to invest in unconventional natural resources. The third driver is to search for the potential markets. As shown in Annex Figure 2, the Asian region has become the largest destination for overseas investment. This is not just due to low costs, but local Asian markets. For example, Hyundai Motor has committed to additional investment in Western China to tap into its less developed provinces. Because of the financial crisis and declining demand in the advanced countries, developing countries have become important options for market seeking investment by Korean firms. Kia Motors and Hyundai Motor have established new plants in Mexico and Brazil respectively, to explore untapped markets in the Americas. Another related motivation is expansion into the neighboring markets of investment countries. For instance, more than 90% of Samsung Electronics’ production in Vietnam is exported to other neighboring countries. Changes in assets, sales, and employment during 2011-2013 Table 2 shows a snapshot of changes in the collective assets, sales, and employment of the top 20 multinationals from 2011 to 2013. Annex tables 1a, 1b, and 1c provide detailed information for each company over the same period. Foreign assets grew by 20.7% in 2012. They continued to grow in 2013, albeit at a decreased rate of 17.4%. Total assets, in turn, grew by 15.6% in 2012 and a lesser 7.5% in 2013. The respective differences between the growth rates of foreign assets and total assets for each year imply that companies have accelerated their overseas investments over domestic investments over the past three years. In the case of sales, the trend is similar to that of foreign and total assets. The growth rates of foreign sales and total sales in 2013 decreased compared to 2012, but the gap between the two increased over the same period. As was the case for assets, the growth rates of foreign sales in both 2012 and 2013 are higher than that of total sales. In contrast to assets and sales, the growth rates of both foreign and total employment are higher in 2013 than 2012. This is because two key sources (Samsung Electronics and Lotte Shopping) of foreign employment among the 14 firms expanded their overseas employment dramatically in 2013. The number of foreign employees of Samsung Electronics, for example, increased by 14,142 in 2012, and increased substantially by more than 50,000 in 2013 because of its active commitment to construction of overseas factories. The expansion of Lotte Shopping’s foreign employment is more aggressive, particularly in China, Indonesia,

page 9 of 45
and Vietnam. The overall foreign employees increased by only 917 in 2012, but went up by 11,038 in 2013, which is more than 10 times that of the preceding year. Comparing the foreign shares of the three indices, it is evident that the ratio of foreign to total assets is much lower than that of the other two (about 1/6 level of the other two). The same data for the "100 largest non-financial TNCs from developing and transition economies” shows the foreign shares for all three variables are around 60% in 2013. Korea’s level of internationalization in terms of sales and employment is similar to the global standard, but internationalization of assets lags far behind. Consequently, there is much potential for Korean firms to expand foreign investment in the future. Table 2. Korea: Snapshot of the top 20 Korean multinationals, 2011-2013 (USD million and numbers of employees)
Variable 2011 2012 2013 % change
(2011-2012)
% change (2012-2013)
% change (2011-2013)
Assetsa Foreign 47,249 57,042 66,952 20.7% 17.4% 41.7% Total 518,765 599,643 644,671 15.6% 7.5% 24.3% Share of foreign in total (%) 9.1% 9.5% 10.4% Salesa Foreign 240,707 283,929 317,036 18.0% 11.7% 31.7% Total 426,352 493,885 525,811 15.8% 6.5% 23.3% Share of foreign in total (%) 56.5% 57.5% 60.3% Employmentb Foreign 287,722 327,877 375,517 14.0% 14.5% 30.5% Total 644,647 684,015 747,709 6.1% 9.3% 16.0% Share of foreign in total (%) 44.6% 47.9% 50.2% Sources: Firms’ individual annual reports and sustainability reports, KORCHAMBIZ (www.korchambiz.net). a Because Samsung Display has no data for 2011, it is excluded for all data (assets, sales, and employment) in the table, in order to make comparison for the three years. b Employment figures only include 14 companies. POSCO, Samsung Display, Samsung C&T, Hyosung, Hyundai Heavy Industry, and SK Innovation are omitted due to lack of data. The big picture Korea’s first recorded outward FDI took place in 1959 when a South Korean firm invested in real estate in New York. The first non-real estate investment involved an Indonesian forestry development project by the Korea Southern Area Development Company in 1968. Most investments from the 1960s to mid-1980s targeted natural resources, forestry, and trading, but the total amount remained marginal. Despite the 1997 Asian financial crisis, Korea’s FDI increased dramatically between 1995 and 1999. The increase can be attributed to several factors, such as the liberalization of government policy, domestic wage increases, appreciation of the Korean won, and efforts made by large Korean firms to overcome the economic downturn.

page 10 of 45
Table 3. Korea: Outward FDI, 2009-2013 (US$ million)
Year 2009 2010 2011 2012 2013 Investment 20,420 24,468 27,591 25,119 24,054 Growth (%) -14.7 19.8 12.8 -9.0 -4.2
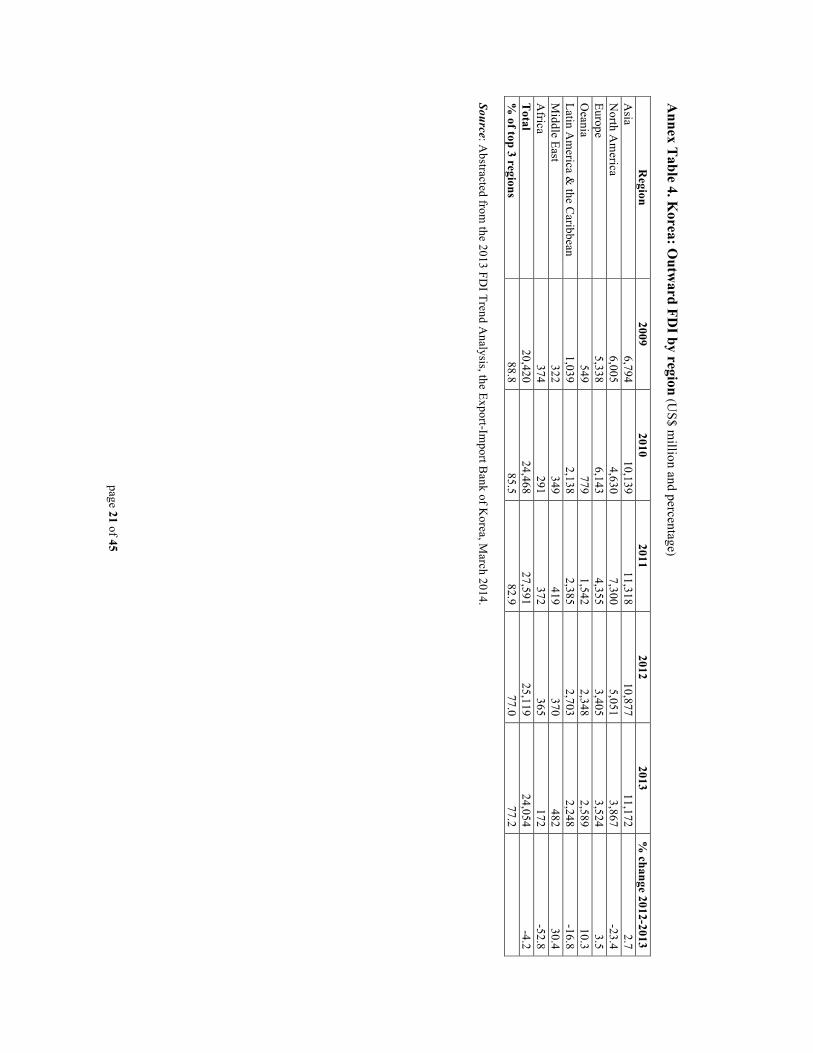
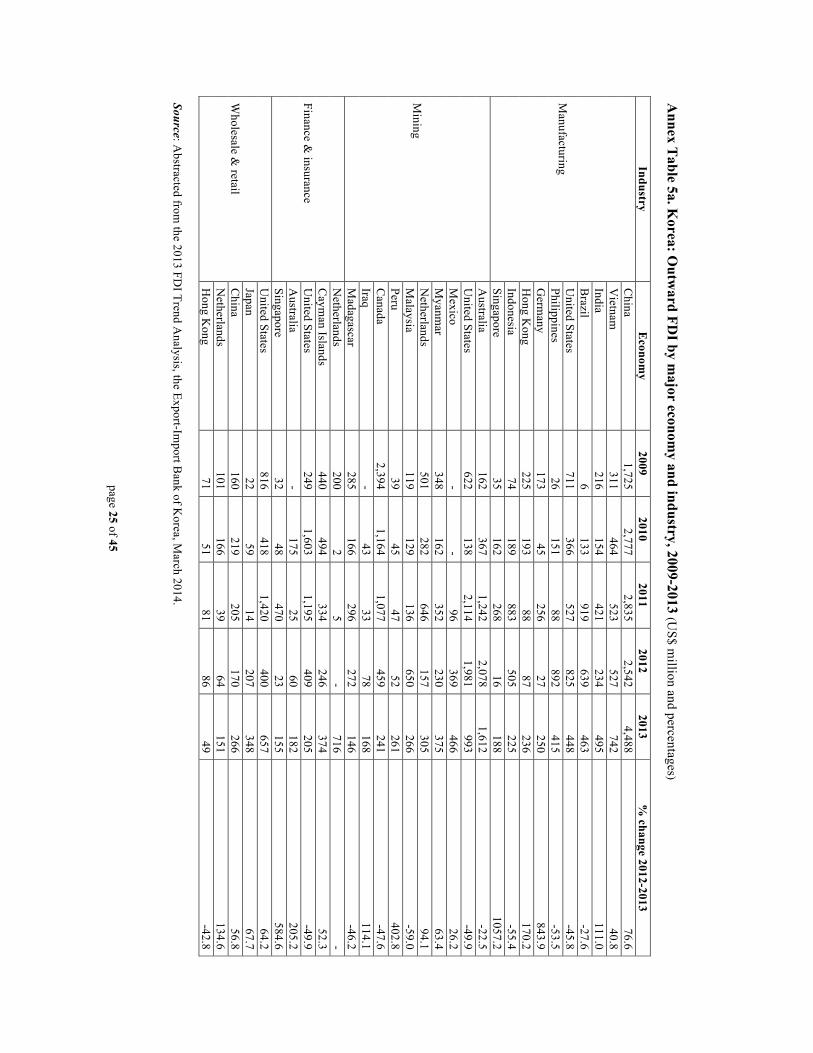
Source: Abstracted from the 2013 FDI Trend Analysis, the Export-Import Bank of Korea, March 2014. Korea’s outward FDI declined in 2009 because of the 2008 global financial crisis but recovered quickly with a 19.8% growth rate in 2010. Outward FDI continued to grow until 2011, albeit at a lower rate. However, several years of domestic and global economic recession, caused Korea’s overseas investments to shrink in 2012 and 2013 by 9% and 4.2% respectively. Until the 1990s, Korean investors targeted developed countries for investment, doing so in order to gain access to advanced technology, a better business environment, and a sophisticated and large consumer market. Since 2000, however, Korean investors have been turning more to untapped markets in Africa and Asia. The rapid growth in demand in these regions along with their large and inexpensive labor pools are big draws for Korean investors. In 2013, Asia became the largest destination for Korea’s FDI, accounting for almost half of all overseas investment. This was much higher than second and third recipient regions, North America (16.1%) and Europe (14.6%). The three regions together accounted for 77.2% of foreign investment in 2013, which is lower than the 88.8% in 2009. This reflects the diversification of Korean firms’ investments to other regions such as Oceania and Latin America & the Caribbean (See Annex Table 4). The Asian investment boom in 2013 was largely due to the substantial increase in investment in the manufacturing sector (42.2% compared to 2012). Investment increased for the top five Asian recipients except for Hong Kong. Also, the 2013 investment by Samsung Electronics in the semiconductor factory in Xi’an was the largest in the country since 2007. In contrast, investment in North America decreased because of a decline in investment in mining sector (49.4% compared to 2012). Oceania surpassed North America as the largest target of Korean firms’ investment in mining. Meanwhile, investment in Europe and Oceania experienced growth in 2013, with the rise of investment in the finance & insurance sector (See Annex Table 4a and 4b). Turning now to an analysis by industry, the top three targets for Korea’s overseas investments were manufacturing, mining, and finance & insurance. These three industries accounted for 71.5% of total investments in 2013, and this share has increased over the previous five years (See Annex Table 5). The manufacturing industry maintained its status as the top investment sector, except for in 2009 and 2010. Although China remains the dominant destination, accounting for about half of total investments in the manufacturing sector, investments in other countries such as India, Germany, and Singapore grew at a faster rate. Also, despite financial firms not being included in the top 20 list, the finance industry ranked third in outward FDI with the highest growth rate among all industries. As for the wholesale and retail industry, most of the targets were advanced countries. The recent notable increase in Japan was due to the mergers and acquisitions of Japanese food and cosmetic companies (See Annex Table 5 and 5a). In the five years from 2009 to 2013, more than 70% of Korea’s outward FDI was taken as majority equity ownership (more than 50%), which implies that Korean firms favor control of

page 11 of 45
local operations (See Annex Table 6). Regarding the scale of outward FDI, the share of investments exceeding US$100 million decreased from 45.2% in 2010 to 28.0% in 2013, suggesting a relative growth of small projects (See Annex Table 7). As shown in Annex Table 8a and 8b, the overall value of foreign investments decreased by 4.2% from 2012 to 2013, but the number of newly established foreign affiliates increased by 10.1% during the same period. Box 2. The development of outward FDI policies Korea’s outward FDI policies have continuously been adapted to changes in the country’s external environment and economic development. In 1968, the Bank of Korea authorized private foreign investments for the first time, albeit under quite severe restrictions. They required strict government approval and had to be aimed at developing natural resources, securing raw materials, or boosting exports. In 1981, the government authorization requirement was scrapped, and qualifications for investing abroad were made less stringent. During the 1980s, wage increases at home and trade conflicts abroad led Korean firms to consider offshoring, and the government assisted their efforts by liberalizing outward investment policies. The pre-authorization system was replaced by a reporting system, particularly in labor-intensive industries. Moreover, the positive specification of acceptable investment areas was dropped in favor of a negative system, which defined a few forbidden industries. Investment procedures were also simplified greatly. After becoming an official member of the Organization for Economic Co-operation and Development (OECD) in 1996, Korea relaxed restrictions even further, but it was the 1997 Asian financial crisis and subsequent conditionality agreement with the International Monetary Fund (IMF) that forced the government to take the most drastic liberalization measures. A number of changes were made to both inward and outward FDI policies. Changes in outward FDI policies at this point included the introduction of a deferred payment system, increased and liberalized financial support for investment in developing countries, and collateral insurance and mortgage systems. In order to strengthen ties with developing countries and secure natural resources from them, the Economic Development Cooperation Fund (EDCF) and the Korea International Cooperation Agency (KOICA) were established in 1987 and 1991, respectively. In 2003, a new enforcement ordinance in foreign trade law was established, which expanded the mission of reducing restrictions on overseas investment. The main supporting measures included financial support, exemption on taxes paid overseas, institutionalized information and administrative services, and special support for small and medium-sized enterprises wishing to invest abroad. In addition, investment insurance services were introduced to protect firms against losses through expropriation, war, and other such contingencies. In 2008, due to the increase in oil prices, the government prompted Korean firms to invest in natural resource development through various policy tools and relevant government departments. However, because of deteriorating financial statements of these investment firms, the government promoted firms’ restructuring their overseas investment by selling or reducing existing investments. The current Park Geun-hye administration promotes overseas investment through free trade agreements (FTA), investment information and financial support for small and medium-sized enterprises, and advocacy of investment diversification from manufacturing to services such as culture, contents, and medical. Note: The above information was abstracted and modified from the following references: OECD (2013), “Lessons from Investment Policy Reform in Korea”; Korea Institute for Industrial Economies and Trade, KIET) (2010), “The Trend of Korea’s Outward Foreign Direct Investment and Structural Characteristics” (in Korean); Korea Eximbank Overseas Research Institute, KERI) (2012), “The Status and Implications of Korean Public Firms’ foreign investment in natural resources” (in Korean). The future of Korea’s outward FDI With the increasing uncertainty of the global investment environment, Korean firms are likely pressured to adopt the following three characteristics.
page 12 of 45
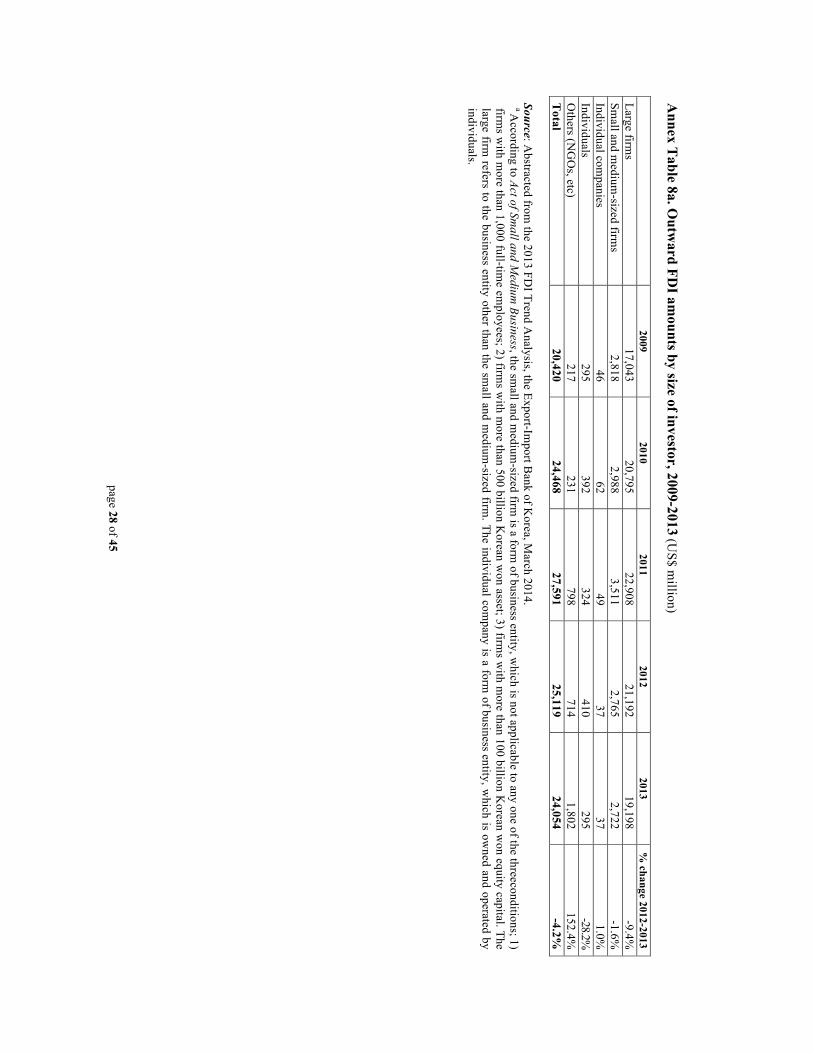
First, given the increasing financial burden due to their poor operation of overseas investment in natural resources, public firms will pay more attention to the quality of management than the quantity of expansion. As a result, new investments projects by government-owned mulinationals in the mining sector are unlikely to grow substantially for the next several years. Second, Korean firms will diversify in terms of both the regions and industries of investment. They will venture more actively into the untapped markets of both developed and developing countries to diversify their sources of revenue. With the changing pattern of competition, Korean firms will also aggresively enter service sectors to strengthen current businesses or seek new competencies, with the support of the Korean government. Third, the composition of Korean firms participating in overseas investment will change. Currently, about 90% of Korea’s overseas investments are made by large firms. Economic democracy is a main objective of the current government, which aims to promote the co-development of large firms with small and medium sized enterprises. This economic philosophy can also be applied to overseas investment. Therefore, there will likely be a substantial growth of FDI by small and medium sized-enterprises, either by themselves or together with large firms as component suppliers.
page 13 of 45
For further information please contact
Graduate School of International Studies, Seoul National University
Hwy-Chang Moon Professor of International Business and Strategy Graduate School of International Studies Seoul National University [email protected] +82-2-880-8518
Wenyan Yin Doctoral Candidate and Research Associate Graduate School of International Studies Seoul National University [email protected]
Columbia Center on Sustainable Investment (CCSI)
Lisa Sachs Director, [email protected]
+1(212) 854-0691
Lise Johnson Head, Investment Law and Policy, CCSI [email protected]
Victor Zitian Chen Assistant Professor of International ManagementBelk College of Business, UNC CharlotteGlobal Coordinator and EditorEmerging Market Global Players Project, CCSI [email protected]
Emerging Markets Global Players Project
This report on Korean multinationals was prepared under the framework of the Emerging Market Global Players (EMGP) Project, a collaborative effort led by the Columbia Center on Sustainable Investment (CCSI). It brings together researchers on FDI from leading institutions in emerging markets to generate annual reports on the top multinationals in each participating country. Reports on 14 economies have been published so far (some with multiple reports): Argentina, Brazil, Chile, China, Hungary, India, Israel, Korea, Mexico, Poland, Russia, Slovenia, Taiwan, and Turkey. For further information, visit: http://www.ccsi.columbia.edu/content/emerging-market-global-players.
Graduate School of International Studies, Seoul National University (GSIS SNU)
This report was prepared by Hwy-Chang Moon and Wenyan Yin at the Graduate School of International Studies, Seoul National University. This school is the premier graduate school of international affairs and area studies in Korea. As both a professional and academic institution, its mission is to promote academic research in the area of international studies and to educate its students to assume leading roles in government and non-government organizations, international organizations, multinational corporations, and the media, as well as research institutes and universities. The school offers both Master’s and Doctoral degree programs, specializing in international commerce, international cooperation, international area studies, and Korean studies. For more information, see http://gsis.snu.ac.kr/.
Columbia Center on Sustainable Investment
The Columbia Center on Sustainable Investment (CCSI), a joint center of Columbia Law School and the Earth Institute at Columbia University, is a leading applied research center and forum dedicated to the study, practice and discussion of sustainable international investment. The mission of the Center is to develop and disseminate practical approaches and solutions, as well as to analyze topical policy-oriented issues, in order to maximize the impact of international investment for sustainable development. The Center undertakes its mission through interdisciplinary research, advisory projects, multi-stakeholder dialogue, educational programs, and the development of resources and tools. For more information, visit http://www.ccsi.columbia.edu/.
page 14 of 45
Annex 1: T
ables and figures A
nnex Table 1. K
orea: The top 20 m
ultinationals – Key variables, 2013 (U
S$ million and num
ber of persons)
Sources: Firms’ individual annual reports and sustainability reports, C
EO Score (http://ceoscore.co.kr/bbs/login.php), and K
OR
CH
AM
BIZ (w
ww
.korchambiz.net).
a All calculations use exchange rates provided by the IM
F for Decem
ber 30th 2013.
b n/a indicates non-availability of data. c TN
Is of six firms m
issing employm
ent data are calculated as the average of foreign assets to total assets and foreign sales to total sales. d Foreign sales are calculated as total sales of 2013 m
ultiplied by the foreign sales ratio, which is based on consolidated financial statem
ent. e Foreign sales are calculated as total sales of 2013 m
ultiplied by the foreign sales ratio, which is based on the first three quarters of 2013.
Rank by
foreign assets Firm
s A
ssets Sales
Em
ployment
TN
I (%)
Foreign T
otal Foreign
Total
Foreign T
otal 1
Samsung Electronics C
o., Ltd 18,449
146,671 133,736
150,030 190,486
286,284 56.1
2 PO
SCO
8,160
51,385 11,739
28,935 n/a
17,823 n/a
3 H
yundai Motor C
ompany
6,786 54,674
24,175 39,495
41,838 104,731
37.9 4
Korea G
as Corporation
5,419 40,045
553d
35,470 248
3,386 7.5
5 LG
Chem
Ltd. 4,239
14,577 14,653
19,189 7,834
20,430 47.9
6 LG
Electronics Inc. 3,456
23,656 18,937
26,600 3,985
24,683 34.0
7 SK
Hynix Inc.
3,165 18,848
12,126 13,164
43,992 82,432
54.1 8
Korea Electric Pow
er Corporation
2,670 93,075
2,682 d
50,864 384
19,644 3.4
9 Lotte C
hemical C
orporation 2,045
9,317 7,627
11,627 2,456
5,274 44.7
10 Lotte Shopping C
o., Ltd. 2,017
24,945 1,695
15,691 31,425
60,365 23.6
11 Sam
sung Display C
o., Ltd. 1,955
33,872 23,288
e 27,839
n/a 26,962
n/a 12
Kia M
otors Corporation
1,617 25,448
18,297 26,840
14,553 48,089
34.9 13
Samsung C
&T C
orporation 1,591
20,813 10,310
17,852 n/a
16,558 n/a
14 LG
Display C
o., Ltd. 1,565
19,557 23,549
24,492 17,470
51,205 46.1
15 H
yundai Mobis C
o., Ltd. 1,162
18,842 5,938
16,590 12,823
20,534 34.8
16 SK
Telecom C
o., Ltd. 1,155
21,625 33
d 12,183
103 4,203
2.7 17
Hyosung C
orporation 896
7,436 6,283
8,590 n/a
7,930 n/a
18 Sam
sung SDI C
o., Ltd. 874
9,593 3,370
3,779 7,920
16,449 48.8
19 H
yundai Heavy Industries C
o., Ltd. 873
30,439 20,588
23,004 n/a
27,246 n/a
20 SK
Innovation Co. Ltd.
812 13,724
745 d
1,415 n/a
6,350 n/a
page 15 of 45
Annex T
able 1a. Korea: Foreign and total assets of the top 20 m
ultinationals, 2011-2013 (US$ m
illion) a
Sources: Firms’ individual annual reports
a All calculations use exchange rates provided by the IM
F for Decem
ber 30th for 2011 and 2013, and D
ecember 28
th for 2012.
Rank by foreign
assets Firm
s 2011
2012 2013
Foreign T
otal Foreign
Total
Foreign T
otal 1
Samsung Electronics C
o., Ltd 13,607
146,671 16,345
124,256 18,449
146,671 2
POSC
O
5,631 51,385
6,886 48,784
8,160 51,385
3 H
yundai Motor C
ompany
5,610 54,674
6,605 50,299
6,786 54,674
4 K
orea Gas C
orporation 2,174
40,045 4,090
36,696 5,419
40,045 5
LG C
hem Ltd.
791 14,577
987 13,785
4,239 14,577
6 LG
Electronics Inc. 3,063
23,656 3,315
22,221 3,456
23,656 7
SK H
ynix Inc. 2,579
18,848 3,032
16,973 3,165
18,848 8
Korea Electric Pow
er Corporation
2,380 93,075
2,500 89,729
2,670 93,075
9 Lotte C
hemical C
orporation n/a
9,317 1,607
8,858 2,045
9,317 10
Lotte Shopping Co., Ltd.
1,606 24,945
2,040 23,126
2,017 24,945
11 Sam
sung Display C
o., Ltd. n/a
33,872 1,405
31,508 1,955
33,872 12
Kia M
otors Corporation
1,314 25,448
1,524 22,825
1,617 25,448
13 Sam
sung C&
T Corporation
1,319 20,813
1,476 21,612
1,591 20,813
14 LG
Display C
o., Ltd. 1,008
19,557 1,218
22,193 1,565
19,557 15
Hyundai M
obis Co., Ltd.
987 18,842
1,122 17,007
1,162 18,842
16 SK
Telecom C
o., Ltd. 921
21,625 1,001
20,745 1,155
21,625 17
Hyosung C
orporation 894
7,436 947
7,669 896
7,436 18
Samsung SD
I Co., Ltd.
630 9,593
688 10,029
874 9,593
19 H
yundai Heavy Industries C
o., Ltd. 746
30,439 900
28,567 873
30,439 20
SK Innovation C
o. Ltd. 650
13,724 757
14,269 812
13,724 T
otal 45,911
511,586 58,447
631,151 68,907
678,543
page 16 of 45
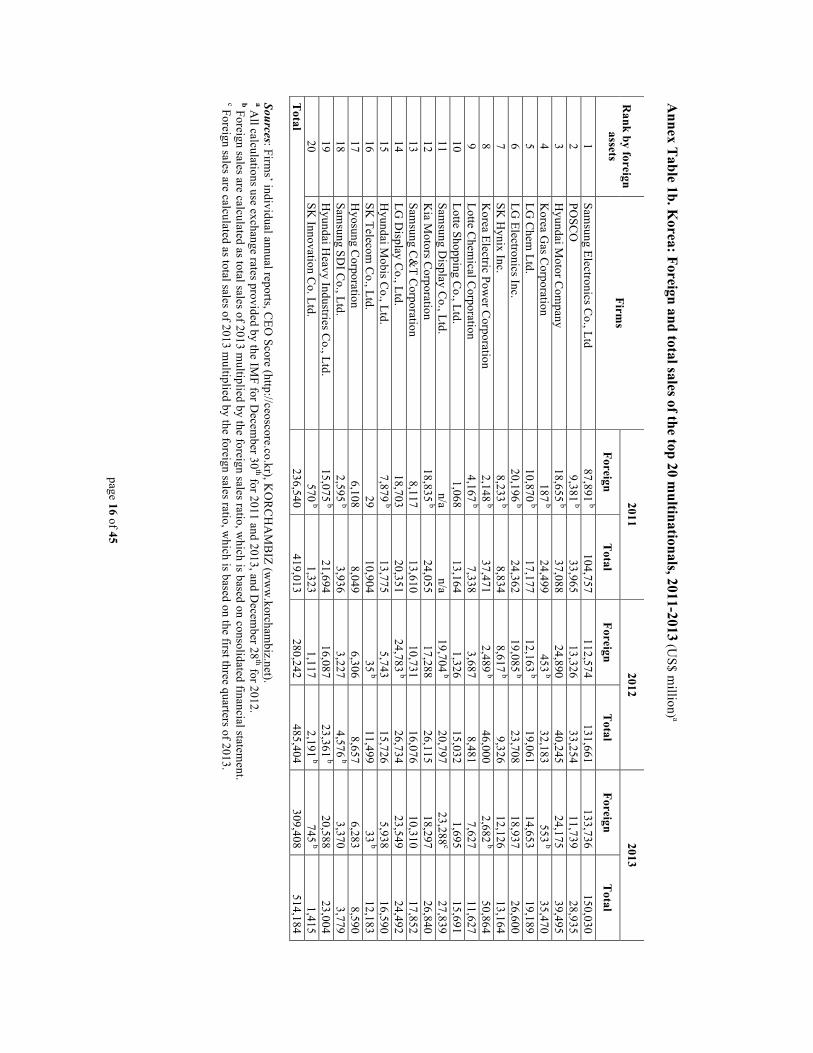
Annex T
able 1b. Korea: Foreign and total sales of the top 20 m
ultinationals, 2011-2013 (US$ m
illion) a
Sources: Firms’ individual annual reports, C
EO Score (http://ceoscore.co.kr), K
OR
CH
AM
BIZ (w
ww
.korchambiz.net).
a All calculations use exchange rates provided by the IM
F for Decem
ber 30th for 2011 and 2013, and D
ecember 28
th for 2012. b Foreign sales are calculated as total sales of 2013 m
ultiplied by the foreign sales ratio, which is based on consolidated financial statem
ent. c Foreign sales are calculated as total sales of 2013 m
ultiplied by the foreign sales ratio, which is based on the first three quarters of 2013.
Rank by foreign
assets Firm
s 2011
2012 2013
Foreign T
otal Foreign
Total
Foreign T
otal 1
Samsung Electronics C
o., Ltd 87,891
b 104,757
112,574 131,661
133,736 150,030
2 PO
SCO
9,381
b 33,965
13,326 33,254
11,739 28,935
3 H
yundai Motor C
ompany
18,655 b
37,088 24,890
40,245 24,175
39,495 4
Korea G
as Corporation
187 b
24,499 453
b 32,183
553 b
35,470 5
LG C
hem Ltd.
10,870 b
17,177 12,163
b 19,061
14,653 19,189
6 LG
Electronics Inc. 20,196
b 24,362
19,085 b
23,708 18,937
26,600 7
SK H
ynix Inc. 8,233
b 8,834
8,617 b
9,326 12,126
13,164 8
Korea Electric Pow
er Corporation
2,148 b
37,471 2,489
b 46,000
2,682 b
50,864 9
Lotte Chem
ical Corporation
4,167 b
7,338 3,687
8,481 7,627
11,627 10
Lotte Shopping Co., Ltd.
1,068 13,164
1,326 15,032
1,695 15,691
11 Sam
sung Display C
o., Ltd. n/a
n/a 19,704
b 20,797
23,288c
27,839 12
Kia M
otors Corporation
18,835 b
24,055 17,288
26,115 18,297
26,840 13
Samsung C
&T C
orporation 8,117
13,610 10,731
16,076 10,310
17,852 14
LG D
isplay Co., Ltd.
18,703
20,351 24,783
b 26,734
23,549 24,492
15 H
yundai Mobis C
o., Ltd. 7,879
b 13,775
5,743 15,726
5,938 16,590
16 SK
Telecom C
o., Ltd. 29
10,904 35
b 11,499
33 b
12,183 17
Hyosung C
orporation 6,108
8,049 6,306
8,657 6,283
8,590 18
Samsung SD
I Co., Ltd.
2,595 b
3,936 3,227
4,576 b
3,370 3,779
19 H
yundai Heavy Industries C
o., Ltd. 15,075
b 21,694
16,087 23,361
b 20,588
23,004 20
SK Innovation C
o. Ltd. 570
b 1,323
1,117 2,191
b 745
b 1,415
Total
236,540 419,013
280,242 485,404
309,408 514,184

page 17 of 45
Annex T
able 1c. Korea: Foreign and total em
ployment of the top 20 m
ultinationals, 2011-2013 (number of persons) a
Sources: Firms’ individual annual reports and sustainability reports.
a Foreign employm
ent is calculated as total employm
ent of 2011 multiplied by the foreign em
ployment ratio, w
hich is the average of foreign assets to total assets and foreign sales to total sales in 2011 (This is because such calculation m
akes it the most sim
ilar to the foreign employm
ent ratio of 2012 and 2013). b Foreign em
ployment is calculated as total em
ployment of 2011 m
ultiplied by foreign employm
ent ratio, which is the ratio of foreign assets to total assets in 2011 (This is
because such calculation makes it the m
ost similar to the foreign em
ployment ratio of 2012 and 2013).
Rank by
foreign assets
Firms
2011 2012
2013
Foreign T
otal Foreign
Total
Foreign T
otal 1
Samsung Electronics C
o., Ltd 119,753
221726 145,166
235,868 190,486
286,284 2
POSC
O
n/a 17553
n/a 17,623
n/a 17,823
3 H
yundai Motor C
ompany
29,125 86428
38,318 98,348
41,838 104,731
4 K
orea Gas C
orporation 187
3014 210
3,193 248
3,386 5
LG C
hem Ltd.
3,776a
10775 8,924
20,661 7,834
20,430 6
LG Electronics Inc.
3,420b
23430 3,736
24,287 3,985
24,683 7
SK H
ynix Inc. 55,759
91045 50,319
86,697 43,992
82,432 8
Korea Electric Pow
er Corporation
212 19303
244 19,278
384 19,644
9 Lotte C
hemical C
orporation 1,964
4557 2,209
4,967 2,456
5,274 10
Lotte Shopping Co., Ltd.
22,938 48,410
23,178 49,327
31,425 60,365
11 Sam
sung Display C
o., Ltd. n/a
n/a n/a
26,911 n/a
26,962 12
Kia M
otors Corporation
12,756 45312
14,183 47,104
14,553 48,089
13 Sam
sung C&
T Corporation
n/a 12759
n/a 14,359
n/a 16,558
14 LG
Display C
o., Ltd. 21,136
56029 20,876
55,621 17,470
51,205 15
Hyundai M
obis Co., Ltd.
9,559 16586
11,951 19,132
12,823 20,534
16 SK
Telecom C
o., Ltd. 246
3877 155
4,081 103
4,203 17
Hyosung C
orporation n/a
7363 n/a
8,577 n/a
7,930 18
Samsung SD
I Co., Ltd.
6,892 14155
8,408 15,451
7,920 16,449
19 H
yundai Heavy Industries C
o., Ltd. n/a
24943 n/a
26,255 n/a
27,246 20
SK Innovation C
o. Ltd. n/a
5943 n/a
6,346 n/a
6,350 T
otal 287,722
644,647 327,877
684,015 375,517
747,709
page 18 of 45
Annex T
able 1d. Korea: T
he top 20 multinationals – D
etailed TN
I Data, 2013
Rank by foreign assets
Firms
Assets
(Foreign/Total)
Sales (Foreign/T
otal)
Em
ployment
(Foreign/ T
otal) T
NI (%
)
1 Sam
sung Electronics Co., Ltd
12.6%
89.1%
66.5%
56.1 2
POSC
O
15.9%
40.6%
n/a n/a
3 H
yundai Motor C
ompany
12.4%
61.2%
39.9%
37.9 4
Korea G
as Corporation
13.5%
1.6%
7.3%
7.5 5
LG C
hem Ltd.
29.1%
76.4%
38.3%
47.9 6
LG Electronics Inc.
14.6%
71.2%
16.1%
34.0 7
SK H
ynix Inc. 16.8%
92.1%
53.4%
54.1
8 K
orea Electric Power C
orporation 2.9%
5.3%
3.2%
3.8
9 Lotte C
hemical C
orporation 22.0%
65.6%
46.6%
44.7
10 Lotte Shopping C
o., Ltd. 8.1%
10.8%
51.6%
23.5
11 Sam
sung Display C
o., Ltd. 5.8%
83.7%
n/a
n/a 12
Kia M
otors Corporation
6.4%
68.2%
30.3%
34.9 13
Samsung C
&T C
orporation 7.6%
57.8%
n/a
n/a 14
LG D
isplay Co., Ltd.
8.0%
96.1%
34.1%
46.1 15
Hyundai M
obis Co., Ltd.
6.2%
35.8%
62.4%
34.8 16
SK Telecom
Co., Ltd.
5.3%
0.3%
2.5%
2.7 17
Hyosung C
orporation 12.1%
73.1%
n/a
n/a 18
Samsung SD
I Co., Ltd.
9.1%
89.2%
48.1%
48.8 19
Hyundai H
eavy Industries Co., Ltd.
2.9%
89.5%
n/a n/a
20 SK
Innovation Co. Ltd.
5.9%
52.6%
n/a n/a

page 19 of 45
Annex T
able 2. Korea: T
he top 20 multinationals – N
umber of affiliates and R
egionality Index (%), 2013
Sources: Firms’ individual annual reports, sustainability reports, and w
ebsites. a The R
egionality index is calculated by dividing the number of a firm
’s foreign affiliates in a particular region by its total number of foreign affiliates, and m
ultiplying the result by 100.
Rank by
foreign assets Firm
s A
sia & the
Pacific E
urope & C
IS N
orth Am
erica South A
merica
Middle E
ast &
Africa
Total
No.
Index N
o. Index
No.
Index N
o. Index
No.
Index N
o. Index
1 Sam
sung Electronics Co., Ltd
55 40.7%
45
33.3%
17 12.6%
8
5.9%
10 7.4%
135
14.4%
2 PO
SCO
108
62.8%
15 8.7%
28
16.3%
16 9.3%
5
2.9%
172 18.4%
3
Hyundai M
otor Com
pany 13
21.3%
20 32.8%
25
41.0%
3 4.9%
0
0.0%
61 6.5%
4
Korea G
as Corporation
8 42.1%
7
36.8%
3 15.8%
0
0.0%
1 5.3%
19
2.0%
5 LG
Chem
Ltd. 15
71.4%
3 14.3%
3
14.3%
0 0.0%
0
0.0%
21 2.2%
6
LG Electronics Inc.
45 36.3%
28
22.6%
20 16.1%
13
10.5%
18 14.5%
124
13.2%
7 SK
Hynix Inc.
12 63.2%
4
21.1%
3 15.8%
0
0.0%
0 0.0%
19
2.0%
8 K
orea Electric Power C
orporation 0
0.0%
6 16.7%
23
63.9%
2 5.6%
5
13.9%
36 3.8%
9
Lotte Chem
ical Corporation
6 66.7%
2
22.2%
1 11.1%
0
0.0%
0 0.0%
9
1.0%
10 Lotte Shopping C
o., Ltd. 32
97.0%
0 0.0%
0
0.0%
1 3.0%
0
0.0%
33 3.5%
11
Samsung D
isplay Co., Ltd.
4 80.0%
1
20.0%
0 0.0%
0
0.0%
0 0.0%
5
0.5%
12 K
ia Motors C
orporation 2
9.5%
16 76.2%
3
14.3%
0 0.0%
0
0.0%
21 2.2%
13
Samsung C
&T C
orporation 30
35.7%
19 22.6%
31
36.9%
3 3.6%
1
1.2%
84 9.0%
14
LG D
isplay Co., Ltd.
12 70.6%
2
11.8%
3 17.6%
0
0.0%
0 0.0%
17
1.8%
15 H
yundai Mobis C
o., Ltd. 10
40.0%
6 24.0%
6
24.0%
1 4.0%
2
8.0%
25 2.7%
16
SK Telecom
Co., Ltd.
7 53.8%
0
0.0%
3 23.1%
3
23.1%
0 0.0%
13
1.4%
17 H
yosung Corporation
27 50.9%
13
24.5%
9 17.0%
3
5.7%
1 1.9%
53
5.7%
18 Sam
sung SDI C
o., Ltd. 9
60.0%
3 20.0%
2
13.3%
1 6.7%
0
0.0%
15 1.6%
19
Hyundai H
eavy Industries Co., Ltd.
16 43.2%
10
27.0%
5 13.5%
3
8.1%
3 8.1%
37
3.9%
20 SK
Innovation Co. Ltd.
25 65.8%
5
13.2%
5 13.2%
3
7.9%
0 0.0%
38
4.1%
Total 436
46.5%
205 21.9%
190
20.3%
60 6.4%
46
4.9%
937 100.0%
page 20 of 45
Annex T
able 3. Korea: T
he top 20 multinationals – Stock exchange listings, 2013
Firms
Dom
estic Foreign
Samsung Electronics C
o., Ltd Seoul
London, Luxembourg
POSC
O
Seoul London, N
ew Y
ork, Tokyo H
yundai Motor C
ompany
Seoul London, Luxem
bourg K
orea Gas C
orporation Seoul
None
LG C
hem Ltd.
Seoul London
LG Electronics Inc.
Seoul London
SK H
ynix Inc. Seoul
Luxembourg
Korea Electric Pow
er Corporation
Seoul N
ew Y
ork Lotte C
hemical C
orporation Seoul
None
Lotte Shopping Co., Ltd.
Seoul London
Samsung D
isplay Co., Ltd.
None
None
Kia M
otors Corporation
Seoul Luxem
bourg Sam
sung C&
T Corporation
Seoul London
LG D
isplay Co., Ltd.
Seoul N
ew Y
ork H
yundai Mobis C
o., Ltd. Seoul
None
SK Telecom
Co., Ltd.
Seoul N
ew Y
ork H
yosung Corporation
Seoul N
one Sam
sung SDI C
o., Ltd. Seoul
Luxembourg
Hyundai H
eavy Industries Co., Ltd.
Seoul N
one SK
Innovation Co. Ltd.
Seoul N
one Sources: Firm
s’ individual annual reports
page 21 of 45
Annex T
able 4. Korea: O
utward FD
I by region (U
S$ million and percentage)
R
egion 2009
2010 2011
2012 2013
% change 2012-2013
Asia
6,794 10,139
11,318 10,877
11,172 2.7
North A
merica
6,005 4,630
7,300 5,051
3,867 -23.4
Europe 5,338
6,143 4,355
3,405 3,524
3.5 O
eania 549
779 1,542
2,348 2,589
10.3 Latin A
merica &
the Caribbean
1,039 2,138
2,385 2,703
2,248 -16.8
Middle East
322 349
419 370
482 30.4
Africa
374 291
372 365
172 -52.8
Total
20,420 24,468
27,591 25,119
24,054 -4.2
% of top 3 regions
88.8 85.5
82.9 77.0
77.2
Source: Abstracted from
the 2013 FDI Trend A
nalysis, the Export-Import B
ank of Korea, M
arch 2014.

page 22 of 45
Annex T
able 4a. Korea: O
utward FD
I by major industry sector and region
(US$ m
illion and percentages)
Region
Industry 2009
2010 2011
2012 2013
% change 2012-
2013
Asia
Manufacturing
2,794 5,571
5,859 5,200
7,394 42.2
Mining
887 1,172
939 1,393
933 -33.1
Wholesale &
retail 379
468 562
792 824
4.0 Finance &
insurance 1,154
900 929
495 435
-12.1 Professional services
378 859
1,499 809
386 -52.2
North A
merica
Mining
3,016 1,303
3,192 2,440
1,234 -49.4
Wholesale &
retail 841
419 1,420
401 676
68.8 M
anufacturing 717
372 568
870 537
-38.3 R
eal estate & leasing
109 94
34 23
359 1,487.4
Professional services 645
279 343
463 294
-36.6
Europe
Finance & insurance
203 15
598 36
941 2,515.5
Manufacturing
903 816
1,307 843
906 7.5
Mining
775 3,304
1,504 297
423 42.4
Professional services 1,105
380 501
1,498 353
-76.4 R
eal estate & leasing
1,607 1,077
30 3
279 10,325.8
Oceania
Mining
257 402
1,265 2,150
1,699 -21.0
Real estate &
leasing 105
12 87
3 579
22,444.9 Finance &
insurance -
175 25
60 183
205.6 A
ccomm
odation and food service 2
2 25
12 49
299.4 A
griculture, forestry, and fishing 2
2 9
12 28
133.4 Source: A
bstracted from the 2013 FD
I Trend Analysis, the Export-Im
port Bank of K
orea, March 2014.

page 23 of 45
Annex T
able 4b. Korea: O
utward FD
I by major econom
y and region (U
S$ million and percentages)
Region
Econom
y 2009
2010 2011
2012 2013
% change 2012-
2013
Asia
China
2,201 3,660
3,686 3,609
5,046 39.8
Vietnam
609
855 1,048
965 1,115
15.6 H
ong Kong
1,567 1,286
1,631 1,581
800 -49.4
Japan 377
321 252
646 691
7.1 India
241 198
452 311
541 73.6
North A
merica
United States
3,571 3,397
5,979 4,407
3,418 -22.4
Canada
2,434 1,233
1,320 643
499 -30.3
Europe
Netherlands
1,057 702
761 1,212
1,570 29.6
Jersey -
- 336
- 722
- U
nited Kingdom
1,717
3,281 1,323
259 604
133.4 G
ermany
292 762
274 142
263 84.7
Belgium
97
317 350
305 180
-40.9
Oeania
Australia
266 564
1,382 2,234
2,000 -10.5
Marshall Islands
240 103
85 73
475 547.8
New
Zealand 12
12 12
11 42
269.7 Sources: D
ata for Asia, N
orth Am
erica, and Oceania: A
bstracted from the 2013 FD
I Trend Analysis, the Export-Im
port Bank of K
orea, March 2014; D
ata for Europe: Korea
Eximbank Foreign Invesm
tent Statistics.

page 24 of 45
Annex T
able 5. Korea: O
utward FD
I by industry sector (US$ m
illion and percentages)
Industry 2009
2010 2011
2012 2013
% change 2012-2013
Manufacturing
4,621 7,241
8,987 7,923
9,517 20.1
Mining
5,449 7,342
7,585 7,273
5,459 -24.9
Finance & insurance
2,085 3,272
3,400 1,390
2,219 59.6
Wholesale &
retail 1,703
1,254 2,163
1,541 1,861
20.8 R
eal estate & leasing
2,363 1,593
678 1,052
1,610 53.0
Professional sevices 2,130
1,622 2,381
2,961 1,037
-65.0 T
otal 20,420
24,468 27,591
25,119 24,054
-4.2 %
of top 3 industries 59.5
73.0 72.4
66.0 71.5
Source: A
bstracted from the 2013 FD
I Trend Analysis, the Export-Im
port Bank of K
orea, March 2014.
page 25 of 45
Annex T
able 5a. Korea: O
utward FD
I by major econom
y and industry, 2009-2013 (US$ m
illion and percentages)
Industry E
conomy
2009 2010
2011 2012
2013 %
change 2012-2013
Manufacturing
China
1,725 2,777
2,835 2,542
4,488 76.6
Vietnam
311
464 523
527 742
40.8 India
216 154
421 234
495 111.0
Brazil
6 133
919 639
463 -27.6
United States
711 366
527 825
448 -45.8
Philippines 26
151 88
892 415
-53.5 G
ermany
173 45
256 27
250 843.9
Hong K
ong 225
193 88
87 236
170.2 Indonesia
74 189
883 505
225 -55.4
Singapore 35
162 268
16 188
1057.2
Mining
Australia
162 367
1,242 2,078
1,612 -22.5
United States
622 138
2,114 1,981
993 -49.9
Mexico
- -
96 369
466 26.2
Myanm
ar 348
162 352
230 375
63.4 N
etherlands 501
282 646
157 305
94.1 M
alaysia 119
129 136
650 266
-59.0 Peru
39 45
47 52
261 402.8
Canada
2,394 1,164
1,077 459
241 -47.6
Iraq -
43 33
78 168
114.1 M
adagascar 285
166 296
272 146
-46.2
Finance & insurance
Netherlands
200 2
5 -
716 -
Caym
an Islands 440
494 334
246 374
52.3 U
nited States 249
1,603 1,195
409 205
-49.9 A
ustralia -
175 25
60 182
205.2 Singapore
32 48
470 23
155 584.6
Wholesale &
retail
United States
816 418
1,420 400
657 64.2
Japan 22
59 14
207 348
67.7 C
hina 160
219 205
170 266
56.8 N
etherlands 101
166 39
64 151
134.6 H
ong Kong
71 51
81 86
49 -42.8
Source: Abstracted from
the 2013 FDI Trend A
nalysis, the Export-Import B
ank of Korea, M
arch 2014.

page 26 of 45
Annex T
able 6. Korea: O
utward FD
I amount by ow
nership percentage (US$ m
illion and percentages)
% of ow
nership 2009
2010 2011
2012 2013
% change 2012-2013
Less than 10%
289 254
192 232
168 -27.4
More than 10%
-less than 50%
1,585 2,934
3,362 2,494
2,999 20.3
50%
660 197
607 683
584 -14.5
More than 50%
-less than 100%
1,694 3,657
3,781 3,149
3,382 7.4
100%
16,191 17,426
19,650 18,561
16,921 -8.8
Total
20,420 24,468
27,591 25,119
24,054 -4.2
Source: Abstracted from
the 2013 FDI Trend A
nalysis, the Export-Import B
ank of Korea, M
arch 2014.

page 27 of 45
Annex T
able 7. Korea: O
utward FD
I by scale of investment (U
S$ million and percentages)
Investm
ent amount
2009 2010
2011 2012
2013 %
change 2012-2013 Less than U
S$5 million
4,637 5,134
5,116 4,885
4,825 -1.2
US$5 m
illion- US$10 m
illion 1,489
1,667 2,332
2,289 1,827
-20.2 U
S$10 million- U
S$50 million
4,391 4,567
6,741 6,496
6,625 2.0
US$50 m
illion- US$100 m
illion 2,101
2,044 3,778
4,044 4,033
-0.3 M
ore than US$100 m
illion 7,801
11,054 9,622
7,404 6,741
-8.9 T
otal 20,420
24,468 27,591
25,119 24,054
-4.2 Source: A
bstracted from the 2013 FD
I Trend Analysis, the Export-Im
port Bank of K
orea, March 2014.
page 28 of 45
Annex T
able 8a. Outw
ard FDI am
ounts by size of investor, 2009-2013 (US$ m
illion)
2009
2010 2011
2012 2013
% change 2012-2013
Large firms
17,043 20,795
22,908 21,192
19,198 -9.4%
Sm
all and medium
-sized firms
2,818 2,988
3,511 2,765
2,722 -1.6%
Individual com
panies 46
62 49
37 37
1.0%
Individuals 295
392 324
410 295
-28.2%
Others (N
GO
s, etc) 217
231 798
714 1,802
152.4%
Total
20,420 24,468
27,591 25,119
24,054 -4.2%
Source: A
bstracted from the 2013 FD
I Trend Analysis, the Export-Im
port Bank of K
orea, March 2014.
a According to Act of Sm
all and Medium
Business, the small and m
edium-sized firm
is a form of business entity, w
hich is not applicable to any one of the threeconditions; 1) firm
s with m
ore than 1,000 full-time em
ployees; 2) firms w
ith more than 500 billion K
orean won asset; 3) firm
s with m
ore than 100 billion Korean w
on equity capital. The large firm
refers to the business entity other than the small and m
edium-sized firm
. The individual company is a form
of business entity, which is ow
ned and operated by individuals.
page 29 of 45
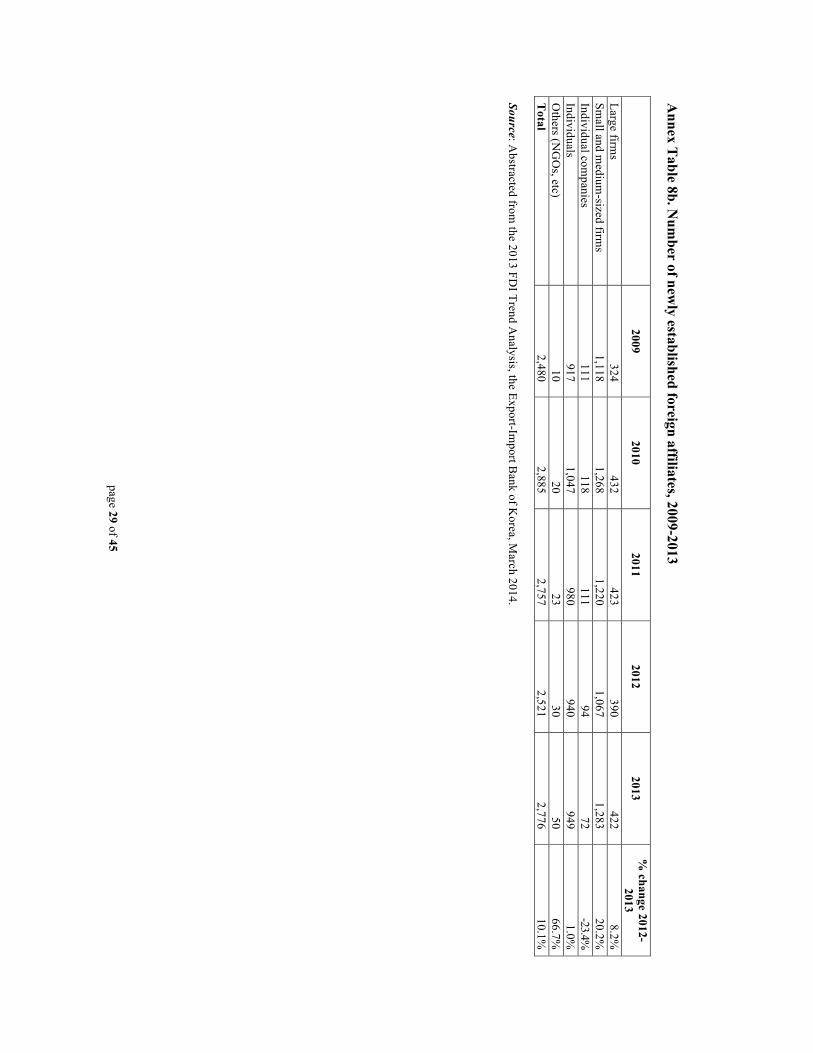
Annex T
able 8b. Num
ber of newly established foreign affiliates, 2009-2013
2009 2010
2011 2012
2013 %
change 2012-2013
Large firms
324 432
423 390
422 8.2%
Sm
all and medium
-sized firms
1,118 1,268
1,220 1,067
1,283 20.2%
Individual com
panies 111
118 111
94 72
-23.4%
Individuals 917
1,047 980
940 949
1.0%
Others (N
GO
s, etc) 10
20 23
30 50
66.7%
Total
2,480 2,885
2,757 2,521
2,776 10.1%
Source: A
bstracted from the 2013 FD
I Trend Analysis, the Export-Im
port Bank of K
orea, March 2014.

page 30 of 45
Annex Figure 1. K
orea: Breakdow
n of foreign assets of the top 20 multinationals, by industry, 2013
T
he top multinationals by m
ain industry, 2013 (US$ m
illion)
Industry Foreign A
ssets C
ompanies
Shipbulding 873
Hyundai H
eavy Industries Electrical &
electronic euqipment,
telecomm
unications 30,619
Samsung Electronics, LG
Electronics, SK H
ynix, Samsung D
isplay, LG D
isplay, SK Telecom
, Sam
sung SDI
Motor vehicles, parts &
components
9,565 H
yundai Motor, K
ia Motors, H
yundai Mobis
Iron & steel foundries
8,160 PO
SCO
W
holesale and retail trade 2,812
Lotte Shopping, Samsung C
&T
a C
onstruction 795
Samsung C
&T
a Petroleum
products, chemicals &
gas 13,412
KO
GA
S, Lotte Chem
ical, LG C
hem, H
yosung, SK Innovation
Electricity 2,670
Korea Electric Pow
er Corporation
Sources: Firms’ individual annual reports
a Samsung C
&T C
orporation’s foreign assets are divided into two broad business areas: w
holesale & retail trade and consutruction. A
s the exact division of assets is unclear, half of Sam
sung C&
T Corporation’s foreign assets are inlcuded in w
holesale & retail trade, and the other half in construction.
page 31 of 45
Annex Figure 2. K
orea: Foreign affiliates of the top 20 multinationals, by region, 2013 (num
ber of affiliates)
Sources: Firm
s’ individual annual reports and websites.

page 32 of 45
Annex Figure 3. K
orea: Geographic distribution of the assets of total outw
ard FDI, by industry, 2013
Oceania, 31.9%
North A
merica,
25.1%
Asia, 15.6%
Africa, 2.5%
Europe, 8.0%
Central &
South A
merica, 13.3%
Middle East,
3.6%
a. Mining

page 33 of 45
Oceania, 0.2%
North A
merica,
5.8%
Asia, 76.9%
Africa, 0.1%
Europe, 10.2%
Central &
South A
merica, 6.7%
Middle East,
0.1%
b. Manufacturing

page 34 of 45
Oceania, 0.7%
North A
merica,
33.9%
Asia, 53.3%
Africa, 0.2%
Europe, 7.9%
Central &
South A
merica, 4.0%
Middle East,
0.0%
c. Wholesale and retail trade

page 35 of 45
Oceania, 1.3%
N
orth Am
erica, 8.8%
Asia, 31.7%
Africa, 0.5%
Europe, 11.9%
Central &
South A
merica, 1.3%
Middle East, 44.6%
d. Construction
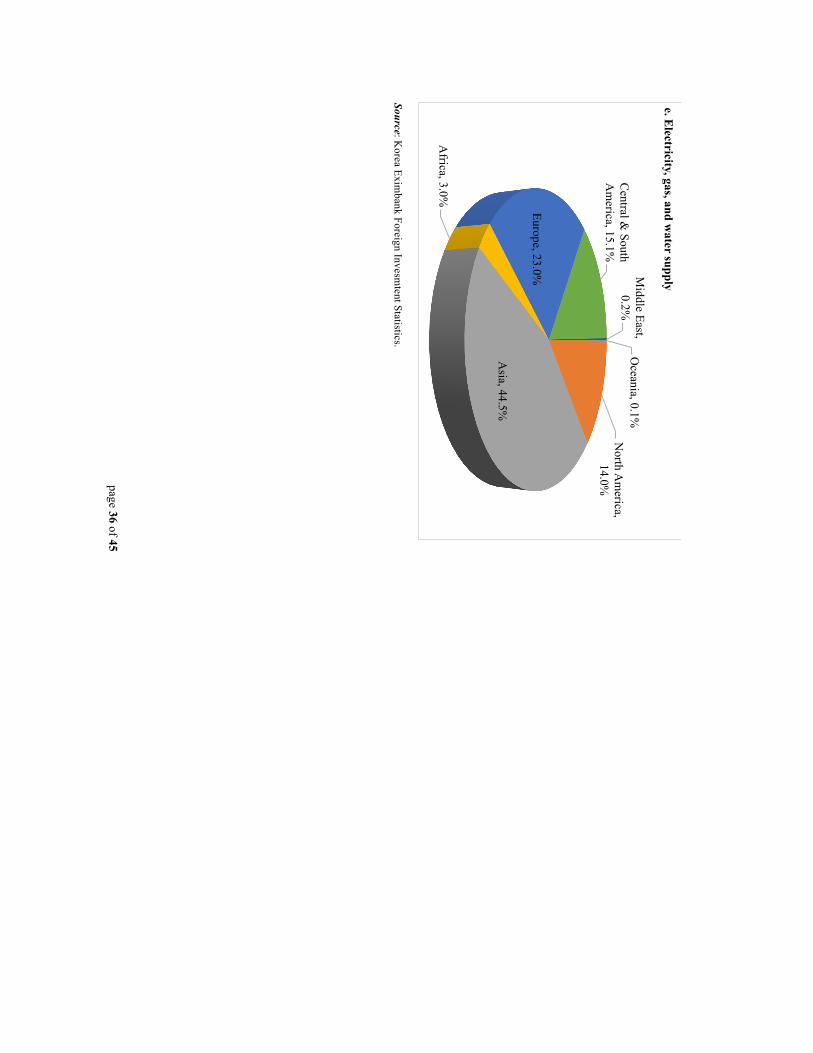
page 36 of 45
Source: K
orea Eximbank Foreign Invesm
tent Statistics.
Oceania, 0.1%
N
orth Am
erica, 14.0%
Asia, 44.5%
Africa, 3.0%
Europe, 23.0%
Central &
South A
merica, 15.1%
Middle East,
0.2%
e. Electricity, gas, and w
ater supply
page 37 of 45
Annex Figure 4. K
orea: Head office locations of the top 20 m
ultinationals, 2013
Sources: Firm
s’ annual reports a C
ompanies w
hose numbers do not appear on the m
ap have their head offices in Seoul. The number in parentheses represents the rank of the 20 firm
s in the table.
Rank
Firm
HQ
Location
1 Sam
sung Electronics Co., Ltd
Suwon
2 PO
SCO
Pohang
3 H
yundai Motor C
ompany
Seoul
4 K
orea Gas C
orporation Seongnam
5 LG
Chem
Ltd. Seoul
6 LG
Electronics Inc. Seoul
7 SK
Hynix Inc.
Icheon
8 K
orea Electric Power C
orporation Seoul
9 Lotte C
hemical C
orporation Seoul
10 Lotte Shopping C
o., Ltd. Seoul
11 Sam
sung Display C
o., Ltd. Y
ongin
12 K
ia Motors C
orporation Seoul
13 Sam
sung C&
T Corporation
Seoul
14 LG
Display C
o., Ltd. Seoul
15 H
yundai Mobis C
o., Ltd. Seoul
16 SK
Telecom C
o., Ltd. Seoul
17 H
yosung Corporation
Seoul
18 Sam
sung SDI C
o., Ltd. Y
ongin
19 H
yundai Heavy Industries C
o., Ltd. U
lsan
20 SK
Innovation Co. Ltd.
Seoul
page 38 of 45
Annex Figure 5. K
orea: Inward and outw
ard FDI flow
s, 1980-2013
Source: U
NC
TAD
FDI Statistics, http://unctadstat.unctad.org/w
ds/ReportFolders/reportFolders.aspx?sR
F_ActivePath=p,5&
sRF_Expanded=,p,5.

page 39 of 45
Annex Figure 6. K
orea: Inward and outw
ard FDI stock, 1980-2013
Source: U
NC
TAD
FDI Statistics, http://unctadstat.unctad.org/w
ds/ReportFolders/reportFolders.aspx?sR
F_ActivePath=p,5&
sRF_Expanded=,p,5.

page 40 of 45
Annex II : Brief profiles of the top 20 multinationals5 No. 1. Samsung Electronics Co., Ltd. http://www.samsung.com/sec From its inception as a small export business in Daegu, Korea, Samsung Electronics Co. (SEC) has grown to become one of the world’s leading electronics companies, specializing in digital appliances and media, semiconductors, memory, and systems integration. It was founded on March 1, 1938 with an investment of KRW30,000. SEC has diversified and expanded its core businesses globally since the late 1970s and has captured the largest global market share for 13 products, including semiconductors, TFT-LCDs, monitors and CDMA mobile phones. Samsung Life holds the largest share (7.55%), followed by Samsung C&T corp. (4.06%). The largest individual shareholder is Gun-Hee Lee, the chairman of Samsung Group, with a share of 3.38%. Overall, foreigners hold 55% of the total shares, major shareholders & related parties 15%, domestic institutions 15%, SEC’s subsidiaries 11%, and the remaining 4% by general public in Korea (by June 60, 2014). No. 2. POSCO http://www.posco.co.kr/homepage/docs/eng3/jsp/s91a0010001i.jsp With the support of the government, Tae-Joon Park established POSCO on April 1, 1968, with 39 employees. The first production line, manufacturing 1.03 million tons of crude steel, was completed in 1973. Pohang Works, with a 9.1 million ton production line, was established in 1983. The company also forged and established strong connections between industry, academics, and research centers with the founding of Pohang University of Science and Technology and the R&D Center for Industrial Science and Technology, in addition to an institute solely devoted to the development of its independent technologies. POSCO was privatized in 2000. In order to reduce the reliance on the domestic market, POSCO has aggressively invested in downstream assets abroad, with more than 200 subsidiaries in over 170 countries around the world by 2014. Foreigners hold 52.92% of its stock shares and domestic institutions own 31.61%. The other shares are taken by treasury stocks (8.49%) and domestic individuals (6.98%). No. 3. Hyundai Motor Company http://worldwide.hyundai.com/ Hyundai Motor was created in 1967 under the Hyundai Group. The company established its first overseas plant in Turkey, and in 2010 its overseas production capacity surpassed domestic production capacity. In 2013, more than 60% of its vehicles were produced in overseas factories. Hyundai produces high quality automobiles and provides excellent customer service, which suits the needs of customers in different regions. Thanks to Hyundai’s focus on ensuring the highest quality, it received the 2nd highest score on Germany’s Autobild’s 2013 quality satisfaction report, and ranked 43rd in the Best Global Brands 2013 by Interbrand, putting it the into the top 50th for the first time. The largest shareholders with more than 5% include Hyundai Mobis (20.78%), National Pension Service (7.57%), and Chung Mong-Koo (5.17%). Foreigners hold 43.59%6. The remaining shares are owned by domestic institutions and individuals. No. 4. Korea Gas Corporation http://www.kogas.or.kr/ The Korea Gas Corporation was incorporated by the Korean governemnt in 1983 and has grown to
��������������������������������������������������������5 Information is taken from the company websites. 6 The basic date of the figure is December 30, 2013, which is obtained from Daum Finance (http://finance.daum.net/index.daum?nil_profile=title&nil_src=stock), due to the lack of information in the company’s annual report.
page 41 of 45
become the world’s largest LNG importer. The company is the only LNG provider in Korea and currently operates three LNG terminals and a nationwide pipline network spanning over 3,562km to ensure a stable supply of clean, safe, and conveninet energy for the nation. KOGAS produces and supplies natural gas, purifies and sells gas-related by-products, builds and operates production facilities and distribution networks, and imports and exports natural gas for domestic and overseas markets. The public shares amount to 54.56%, and are held by the Central Government, KEPCO, and local governments at 26.15%, 20.47%, and 7.94% respectively. Other shareholders include Korean individuals & institutions, foreigners, the treasury, and employees, taking 27.98%, 7.51%, 5.07%, and 4.88% respectively. No. 5. LG Chem Ltd. http://www.lgchem.com/kr/main LG Chem was established as Lucky Chemical Industrial Coporation in 1947. It began to produce petrochemical products in Yeosu and Ulsan in the late 1970s and expanded petrochemical plants in Yeosu and Naju. In 1990s, it was renamed as LG Chem and began producing IT & electronic materials. LG Chem completed its vertically integrated structure in the petrochemical business by merging with LG Daesan Petrochemicals in 2006 and LG Petrochemical in 2007. Today it is the largest Korean chemical company, and one of the world’s top 30 chemical makers. It currently operates in three major industries: petrochemicals, IT & electronic materials, and energy solutions. LG Corp. is the largest shareholder, accounting for 33.5% of LG Chem’s total stocks. Foreigners own 33.1%, domestic institutions and individuals 32.9%, and treasury stocks 0.5%. No. 6. LG Electronics Inc. http://www.lge.com/ LG Electronics was established in 1958 and has led Korea into the advanced digital area. The company is a global leader and technology innovator in consumer electronics, mobile communiations, and home appliances. Currently, it has five business divisions: home entertainment, mobile communications, home appliance, air conditions & energy solution, and, most recently established, vehicle components. It employs more than 200,000 people in more than 200 countries aournd the world (including domestic employees). The shareholder structure is as follows: 34% by LG Corp., 49% by domestic investors, and 17% by foreign investors. No. 7. SK Hynix Inc. http://www.skhynix.com/en/index.jsp SK Hynix started as a member of the Hyundai Group in February 1983. It developed the world’s first 256M SDRAM in 1995 and the 1G synchronous DRAM in 1997. In 1997, it merged with LG Semiconductor and in 2001 became an idependent firm under the name of Hynix Semiconductor. In 2012, SK Telecom took over Hynix Semiconductor, by buying 21.05% of total shares. After that acquisition, the company became a member of the SK Group and its official name was changed to SK Hynix. Through its global manufacturing and sales support network, SK Hynix has strengthened its status as a leading semiconductor firm in many regions. In 2013, SK Hynix became the world’s 5th largest semiconductor manufacturer in terms of market share, after Intel, Samsung Electronics, Qualcomm, and Micron Technology. The largest shareholders with more than 5% are SK Telecom (20.6%) and National Pension Service (9.4%). Foreigners hold 42.8%. Domestic institutions and individuals own 13.9% and 13.3%, respectively. No. 8. Korea Electric Power Corporation http://cyber.kepco.co.kr/kepco/EN/main.do Although its history reaches back to 1898, the modern Korea Electric Power Corporation (KEPCO) was founded in 1961 and started transmission of electricity in 1964. It achieved nationwide rural

page 42 of 45
electrification by 1979. KEPCO was listed on the Korea Exchange in 1989, and the New York Stock Exchange in 1994. It won the bid to operate the Malaya Power Plant in the Philippines in 1995, its first overseas project. Currently it has 10 subsidiaries in Korea and 27 overseas subsidiaries. KEPCO was named the Best Public Company for six consecutive years in the Korea Corporate Governance Service’s assessment. Korea Finance Corporation holds 29.93% of its stock, central government owns 21.17%, and foreigners own 25.90%. The remaining 25.43% are held by treasury stocks and the public. No. 9. Lotte Chemical Corporation http://english.lottechem.com/contents/main/main.asp Lotte Chemical was founded in 1976 as Honam Petrochemical Corporation. In the 1980s, the company focused on the expansion of downstream facilities, and by 1990 it completed vertical integration through continuously expanding plants, businesses, and products. Since 2000, it has enthusiastically committed to M&A and global expansion. In 2012, Honam Petrochemical merged with KP Chemical and officially changed its name to Lotte Chemical. The Surgil project in Uzbekistan became a milestone in its global expansion, as the investment provided access to low-priced raw materials and enhanced its overall global competitiveness. It now manufactures a variety of products, such as basic chemical materials, chemical synthetics, synthetic resins, and functional materials. The major shareholders include Lotte Corporation, Hotel Lotte, Lotte Holdings, and the National Pension Service, having 31.27%, 12.68%, 9.3%, and 7.43% of its total stock, respectively. Other minority shareholders own the remaining 39.32%. No. 10. Lotte Shopping Co., Ltd. http://www.lotteshopping.com/ Lotte Shopping opened its first Lotte Department Store in 1979, and over several decades has expanded its business scope to discount stores (Lotte Mart), grocery stores (Lotte Super), and movie theaters (Lotte Cinema). Today Lotte Shopping is Korea’s most renowned distribution company. Internationally, Lotte Shopping Co. expanded its business presence into major global markets, including China, Russia, Vietnam, and Indonesia. As of June 2013, Lotte Shopping had 165 global stores. In 2013, it was selected as the third best department store in Forbes Global 2000. By the end of 2014, 16.19% of its stock was held by foreigners. No. 11. Samsung Display Co., Ltd. http://www.samsungdisplay.com/eng/index/index.jsp Samsung Display was established in 2012 when three display affiliates of Samsung Group (Samsung Display, Samsung Mobile Display, and S-LCD) merged in order to create synergy within the group. In April 2012, the LCD unit of Samsung Electronics became independent, and acquired Samsung Mobile Display (a joint venture between Samsung Electronics and Samsung SDI) and S-LCD in July of the same year. Samsung Display is the world’s number one display company, producing the TFT-LCD and OLED used in various electronic devices. Currently, three plants are located in Korea, three in China, and one in Slovakia. More than 80% of its revenues are generated through foreign sales. The largest shareholders together own 20.38% of shares, followed by Korean institutions (27.25%), foreign investors (28.59%), domestic individuals (19%), and the treasury stock (4.78%). No. 12. Kia Motors Corporation http://www.kia.com/worldwide/ Since its humble beginnings as a manufacturer of hand-made bicycle parts on the outskirts of Seoul in 1944, Kia Motors has emerged as one of the leading automobile manufacturers in the world. It produced Korea’s first automobile, the K-360 truck, in 1962 and became Korea’s first automobile exporter in 1975. It later merged with Hyundai, forming the Hyundai-Kia Group in 1999. Now it has
page 43 of 45
grown into a global producer with 18 foreign subsidiaries and a network of 4,716 distributors and dealers around the world. Today, Kia Motors is the world’s 9th largest automaker by sales volume. Hyundai Motor owns 33.88% of Kia’s stock, foreigners 33.98%, and domestic private investors 15.91%. Employees and others (e.g., financial institutions) hold 1.61% and 14.62%, respectively. No. 13. Samsung C&T Corporation http://www.samsungcnt.com/EN/cnt/index.do Samsung C&T Corp., founded in 1938, is the original company of Samsung Group. In 1975, it was designated as the first general trading company in Korea to lead overseas sales operations. With its merger with Samsung E&C in December 1995, Samsung C&T now has two wings: the engineering & construction group and the trading & investment group. The combination of the two different businesses resulted in positive synergies, which allow the company to effectively respond to external environmental changes. As of 2013, 31.3% of its stock was held by domestic institutions and 23.8% by foreigners. Domestic individuals and corporates own 22.4% and subsidiaries (Samsung SDI, etc.) own 16.6%. Employees and treasury stocks own the rest at 5.8% and 0.1% respectively. No. 14. LG Display Co., Ltd. http://www.lgdisplay.com/eng/main LG Display was established in January 1985 under the name of Geumsung Software. In 1987, the company started developing TFT-LC and, in 1995, it launched LCD modules. The company has recently become the world’s largest company in the area of eco-friendly technology by expanding its business into thin film solar cells related to display technology. LG Display won the world’s largest market share in key products, such as LCD. The shareholder structure is as follows: LG Electronics, foreign investors, and domestic investors (individuals and institutions) own 37.9%, 25.9%, and 26.6% of shares respectively. The National Pension Service and ADR hold the remaining 9% of total shares. No. 15. Hyundai Mobis Co., Ltd. Http://www.mobis.co.kr/eng/ Hyundai Mobis was established in July 1977 as Hyundai Precision Industry. The company grew into the top container manufacturer in the world and, in the 1990s, moved to the automobile business. It produced complete automobiles (four-wheel drive vehicles like Galloper and Santamo) until 1997. After the Asian financial crisis, it ceded its automobile division to Hyundai Motor and its railway cars division to the Korea Rolling Stock Technology Corporation, as part of a restructuring process. With the production of chassis modules in late 1999, the company transformed itself into an integral auto parts company and formalized this transformation with a new name, Hyundai Mobis. Currently it has three business domains, including module parts manufacturing, core parts manufacturing, and after sales parts. By 2013, it was ranked 8th among global OEM parts suppliers. Major shareholders are Kia Motors (16.88%), Mong-Koo Chung (the former chairman of Hyundai Group; 6.96%), and Hyundai Steel (5.66%). The shares owned by Hyundai Glovis and treasury stocks are 0.67% and 1.86% respectively. The rest of the shares (including the public, foreigners, etc.) comprise 67.98%. No. 16. SK Telecom Co., Ltd. http://www.sktelecom.com/index_real.html A leading wireless telecommunications services provider, SK Telecom, was established in 1984 as Korea Mobile Telecommunications Service Corporation, which was later renamed to Hankuk Idong Tongshin Corp in 1988. It was a subsidiary of a state-controlled company before it became a member of SK Group 1997. It was the first Korean firm to develop the earliest generation of analog mobile phones and also the first to successfully commercialize CDMA technology. In 2013, SK Telecom commercialized the world’s first 150 Mbps LTE-A technology, which provided a foundation for further growth. SK Telecom’s network extends throughout the world, including countries like US,
page 44 of 45
China, Singapore, Japan, Vietnam, Indonesia, and Malaysia. The major shareholder structure is as follows: SK Corp., Citibank ADR, SK Telecom, and the National Pension Corporation representing 25.22%, 16.94%, 12.15%, and 5.90% of total ownership. Others account for 39.80% of its total shares. No. 17. Hyosung Corporation http://www.hyosung.com/en/index.do Hyosung Corporation was founded in 1966, and has become Korea’s leading industrial conglomerate. Hyosung established Korea’s first private technology research institute in 1971 and has committed to developing world-class technology, which became its foundation for rapid growth over the last decades. Since the 1970s it began to diversify its business into various areas by acquiring other firms. Due to its rapid growth, the company was included in the Fortune Global 500 for the first time in 1984. Since 2000, it has actively pursued global market expansion by establishing foreign manufacturing bases in numerous regions. It currently operates in seven industries, including power & industrial systems, industrial materials, textiles, chemicals, construction, trading, and information & communication. The largest shareholder7 owns 30.3% of stocks, followed by foreigners (30.8%), individuals (17.5%), domestic intuitions (14.3%), treasury stocks (5.3%), and other corporations (1.9%). No. 18. Samsung SDI Co., Ltd. http://www.samsungsdi.com/main Samsung SDI, established in 1970, has led Korea’s electronic display industry for the past 40 years. In the beginning the company mainly manufactured vacuum and cathode ray tubes, but it later expanded its businesses to cutting-edge innovations, including LCD, PDP, and AMOLED. It operates several business divisions, including Cell, Pack, Automotive Battery Systems, Energy Solution, and PDP. Currently Samsung SDI owns 10 production plants and four sales subsidiaries, as well as many branches and offices, in 12 countries in the world. Samsung Electronics is the largest shareholder, representing 19.68% of its total shares. The other major shareholders are the National Pension Service, Capital Research, and Korea Investment Management, accounting for 9.46%, 5.24%, and 4.51% respectively. Foreign investors own 28.0%, domestic institutions 27.6%, retail investors 19.9%, and the treasury 4.9%, respectively. No. 19. Hyundai Heavy Industries Co., Ltd. http://www.hhiir.com/EN/index.asp As a construction company, Hyundai Heavy Industries was created by the founder of the Hyundai Groups, Ju-Yung Chung in 1947. Despite many difficulties, in March 1972, the company broke ground on an empty stretch of beach in Ulsan to construct what is now the world’s largest shipyard. It has since set several world records, such as shipbuilding rates (about one every four days), the world’s largest carrier, and the world’s most powerful ship engine. It was featured in the Fortune Global 500 for seven consecutive years. The company’s major stockholders are Mong-Joon Chung (10.15%), Hyundai Mipo Dockyard (7.98%), KCC Corporation (3.12%), Hyundai Motor (2.88%), the Asan Foundation (2.53%), POSCO (1.94%), and the Asan Nanum Foundation (0.65%). Treasury stocks and others account for the remaining shares, 19.36% and 51.39%. No. 20. SK Innovation Co. Ltd. http://eng.skinnovation.com SK Innovation was known as SK Energy until 2011, when it was restructured and renamed. It was founded in December 1962 under the name of Korea Oil Corp. and started operating the first domestic oil refinery in 1964. After becoming a member of SunKyong Group in 1980, the company began ��������������������������������������������������������7 Chairman of Hyosung Group and his relatives.
page 45 of 45
taking the challenging steps needed to become a world-class general energy and chemical company. SK Innovation continues to be a pioneer within the paradigm shift taking place in Korea’s petroleum industry. In 2013, SK Innovation realigned its business system by launching SK Incheon Petrochemical and SK Trading International as new subsidiaries in order to enhance its overall competitiveness. The major shareholders consist of SK Co. and the National Pension Service, accounting for 33.40% and 8.58%, respectively. Domestic institutions, individuals, and foreign investors hold the remaining 58.02% of shares.