the toomre sequence revisited with hst … · resolution than existing ground-based nir data. ......
TRANSCRIPT

THE TOOMRE SEQUENCE REVISITED WITH HST NICMOS: NUCLEAR BRIGHTNESSPROFILES AND COLORS OF INTERACTING AND MERGING GALAXIES1
Jorn Rossa,2,3
Seppo Laine,4Roeland P. van der Marel,
2J. Christopher Mihos,
5
John E. Hibbard,6Torsten Boker,
7and Ann I. Zabludoff
8
Received 2006 July 14; accepted 2007 August 20
ABSTRACT
We discuss the near-infrared (NIR) properties of the nuclei in the 11merging galaxies of the Toomre sequence, basedon high spatial resolution J, H, and K imaging data using NICMOS on board the Hubble Space Telescope (HST ). Theobservations are less affected by dust extinction than our previous HST WFPC2 observations and offer higher spatialresolution than existing ground-based NIR data. Nuclear positions are generally found to be consistent with thosereported from data in other wave bands. In NGC 7764Awe detect for the first time two nuclei with a separation ofabout 260 pc, consistentwith its placement in themiddle of themerging sequence.We see amarginal trend for the nucleito become bluer with advancing merger stage, which we attribute to a dispersal of dust at late times in the merging pro-cess. Our data also indicate a statistically significant trend for the nuclei in the sequence to become more luminous,within an aperture offixed physical size and after correcting for dust extinction, with advancing merger stage. We de-riveK-band surface brightness profiles for those nuclei for which themorphology allows ameaningful isophotal anal-ysis, and fit the profiles with a ‘‘Nuker’’ law for comparison with other samples of galaxies observed with HST. Themajority of the nuclei have steep profiles that can be characterized as power-law type. In general, the Toomre-sequencegalaxies tend to have steeper profiles and higher central luminosity surface densities than E/S0 galaxies. Our findingscan be explained if the Toomre-sequence galaxies have newly formed stars that are concentrated toward their centers.We derive V � K color profiles for the nuclei to further address this possibility, but find that the large amounts of dustextinction complicate their interpretation. Overall, our results are consistent with the generic predictions of N-bodysimulations of spiral galaxy mergers. If left to evolve and fade for several gigayears, it is possible that the properties ofthe Toomre-sequence nuclei would resemble the properties of the nuclei of normal E/S0 galaxies. Our results thereforesupport the view that mergers of spiral galaxies can lead to the formation of early-type galaxies.
Key words: galaxies: evolution — galaxies: formation — galaxies: interactions — galaxies: nuclei —galaxies: spiral
1. INTRODUCTION
It is commonly assumed that the merging of two spiral gal-axies following a close interaction will eventually result in theirtransformation into an elliptical galaxy. This outcomewas first sug-gested by the early simulations of Toomre & Toomre (1972) andlater confirmed by various other investigators (e.g., Barnes 1988;Borne & Richstone 1991). Evidence gathered over the last fewdecades conclusively shows that at least a fraction of ellipticalgalaxies were indeed formed by mergers (see, e.g., the review bySchweizer 1998). Such evidence includes the finding from ground-
based imaging that on global scalesmanymerger remnants arewellfit by the R1/4 luminosity profiles that are characteristic of ellipticalgalaxies (e.g., Schweizer 1982;Wright et al. 1990; Hibbard &Yun1999; Rothberg & Joseph 2004).
Previous studies of spiral-spiral mergers have focused ex-tensively on the tidal tails (e.g., Hibbard & van Gorkom 1996;Hibbard et al. 2001), globular clusters (e.g., Whitmore et al.1993;Whitmore& Schweizer 1995; Schweizer et al. 1996, 2004),young star clusters (e.g., Whitmore et al. 1999, 2005), and dwarfgalaxies that may have formed during the merger (e.g., Braineet al. 2001; Weilbacher et al. 2003). Less attention has been paidto the nuclei, however (although see Schweizer 1996; Scovilleet al. 2000). This is in contrast with the case for, e.g., the nuclearregions of spiral galaxies (Carollo et al. 1997; Boker et al. 2002)and ellipticals (e.g., Lauer et al. 1995; Ravindranath et al. 2001,hereafter R01; Rest et al. 2001; Laine et al. 2003a; Ferrarese et al.2006), which have been studied at high resolution using theHubbleSpace Telescope (HST ). In fact, one of the most important physicalprocesses that occurs during the merging process is the inflow ofgas into the nuclear region (e.g., Noguchi 1988;Mihos&Hernquist1994, 1996; Barnes & Hernquist 1996). To study the question ofwhether and how mergers convert the structure of the nuclearregions from disk galaxy bulges or pseudobulges into the densityprofiles seen in the centers of elliptical galaxies, it is thereforeimportant to investigate the nuclear regions at the highest achiev-able angular resolution.Toomre (1977) assembled a small sample of prospectivemerger
systems in various stages of merging that later became known as
1 Based on observations made with the NASA/ESA Hubble Space Telescope,obtained at the Space Telescope Science Institute, which is operated by the Asso-ciation of Universities for Research in Astronomy (AURA), Inc., under NASA con-tract NAS5-26555. These observations are associated with proposal 9402.
2 Space Telescope Science Institute, 3700 San Martin Drive, Baltimore, MD21218, USA; [email protected].
3 Present address:Department of Astronomy,University of Florida, 211BryantSpace Science Center, P.O. Box 112055, Gainesville, FL 32611-2055, USA; [email protected].
4 Spitzer Science Center, California Institute of Technology, Mail Code 220-6,Pasadena, CA 91125, USA; [email protected].
5 Department of Astronomy, CaseWestern Reserve University, 10900 EuclidAvenue, Cleveland, OH 44106, USA; [email protected].
6 National Radio Astronomy Observatory, 520 Edgemont Road, Charlottes-ville, VA 22903-2475, USA; [email protected].
7 Astrophysics Division, RSSD, European Space Research and TechnologyCentre, NL-2200 AG Noordwijk, The Netherlands; [email protected].
8 Steward Observatory, University of Arizona, 933 North Cherry Avenue,Tucson, AZ 85721-0065, USA; [email protected].
2124
The Astronomical Journal, 134:2124Y2147, 2007 December
# 2007. The American Astronomical Society. All rights reserved. Printed in U.S.A.
the Toomre sequence. We investigated various properties of thisoptically selected merger sample withHST WFPC2, in particularthe response of the nuclei to the merging process (Laine et al.2003b, hereafter Paper I). However, in the optical several of thenuclear regions are hidden behind dust, which makes identifica-tion of the nuclei difficult, if not impossible. Near-infrared (NIR)observations are much less affected by dust, and thus are bettersuited to identifying the location of the nuclei within the often com-plex circumnuclear environments of the host galaxies.
Previous investigations have studied a range of basic proper-ties of various merger samples (e.g., Joseph et al. 1984; Lonsdaleet al. 1984; Stanford & Bushouse 1991; Bushouse & Stanford1992; Rothberg & Joseph 2004). Most of the Toomre-sequencegalaxies have been studied previously from the ground at NIRwavelengths:NGC4038/4039 (Bushouse&Werner 1990;Hibbardet al. 2001;Kassin et al. 2003), NGC4676 (J.Hibbard 2006, unpub-lished), NGC 7592 (Bushouse &Werner 1990), NGC 6621/6622(Bushouse & Werner 1990), NGC 3509 (Bushouse & Stanford1992), NGC 520 (Bushouse & Stanford 1992; Kotilainen et al.2001), NGC 3256 (Kotilainen et al. 1996), andmore recently, allfour late-stagemergers (Rothberg& Joseph 2004). However, theseobservations either lacked adequate spatial resolution to reveal thedetailed structure of the nuclei, or were aimed at investigating prop-
erties on larger scales. In order to explore the nuclear regions them-selves, the high spatial resolution of the HST (5Y50 pc at the dis-tance of the Toomre-sequence galaxies) is imperative.
We present here a study of the entire Toomre sequence withHST NICMOS.Thiswork is part of a high spatial resolutionmulti-instrument HST survey of the nuclear regions in the Toomresequence (cf. Table 1), including WFPC2, NICMOS, and STISobservations. Earlier (see Paper I) we reported on the nuclearmor-phologies and luminosity densities based on WFPC2 broad- andnarrowband observations. In a future paper (J. Rossa et al. 2008, inpreparation, hereafter Paper III) we will present stellar populationstudies based on STIS G430L spectra. In this paper we focus onthe nuclearmorphology and photometric properties as revealed bythe NICMOS observations. We make a detailed comparison withour previous WFPC2 observations and other existing multiwave-length observations, and discuss the results in the context of theevolution of merging galaxies and the formation of ellipticals.
Our investigation is the first comprehensive high spatial reso-lution study of an optically selected sample of mergers. Merginggalaxies often have high infrared luminosities (Sanders et al. 1988),sometimes in excess of LIR � 1011 L�, and samples of LIRGS( luminous infrared galaxies) and ULIRGS (ultraluminous in-frared galaxies) are dominated by merging systems (Sanders &
TABLE 1
The Nuclei of the Toomre Sequence
Seq. No.
(1)
Galaxy
(2)
Alt. Name
(3)
R.A. (J2000.0)
(4)
Decl. (J2000.0)
(5)
Comments on
Nuc. Morph.
(6)
cz
(km s�1)
(7)
Distance
(Mpc)
(8)
0.100
( pc)
(9)
Class
(10)
Early Stage
1..................... NGC 4038 Arp 244 12 01 53.06 �18 52 03.6 c, d, f 1616 13.8 7 . . .1..................... NGC 4039 Arp 244 12 01 53.61 �18 53 10.7 p 1624 13.8 7 . . .
2..................... NGC 4676A Arp 242 12 46 10.09 +30 43 54.6 p+s, b? 6613 88.2 43 LINER
2..................... NGC 4676B Arp 242 12 46 11.21 +30 43 22.2 p 6613 88.2 43 LINER
3..................... NGC 7592 W VV 731 23 18 21.78 �04 24 58.0 p+r 7280 97.1 47 Sy2
3..................... NGC 7592 E VV 731 . . . . . . c, e, f 7280 97.1 47 . . .
4..................... NGC 7764A E AM 2350�410 23 53 23.75 �40 48 25.2 p+f 9162 122.2 59 . . .
4..................... NGC 7764A W AM 2350�410 23 53 23.72 �40 48 25.4 p 9162 122.2 59 . . .
Midstage
5..................... NGC 6621 Arp 81 18 12 55.34 +68 21 48.8 p+c, e 6191 84.4 41 . . .
5..................... NGC 6622 Arp 81 18 12 59.40 +68 21 15.0 p 6466 84.4 41 . . .6..................... NGC 3509 Arp 335 11 04 23.63 +04 49 43.9 p 7704 102.7 50 . . .
7..................... NGC 520 S Arp 157 01 24 34.91 +03 47 29.1 p 2281 30.4 15 . . .
7..................... NGC 520 N Arp 157 01 24 33.29 +03 48 02.6 p?, c 2281 30.4 15 . . .
Late Stage
8..................... NGC 2623 Arp 243 08 38 24.14 +25 45 16.1 p 5535 73.8 36 LINER
9..................... NGC 3256 N VV 65 10 27 51.17 �43 54 15.6 p 2738 36.5 18 . . .9..................... NGC 3256 S VV 65 10 27 51.16 �43 54 20.8 e 2738 36.5 18 . . .
10................... NGC 3921 Arp 224 11 51 07.19 +55 04 43.1 p 5838 77.8 38 LINER
11................... NGC 7252 Arp 226 22 20 44.77 �24 40 42.6 p, s 4688 62.5 30 . . .
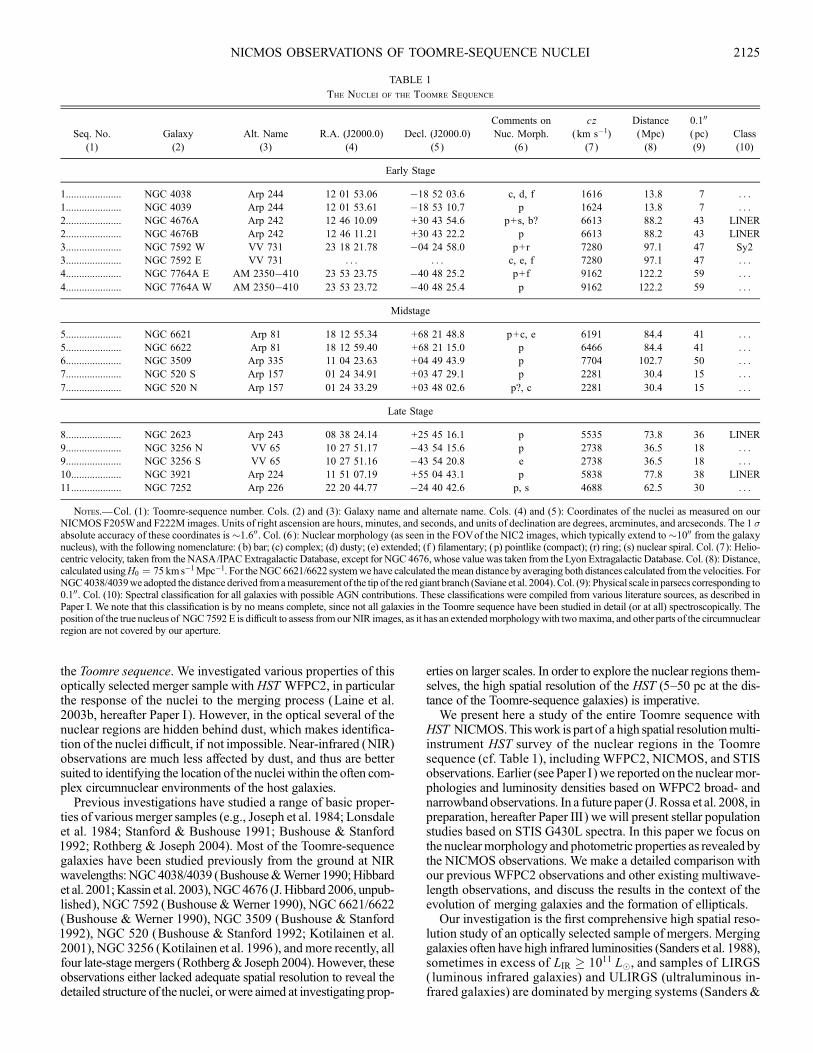
Notes.—Col. (1): Toomre-sequence number. Cols. (2) and (3): Galaxy name and alternate name. Cols. (4) and (5): Coordinates of the nuclei as measured on ourNICMOS F205Wand F222M images. Units of right ascension are hours, minutes, and seconds, and units of declination are degrees, arcminutes, and arcseconds. The 1 �absolute accuracy of these coordinates is�1.600. Col. (6): Nuclear morphology (as seen in the FOVof the NIC2 images, which typically extend to�1000 from the galaxynucleus), with the following nomenclature: (b) bar; (c) complex; (d) dusty; (e) extended; (f ) filamentary; (p) pointlike (compact); (r) ring; (s) nuclear spiral. Col. (7): Helio-centric velocity, taken from the NASA/IPAC Extragalactic Database, except for NGC 4676, whose value was taken from the Lyon Extragalactic Database. Col. (8): Distance,calculated usingH0 ¼ 75 kms�1Mpc�1. For theNGC6621/6622 systemwe have calculated themean distance by averaging both distances calculated from the velocities. ForNGC4038/4039we adopted the distance derived fromameasurement of the tip of the red giant branch (Saviane et al. 2004).Col. (9): Physical scale in parsecs corresponding to0.100. Col. (10): Spectral classification for all galaxies with possible AGN contributions. These classifications were compiled from various literature sources, as described inPaper I. We note that this classification is by no means complete, since not all galaxies in the Toomre sequence have been studied in detail (or at all) spectroscopically. Theposition of the true nucleus of NGC7592 E is difficult to assess from our NIR images, as it has an extendedmorphologywith twomaxima, and other parts of the circumnuclearregion are not covered by our aperture.
NICMOS OBSERVATIONS OF TOOMRE-SEQUENCE NUCLEI 2125
Mirabel 1996). The present optically selected sample thus pro-vides a useful comparison to HST NICMOS studies of mergerremnants selected only on the basis of their infrared luminosity(e.g., Scoville et al. 2000; Borne et al. 1999).
This paper is structured in the following way: in x 2we presentthe observations and the data reduction procedures. In x 3we showresults on the nuclear morphology and color mapping for each in-dividual system separately (grouped in three merger stages), andcompare them with other multiwavelength studies. In x 4 we pres-ent and discuss photometry, colors, and radial color profiles for theToomre nuclei. In x 5 we present K-band surface brightness pro-files, and discuss the results in the context of the evolution ofmerg-ing galaxies and the formation of early-type galaxies. In x 6 wesummarize the main results of the paper.
2. SAMPLE AND OBSERVATIONS
2.1. Sample
Our sample is the Toomre sequence of relatively nearby (D �122Mpc), strongly interacting andmerging galaxies, ordered ac-cording to the estimated degree of completeness of the mergingprocess (Toomre 1977). The basic properties of the 11 systemsare listed in Table 1. Distances in the table and throughout this pa-per are based on a Hubble constant of H0 ¼ 75 km s�1 Mpc�1,save for the distance to the Antennae, which is based on observa-tions of red giant branch stars (Saviane et al. 2004). The systemsspan a wide range of dynamical phases, from galaxies early in themerging process (e.g., NGC 4038/4039) to late-stage systems(merger remnants; e.g., NGC 7252). A detailed description of theoptical morphology of the nuclear regions is presented in Paper I.We emphasize that the Toomre sequence was chosen originallybased on the visual inspection of photographic plates, mostly thosepresented in the Atlas of Peculiar Galaxies (Arp 1966), and therough merger stage has been derived from the degree of coales-cence (Toomre 1977). Although the very early and very late stagescan be distinguished quite unambiguously, an exact placement in asequence may be possible only after deriving the dynamical his-tory of the merger through detailed simulations.
2.2. Observations and Data Reduction
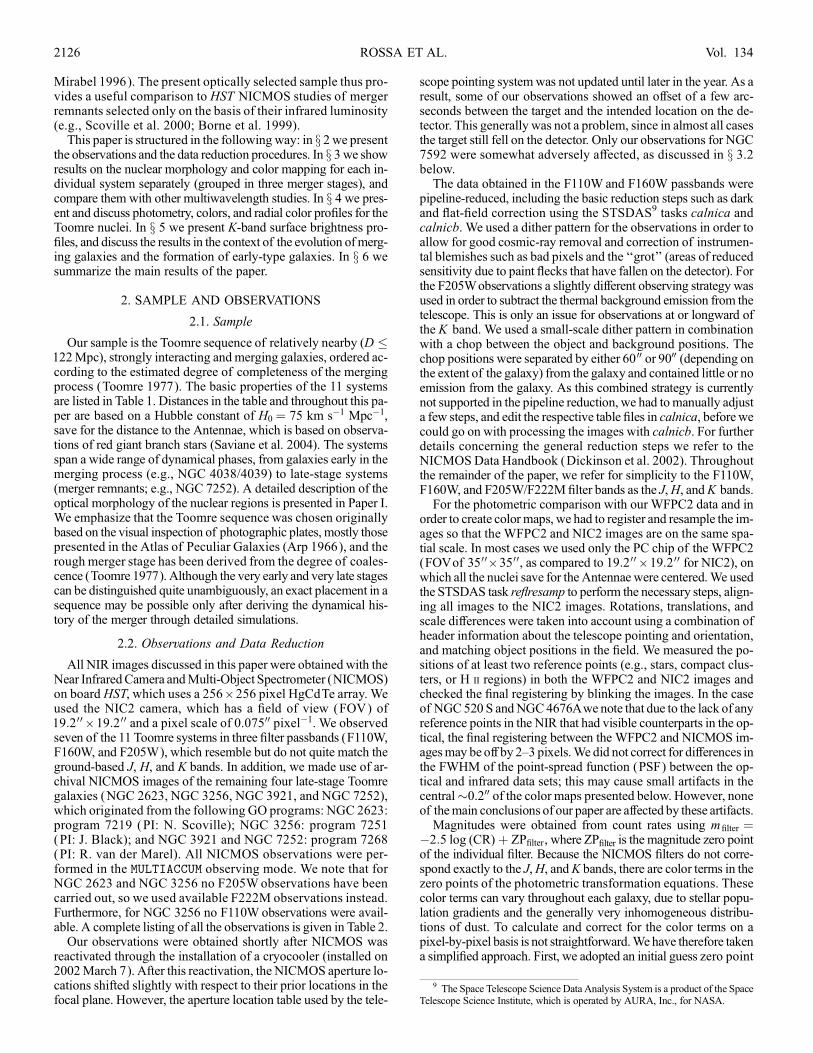
All NIR images discussed in this paper were obtained with theNear InfraredCamera andMulti-Object Spectrometer (NICMOS)on board HST, which uses a 256 ; 256 pixel HgCdTe array. Weused the NIC2 camera, which has a field of view (FOV) of19:200 ; 19:200 and a pixel scale of 0.07500 pixel�1. We observedseven of the 11 Toomre systems in three filter passbands (F110W,F160W, and F205W), which resemble but do not quite match theground-based J, H, and K bands. In addition, we made use of ar-chival NICMOS images of the remaining four late-stage Toomregalaxies (NGC 2623, NGC 3256, NGC 3921, and NGC 7252),which originated from the following GO programs: NGC 2623:program 7219 (PI: N. Scoville); NGC 3256: program 7251(PI: J. Black); and NGC 3921 and NGC 7252: program 7268(PI: R. van der Marel). All NICMOS observations were per-formed in the MULTIACCUM observing mode. We note that forNGC 2623 and NGC 3256 no F205Wobservations have beencarried out, so we used available F222M observations instead.Furthermore, for NGC 3256 no F110W observations were avail-able. A complete listing of all the observations is given in Table 2.
Our observations were obtained shortly after NICMOS wasreactivated through the installation of a cryocooler (installed on2002March 7). After this reactivation, the NICMOS aperture lo-cations shifted slightly with respect to their prior locations in thefocal plane. However, the aperture location table used by the tele-
scope pointing systemwas not updated until later in the year. As aresult, some of our observations showed an offset of a few arc-seconds between the target and the intended location on the de-tector. This generally was not a problem, since in almost all casesthe target still fell on the detector. Only our observations for NGC7592 were somewhat adversely affected, as discussed in x 3.2below.The data obtained in the F110W and F160W passbands were
pipeline-reduced, including the basic reduction steps such as darkand flat-field correction using the STSDAS9 tasks calnica andcalnicb. We used a dither pattern for the observations in order toallow for good cosmic-ray removal and correction of instrumen-tal blemishes such as bad pixels and the ‘‘grot’’ (areas of reducedsensitivity due to paint flecks that have fallen on the detector). Forthe F205Wobservations a slightly different observing strategy wasused in order to subtract the thermal background emission from thetelescope. This is only an issue for observations at or longward ofthe K band. We used a small-scale dither pattern in combinationwith a chop between the object and background positions. Thechop positions were separated by either 60 00 or 9000 (depending onthe extent of the galaxy) from the galaxy and contained little or noemission from the galaxy. As this combined strategy is currentlynot supported in the pipeline reduction, we had tomanually adjusta few steps, and edit the respective table files in calnica, beforewecould go on with processing the images with calnicb. For furtherdetails concerning the general reduction steps we refer to theNICMOSData Handbook (Dickinson et al. 2002). Throughoutthe remainder of the paper, we refer for simplicity to the F110W,F160W, and F205W/F222Mfilter bands as the J,H, andK bands.For the photometric comparison with our WFPC2 data and in
order to create color maps, we had to register and resample the im-ages so that the WFPC2 and NIC2 images are on the same spa-tial scale. In most cases we used only the PC chip of the WFPC2(FOVof 3500 ; 3500, as compared to 19:200 ; 19:200 for NIC2), onwhich all the nuclei save for the Antennae were centered.We usedthe STSDAS task reflresamp to perform the necessary steps, align-ing all images to the NIC2 images. Rotations, translations, andscale differences were taken into account using a combination ofheader information about the telescope pointing and orientation,and matching object positions in the field. We measured the po-sitions of at least two reference points (e.g., stars, compact clus-ters, or H ii regions) in both the WFPC2 and NIC2 images andchecked the final registering by blinking the images. In the caseof NGC520 S andNGC4676Awe note that due to the lack of anyreference points in the NIR that had visible counterparts in the op-tical, the final registering between the WFPC2 and NICMOS im-agesmay be off by 2Y3 pixels.We did not correct for differences inthe FWHM of the point-spread function (PSF) between the op-tical and infrared data sets; this may cause small artifacts in thecentral�0.200 of the color maps presented below. However, noneof themain conclusions of our paper are affected by these artifacts.Magnitudes were obtained from count rates using mBlter ¼
�2:5 log (CR) þ ZPBlter, where ZPfilter is the magnitude zero pointof the individual filter. Because the NICMOS filters do not corre-spond exactly to the J,H, andK bands, there are color terms in thezero points of the photometric transformation equations. Thesecolor terms can vary throughout each galaxy, due to stellar popu-lation gradients and the generally very inhomogeneous distribu-tions of dust. To calculate and correct for the color terms on apixel-by-pixel basis is not straightforward.We have therefore takena simplified approach. First, we adopted an initial guess zero point
9 The Space Telescope Science Data Analysis System is a product of the SpaceTelescope Science Institute, which is operated by AURA, Inc., for NASA.
ROSSA ET AL.2126 Vol. 134
that depends only on the filter. These zero points were based onthe color terms appropriate for a 109 yr old population (as givenby Bruzual & Charlot 2003) without additional reddening. Thecolor termswere calculated using the calcphot task in the STSDASpackage SYNPHOT. We then refined the zero points on a galaxy-by-galaxy basis. For each galaxywe calculated (as discussed in x 4)the count rates in several apertures offixed sizes. These were com-bined with the initial-guess zero points to obtain initial guesses forthe J, H, and Kmagnitudes. We then used these magnitudes to es-timate the colors in the aperture, and subsequently we used thesecolors to improve the zero-point estimates.
From a variety of tests we infer that this iterative scheme yieldsmagnitudes that are accurate to�0.05mag in each of the J,H, andK bands. This is generallymuch smaller than the variations in coloreither within a given galaxy or between different galaxies. Whenquoting aperture magnitudes in x 4 we use the zero points calcu-lated specifically for each given combination of filter, galaxy, andaperture.When displaying the images, constructing surface bright-ness profiles, and constructing color maps, we adopt a single zeropoint for each combination offilter and galaxy by averaging thezero points calculated for the 100 pc and 1 kpc apertures. Ourcalibrated magnitudes are in a system defined by the J-,H-, and
TABLE 2
NICMOS Observations
Galaxy
(1)
Data Set Identifier
(HST Archive)
(2)
Date
(3)
Filter
(4)
kcen(�m)
(5)
texp(s)
(6)
NGC 4038.............................. N8FR01010 2003 Jun 12 F110W 1.1264 160
NGC 4038.............................. N8FR01020 2003 Jun 12 F160W 1.6037 160
NGC 4038.............................. N8FR01030 2003 Jun 12 F205W 2.0658 448
NGC 4039.............................. N8FR02010 2003 May 26 F110W 1.1264 160
NGC 4039.............................. N8FR02020 2003 May 26 F160W 1.6037 160
NGC 4039.............................. N8FR02030 2003 May 26 F205W 2.0658 448
NGC 4676A........................... N8FR03010 2003 Jun 12 F110W 1.1264 192
NGC 4676A........................... N8FR03020 2003 Jun 12 F160W 1.6037 160
NGC 4676A........................... N8FR03030 2003 Jun 12 F205W 2.0658 448
NGC 4676B ........................... N8FR04010 2003 Jun 21 F110W 1.1264 192
NGC 4676B ........................... N8FR04020 2003 Jun 21 F160W 1.6037 160
NGC 4676B ........................... N8FR04030 2003 Jun 21 F205W 2.0658 448
NGC 7592 E+W.................... N8FR05010 2002 Oct 4 F110W 1.1264 160
NGC 7592 E+W.................... N8FR05020 2002 Oct 4 F160W 1.6037 160
NGC 7592 E+W.................... N8FR05030 2002 Oct 4 F205W 2.0658 448
NGC 7764A E+W................. N8FR06010 2003 Apr 24 F110W 1.1264 192
NGC 7764A E+W................. N8FR06020 2003 Apr 24 F160W 1.6037 192
NGC 7764A E+W................. N8FR06030 2003 Apr 24 F205W 2.0658 448
NGC 6621.............................. N8FR07010 2002 Aug 30 F110W 1.1264 224
NGC 6621.............................. N8FR07020 2002 Aug 30 F160W 1.6037 224
NGC 6621.............................. N8FR07030 2002 Aug 30 F205W 2.0658 448
NGC 6622.............................. N8FR08010 2002 Aug 28 F110W 1.1264 224
NGC 6622.............................. N8FR08020 2002 Aug 28 F160W 1.6037 224
NGC 6622.............................. N8FR08030 2002 Aug 28 F205W 2.0658 448
NGC 3509.............................. N8FR09010 2002 Oct 30 F110W 1.1264 160
NGC 3509.............................. N8FR09020 2002 Oct 30 F160W 1.6037 160
NGC 3509.............................. N8FR09030 2002 Oct 30 F205W 2.0658 448
NGC 520 S ............................ N8FR10010 2003 Jan 18 F110W 1.1264 160
NGC 520 S ............................ N8FR10020 2003 Jan 18 F160W 1.6037 160
NGC 520 S ............................ N8FR10030 2003 Jan 18 F205W 2.0658 448
NGC 520 N............................ N8FR11010 2003 Jan 18 F110W 1.1264 160
NGC 520 N............................ N8FR11020 2003 Jan 18 F160W 1.6037 160
NGC 520 N............................ N8FR11030 2003 Jan 18 F205W 2.0658 448
NGC 2623.............................. N48H23010 1997 Nov 19 F110W 1.1264 88
NGC 2623.............................. N48H23020 1997 Nov 19 F160W 1.6037 88
NGC 2623.............................. N48H23030 1997 Nov 19 F222M 2.2177 120
NGC 3256.............................. N4G601080 1997 Nov 28 F160W 1.6037 48
NGC 3256.............................. N4G601090/91 1997 Nov 28 F222M 2.2177 80
NGC 3921.............................. N49J09040 1998 Jan 10 F110W 1.1264 160
NGC 3921.............................. N49J09020/60 1998 Jan 10 F160W 1.6037 192
NGC 3921.............................. N49J09080/81/82 1998 Jan 10 F205W 2.0658 256
NGC 7252.............................. N49J12040 1997 Nov 11 F110W 1.1264 128
NGC 7252.............................. N49J12020/60 1997 Nov 11 F160W 1.6037 128
NGC 7252.............................. N49J12080/81/82 1997 Nov 11 F205W 2.0658 256
Notes.—Col. (1): Galaxy identifier. Col. (2): Data set identifier from the HST data archive. Col. (3): Date of obser-vations. Col. (4):HST NICMOS filter used. Col. (5): Central wavelength. Col. (6): Exposure time. Note that for NGC 3256no F110Wobservations are available in the archive. TheK-band observations for NGC 2623 andNGC3256were performedwith the F222M filter, which covers the CO continuum (2.15Y2.29 �m).
NICMOS OBSERVATIONS OF TOOMRE-SEQUENCE NUCLEI 2127No. 6, 2007

K-band filter transmission curves of the Bessell system (Bessell&Brett 1988).
3. NUCLEAR MORPHOLOGY
3.1. Introduction
Figures 1 (NGC 4038) through 16 (NGC 7252) show imagesof the nuclear regions of the Toomre-sequence galaxies. Most fig-ures show three panels arranged as follows: the left panel in eachfigure shows the WFPC2 F555W (V-band) image from Paper I;the middle panel shows the NICMOS K-band image from thepresent study; and the right panel shows theV � K image.A com-parison of theVandK bands provides the longest baseline in colorspace available from our HST data. We also created color imagesof J � H , J � K, andH � K, composed entirely of theNICMOSdata. However, these generally show the same structure as theV � K images, at lower contrast, so we do not present them here.Also, most galaxies reveal very similar morphology in the J, H,and K bands, so we only show the K images.
In this sectionwe describe the nuclearmorphologies on a galaxy-by-galaxy basis, focusing on the information revealed by the J, H,and K images. Of course, many of the Toomre-sequence galaxieshave also been observed at other wavelengths. For example, sevenof the 11 systems have X-ray imaging from either Chandra orXMM-Newton in the X-ray regime, while NGC 6621/6622 wasstudied with the ROSAT PSPC; only NGC 3509, NGC 7592,
and NGC 7764A have not yet been studied in X-rays. Many ofthe Toomre-sequence galaxies have also been studied with mod-erate angular resolution in H i and in the radio continuum and inCO lines (e.g., Norris & Forbes 1995; Hibbard & van Gorkom1996; Georgakakis et al. 2000; Hibbard et al. 2001; Iono et al.2005). All these observations at other wavelengths have provideda wealth of information. However, we highlight in the discussionsbelow only those aspects that have a direct impact on the inter-pretation of features observed in the NICMOS images.One advantage of our high spatial resolution NICMOS data
is that it allows better identification of the nuclei in the Toomre-sequence galaxies than do either ground-based or optical data. Inthis context we define ‘‘nucleus’’ loosely as a light concentrationthat has properties consistent with it being the center of the gal-axy itself, or one of its merging progenitor galaxies. Table 1 liststhe nuclei identified in our data, including their right ascensionand declination. These positions are measured from the NICMOSdata, and have an absolute accuracy limited to �1.600 (Ptak et al.2006) due to guide-star catalog uncertainties and uncertainties inthe relative positions of the HST instruments and Fine GuidanceSensors in theHST focal plane. For the NICMOS imaging of NGC3921, we have some evidence that the astrometry is in fact off byseveral arcseconds, and believe that the absolute positions inferredfrom the WFPC2 data, as listed in Paper I, are more accurate.While we typically have not marked in Figures 1Y16 the positionsof the nuclei we identify, their positions can always be easily
Fig. 2.—Same as Fig. 1, but for NGC 4039 (FOV: 1:3 kpc ; 1:3 kpc).
Fig. 1.—V-band (left ),K-band (middle), andV � K (right ) images of the circumnuclear region inNGC 4038. The nucleus is marked by a square in theV-band image, asin this particular case several nuclear components are visible. The displayed FOV translates to a physical size of 1:3 kpc ; 1:3 kpc. To visually indicate the scale we showan aperture of diameter 100 pc (solid circle) and, for all nuclei other than the Antennae, also of 1 kpc (dashed circle) at the bottom left of the V-band image.
ROSSA ET AL.2128 Vol. 134

located (if they are not already obvious from the images) by com-bining the positions in the table with the coordinates listed alongthe image axes.
In order to unambiguously identify the nuclei of the Toomresequence, it is important to compare the derived infrared positionsof the nuclei with measurements at other wavelengths that are rel-atively insensitive to dust, such as X-ray, radio continuum, andCO emission. Table 3 lists the offsets between the absolute posi-tions inferred from our NICMOS data and those inferred fromdata in these other wavelengths (where available). In general thepositions from different wavelengths agree within the uncertain-ties; in the discussions below we address the nuclear positionsonly in those cases where the agreement is not good.
Many of the Toomre galaxies have quite complex nuclear mor-phologies in the NICMOS images. Some interesting features areobvious when blinking or displaying images at various contrastlevels on a high-resolution computer screen, but can be muchharder to identify and interpret on the figures reproduced here.The discussions presented below are therefore intended to guidethe reader through the most relevant features. Descriptions suchas ‘‘compact,’’ ‘‘concentrated,’’ and ‘‘extended’’ are qualitative innature and refer only to the visual impression obtained from theimages. The term ‘‘circumnuclear region’’ is used loosely to de-note the region in the immediate vicinity of the nucleus. No par-ticular scale is necessarily implied, but we generally use this termto denote only a small fraction (say, 10%Y30%) of the size of theFOV. The NIC2 FOV corresponds to 7.5 kpc at the median dis-
tance of the sample galaxies, so the circumnuclear region doesnot generally extend beyond�1 kpc from the nucleus.When ref-erring to the entire NIC2 FOV (which is generally much smallerthan the full size of the sample galaxies) we refer to the ‘‘centralregion’’ of the galaxy. More quantitative measures of the nuclearstructure, such as detailed aperture photometry, color index pro-files, and surface brightness profiles of the nuclei, are presentedand discussed in xx 4 and 5.
3.2. Early-Stage Systems: NGC 4038/4039 (The Antennae),NGC 4676 (The Mice), NGC 7592, and NGC 7764A
The Antennae10 were imaged in two separate pointings, onecentered on the nucleus of NGC 4038 (Fig. 1) and the other cen-tered on the nucleus of NGC 4039 (Fig. 2). As a result of theNICMOS aperture location offset discussed in x 2.2, the imageswere not centered exactly on the presumed nuclear positions (de-termined from previous WFPC2 imagery). The nucleus of NGC4039 is an easily identified concentrated source (see Fig. 2). By
Fig. 3.—Same as Fig. 1, but for NGC 4676A (FOV: 8:1 kpc ; 8:1 kpc).
Fig. 4.—Same as Fig. 1, but for NGC 4676B (FOV: 8:1 kpc ; 8:1 kpc).
10 We use a different distance to the Antennae as compared to Paper I. In thatpaper we adopted the distance of 21.6Mpc implied by the observed redshift of theAntennae, neglecting any potential peculiar velocity of the system. Instead, weadopt here the value of 13.8 Mpc, which was recently derived from measure-ments of the tip of the red giant branch (TRGB; Saviane et al. 2004). While thisdistance puts the Antennae closer than has been assumed in most previous works,the TRGB method has been well demonstrated, and the inferred distance shouldbe more accurate than the canonical redshift distance.
NICMOS OBSERVATIONS OF TOOMRE-SEQUENCE NUCLEI 2129No. 6, 2007

contrast, NGC 4038 does not seem to possess a highly concen-trated nuclear region; however, a probable nucleus can be iden-tified in all three NIR filter bands (marked with a square in Fig. 1).Given the patchy dust obscuring the view into the nucleus in theoptical regime, optical identifications of the nuclei can bemislead-ing. In the case of NGC 4038, the nucleus identified in Paper I ismost likely a circumnuclear H ii region (see also Whitmore et al.1999). It is very blue in V � K, and is likely a foreground star-forming knot located in front of a region of high extinction. Thenucleus identified here using the NICMOS images is barely vis-ible in the optical.
A comparisonwith the results obtained from data at other wave-lengths does not provide an unambiguous answer to the questionof whether the nucleus of NGC 4038 has been correctly identi-fied. This may not be surprising, given the intrinsically complexnature of the nuclear region.We have identified the clump closestto the center of the overall light profile as the nucleus; this posi-tion is consistent with that implied by radio continuum data, ifone assumes that the nucleus coincides with the brightest sourceobserved at 6 cm (as assumed for Table 3). However, there areseveral bright sources in the nuclear area. If the radio continuumnucleus is presumed to reside at the centroid of these sources (asNeff & Ulvestad 2000 presume; see their Fig. 5a), then the radiocontinuum and NICMOS positions are not in mutual agreement.A more accurate alignment of the NIR and radio data might bepossible using the technique of Whitmore & Zhang (2002), butwe do not pursue that here.
The Antennae have also been studied extensively in the X-rayregime (e.g., Fabbiano et al. 1997, 2001 and follow-up papers).TheNICMOS position of NGC 4038’s nucleus is consistent withsource 24 in the list of Zezas et al. (2002a, 2002b) and may wellbe the nucleus (as assumed for Table 3). However, Zezas et al.(2002a, 2002b) actually identify their source 25 as the nucleus,offset in declination by about 600 from the NICMOS position.There is little evidence in the NICMOS images to favor source 25as the nucleus, and in fact source 24 has a much larger X-rayflux.We have observed NGC 4676 in two pointings and clearly de-
tect the nuclei of both galaxies. The northern galaxy, NGC 4676A(Fig. 3), shows a highly concentrated infrared source, completelyobscured in the optical, which we identify as the nucleus. The sec-ond nucleus (NGC 4676 B) shows a concentrated nuclear regionwith a smooth appearance (Fig. 4).We acquired NICMOS images of NGC 7592 in one pointing,
as both nuclei in principle fit into the FOVof theNIC2 aperture (seeFig. 5). However, this observation was affected by the NICMOSaperture location offset, discussed in x 2.2, which placed the secondcircumnuclear region right on the edge of the NIC2 aperture. Al-though the image covers most of the circumnuclear region, this re-gion shows a very complex morphology, and there is a chance thatthe true eastern nucleus (NGC 7592 E) is located outside the FOV.In contrast, the western nucleus (NGC 7592 W) is clearly definedand compact, andwas previously identifiedbyRafanelli&Marziani(1992) to be of Seyfert 2 type.
Fig. 5.—Same as Fig. 1, but for NGC 7592 (FOV: 8:9 kpc ; 8:9 kpc).
Fig. 6.—Same as Fig. 1, but for NGC 7764A (FOV: 11:3 kpc ; 11:3 kpc).
ROSSA ET AL.2130 Vol. 134

The nuclear region of NGC 7764A is shown in Figure 6.Whenenlarged, all three NICMOS images (J,H, and K ) reveal what ap-pears to be a double nucleus in this system (see Fig. 7). If thesetruly are twomerging galaxy nuclei, it is consistent with the place-ment of NGC 7764A in the middle of the Toomre sequence. Thetwo putative nuclei are separated in a nearly east-west directionby 0.4300, which corresponds to 260 pc at the distance to NGC7764A. This is similar to the separation of the two nuclei in themerging galaxy Arp 220 (Scoville et al. 1998).
3.3. Midstage Systems: NGC 6621/6622, NGC 3509,and NGC 520
The nucleus of NGC 6621 is detected in the infrared and has afainter counterpart in the optical images (see Fig. 8). The circum-nuclear region has a complexmorphology, even in theK band. Incontrast, the nuclear region of NGC 6622 appears much less com-plex, showing only a single concentrated source, which we iden-tify as the nucleus (Fig. 9).
The nuclear region of NGC 3509 looks rather inconspicuous,with only a single, well-defined nucleus (Fig. 10), appearing asa concentrated but clearly resolved source. As noted already in
Paper I, NGC 3509 has possibly experienced a minor merger inthe past, as only one clear tidal tail is visible in deep optical im-ages (cf. Arp 1966). The relatively low value of the IRAS flux den-sity ratio at 60 �m over 100 �m ( f60/f100 � 0:33) also favors ascenario in which star formation has been suppressed comparedto the othermidstagemergers in the Toomre sequence,which showmore vigorous signs of recent or ongoing star formation (cf. Figs. 7and 8 of Paper I).
NGC 520 was also observed in two pointings. The NIR obser-vations of the southern nucleus (NGC 520 S) are quite striking(Fig. 11), revealing a nucleus completely hidden in the optical be-hind an enormous dust complex. The J-band observations show aconsiderable amount of dust present around the nuclear region. Atlonger wavelengths (H andK ) we peer deeper through the dust to-ward the nucleus, but even the K image is affected by patchy duststructure around the circumnuclear region. However, the nucleusis clearly visible, appearing as an extended disk composed of atleast seven major knots. The brightest knot, which we identify asthe nucleus, is slightly extended toward the north. Interestingly,the nuclear disk, which appears almost edge-on in the east-westdirection, is slightly skewed with respect to the large-scale dustlane. Such a misalignment is also seen in Centaurus A (Schreieret al. 1998).
Previous subarcsecond resolution ground-based NIR imagingalso revealed an extended disk around NGC 520 S (Kotilainenet al. 2001). However, considerable substructure was only seenin Br� observations, not in their K-band image. Radio observa-tions at 2 cm (Carral et al. 1990) also showed an extended diskwith five prominent knots, very similar inmorphology to our fivebrightest components. More recently, high spatial resolution radiocontinuum observations at 21.4 cm obtained with MERLIN re-vealed an extended disk with at least nine bright components(Beswick et al. 2003), also consistent with the NIR morphol-ogy. The much less obscured northern nucleus (NGC 520 N) re-veals a bright, centrally confined, compact morphology, embeddedin an amorphous disk that is highly inclined to the line of sight (seeFig. 12).
3.4. Late-Stage Systems: NGC 2623, NGC 3256,NGC 3921, and NGC 7252
The nuclear region of NGC 2623 shows a highly concentratedlight profile (Fig. 13). Consistent with our previous findings (seePaper I), only one nucleus is identified, appearing slightly elon-gated in the east-west direction. There is no clear nucleus discern-ible in the optical image.
Fig. 7.—Enlarged view of the K-band image of the circumnuclear region inNGC 7764A, shown in inverted gray scale and revealing the two nuclei. The dis-played FOV translates to a physical size of 2:7 kpc ; 2:7 kpc.
Fig. 8.—Same as Fig. 1, but for NGC 6621 (FOV: 3:9 kpc ; 3:9 kpc).
NICMOS OBSERVATIONS OF TOOMRE-SEQUENCE NUCLEI 2131No. 6, 2007

Our analysis of the late-stagemerger galaxyNGC3256 is basedon archival NICMOS images inH and F222M (hereafter referredto as K; see Fig. 14); no J-band data exist. The nuclear region(NGC 3256 N) appears as a concentrated and smooth source.Radio imaging at 3 and 6 cm, performed by Norris & Forbes(1995), identified a second nucleus 500 south of the primary (NGC3256 S). Studies of molecular gas emission also hint at a secondnucleus at the same location (Sakamoto et al. 2006). Boker et al.(1997) also imagedNGC 3256 in theN band and detected a sourceat this same position. Based on radio and X-ray power and their ra-tios, Neff et al. (2003) argue that both nucleimay be low-luminosityactive galactic nuclei. In our NICMOS data there is a compactsource at the position of the secondary nucleus, but with fainterintensity than the primary nucleus. The source appears projectedonto the middle of a spiral arm, lying in a highly reddened regioncorresponding to a local maximum in the V � K image. It has anextinction-corrected K-band magnitude of �18.2, similar to thenuclei in the other Toomre-sequence galaxies (see x 4.3). All thissupports the view that there is in fact a highly extincted infraredcounterpart to the secondary nucleus that was detected in radio,MIR, and X-ray data.
We also analyzed archival images of NGC 3921. The nuclearregion shows a slightly elongated core in the north-northeast tosouth-southwest direction (see Fig. 15), with only one nucleus de-tected. Our findings are consistent with earlier studies (Schweizer1996) and with the fact that NGC 3921 is generally regarded as alate-stage merger remnant with properties resembling ellipticalgalaxies. In a recent X-ray study byNolan et al. (2004), however,
the X-ray luminosity of the hot diffuse gas was found to be 2 or-ders of magnitude less than that typical of elliptical galaxies.Our images of the latest stage merger remnant of the Toomre
sequence, NGC 7252, show a nuclear spiral (see Fig. 16), as al-ready detected in the optical and described in our previous study(Paper I).Only one nucleus is identified in all three filter passbands,consistent with previous ground-based studies (e.g., Schweizer1982; Hibbard et al. 1994) and with the general notion of NGC7252 being a prototype merger remnant, with an estimated ageof about 1 Gyr (e.g., Schweizer 1998).
4. PHOTOMETRY AND COLORS
4.1. Photometry
We measured the J, H, and K magnitudes for all identifiedToomre-sequence nucleiwithin apertures 100 pc and 1 kpc in size.Depending on the distance to each galaxy, the 100 pc aperture cor-responds to 2Y20 pixels and the 1 kpc aperture corresponds to23Y200 pixels. Fluxes were measured with the IRAF11 task phot,centered on the identified nuclei; the resulting magnitudes arelisted in Tables 4 and 5. The photometric random errors on themagnitudes and colors are very small (with amedian of 0.01mag)and are not listed in the tables. The actual errors are dominated by
Fig. 9.—Same as Fig. 1, but for NGC 6622 (FOV: 7:8 kpc ; 7:8 kpc).
Fig. 10.—Same as Fig. 1, but for NGC 3509 (FOV: 9:5 kpc ; 9:5 kpc).
11 IRAF is distributed by theNational Optical AstronomyObservatory, whichis operated by AURA, Inc., under cooperative agreement with the National Sci-ence Foundation.
ROSSA ET AL.2132 Vol. 134

systematic calibration uncertainties (P0.05 mag in each band; seex 2.2).
4.2. Near-Infrared Colors
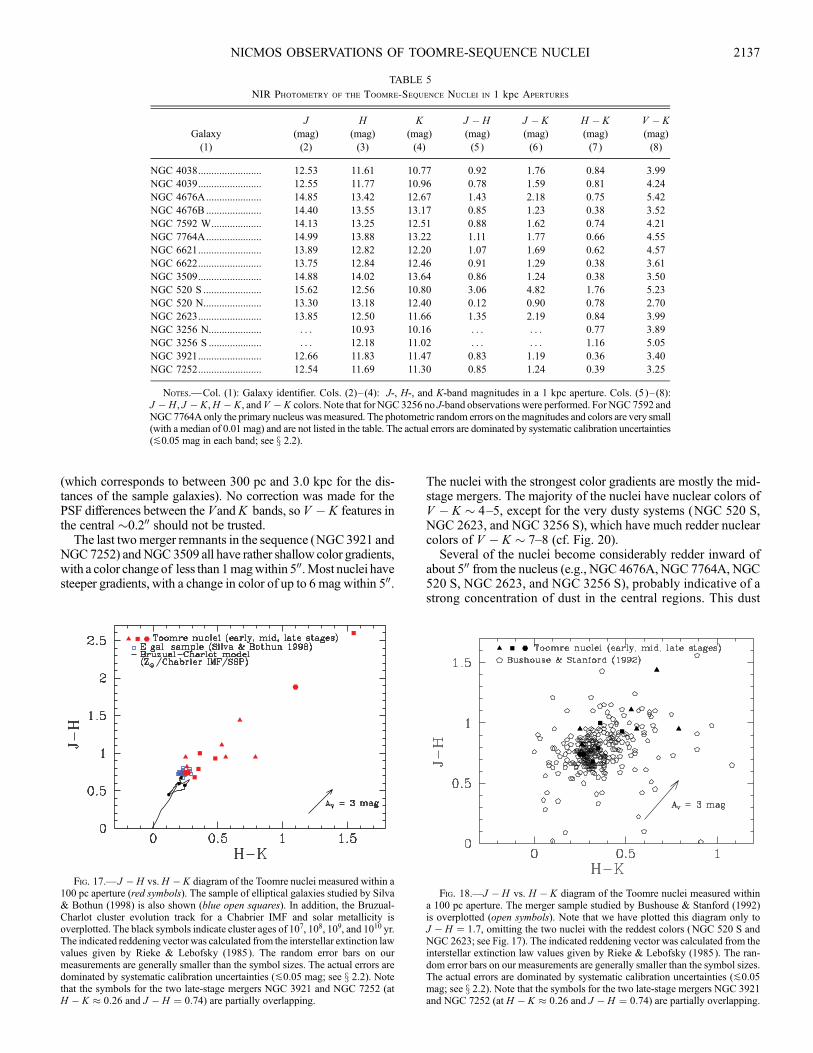
Figure 17 shows the J � H versusH � K color-color diagramfor the 100 pc aperture measurements of the Toomre-sequencenuclei. Separate symbols are used for the early-stage, midstage,and late-stage mergers, as indicated in Table 1. For a direct com-parison of the late-stage mergers with elliptical galaxies, we alsoshow in the figure the sample of elliptical galaxies studied bySilva& Bothun (1998). We transformed their data, which were cali-brated to the CIT photometric system, to the Bessell system inwhich our NICMOS data were calibrated (Bessell & Brett 1988).We also used the respective J � H and H � K values from theGALAXEV database to generate and overplot the evolutionarytrack of an aging simple population (Bruzual & Charlot 2003).We used the Bruzual-Charlot models with the Padua 1994 stellarevolution library for a standard Chabrier initial mass function(IMF) from 0.1 to 100M� (Chabrier 2003) and solar metallicity.Two of the three late-stage merger remnants (those which hadJ,H, and Kmeasurements) fall close to the positions of the ellip-tical galaxies studied by Silva & Bothun (1998). All Toomre-sequence nuclei are closely aligned along the reddening vectordirection, as expected for dusty stellar populations.
Figure 18 shows the same color-color data for the Toomrenuclei as Figure 17 but focuses on a smaller region of the color-color diagram. We compare our data to ground-based measure-ments from Bushouse & Stanford (1992; also transformed to the
Bessell system) for a larger sample of interacting galaxies selectedfrom the Arp atlas (Arp 1966). The average and median colorsare slightly redder for the Toomre-sequence nuclei than for theBushouse & Stanford (1992) galaxies, but this result is only mar-ginally significant given the large scatter in both distributions.Moreover, a direct comparison between the samples is not straight-forward. Bushouse & Stanford (1992) performed photometry ina fixed angular aperture of 5.400, which is generally much largerthan the apertures of a fixed physical size that we have consideredfor the NICMOS data. Also, Toomre’s criteria for characterizing agalaxy as interacting ormergingweremore stringent than those ofBushouse & Stanford (1992). In any case, Figure 18 shows thatthe majority of the Toomre-sequence nuclei fall in the region ofthe J � H versusH � K diagram that is populated by the sampleof Bushouse & Stanford (1992). The Toomre-sequence nucleitherefore have colors that are comparable to those seen in otherinteracting and merging galaxies.
In principle it should be possible to constrain the stellar pop-ulations in the nuclei of the Toomre-sequence galaxies using themultiband V, I, J, H, and K photometry presented here and inPaper I. Such analyses have already been performed for othermerging galaxies (e.g., Pasquali et al. 2004). However, in the pres-ence of significant dust, as is the case here, the results are quiteuncertain. We therefore postpone a discussion of the stellar popu-lations to a subsequent paper (Paper III), in which wewill presentHST STIS spectra obtained in the context of our investigation.These spectra can be used to investigate the populations of thenuclei with moderate obscuration. By contrast, NIR spectroscopy
Fig. 11.—Same as Fig. 1, but for NGC 520 S (FOV: 2:8 kpc ; 2:8 kpc).
Fig. 12.—Same as Fig. 1, but for NGC 520 N (FOV: 2:8 kpc ; 2:8 kpc).
NICMOS OBSERVATIONS OF TOOMRE-SEQUENCE NUCLEI 2133No. 6, 2007

would be required to study the populations of the most heavilyobscured nuclei.
4.3. Dependence on Merger Stage
In Figures 19 and 20 we examine color trends along the pro-posed merger sequence. The NIR J � K colors in apertures of100 pc and 1 kpc are shown as a function of merger stage in Fig-ure 19. The J � K colors vary between 1.0 and 2.1 for all but thetwo most heavily obscured nuclei (NGC 2623 and NGC 520 S),which have much redder values within the 100 pc and 1 kpc aper-tures (see Tables 4 and 5, respectively). We have also plottedV � K colors ( listed in Tables 4 and 5) as a function of mergerstage (see Fig. 20), therefore extending the spectral baseline tooptical wavelengths. By and large, these yield results consistentwith those seen for J � K. At the latest stages, the NIR colors tendto be less red and closer to those of normal E/S0 galaxies. Out of15 nuclei, the three bluest nuclei in a 100 pc aperture are all foundin the five latest galaxies of the sequence. While this is suggestiveof a trend for the nuclei to become bluer with increasing mergerstage, it is clear that there is large scatter in color along the se-quence, and that any trend is weak at best and not monotonic.
Unfortunately, the NIR colors measured here do not providemuch insight into variations in age along the Toomre sequence,or variations in age between the Toomre-sequence galaxies andelliptical galaxies. The J � K color of a stellar population does notvary much as a function of age. For example, a solar-metallicitypopulation with a Chabrier (2003) IMF has J � K ¼ 0:80, 0.57,0.82, and 0.89, at ages of 107, 108, 109, and 1010 yr, respectively
(using the Padua 1994 stellar library and an IMF that extends from0.1 to 100M�; Bruzual & Charlot 2003). Moreover, realistic stel-lar populations for the galaxies in the present sample cannot pro-duce J � K colors that are much redder than�1.0. Therefore, theredder J � K colors seen in Figure 19 must be due to dust extinc-tion. As a corollary, the trend that the early-stage mergers are red-der than the late-stagemergersmerely indicates that the former aredustier than the latter.Models ofmerging galaxieswith black holes often invoke feed-
back from anAGN to disperse obscuring dust and shut off star for-mation (e.g., Hopkins et al. 2005). Combined with the hierarchicalformation of structure over a Hubble time, such models can suc-cessfully explain a variety of observed properties related to gal-axy formation and quasar evolution (e.g., Hopkins et al. 2006).The existence of AGN-driven feedback is supported by observa-tions of individual galaxies such as NGC 6240, which has twoAGNs and a strong superwind (Komossa et al. 2003; Gerssen et al.2004). Our finding that the dust content of the Toomre-sequencenuclei has a decreasing trend with merger stage is qualitativelyconsistent with the predictions of feedback models. While theToomre sequence does not currently host many strong AGNs(see Table 1), this is not difficult to reconcile with the feedbackmodels if bright AGN stages are either very short-lived or highlyobscured (Hopkins et al. 2005). It will be valuable to use numer-ical models to make quantitative predictions for the dust and gascontent of interacting and merging galaxies as a function ofmerger (st)age, and compare these to results such as those ob-tained here.
Fig. 13.—Same as Fig. 1, but for NGC 2623 (FOV: 6:8 kpc ; 6:8 kpc).
Fig. 14.—Same as Fig. 1, but for NGC 3256 (FOV: 3:4 kpc ; 3:4 kpc).
ROSSA ET AL.2134 Vol. 134

As in our previous WFPC2 study, we also calculate the totalluminosity within the 100 pc and 1 kpc apertures for the samplegalaxies, in this case for the K band. The K-band luminosity (LK )is shown in Figure 21 as a function of merger stage,where the lumi-nosities have been corrected for dust extinction. To perform thiscorrection, we first assume that the stellar population has an intrin-sic J � K � 0:85. The K-band extinction for each nucleus canthen be estimated from Tables 4 and 5 using the equation AK ¼0:659(J � K � 0:85), based on the extinction law of Rieke &Lebofsky (1985).12 Our results are not significantly affected forother realistic choices for the intrinsic J � K color. Figure 21shows that LK (within an aperture of fixed physical size) tends toincrease with advancing merger stage. To statistically test thistrend, we calculate the Spearman rank-order correlation coeffi-cient (rs) for each of the 100 pc and 1 kpc data sets. In both caseswe find that rs ¼ 0:61, indicating a 2 � correlation (99% confi-dence level [CL]). We note that the Antennae drive much of thiscorrelation; removing the Antennae nuclei from the analysis low-ers the correlation coefficient to rs ¼ 0:5, indicating a 1.5 � corre-lation (93% CL). We caution, however, that this analysis assumesthat there are no systematic errors which depend on the mergerstage. While not shown here, we have done the same analysis forthe fractional nuclear luminosity (i.e., LK;nuc /LK; tot) as a functionof merger stage and find a similar trend. Because we have cor-rected for extinction, the underlying cause of this trend must be
either an increasing stellar density with advancing merger stage,or a younger average stellar age with advancing merger stage (orboth). We cannot discriminate between these two possibilities onthe basis of the NIR imaging data alone. Available far-infrareddata also cannot address this issue, since the global star formationrates measured by IRAS (e.g., Joseph &Wright 1985; Casoli et al.1991) are not necessarily a good indicator of the star formationrates in the nuclei (Kennicutt et al. 1987). As a caveat we wouldlike to note that the observed trend of increasing LK as a functionof advancingmerger stage is based on the initially assumedmergerstage (Toomre 1977), which may not necessarily reflect the ac-tual merger (st)age for all 11merger systems. Nonetheless, we usethe predefinedmerger stage (which is a fixed value) rather than themerger age. While the very early and very late stages are well de-fined, an actual ranking (i.e., an exact placement within this se-quence) may be possible only after deriving the dynamical historyof the merger through detailed simulations.
4.4. Radial Color Gradients
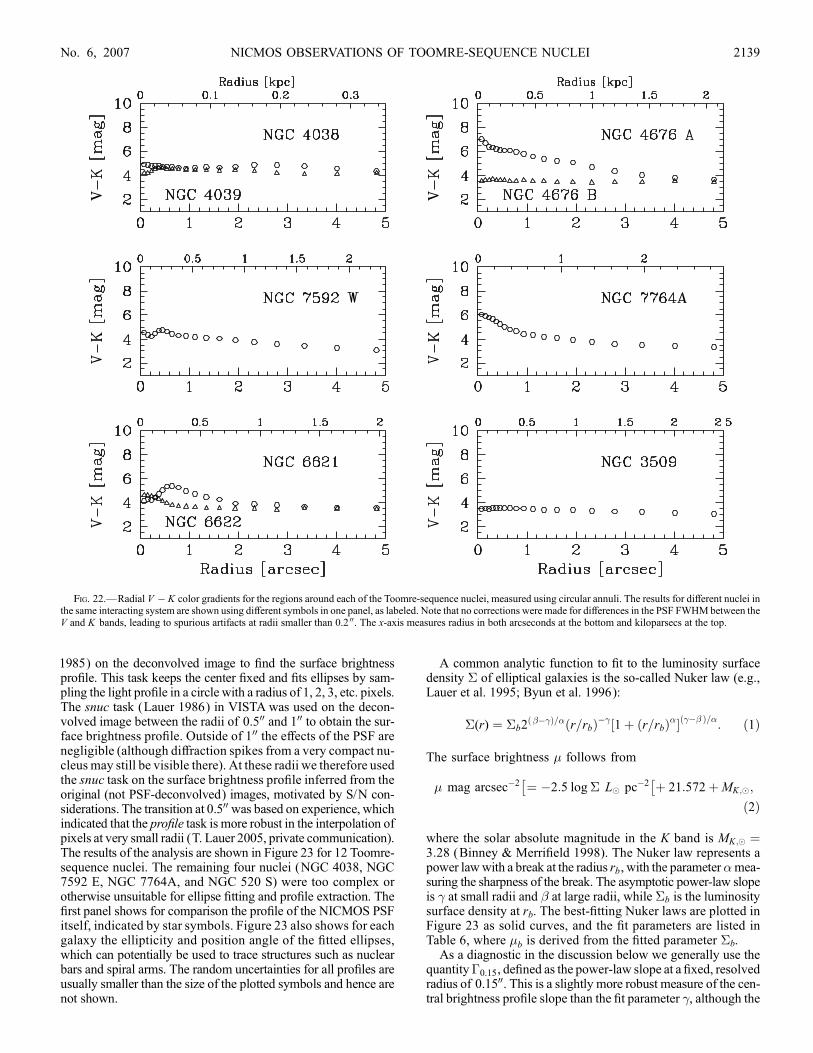
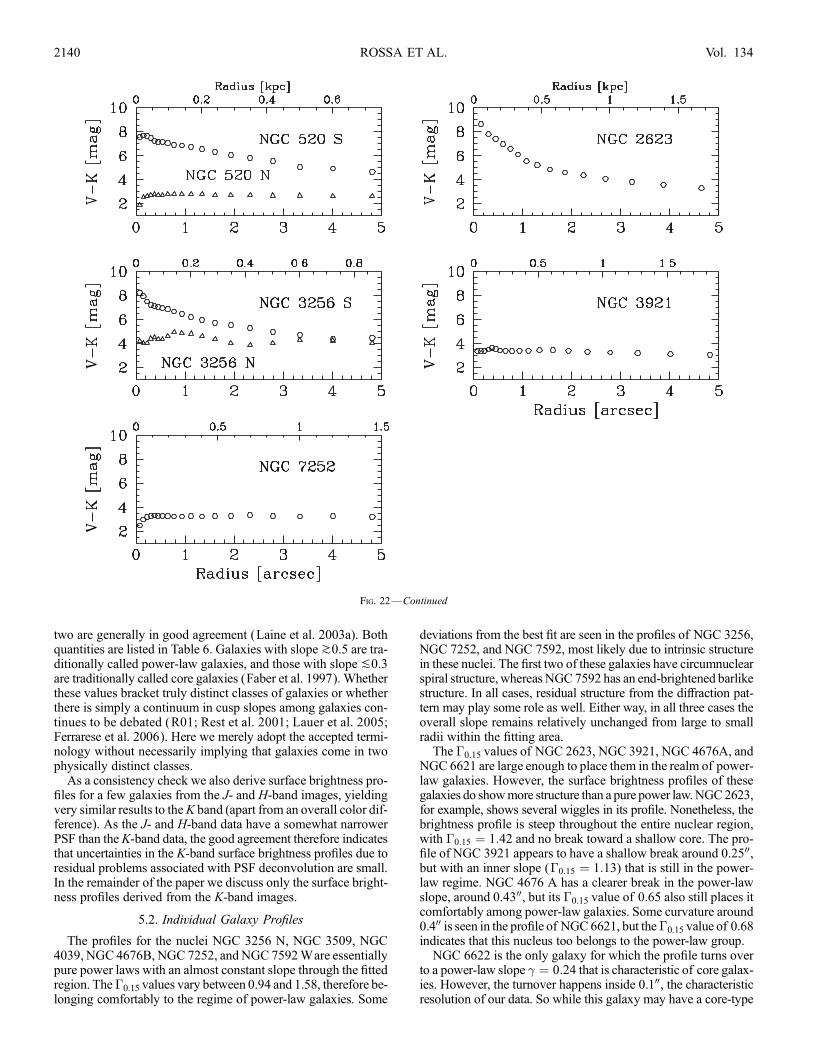
The two-dimensional spatial variations of the V � K color inthe central regions of Toomre-sequence galaxies are quite com-plex, as evident from the gray-scale representations in Figures 1Y16. To obtain more easily interpretable quantitative insight, wehave therefore determined the radial V � K color gradients forall of the nuclei, measured in concentric circular annuli centeredaround each nucleus and shown in Figure 22. The annuli arecontiguous and grow in radius by a factor of 1.1 at each step. Thecolor profiles are followedout to a distance of 500 fromeachnucleus
Fig. 15.—Same as Fig. 1, but for NGC 3921 (FOV: 7:2 kpc ; 7:2 kpc).
Fig. 16.—Same as Fig. 1, but for NGC 7252 (FOV: 5:8 kpc ; 5:8 kpc).
12 For NGC 3256we used a similar formalism for calculatingAK based on theH � K color, because no J-band data are available for this galaxy.
NICMOS OBSERVATIONS OF TOOMRE-SEQUENCE NUCLEI 2135No. 6, 2007

TABLE 3
Positional Offsets of the Nuclei Compared to Other Wave Bands
NIR � X-Ray NIR � Radio Continuum NIR � CO
Galaxy
(1)
�R.A.
(arcsec)
(2)
�Decl.
(arcsec)
(3)
�(�, �)
(arcsec)
(4)
�R.A.
(arcsec)
(5)
�Decl.
(arcsec)
(6)
�(�, � )
(arcsec)
(7)
�R.A.
(arcsec)
(8)
�Decl.
(arcsec)
(9)
�(�, � )
(arcsec)
(10)
NGC 4038......................... +1.05a +0.42a 1.8 +0.60b +1.30b 1.6 . . . . . . . . .NGC 4039......................... +0.11a �0.30a 1.8 +1.35b +0.30b 1.6 . . . . . . . . .
NGC 4676A...................... 0.00c �1.20c 1.8 +0.24d �0.67d 1.6 +0.75e �1.36e 1.7
NGC 4676B ...................... �0.30c +0.20c 1.8 �1.50d �0.86d 1.6 �0.45e �1.78e 1.7
NGC 7592 W.................... . . . . . . . . . +0.90f +0.73f 1.6 �0.75g +1.20g 1.6
NGC 7592 E ..................... . . . . . . . . . . . . . . . . . . . . . . . . . . .
NGC 7764A E .................. . . . . . . . . . . . . . . . . . . . . . . . . . . .
NGC 7764A W................. . . . . . . . . . . . . . . . . . . . . . . . . . . .NGC 6621......................... . . . . . . . . . +0.60h +0.80h �2.4 �2.25g �0.70g 1.6
NGC 6622......................... . . . . . . . . . . . . . . . . . . . . . . . . . . .
NGC 3509......................... . . . . . . . . . +0.15i +0.80 i �1.9 . . . . . . . . .
NGC 520 S ....................... +4.95 j +0.70 j �35.0 +0.15k �0.77k 1.6 +1.05e �0.70e �1.7
NGC 520 N....................... . . . . . . . . . . . . . . . . . . . . . . . . . . .
NGC 2623......................... +0.15l +2.77l 1.8 +0.83d �0.59d 1.6 +1.05m �0.37m �1.7
NGC 3256 N..................... �1.20n +1.40n 1.8 �0.90o +1.60o 1.6 . . . . . . . . .
NGC 3256 S ..................... �0.90n +1.40n 1.8 �0.90o +1.60o 1.6 . . . . . . . . .NGC 3921......................... �0.30p +1.31p 2.6 +1.11d +0.09d 1.6 +0.45e +1.57e �1.7
NGC 7252......................... +0.15p +1.60p 2.6 +1.20q �2.10q �2.4 +0.75r �0.44r �1.9
Notes.—Col. (1): Galaxy name. Cols. (2) and (3): Positional offsets between theHST and X-ray-detected nucleus. Col. (4): Uncertainty associated with this positionaloffset. Cols. (5) and (6): Positional offsets between theHST and radio continuum measurements. Col. (7): Uncertainty associated with this positional offset. Cols. (8) and(9): Positional offsets between the HST and CO measurements. Col. (10): Uncertainty associated with this positional offset. The HST positions adopted for the nuclei arethe NICMOS positions listed in Table 1, except for NGC 3921, for which we used theWFPC2 position from Paper I (due to evidence for an�400 absolute astrometric errorin the corresponding NICMOS data set). The sources for the X-raymeasurements are Einstein,Chandra, andXMM-Newton, for the radio continuummeasurements the VLA,and for theCOmeasurements various telescopes. The listed uncertainties associated with the positional offsets are the quadrature sums of theHST astrometric accuracy and theastrometric accuracies of the observations in the other wave bands. Astrometric accuracies were obtained from the following sources: HST (Ptak et al. 2006), Chandra(Aldcroft 2002; Schade et al. 2002),XMM-Newton andEinstein (S. Snowden 2006, private communication), and the radio continuum andCO (the original literature sources ofthe data). See the text for a discussion of the X-ray and radio nucleus positions adopted for NGC 4038.
References.—(a) Zezas et al. 2002b; (b)Neff&Ulvestad 2000; (c)Read2003; (d)McMahon et al. 2002; (e)Yun&Hibbard 2001; (f ) Condon et al. 1990; (g)D. Iono2006,private communication; (h) Condon et al. 1996; (i) J. E. Hibbard 2006, unpublished; ( j) Fabbiano et al. 1992; (k) Carral et al. 1990; ( l) our measurement from archival data;(m) Bryant & Scoville 1999; (n) Lira et al. 2002; (o) Neff et al. 2003; (p) Nolan et al. 2004; (q) Hibbard et al. 1994; (r) Wang et al. 1992.
TABLE 4
NIR Photometry of the Toomre Sequence Nuclei in 100 pc Apertures
Galaxy
(1)
J
(mag)
(2)
H
(mag)
(3)
K
(mag)
(4)
J � H
(mag)
(5)
J � K
(mag)
(6)
H � K
(mag)
(7)
V � K
(mag)
(8)
NGC 4038........................ 16.26 15.31 14.75 0.95 1.51 0.56 4.67
NGC 4039........................ 14.62 13.67 13.42 0.95 1.20 0.25 4.50
NGC 4676A..................... 18.36 16.92 16.25 1.44 2.11 0.67 6.79
NGC 4676B ..................... 17.60 16.78 16.52 0.82 1.08 0.26 3.56
NGC 7592 W................... 16.60 15.65 14.86 0.95 1.74 0.79 4.46
NGC 7764A..................... 18.25 17.14 16.61 1.11 1.64 0.53 6.05
NGC 6621........................ 17.27 16.34 15.86 0.93 1.41 0.48 4.27
NGC 6622........................ 16.77 15.77 15.41 1.00 1.36 0.36 4.59
NGC 3509........................ 17.90 17.11 16.76 0.79 1.14 0.35 3.53
NGC 520 S ...................... 18.18 15.58 14.03 2.60 4.15 1.55 7.32
NGC 520 N...................... 16.99 16.31 15.99 0.68 1.00 0.32 2.80
NGC 2623........................ 16.56 14.68 13.58 1.88 2.98 1.10 8.15
NGC 3256 N.................... . . . 13.08 12.53 . . . . . . 0.55 4.35
NGC 3256 S .................... . . . 16.27 14.65 . . . . . . 1.62 7.22
NGC 3921........................ 14.71 13.97 13.70 0.74 1.01 0.27 3.39
NGC 7252........................ 14.95 14.21 13.96 0.74 0.99 0.25 3.13
Notes.—Col. (1): Galaxy identifier. Cols. (2)Y (4): J-, H-, and K-band magnitudes in a 100 pc aperture. Cols. (5)Y (8):J � H , J � K,H � K, andV � K colors. Note that for NGC3256 no J-band observationswere performed. ForNGC7592 andNGC 7764A only the primary nucleus was measured. The photometric random errors on the magnitudes and colors are verysmall for the NIR bands (with a median of 0.01 mag) and are not listed in the table. The actual errors are dominated bysystematic calibration uncertainties (P0.05 mag in each band; see x 2.2).
(which corresponds to between 300 pc and 3.0 kpc for the dis-tances of the sample galaxies). No correction was made for thePSF differences between the Vand K bands, so V � K features inthe central �0.200 should not be trusted.
The last twomerger remnants in the sequence (NGC 3921 andNGC7252) andNGC 3509 all have rather shallow color gradients,with a color change of less than 1magwithin 500.Most nuclei havesteeper gradients, with a change in color of up to 6 mag within 500.
The nuclei with the strongest color gradients are mostly the mid-stage mergers. The majority of the nuclei have nuclear colors ofV � K � 4Y5, except for the very dusty systems (NGC 520 S,NGC 2623, and NGC 3256 S), which have much redder nuclearcolors of V � K � 7Y8 (cf. Fig. 20).
Several of the nuclei become considerably redder inward ofabout 500 from the nucleus (e.g., NGC 4676A, NGC 7764A, NGC520 S, NGC 2623, and NGC 3256 S), probably indicative of astrong concentration of dust in the central regions. This dust
TABLE 5
NIR Photometry of the Toomre-Sequence Nuclei in 1 kpc Apertures
Galaxy
(1)
J
(mag)
(2)
H
(mag)
(3)
K
(mag)
(4)
J � H
(mag)
(5)
J � K
(mag)
(6)
H � K
(mag)
(7)
V � K
(mag)
(8)
NGC 4038........................ 12.53 11.61 10.77 0.92 1.76 0.84 3.99
NGC 4039........................ 12.55 11.77 10.96 0.78 1.59 0.81 4.24
NGC 4676A..................... 14.85 13.42 12.67 1.43 2.18 0.75 5.42
NGC 4676B ..................... 14.40 13.55 13.17 0.85 1.23 0.38 3.52
NGC 7592 W................... 14.13 13.25 12.51 0.88 1.62 0.74 4.21
NGC 7764A..................... 14.99 13.88 13.22 1.11 1.77 0.66 4.55
NGC 6621........................ 13.89 12.82 12.20 1.07 1.69 0.62 4.57
NGC 6622........................ 13.75 12.84 12.46 0.91 1.29 0.38 3.61
NGC 3509........................ 14.88 14.02 13.64 0.86 1.24 0.38 3.50
NGC 520 S ...................... 15.62 12.56 10.80 3.06 4.82 1.76 5.23
NGC 520 N...................... 13.30 13.18 12.40 0.12 0.90 0.78 2.70
NGC 2623........................ 13.85 12.50 11.66 1.35 2.19 0.84 3.99
NGC 3256 N.................... . . . 10.93 10.16 . . . . . . 0.77 3.89
NGC 3256 S .................... . . . 12.18 11.02 . . . . . . 1.16 5.05
NGC 3921........................ 12.66 11.83 11.47 0.83 1.19 0.36 3.40
NGC 7252........................ 12.54 11.69 11.30 0.85 1.24 0.39 3.25
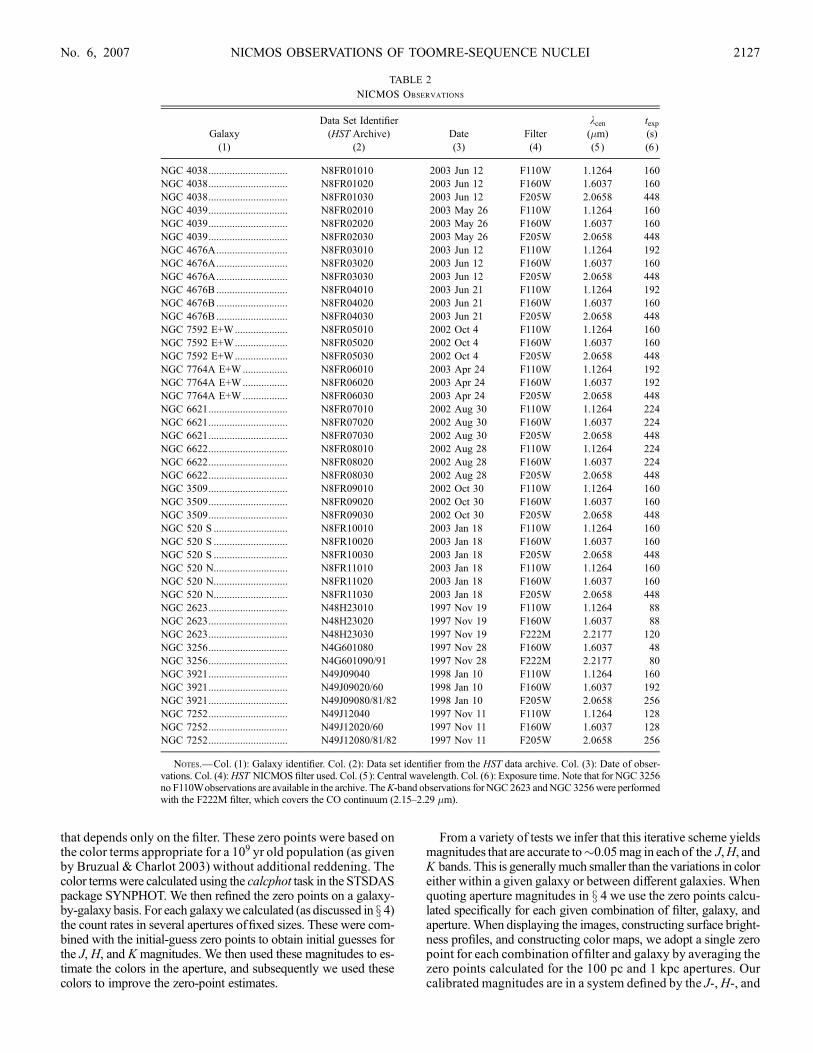
Notes.—Col. (1): Galaxy identifier. Cols. (2)Y (4): J-, H-, and K-band magnitudes in a 1 kpc aperture. Cols. (5)Y (8):J � H , J � K,H � K, andV � K colors. Note that for NGC 3256 no J-band observations were performed. For NGC 7592 andNGC7764A only the primary nucleus wasmeasured. The photometric random errors on the magnitudes and colors are very small(with a median of 0.01 mag) and are not listed in the table. The actual errors are dominated by systematic calibration uncertainties(P0.05 mag in each band; see x 2.2).
Fig. 17.—J � H vs. H � K diagram of the Toomre nuclei measured within a100 pc aperture (red symbols). The sample of elliptical galaxies studied by Silva& Bothun (1998) is also shown (blue open squares). In addition, the Bruzual-Charlot cluster evolution track for a Chabrier IMF and solar metallicity isoverplotted. The black symbols indicate cluster ages of 107, 108, 109, and 1010 yr.The indicated reddening vector was calculated from the interstellar extinction lawvalues given by Rieke & Lebofsky (1985). The random error bars on ourmeasurements are generally smaller than the symbol sizes. The actual errors aredominated by systematic calibration uncertainties (P0.05 mag; see x 2.2). Notethat the symbols for the two late-stage mergers NGC 3921 and NGC 7252 (atH � K � 0:26 and J � H ¼ 0:74) are partially overlapping.
Fig. 18.—J � H vs. H � K diagram of the Toomre nuclei measured withina 100 pc aperture. The merger sample studied by Bushouse & Stanford (1992)is overplotted (open symbols). Note that we have plotted this diagram only toJ � H ¼ 1:7, omitting the two nuclei with the reddest colors (NGC 520 S andNGC 2623; see Fig. 17). The indicated reddening vector was calculated from theinterstellar extinction law values given by Rieke & Lebofsky (1985). The ran-dom error bars on our measurements are generally smaller than the symbol sizes.The actual errors are dominated by systematic calibration uncertainties (P0.05mag; see x 2.2). Note that the symbols for the two late-stage mergers NGC 3921and NGC 7252 (at H � K � 0:26 and J � H ¼ 0:74) are partially overlapping.
NICMOS OBSERVATIONS OF TOOMRE-SEQUENCE NUCLEI 2137

complicates the identification of potential population gradientsfrom the observed color gradients. NGC 6621 becomes bluer inits central �0.600, but the morphology of the V � K image (seeFig. 8) suggests that this may be due to an absence of dust ratherthan the presence of young stars. A few nuclei are bluer in theircentral �0.200 (e.g., NGC 520 N and NGC 7252), but this maybe due to PSF differences between V and K rather than differ-ences in stellar populations. On the whole, Figure 22 certainlyshows no evidence for the bluer nuclear colors that might beexpected if the galaxies all had recent nuclear star formation.On the other hand, this scenario is certainly not ruled out by thedata, given that large quantities of dust affect most of the colorgradients.
5. SURFACE BRIGHTNESS PROFILES
5.1. Analysis
Surface brightness profiles for the Toomre nuclei were derivedprimarily from the K-band imaging, as they are least affected bydust and star formation. The images were run through 20 itera-tions of Lucy-Richardson deconvolution (Richardson 1972; Lucy1974) using theVISTA software package (Lauer 1986), where theuse of a higher number of iterations did not result in a significantlydifferent deconvolved image. We used TinyTim (Krist & Hook2001) to generate a PSF for each nucleus, modeled at the specificposition of each nucleus on the detector array and using a K-typestar for the PSF spectral distribution. For NGC 2623we used driz-zled images (Scoville et al. 2000) with half the pixel size of theoriginal data. In each case, the PSF was generated out to a radiusof 300, which incorporates the low-level emission in the extendedwings, and was tapered at the edges with a Gaussian taper. A fewof the galaxies have nuclei that are compact enough to produce astrong Airy ring and diffraction spike pattern.We found that theseartifacts were in general successfully mitigated by our deconvolu-tion procedure, although some residuals do remain (especially forthe most compact sources, such as NGC 2623).The nuclear positions were determined by finding the centroid
in a small square, typically with a size of about 7 ; 7 pixels. Wethen fitted ellipses to the isophotes of the two-dimensional con-volved and deconvolved images. The surface brightness profilewas derived only for the nuclear region (usually out to a radius ofa few arcseconds). We did not attempt to mask out dust or stellarclusters within the area where the surface brightness profile wasderived, since the effects of dust are subtle in most cases and therewere usually no strong point sources within the few-arcsecond ra-dius that could have interfered with the profile. In cases wheresuch sources exist (e.g., NGC 6621), the profile was only extractedwithin the innermost nuclear area. The effects of subtle dust fea-tures and circumnuclear spiral arms are still visible as small-scalewiggles in some of the luminosity profiles (e.g., NGC 3256 andNGC 7252).Following closely the procedure used by Laine et al. (2003a)
for radii smaller than 0.500, we used the VISTA profile task (Lauer
Fig. 19.—J � K color measured within 100 pc ( filled symbols) and 1 kpc(open symbols) apertures as a function of the Toomre-sequencemerger stage. Therandom uncertainties in the colors are generally smaller than the symbol sizes.The true uncertainties in the colors are dominated by systematic uncertaintiesin the absolute photometric calibration (see x 2.2). The dotted horizontal line indi-cates the J � K color for a 1010 yr population of solarmetallicity (Bruzual&Charlot2003), which provides a reasonable fit to the actual colors measured for E/S0 gal-axies. Note that for NGC 3256 there are no J-band measurements available.
Fig. 20.—V � K color measured within 100 pc ( filled symbols) and 1 kpc(open symbols) apertures as a function of the Toomre-sequence merger stage.The random uncertainties in the colors are generally smaller than the symbolsizes. The true uncertainties in the colors are often dominated by systematic un-certainties in the absolute photometric calibration (see x 2.2). The dotted hori-zontal line indicates the V � K color for a 1010 yr population of solar metallicity(Bruzual &Charlot 2003), which provides a reasonable fit to the actual colorsmea-sured for E/S0 galaxies.
Fig. 21.—K-band luminosity (corrected for dust extinction) within a 100 pc( filled symbols) and 1 kpc (open symbols) aperture as a function of merger stage.The luminosities were corrected for dust extinction based on the observed J � Kcolor, as described in the text. The random uncertainties in the luminosities are gen-erally smaller than the symbol sizes. The true uncertainties are dominated by un-certainties in the galaxy distances. The solid lines are linear least-squares fitsintended to guide the eye. There is a trend of increasing nuclear K-band lumi-nosity as a function of merger stage.
ROSSA ET AL.2138 Vol. 134
1985) on the deconvolved image to find the surface brightnessprofile. This task keeps the center fixed and fits ellipses by sam-pling the light profile in a circle with a radius of 1, 2, 3, etc. pixels.The snuc task (Lauer 1986) in VISTA was used on the decon-volved image between the radii of 0.500 and 100 to obtain the sur-face brightness profile. Outside of 100 the effects of the PSF arenegligible (although diffraction spikes from a very compact nu-cleus may still be visible there). At these radii we therefore usedthe snuc task on the surface brightness profile inferred from theoriginal (not PSF-deconvolved) images, motivated by S/N con-siderations. The transition at 0.500 was based on experience, whichindicated that the profile task is more robust in the interpolation ofpixels at very small radii (T. Lauer 2005, private communication).The results of the analysis are shown in Figure 23 for 12 Toomre-sequence nuclei. The remaining four nuclei (NGC 4038, NGC7592 E, NGC 7764A, and NGC 520 S) were too complex orotherwise unsuitable for ellipse fitting and profile extraction. Thefirst panel shows for comparison the profile of the NICMOS PSFitself, indicated by star symbols. Figure 23 also shows for eachgalaxy the ellipticity and position angle of the fitted ellipses,which can potentially be used to trace structures such as nuclearbars and spiral arms. The random uncertainties for all profiles areusually smaller than the size of the plotted symbols and hence arenot shown.
A common analytic function to fit to the luminosity surfacedensity � of elliptical galaxies is the so-called Nuker law (e.g.,Lauer et al. 1995; Byun et al. 1996):
�(r) ¼ �b2���ð Þ=� r=rbð Þ��
1þ r=rbð Þ�½ � ���ð Þ=�: ð1Þ
The surface brightness � follows from
� mag arcsec�2� �
¼ �2:5 log� L� pc�2� �
þ 21:572þMK;�;
ð2Þ
where the solar absolute magnitude in the K band is MK;� ¼3:28 (Binney & Merrifield 1998). The Nuker law represents apower lawwith a break at the radius rb, with the parameter�mea-suring the sharpness of the break. The asymptotic power-law slopeis � at small radii and � at large radii, while �b is the luminositysurface density at rb. The best-fitting Nuker laws are plotted inFigure 23 as solid curves, and the fit parameters are listed inTable 6, where �b is derived from the fitted parameter �b.
As a diagnostic in the discussion below we generally use thequantity�0.15, defined as the power-law slope at a fixed, resolvedradius of 0.1500. This is a slightly more robust measure of the cen-tral brightness profile slope than the fit parameter �, although the
Fig. 22.—Radial V � K color gradients for the regions around each of the Toomre-sequence nuclei, measured using circular annuli. The results for different nuclei inthe same interacting system are shown using different symbols in one panel, as labeled. Note that no corrections were made for differences in the PSF FWHMbetween theV and K bands, leading to spurious artifacts at radii smaller than 0.2 00. The x-axis measures radius in both arcseconds at the bottom and kiloparsecs at the top.
NICMOS OBSERVATIONS OF TOOMRE-SEQUENCE NUCLEI 2139No. 6, 2007
two are generally in good agreement (Laine et al. 2003a). Bothquantities are listed in Table 6. Galaxies with slopek0.5 are tra-ditionally called power-law galaxies, and those with slope P0.3are traditionally called core galaxies (Faber et al. 1997). Whetherthese values bracket truly distinct classes of galaxies or whetherthere is simply a continuum in cusp slopes among galaxies con-tinues to be debated (R01; Rest et al. 2001; Lauer et al. 2005;Ferrarese et al. 2006). Here we merely adopt the accepted termi-nology without necessarily implying that galaxies come in twophysically distinct classes.
As a consistency check we also derive surface brightness pro-files for a few galaxies from the J- and H-band images, yieldingvery similar results to theK band (apart from an overall color dif-ference). As the J- and H-band data have a somewhat narrowerPSF than the K-band data, the good agreement therefore indicatesthat uncertainties in the K-band surface brightness profiles due toresidual problems associated with PSF deconvolution are small.In the remainder of the paper we discuss only the surface bright-ness profiles derived from the K-band images.
5.2. Individual Galaxy Profiles
The profiles for the nuclei NGC 3256 N, NGC 3509, NGC4039, NGC 4676B, NGC 7252, and NGC 7592Ware essentiallypure power laws with an almost constant slope through the fittedregion. The�0.15 values vary between 0.94 and 1.58, therefore be-longing comfortably to the regime of power-law galaxies. Some
deviations from the best fit are seen in the profiles of NGC 3256,NGC 7252, and NGC 7592, most likely due to intrinsic structurein these nuclei. The first two of these galaxies have circumnuclearspiral structure, whereas NGC 7592 has an end-brightened barlikestructure. In all cases, residual structure from the diffraction pat-tern may play some role as well. Either way, in all three cases theoverall slope remains relatively unchanged from large to smallradii within the fitting area.The �0.15 values of NGC 2623, NGC 3921, NGC 4676A, and
NGC 6621 are large enough to place them in the realm of power-law galaxies. However, the surface brightness profiles of thesegalaxies do showmore structure than a pure power law.NGC2623,for example, shows several wiggles in its profile. Nonetheless, thebrightness profile is steep throughout the entire nuclear region,with �0:15 ¼ 1:42 and no break toward a shallow core. The pro-file of NGC 3921 appears to have a shallow break around 0.2500,but with an inner slope (�0:15 ¼ 1:13) that is still in the power-law regime. NGC 4676 A has a clearer break in the power-lawslope, around 0.4300, but its �0.15 value of 0.65 also still places itcomfortably among power-law galaxies. Some curvature around0.400 is seen in the profile of NGC6621, but the�0.15 value of 0.68indicates that this nucleus too belongs to the power-law group.NGC 6622 is the only galaxy for which the profile turns over
to a power-law slope � ¼ 0:24 that is characteristic of core galax-ies. However, the turnover happens inside 0.100, the characteristicresolution of our data. So while this galaxy may have a core-type
Fig. 22—Continued
ROSSA ET AL.2140 Vol. 134

profile, it is certainly not an unambiguous case. In the followingwe do not discuss the parameter rb of the Nuker profile fits. Thisparameter generally has physical meaning only for galaxies withwell-resolved cores, and none of the Toomre-sequence nuclei fallin this category.
The only nucleus that does not fit within the class of either thecore or the power-law galaxies is one nucleus in amidstagemerger,NGC 520 N. This nucleus has a very shallow profile out to severalarcseconds from the center, but with a strong upturn in the central�0.1500. The bright central source responsible for this upturn is
Fig. 23.—Major-axis surface brightness profiles of the nuclear regions of selected Toomre-sequence galaxies, where a fit was possible. The subpanels show the surfacebrightness profiles overplotted with a Nuker model fit (solid line). The host galaxies of the individual nuclei are labeled. For comparison, we plot the profile of the NICMOSPSF in the first panel (star symbols, arbitrarily normalized).
NICMOS OBSERVATIONS OF TOOMRE-SEQUENCE NUCLEI 2141No. 6, 2007

clearly visible in theK-band image (Fig. 12). This profile and nu-clear morphology are very similar to what is seen in the centers ofmany late-type spiral galaxies (e.g., Boker et al. 2002), where ithas been established that the upturn is due to the presence of a nu-clear star cluster (e.g., Boker et al. 2004; Rossa et al. 2006). Sincemore than half of the spiral galaxies have such nuclear star clus-
ters, it would not be surprising to find one among the Toomre-sequence galaxies as well.Because the galaxies at the earliest stage in the Toomre se-
quence have not yet experienced the full merger evolution, theirnuclei would be expected to still have brightness profiles similarto those of spiral galaxies. At HST resolution, the ‘‘classical’’ R1/4
Fig. 23—Continued
ROSSA ET AL.2142 Vol. 134
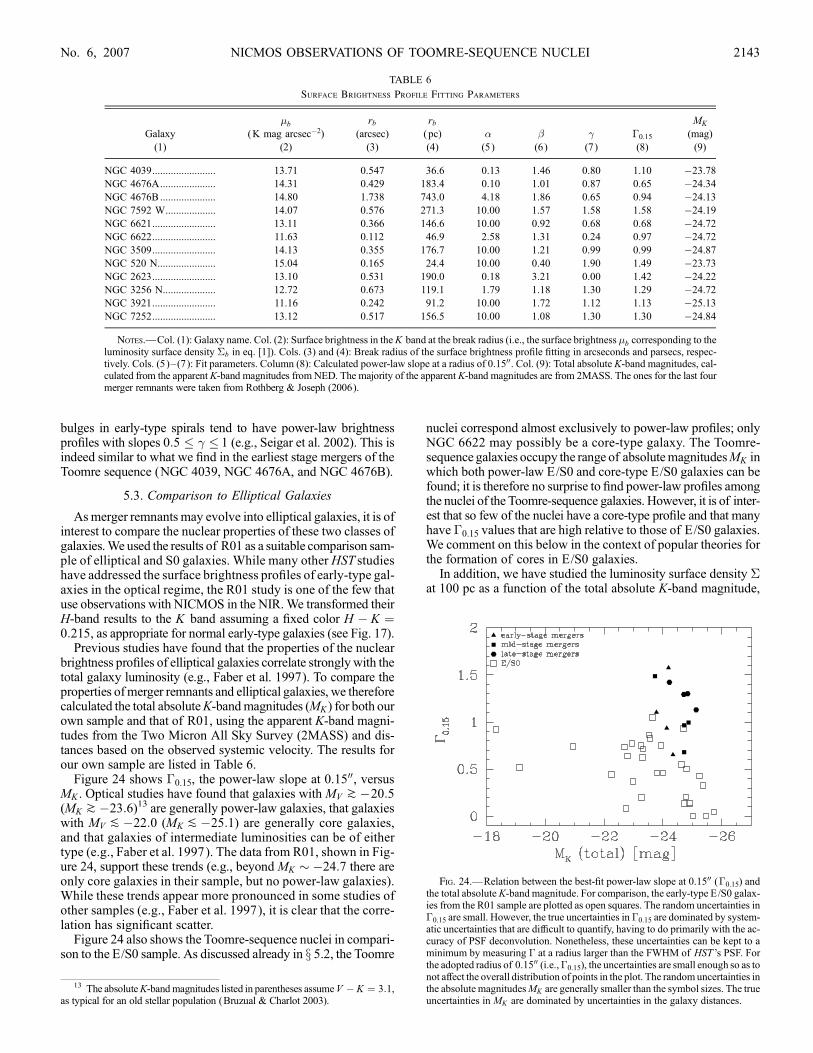
bulges in early-type spirals tend to have power-law brightnessprofiles with slopes 0:5 � � � 1 (e.g., Seigar et al. 2002). This isindeed similar to what we find in the earliest stage mergers of theToomre sequence (NGC 4039, NGC 4676A, and NGC 4676B).
5.3. Comparison to Elliptical Galaxies
Asmerger remnants may evolve into elliptical galaxies, it is ofinterest to compare the nuclear properties of these two classes ofgalaxies.We used the results of R01 as a suitable comparison sam-ple of elliptical and S0 galaxies. While many other HST studieshave addressed the surface brightness profiles of early-type gal-axies in the optical regime, the R01 study is one of the few thatuse observations with NICMOS in the NIR.We transformed theirH-band results to the K band assuming a fixed color H � K ¼0:215, as appropriate for normal early-type galaxies (see Fig. 17).
Previous studies have found that the properties of the nuclearbrightness profiles of elliptical galaxies correlate strongly with thetotal galaxy luminosity (e.g., Faber et al. 1997). To compare theproperties ofmerger remnants and elliptical galaxies, we thereforecalculated the total absoluteK-bandmagnitudes (MK ) for both ourown sample and that of R01, using the apparent K-band magni-tudes from the Two Micron All Sky Survey (2MASS) and dis-tances based on the observed systemic velocity. The results forour own sample are listed in Table 6.
Figure 24 shows �0.15, the power-law slope at 0.1500, versusMK . Optical studies have found that galaxies with MV k�20:5(MK k�23:6)13 are generally power-law galaxies, that galaxieswith MV P�22:0 (MK P�25:1) are generally core galaxies,and that galaxies of intermediate luminosities can be of eithertype (e.g., Faber et al. 1997). The data from R01, shown in Fig-ure 24, support these trends (e.g., beyond MK � �24:7 there areonly core galaxies in their sample, but no power-law galaxies).While these trends appear more pronounced in some studies ofother samples (e.g., Faber et al. 1997), it is clear that the corre-lation has significant scatter.
Figure 24 also shows the Toomre-sequence nuclei in compari-son to the E/S0 sample. As discussed already in x 5.2, the Toomre
nuclei correspond almost exclusively to power-law profiles; onlyNGC 6622 may possibly be a core-type galaxy. The Toomre-sequence galaxies occupy the range of absolutemagnitudesMK inwhich both power-law E/S0 and core-type E/S0 galaxies can befound; it is therefore no surprise to find power-law profiles amongthe nuclei of the Toomre-sequence galaxies. However, it is of inter-est that so few of the nuclei have a core-type profile and that manyhave �0.15 values that are high relative to those of E/S0 galaxies.We comment on this below in the context of popular theories forthe formation of cores in E/S0 galaxies.
In addition, we have studied the luminosity surface density �at 100 pc as a function of the total absolute K-band magnitude,
13 The absoluteK-bandmagnitudes listed in parentheses assumeV � K ¼ 3:1,as typical for an old stellar population (Bruzual & Charlot 2003).
TABLE 6
Surface Brightness Profile Fitting Parameters
Galaxy
(1)
�b
(K mag arcsec�2)
(2)
rb(arcsec)
(3)
rb( pc)
(4)
�
(5)
�
(6)
�
(7)
�0.15
(8)
MK
(mag)
(9)
NGC 4039........................ 13.71 0.547 36.6 0.13 1.46 0.80 1.10 �23.78
NGC 4676A..................... 14.31 0.429 183.4 0.10 1.01 0.87 0.65 �24.34
NGC 4676B ..................... 14.80 1.738 743.0 4.18 1.86 0.65 0.94 �24.13
NGC 7592 W................... 14.07 0.576 271.3 10.00 1.57 1.58 1.58 �24.19
NGC 6621........................ 13.11 0.366 146.6 10.00 0.92 0.68 0.68 �24.72
NGC 6622........................ 11.63 0.112 46.9 2.58 1.31 0.24 0.97 �24.72
NGC 3509........................ 14.13 0.355 176.7 10.00 1.21 0.99 0.99 �24.87
NGC 520 N...................... 15.04 0.165 24.4 10.00 0.40 1.90 1.49 �23.73
NGC 2623........................ 13.10 0.531 190.0 0.18 3.21 0.00 1.42 �24.22
NGC 3256 N.................... 12.72 0.673 119.1 1.79 1.18 1.30 1.29 �24.72
NGC 3921........................ 11.16 0.242 91.2 10.00 1.72 1.12 1.13 �25.13
NGC 7252........................ 13.12 0.517 156.5 10.00 1.08 1.30 1.30 �24.84
Notes.—Col. (1): Galaxy name. Col. (2): Surface brightness in theK band at the break radius (i.e., the surface brightness �b corresponding to theluminosity surface density �b in eq. [1]). Cols. (3) and (4): Break radius of the surface brightness profile fitting in arcseconds and parsecs, respec-tively. Cols. (5)Y (7): Fit parameters. Column (8): Calculated power-law slope at a radius of 0.1500. Col. (9): Total absolute K-band magnitudes, cal-culated from the apparent K-band magnitudes from NED. The majority of the apparent K-band magnitudes are from 2MASS. The ones for the last fourmerger remnants were taken from Rothberg & Joseph (2006).
Fig. 24.—Relation between the best-fit power-law slope at 0.1500 (�0.15) andthe total absolute K-band magnitude. For comparison, the early-type E/S0 galax-ies from the R01 sample are plotted as open squares. The random uncertainties in�0.15 are small. However, the true uncertainties in �0.15 are dominated by system-atic uncertainties that are difficult to quantify, having to do primarily with the ac-curacy of PSF deconvolution. Nonetheless, these uncertainties can be kept to aminimum by measuring � at a radius larger than the FWHM of HST ’s PSF. Forthe adopted radius of 0.1500 (i.e.,�0.15), the uncertainties are small enough so as tonot affect the overall distribution of points in the plot. The randomuncertainties inthe absolute magnitudesMK are generally smaller than the symbol sizes. The trueuncertainties in MK are dominated by uncertainties in the galaxy distances.
NICMOS OBSERVATIONS OF TOOMRE-SEQUENCE NUCLEI 2143No. 6, 2007

shown in Figure 25. The majority of the Toomre nuclei have ahigher luminosity surface density than the E/S0 galaxies, althoughthere are a few in the overlapping region. The most luminousToomre galaxies also tend to have the highest surface luminositydensity. Note that neither sample was corrected for dust extinctionin the K band (see x 4.3 for a discussion of the typical amount ofextinction for the Toomre nuclei). However, Figure 17 shows thatthe Toomre nuclei have more dust extinction than typical E/S0 gal-axies. Therefore, any correction for dust extinction would in factincrease the systematic difference in luminosity surface densitybetween the two samples.
Figure 24 shows that, on the whole, the Toomre-sequence nu-clei tend to have slopes that are significantly steeper than what isseen in E/S0 galaxies. The four latest-stage merger remnants allhave 1:1P �0:15 P 1:4. In principle this could be a resolution ef-fect, as the median distance of the Toomre galaxies is 77.8 Mpc,versus 17.0 Mpc for the galaxies in the sample of R01. Early-type galaxies in general tend to have steeper logarithmic surfacebrightness profiles at larger radii, so that at a fixed angular scale,one would naturally expect to find somewhat steeper slopes in amore distant sample. However, Figure 25 shows that this is un-likely to be the whole explanation in the present case. The Toomrenuclei tend to have a higher luminosity surface density than theE/S0 galaxies at fixed physical radius (i.e., at 100 pc), and thusmust be intrinsically brighter at small radii. It then seems plau-sible that they have intrinsically steeper surface brightness slopesas well. A similar result was recently reported in an HST WFPC2optical study by Yang et al. (2004), who found that E+A galaxies(shown to be evolved merger remnants) had power-law profilesand higher surface brightnesses than E/S0 galaxies. Yang et al.(2004) attributed the higher surface brightnesses to the recent starformation in E+A galaxies and argued that, once the A stellar pop-ulation faded, the E+A galaxies would have surface brightnessprofiles typical of E/S0 galaxies. Our results also connect natu-rally with the finding of Rothberg & Joseph (2004) that manymerger remnants have higher luminosity densities near their cen-ters than would be expected on the basis of inward extrapolationof the surface brightness profiles at large radii.
The steep K-band profiles and high luminosity surface densi-ties seen in the Toomre galaxies cannot be attributed to the pres-ence of bright nonthermal point sources. We measure the profileslope at 0.1500 and the luminosity surface density at 100 pc; thelatter corresponds to 0.2600 at the median distance of the samplegalaxies. Therefore, both of these quantities are defined outsideof the direct influence of a central nonthermal point source, if oneexists. This is true in particular because we measure these quanti-ties on the deconvolved profiles, not the observed profiles. More-over, there is little independent reason to suspect the presence ofnonthermal point sources. Most of the surface brightness profilesdo not showanupturn near 0.100. The only exception isNGC520N,but for this galaxy a nuclear star cluster is the likely cause. Whilesome of the galaxy images (e.g., NGC 2623 and NGC 3921) doshow the NICMOS PSF diffraction pattern around the galaxy cen-ter, this merely implies that the galaxy light must be very centrallyconcentrated (as indeed our analysis confirms), not that a centralpoint source need be present. Finally, nonthermal point sources atoptical wavelengths are generally associated with powerful AGNs,and radio galaxies in particular (Verdoes Kleijn et al. 2002). Bycontrast, most of the Toomre galaxies do not host strong AGNs(see Table 1).The results of our surface brightness profile analysis have a
natural explanation in the context of our understanding of themerger process. As two galaxies interact, gravitational torquesremove angular momentum from the gas and drive nuclear inflows(Noguchi 1988; Mihos & Hernquist 1996; Barnes & Hernquist1996). This transports gas to the centers of the interacting galax-ies, and subsequently to the center of the merger remnant, trig-gering nuclear starbursts. The newly formed stars increase thestellar density in the nucleus and steepen the surface mass den-sity profile (Mihos & Hernquist 1994). Since the young stellarpopulation will have a lower mass-to-light ratio than the olderstars in the galaxy, the steepening of the projected luminosity pro-file will be even stronger. All this is qualitatively consistent withthe results shown in Figures 24 and 25. The formation of new starsin a progressing merger may also be responsible for the observedtrend of increasing nuclear luminosity with advancing mergerstage shown in Figure 21. NGC3921 andNGC7252 are known tohave ‘‘poststarburst’’ A-star features in spectra of their nuclei,which provides direct evidence that stars recently formed in thesemergers (Schweizer 1982; Liu & Kennicutt 1995a, 1995b).To quantitatively compare the mass densities of ongoingmerg-
ers and elliptical galaxies on the basis of their luminosity densities,one needs to take into account potential differences in the ages oftheir stellar populations, as well as any radial gradients in the av-erage age within the galaxies. This is not possible in detail here, aswe have no estimates available of the stellar population ages in theToomre-sequence galaxies. However, a simple estimate can bemade on the basis of the fact that the dynamical merging age ofseveral of the late-stage Toomre-sequence galaxies has been esti-mated to be on the order of 1 Gyr (e.g., Hibbard & van Gorkom1996). A stellar population fades in the K band by�1.5 mag be-tween ages of 109 and 1010 yr (Bruzual & Charlot 2003), corre-sponding to 0.6 dex in luminosity. As the nuclei likely contain amix of young and old stellar populations, this represents an upperlimit to the amount of fading the nuclei may experience. Suchsignificant fading would be sufficient to explain much of the ex-cess luminosity density compared to E/S0 galaxies for most ofthe Toomre-sequence nuclei (see Fig. 25). Also, simulations showthat the young stars formed in mergers are likely to be more con-centrated toward the center than the underlying older stars. A fad-ing of the young population with time will therefore decreasenot only the amplitude but also the power-law slope of the total
Fig. 25.—Relation between the luminosity surface density� and the total ab-soluteK-band magnitude. The random uncertainties in� are small. However, thetrue uncertainties in � are dominated by systematic uncertainties that are difficultto quantify, having to do primarilywith the accuracy of PSF deconvolution.None-theless, these uncertainties can be kept to a minimum by measuring � at a radiuslarger than the FWHM of HST’s PSF. For the adopted radius of 100 pc, the un-certainties are small enough so as to not affect the overall distribution of pointsin the plot. The symbols are as in Figure 24, which also discusses the uncertaintiesin MK .
ROSSA ET AL.2144 Vol. 134
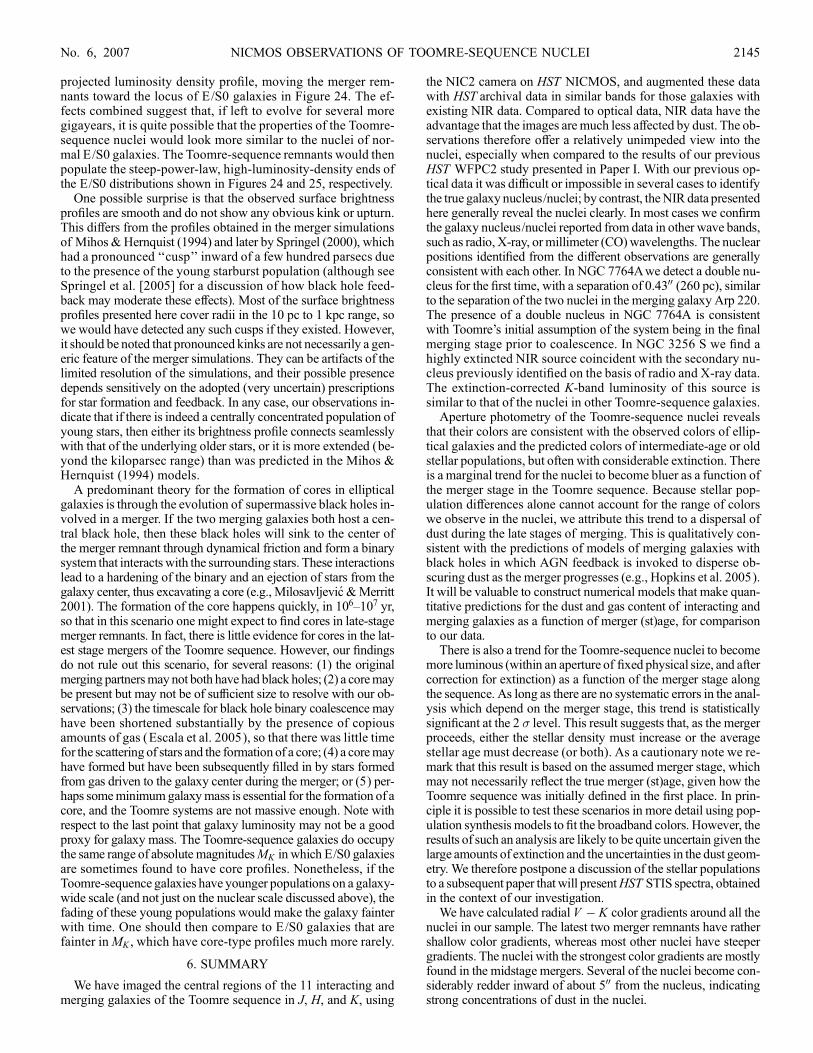
projected luminosity density profile, moving the merger rem-nants toward the locus of E/S0 galaxies in Figure 24. The ef-fects combined suggest that, if left to evolve for several moregigayears, it is quite possible that the properties of the Toomre-sequence nuclei would look more similar to the nuclei of nor-mal E/S0 galaxies. The Toomre-sequence remnants would thenpopulate the steep-power-law, high-luminosity-density ends ofthe E/S0 distributions shown in Figures 24 and 25, respectively.
One possible surprise is that the observed surface brightnessprofiles are smooth and do not show any obvious kink or upturn.This differs from the profiles obtained in the merger simulationsof Mihos &Hernquist (1994) and later by Springel (2000), whichhad a pronounced ‘‘cusp’’ inward of a few hundred parsecs dueto the presence of the young starburst population (although seeSpringel et al. [2005] for a discussion of how black hole feed-back may moderate these effects). Most of the surface brightnessprofiles presented here cover radii in the 10 pc to 1 kpc range, sowe would have detected any such cusps if they existed. However,it should be noted that pronounced kinks are not necessarily a gen-eric feature of the merger simulations. They can be artifacts of thelimited resolution of the simulations, and their possible presencedepends sensitively on the adopted (very uncertain) prescriptionsfor star formation and feedback. In any case, our observations in-dicate that if there is indeed a centrally concentrated population ofyoung stars, then either its brightness profile connects seamlesslywith that of the underlying older stars, or it is more extended (be-yond the kiloparsec range) than was predicted in the Mihos &Hernquist (1994) models.
A predominant theory for the formation of cores in ellipticalgalaxies is through the evolution of supermassive black holes in-volved in a merger. If the two merging galaxies both host a cen-tral black hole, then these black holes will sink to the center ofthe merger remnant through dynamical friction and form a binarysystem that interacts with the surrounding stars. These interactionslead to a hardening of the binary and an ejection of stars from thegalaxy center, thus excavating a core (e.g., Milosavljevic &Merritt2001). The formation of the core happens quickly, in 106Y107 yr,so that in this scenario one might expect to find cores in late-stagemerger remnants. In fact, there is little evidence for cores in the lat-est stage mergers of the Toomre sequence. However, our findingsdo not rule out this scenario, for several reasons: (1) the originalmerging partnersmay not both have had black holes; (2) a coremaybe present but may not be of sufficient size to resolve with our ob-servations; (3) the timescale for black hole binary coalescence mayhave been shortened substantially by the presence of copiousamounts of gas (Escala et al. 2005), so that there was little timefor the scattering of stars and the formation of a core; (4) a coremayhave formed but have been subsequently filled in by stars formedfrom gas driven to the galaxy center during the merger; or (5) per-haps someminimumgalaxymass is essential for the formation of acore, and the Toomre systems are not massive enough. Note withrespect to the last point that galaxy luminosity may not be a goodproxy for galaxy mass. The Toomre-sequence galaxies do occupythe same range of absolute magnitudesMK in which E/S0 galaxiesare sometimes found to have core profiles. Nonetheless, if theToomre-sequence galaxies have younger populations on a galaxy-wide scale (and not just on the nuclear scale discussed above), thefading of these young populations would make the galaxy fainterwith time. One should then compare to E/S0 galaxies that arefainter inMK , which have core-type profiles much more rarely.
6. SUMMARY
We have imaged the central regions of the 11 interacting andmerging galaxies of the Toomre sequence in J, H, and K, using
the NIC2 camera on HST NICMOS, and augmented these datawith HST archival data in similar bands for those galaxies withexisting NIR data. Compared to optical data, NIR data have theadvantage that the images aremuch less affected by dust. The ob-servations therefore offer a relatively unimpeded view into thenuclei, especially when compared to the results of our previousHST WFPC2 study presented in Paper I. With our previous op-tical data it was difficult or impossible in several cases to identifythe true galaxy nucleus/nuclei; by contrast, theNIR data presentedhere generally reveal the nuclei clearly. In most cases we confirmthe galaxy nucleus/nuclei reported from data in other wave bands,such as radio, X-ray, ormillimeter (CO)wavelengths. The nuclearpositions identified from the different observations are generallyconsistent with each other. In NGC 7764Awe detect a double nu-cleus for the first time, with a separation of 0.4300 (260 pc), similarto the separation of the two nuclei in the merging galaxy Arp 220.The presence of a double nucleus in NGC 7764A is consistentwith Toomre’s initial assumption of the system being in the finalmerging stage prior to coalescence. In NGC 3256 S we find ahighly extincted NIR source coincident with the secondary nu-cleus previously identified on the basis of radio and X-ray data.The extinction-corrected K-band luminosity of this source issimilar to that of the nuclei in other Toomre-sequence galaxies.
Aperture photometry of the Toomre-sequence nuclei revealsthat their colors are consistent with the observed colors of ellip-tical galaxies and the predicted colors of intermediate-age or oldstellar populations, but often with considerable extinction. Thereis a marginal trend for the nuclei to become bluer as a function ofthe merger stage in the Toomre sequence. Because stellar pop-ulation differences alone cannot account for the range of colorswe observe in the nuclei, we attribute this trend to a dispersal ofdust during the late stages of merging. This is qualitatively con-sistent with the predictions of models of merging galaxies withblack holes in which AGN feedback is invoked to disperse ob-scuring dust as the merger progresses (e.g., Hopkins et al. 2005).It will be valuable to construct numerical models that make quan-titative predictions for the dust and gas content of interacting andmerging galaxies as a function of merger (st)age, for comparisonto our data.
There is also a trend for the Toomre-sequence nuclei to becomemore luminous (within an aperture of fixed physical size, and aftercorrection for extinction) as a function of the merger stage alongthe sequence. As long as there are no systematic errors in the anal-ysis which depend on the merger stage, this trend is statisticallysignificant at the 2 � level. This result suggests that, as the mergerproceeds, either the stellar density must increase or the averagestellar age must decrease (or both). As a cautionary note we re-mark that this result is based on the assumed merger stage, whichmay not necessarily reflect the true merger (st)age, given how theToomre sequence was initially defined in the first place. In prin-ciple it is possible to test these scenarios in more detail using pop-ulation synthesis models to fit the broadband colors. However, theresults of such an analysis are likely to be quite uncertain given thelarge amounts of extinction and the uncertainties in the dust geom-etry. We therefore postpone a discussion of the stellar populationsto a subsequent paper that will presentHST STIS spectra, obtainedin the context of our investigation.
We have calculated radial V � K color gradients around all thenuclei in our sample. The latest two merger remnants have rathershallow color gradients, whereas most other nuclei have steepergradients. The nuclei with the strongest color gradients are mostlyfound in the midstage mergers. Several of the nuclei become con-siderably redder inward of about 500 from the nucleus, indicatingstrong concentrations of dust in the nuclei.
NICMOS OBSERVATIONS OF TOOMRE-SEQUENCE NUCLEI 2145No. 6, 2007

Finally, we have derived the K-band surface brightness pro-files for those Toomre-sequence nuclei for which the morphologyallows ameaningful isophotal analysis (12 out of the total 18). Theprofiles were fit with a so-called Nuker law to facilitate a compar-ison with other samples of galaxies observed with HST. The ma-jority of the nuclei have steep profiles that can be characterized aspower-law profiles. In general, the Toomre-sequence galaxies tendto have steeper profiles and higher central luminosity surface den-sities than E/S0 galaxies. These findings can both be qualitativelyexplained if the Toomre-sequence galaxies have young stellar pop-ulations concentrated toward their centers. Such populations are ex-pected on the basis of N-body simulations of spiral galaxymergers,in which gas flows toward the center of the merger remnant triggernuclear starbursts. This process may also be responsible for the ob-served trend in the Toomre sequence of increasing nuclear lumi-nosity with advancing merger stage. If left to evolve and fade forseveral more gigayears, it is quite possible that the properties of theToomre-sequence nuclei would look similar to the nuclei of normalE/S0 galaxies. Our results therefore support the view that mergersof spiral galaxies lead to the formation of early-type galaxies.
Support for proposal 9402 was provided by NASA through agrant from the Space Telescope Science Institute, which is op-
erated by the Association of Universities for Research in Astron-omy, Inc., under NASA contract NAS5-26555. We thank NickScoville for kindly providing us with the drizzled NGC 2623 im-ages, and Daisuke Iono for providing us with the unpublishedcoordinates of the COmeasurements of the nuclei of NGC 6621and NGC 7592. We would also like to thank the anonymous ref-eree for a very constructive and detailed report, which helped toimprove the clarity and contents of the paper. R. P. v. d. M. car-ried out part of this research at the Kavli Institute for TheoreticalPhysics in Santa Barbara, supported in part by the National Sci-ence Foundation under grant PHY 99-07949. A. I. Z. is gratefulfor the hospitality and support of the Aspen Center for Physics,the Kavli Institute for Theoretical Physics, and the NewYorkUni-versity Physics Department and Center for Cosmology and Par-ticle Physics during her sabbatical year. This research has madeuse of theNASA/IPACExtragalactic Database, which is operatedby the Jet Propulsion Laboratory, California Institute of Technol-ogy, under contract with the National Aeronautics and Space Ad-ministration. This publicationmakes use of data products from theTwo Micron All Sky Survey, which is a joint project of the Uni-versity ofMassachusetts and the Infrared Processing andAnalysisCenter/California Institute of Technology, funded by the NationalAeronautics and Space Administration and the National ScienceFoundation.
REFERENCES
Aldcroft, T. 2002, ChandraAbsolute Astrometric Accuracy (Cambridge: CXC),http://cxc.harvard.edu/cal /ASPECT/celmon/
Arp, H. C. 1966, Atlas of Peculiar Galaxies (Pasadena: Caltech)Barnes, J. E. 1988, ApJ, 331, 699Barnes, J. E., & Hernquist, L. 1996, ApJ, 471, 115Bessell, M. S., & Brett, J. M. 1988, PASP, 100, 1134Beswick, R. J., Pedlar, A., Clemens, M. S., & Alexander, P. 2003, MNRAS, 346,424
Binney, J. J., & Merrifield, M. 1998, Galactic Astronomy (Princeton: PrincetonUniv. Press)
Boker, T., Laine, S., van der Marel, R. P., Sarzi, M., Rix, H.-W., Ho, L. C., &Shields, J. C. 2002, AJ, 123, 1389
Boker, T., Sarzi, M., McLaughlin, D. E., van der Marel, R. P., Rix, H.-W., Ho,L. C., & Shields, J. C. 2004, AJ, 127, 105
Boker, T., Storey, J. W. V., Krabbe, A., & Lehmann, T. 1997, PASP, 109, 827Borne, K. D., Colina, L., Bushouse, H., & Lucas, R. A. 1999, ApJ, 527, 554Borne, K. D., & Richstone, D. G. 1991, ApJ, 369, 111Braine, J., Duc, P.-A., Lisenfeld, U., Charmandaris, V., Vallejo, O., Leon, S., &Brinks, E. 2001, A&A, 378, 51
Bruzual, G., & Charlot, S. 2003, MNRAS, 344, 1000Bryant, P. M., & Scoville, N. Z. 1999, AJ, 117, 2632Bushouse, H. A., & Stanford, S. A. 1992, ApJS, 79, 213Bushouse, H. A., & Werner, M. W. 1990, ApJ, 359, 72Byun, Y.-I., et al. 1996, AJ, 111, 1889Carollo, C. M., Stiavelli, M., de Zeeuw, P. T., & Mack, J. 1997, AJ, 114, 2366Carral, P., Turner, J. L., & Ho, P. T. P. 1990, ApJ, 362, 434Casoli, F., Dupraz, C., Combes, F., & Kazes, I. 1991, A&A, 251, 1Chabrier, G. 2003, PASP, 115, 763Condon, J. J., Helou, G., Sanders, D. B., & Soifer, B. T. 1990, ApJS, 73, 359———. 1996, ApJS, 103, 81Dickinson, M. E., et al. 2002, in HST NICMOS Data Handbook, ver. 5.0, ed. B.Mobasher (Baltimore: STScI ), 3-1
Escala, A., Larson, R. B., Coppi, P. S., & Mardones, D. 2005, ApJ, 630, 152Fabbiano, G., Kim, D.-W., & Trinchieri, G. 1992, ApJS, 80, 531Fabbiano, G., Schweizer, F., & Mackie, G. 1997, ApJ, 478, 542Fabbiano, G., Zezas, A., & Murray, S. S. 2001, ApJ, 554, 1035Faber, S. M., et al. 1997, AJ, 114, 1771Ferrarese, L., et al. 2006, ApJS, 164, 334Georgakakis, A., Forbes, D. A., & Norris, R. P. 2000, MNRAS, 318, 124Gerssen, J., van der Marel, R. P., Axon, D., Mihos, J. C., Hernquist, L., &Barnes, J. E. 2004, AJ, 127, 75
Hibbard, J. E., Guhathakurta, P., van Gorkom, J. H., & Schweizer, F. 1994, AJ,107, 67
Hibbard, J. E., van der Hulst, J. M., Barnes, J. E., & Rich, R. M. 2001, AJ, 122,2969
Hibbard, J. E., & van Gorkom, J. H. 1996, AJ, 111, 655
Hibbard, J. E., & Yun, M. S. 1999, ApJ, 522, L93Hopkins, P. F., Hernquist, L., Cox, T. J., Di Matteo, T., Robertson, B., &Springel, V. 2006, ApJS, 163, 1
Hopkins, P. F., Hernquist, L., Martini, P., Cox, T. J., Robertson, B., Di Matteo, T.,& Springel, V. 2005, ApJ, 625, L71
Iono, D., Yun, M. S., & Ho, P. T. P. 2005, ApJS, 158, 1Joseph, R. D., Meikle, W. P. S., Robertson, N. A., & Wright, G. S. 1984,MNRAS, 209, 111
Joseph, R. D., & Wright, G. S. 1985, MNRAS, 214, 87Kassin, S. A., Frogel, J. A., Pogge, R. W., Tiede, G. P., & Sellgren, K. 2003,AJ, 126, 1276
Kennicutt, R. C., Jr., Roettiger, K. A., Keel, W. C., van der Hulst, J. M., &Hummel, E. 1987, AJ, 93, 1011
Komossa, S., Burwitz, V., Hasinger, G., Predehl, P., Kaastra, J. S., & Ikebe, Y.2003, ApJ, 582, L15
Kotilainen, J. K., Moorwood, A. F. M., Ward, M. J., & Forbes, D. A. 1996,A&A, 305, 107
Kotilainen, J. K., Reunanen, J., Laine, S., & Ryder, S. D. 2001, A&A, 366, 439Krist, J., & Hook, R. 2001, The TinyTim User’s Guide (Baltimore: STScI )Laine, S., van der Marel, R. P., Lauer, T. R., Postman, M., O’Dea, C. P., &Owen, F. N. 2003a, AJ, 125, 478
Laine, S., van der Marel, R. P., Rossa, J., Hibbard, J. E., Mihos, J. C., Boker, T.,& Zabludoff, A. I. 2003b, AJ, 126, 2717 (Paper I )
Lauer, T. R. 1985, ApJS, 57, 473———. 1986, ApJ, 311, 34Lauer, T. R., et al. 1995, AJ, 110, 2622———. 2005, AJ, 129, 2138Lira, P., Ward, M., Zezas, A., Alonso-Herrero, A., & Ueno, S. 2002, MNRAS,330, 259
Liu, C. T., & Kennicutt, R. C., Jr. 1995a, ApJ, 450, 547———. 1995b, ApJS, 100, 325Lonsdale, C. J., Persson, S. E., & Matthews, K. 1984, ApJ, 287, 95Lucy, L. B. 1974, AJ, 79, 745McMahon, R. G., White, R. L., Helfand, D. J., & Becker, R. H. 2002, ApJS,143, 1
Mihos, J. C., & Hernquist, L. 1994, ApJ, 431, L9———. 1996, ApJ, 464, 641Milosavljevic, M., & Merritt, D. 2001, ApJ, 563, 34Neff, S. G., & Ulvestad, J. S. 2000, AJ, 120, 670Neff, S. G., Ulvestad, J. S., & Campion, S. D. 2003, ApJ, 599, 1043Noguchi, M. 1988, A&A, 203, 259Nolan, L.A., Ponman, T. J., Read, A.M.,&Schweizer, F. 2004,MNRAS, 353, 221Norris, R. P., & Forbes, D. A. 1995, ApJ, 446, 594Pasquali, A., Gallagher, J. S., & de Grijs, R. 2004, A&A, 415, 103Ptak, A. F., Colbert, E. J. M., van der Marel, R. P., Roye, E. W., Heckman, T. M.,& Towne, B. 2006, ApJS, 166, 154
ROSSA ET AL.2146 Vol. 134
Rafanelli, P., & Marziani, P. 1992, AJ, 103, 743Ravindranath, S., Ho, L. C., Peng, C. Y., Filippenko, A. V., & Sargent, W. L. W.2001, AJ, 122, 653 (R01)
Read, A. M. 2003, MNRAS, 342, 715Rest, A., van den Bosch, F. C., Jaffe, W., Tran, H., Tsvetanov, Z., Ford, H. C.,Davies, J., & Schafer, J. 2001, AJ, 121, 2431
Richardson, W. H. 1972, J. Opt. Soc. Am., 62, 55Rieke, G. H., & Lebofsky, M. J. 1985, ApJ, 288, 618Rossa, J., van der Marel, R. P., Boker, T., Gerssen, J., Ho, L. C., Rix, H.-W.,Shields, J. C., & Walcher, C. J. 2006, AJ, 132, 1074
Rothberg, B., & Joseph, R. D. 2004, AJ, 128, 2098———. 2006, AJ, 131, 185Sakamoto, K., Ho, P. T. P., & Peck, A. B. 2006, ApJ, 644, 862Sanders, D. B., & Mirabel, I. F. 1996, ARA&A, 34, 749Sanders, D. B., Soifer, B. T., Elias, J. H., Madore, B. F., Matthews, K.,Neugebauer, G., & Scoville, N. Z. 1988, ApJ, 325, 74
Saviane, I., Hibbard, J. E., & Rich, R. M. 2004, AJ, 127, 660Schade, D., Micol, A., Durand, D., Pirenne, B., Simard, L., Dolensky, M., &Stetson, P. B. 2002, The WFPC2 Association Science Products Pipeline atCADC and ST-ECF (Victoria: Canadian Astron. Data Centre), http://archive.eso.org/archive/hst /wfpc2asn/3sites /WFPC2Newsletter.pdf
Schreier, E. J., et al. 1998, ApJ, 499, L143Schweizer, F. 1982, ApJ, 252, 455———. 1996, AJ, 111, 109———. 1998, inGalaxies: Interactions and Induced Star Formation, ed. D. Friedli,L. Martinet, & D. Pfenniger (Heidelberg: Springer), 105
Schweizer, F., Miller, B. W., Whitmore, B. C., & Fall, S. M. 1996, AJ, 112, 1839Schweizer, F., Seitzer, P., & Brodie, J. P. 2004, AJ, 128, 202
Scoville, N. Z., et al. 1998, ApJ, 492, L107———. 2000, AJ, 119, 991Seigar, M., Carollo, C. M., Stiavelli, M., de Zeeuw, P. T., & Dejonghe, H. 2002,AJ, 123, 184
Silva, D. R., & Bothun, G. D. 1998, AJ, 116, 85Springel, V. 2000, MNRAS, 312, 859Springel, V., Di Matteo, T., & Hernquist, L. 2005, MNRAS, 361, 776Stanford, S. A., & Bushouse, H. A. 1991, ApJ, 371, 92Toomre, A. 1977, in The Evolution of Galaxies and Stellar Populations, ed. B.M.Tinsley & R. B. Larson (New Haven: Yale Univ. Press), 401
Toomre, A., & Toomre, J. 1972, ApJ, 178, 623Verdoes Kleijn, G. A., Baum, S. A., de Zeeuw, P. T., & O’Dea, C. P. 2002, AJ,123, 1334
Wang, Z., Schweizer, F., & Scoville, N. Z. 1992, ApJ, 396, 510Weilbacher, P. M., Duc, P.-A., & FritzeYv. Alvensleben, U. 2003, A&A, 397, 545Whitmore, B. C., & Schweizer, F. 1995, AJ, 109, 960Whitmore, B. C., Schweizer, F., Leitherer, C., Borne, K., & Robert, C. 1993,AJ, 106, 1354
Whitmore, B. C., & Zhang, Q. 2002, AJ, 124, 1418Whitmore, B. C., Zhang, Q., Leitherer, C., Fall, S. M., Schweizer, F., & Miller,B. W. 1999, AJ, 118, 1551
Whitmore, B. C., et al. 2005, AJ, 130, 2104Wright, G. S., James, P. A., Joseph, R. D.,&McLean, I. S. 1990,Nature, 344, 417Yang, Y., Zabludoff, A. I., Zaritsky, D., Lauer, T. R., & Mihos, J. C. 2004, ApJ,607, 258
Yun, M. S., & Hibbard, J. H. 2001, ApJ, 550, 104Zezas, A., Fabbiano, G., Rots, A. H., & Murray, S. S. 2002a, ApJ, 577, 710———. 2002b, ApJS, 142, 239
NICMOS OBSERVATIONS OF TOOMRE-SEQUENCE NUCLEI 2147No. 6, 2007