the tools of fiscal policy - u.s. history
TRANSCRIPT
Advanced Placement Economics Macroeconomics: Student Resource Manual © Council for Economic Education, New York, N.Y. 167
5 Macroeconomics
The Tools of Fiscal Policy
Changes in taxes and government spending designed to affect the level of aggregate demand in the economy are called fiscal policy.
Recall that aggregate demand is the total amount of spending on goods and services in the economy during a stated period of time and is made up of consumer spending (C), investment (I), government spending (G), and net exports (Xn). Aggregate supply is the total amount of goods and services available in the economy.
During a recession, the short-run equilibrium is below the full-employment level of output. Aggregate demand is too low to bring about full employment of resources. Government can increase aggregate demand by spending more and/or cutting taxes. Increasing aggregate demand to move the economy toward full employment is expansionary fiscal policy. Expansionary fiscal policy increases employment but also can raise the price level and result in budget deficits.
If the level of aggregate demand is too high, it creates inflationary pressures. Government can decrease aggregate demand by reducing spending and/or increasing taxes. Decreasing aggregate demand to decrease inflationary pressures is contractionary fiscal policy. Contractionary fiscal policy reduces inflationary pressures but can also decrease output and employment. Contractionary fiscal policy can result in budget surpluses (or smaller budget deficits).
Student Alert: Remember that the multiplier is different for taxes and for spending!
Decide whether each of the following fiscal policies of the federal government is expansionary or contractionary. Write expansionary or contractionary, and explain the reasons for your choice.
1. The government cuts business and personal income taxes and increases its own spending.
2. The government increases the personal income tax, Social Security tax, and corporate income tax. Government spending stays the same.
3. Government spending goes up while taxes remain the same.
4. The government reduces the wages of its employees while raising taxes on consumers and businesses. Other government spending remains the same.
ACTIVITY 5-1
CEE-APE_MACROSE-12-0101-MASM-Book.indb 167 27/07/12 10:46 PM

168 Advanced Placement Economics Macroeconomics: Student Resource Manual © Council for Economic Education, New York, N.Y..
5 Macroeconomics ACTIVITY 5-1 (CONTINUED)
Effects of Fiscal Policy
Test your understanding of fiscal policy by completing Table 5-1.1. Your choices for each situation must be consistent—that is, you should choose either an expansionary or contractionary fiscal policy. (Fiscal policy cannot provide a solution to one of the situations.) Fill in the spaces as follows:
Column A: Objective for aggregate demand
Draw an up arrow to increase aggregate demand or a down arrow to decrease aggregate demand.
Column B: Action on taxes
Draw an up arrow to increase taxes or a down arrow to decrease taxes.
Column C: Action on government spending
Draw an up arrow to increase government spending or a down arrow to decrease government spending.
Column D: Effect on federal budget
Write toward deficit if your action will increase the deficit (or reduce the surplus) or toward surplus if your action will reduce the deficit (or increase the surplus).
Column E: Effect on national bebt
Draw an up arrow if your action will increase the national debt or a down arrow if your action will decrease the national debt.
Table 5-1.1Effects of Fiscal Policy
(A) Objective
for aggregate demand
(B) Action
on taxes
(C) Action on
government spending
(D) Effect
on federal budget
(E) Effect on national
debt
1. National unemployment rate rises to 12 percent.
2. Inflation is strong at a rate of 14 percent per year.
3. Surverys show consumers are losing confidence in the economy, retail sales are weak, and business inventories are increasing rapidly.
4. Business sales and investment are expanding rapidly, and economists think strong inflation lies ahead.
5. Inflation persists while unemployment stays high.
CEE-APE_MACROSE-12-0101-MASM-Book.indb 168 27/07/12 10:46 PM

Advanced Placement Economics Macroeconomics: Student Resource Manual © Council for Economic Education, New York, N.Y. 169
5 Macroeconomics
Discretionary Fiscal Policy and Automatic Stabilizers
One of the goals of economic policy is to stabilize the economy. This means promoting full employment and stable prices. To accomplish this, aggregate demand must be near the full-employment level of output. If aggregate demand is too low, there will be unemployment. If aggregate demand is too high, there will be inflation.
If aggregate demand is too low, government can use fiscal policy to stimulate the economy through increased spending or decreased taxes. These policies are examples of expansionary fiscal policy. If government wants to decrease aggregate demand, it can pursue a contractionary fiscal policy by decreasing taxes or increasing spending.
If government has to pass a law or take some other specific action to change taxes or spending, then the action is at the government’s discretion and the policy is discretionary policy. If the effect happens automatically as the economic situation changes, then the policy is the result of an automatic stabilizer. An example of an automatic stabilizer is unemployment compensation. If the economy goes into a recession, some people are laid off and are eligible to receive unemployment compensation. The payment creates income and spending to keep aggregate demand from falling as much as it would have. Unemployment compensation stabilizes the economy automatically during a recession.
For each of the scenarios on the following page, indicate whether it represents an automatic (A) or discretionary (D) stabilizer, and whether it is an example of expansionary (E) or contractionary (C) fiscal policy.
Economic scenariosAutomatic (A) or Discretionary (D)
Expansionary (E) or Contractionary (C)
Example: Recession raises amount of unemployment compensation.
A E
1. The government cuts personal income tax rates.
2. The government eliminates favorable tax treatment on long-term capital gains.
3. Incomes rise; as a result, people pay a larger fraction of their income in taxes.
4. As a result of a recession, more families qualify for food stamps and welfare benefits.
ACTIVITY 5-2
CEE-APE_MACROSE-12-0101-MASM-Book.indb 169 27/07/12 10:46 PM

170 Advanced Placement Economics Macroeconomics: Student Resource Manual © Council for Economic Education, New York, N.Y..
5 Macroeconomics
Economic scenariosAutomatic (A) or Discretionary (D)
Expansionary (E) or Contractionary (C)
5. The government eliminates the deductibility of interest expense for tax purposes.
6. The government launches a major new space program to explore Mars.
7. The government raises Social Security taxes.
8. Corporate profits increase; as a result, government collects more corporate income taxes.
9. The government raises corporate income tax rates.
10. The government gives all its employees a large pay raise.
ACTIVITY 5-2 (CONTINUED)
CEE-APE_MACROSE-12-0101-MASM-Book.indb 170 27/07/12 10:46 PM
Advanced Placement Economics Macroeconomics: Student Resource Manual © Council for Economic Education, New York, N.Y. 171
5 Macroeconomics
Monetary and Fiscal Policy
Tools of Monetary and Fiscal Policy
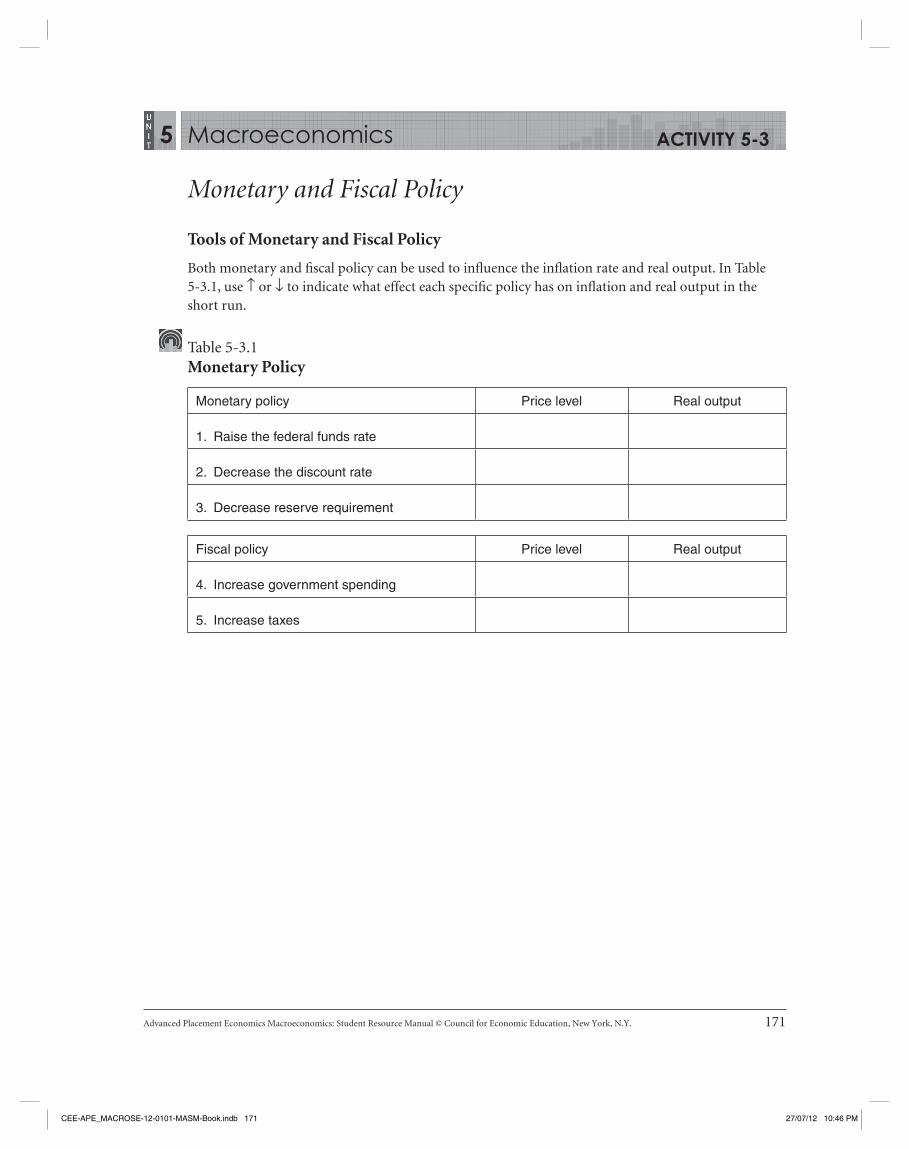
Both monetary and fiscal policy can be used to influence the inflation rate and real output. In Table 5-3.1, use ↑ or ↓ to indicate what effect each specific policy has on inflation and real output in the short run.
Table 5-3.1Monetary Policy
Monetary policy Price level Real output
1. Raise the federal funds rate
2. Decrease the discount rate
3. Decrease reserve requirement
Fiscal policy Price level Real output
4. Increase government spending
5. Increase taxes
ACTIVITY 5-3
CEE-APE_MACROSE-12-0101-MASM-Book.indb 171 27/07/12 10:46 PM

Advanced Placement Economics Macroeconomics: Student Resource Manual © Council for Economic Education, New York, N.Y. 173
5 Macroeconomics
Policy Effects on Aggregate Supply
Fiscal and monetary policy affect the economy through changes in aggregate demand (AD). There are also policies that can affect the short-run aggregate supply (SRAS) and long-run aggregate supply (LRAS). Any policy that changes a determinant of SRAS or leads to long-run economic growth will affect the macroeconomy through the supply side. The determinants of SRAS include changes in economy-wide input prices (like wages and the price of oil) and productivity. Factors that affect the LRAS include increases in available resources, higher quality resources, or technological advances.
1. Assume the government grants businesses a substantial tax credit on capital investment. Circle the correct symbol (↑ for increase, ↓ for decrease) to indicate what will happen to the following as a result of the tax credit.
(A) Capital investment ➞
➞
(B) AD ➞
➞
(C) The amount of capital available to labor ➞
➞
(D) Productivity ➞
➞
(E) Firms’ unit cost of production ➞
➞
(F) SRAS ➞
➞
(G) LRAS ➞
➞
(H) Real gross domestic product (GDP) ➞
➞
2. How will a decrease in business taxes affect firms’ per unit costs?
ACTIVITY 5-4
CEE-APE_MACROSE-12-0101-MASM-Book.indb 173 27/07/12 10:46 PM

174 Advanced Placement Economics Macroeconomics: Student Resource Manual © Council for Economic Education, New York, N.Y..
5 Macroeconomics
3. Use the AS/AD diagram below to show the effect of a decrease in business taxes on SRAS, real GDP, and the price level.
SRAS
PL
Y
PR
ICE
LE
VE
L
AD
REAL GDP
4. How will firms’ unit cost of production change when there is an increase in government regulation? (Hint: compliance with regulations creates a cost for firms.) Use the following AS/AD diagram to show how an increase in regulations on firms affects SRAS, real GDP, and the price level.
SRAS
PL
Y
PR
ICE
LE
VE
L
AD
REAL GDP
ACTIVITY 5-4 (CONTINUED)
CEE-APE_MACROSE-12-0101-MASM-Book.indb 174 27/07/12 10:46 PM

Advanced Placement Economics Macroeconomics: Student Resource Manual © Council for Economic Education, New York, N.Y. 175
5 Macroeconomics
Assume that the economy suffers a negative supply shock and that input prices are completely flexible. In the absence of any fiscal or monetary policy, explain how the economy will return to full employment. To help you reach the correct conclusion, answer the following questions.
5. Immediately following the supply shock, what happens to unemployment?
6. How will high unemployment in the economy affect both product prices and wages if prices and wages are completely flexible?
7. How do firms respond to a decrease in input prices?
8. What effect will firms’ response to the decrease in input prices have on SRAS?
ACTIVITY 5-4 (CONTINUED)
CEE-APE_MACROSE-12-0101-MASM-Book.indb 175 27/07/12 10:46 PM

Advanced Placement Economics Macroeconomics: Student Resource Manual © Council for Economic Education, New York, N.Y. 177
5 Macroeconomics
Monetary and Fiscal Policy Interactions
In the figures accompanying each question, illustrate the short-run effects for each monetary and fiscal policy combination using the money market, the loanable funds market, and aggregate supply/aggregate demand (AS/AD) graph. Circle the up or down arrow (or ? for uncertain), and explain the effect of the policies on real gross domestic product (GDP), the price level, unemployment, interest rates, and investment.
1. The unemployment rate is 10 percent, and the inflation rate is 2 percent. The federal government cuts personal income taxes and increases its spending. The Federal Reserve (the Fed) buys bonds on the open market.
Figure 5-5.1Expansionary Monetary and Fiscal Policy
(A) Real GDP Explain.
(B) The price level Explain.
(C) Unemployment Explain.
REAL GDP
PR
ICE
LE
VE
L
QUANTITY OF MONEY
INT
ER
ES
T R
ATE
QUANTITY OFLOANABLE FUNDS
INT
ER
ES
T R
ATE
(D) Interest rates Explain.
(E) Investment Explain.
ACTIVITY 5-5
CEE-APE_MACROSE-12-0101-MASM-Book.indb 177 27/07/12 10:46 PM

178 Advanced Placement Economics Macroeconomics: Student Resource Manual © Council for Economic Education, New York, N.Y..
5 Macroeconomics
2. The unemployment rate is 6 percent, and the inflation rate is 9 percent. The federal government raises personal income taxes and cuts spending. The Fed sells bonds on the open market.
Figure 5-5.2Contractionary Monetary and Fiscal Policy
(A) Real GDP Explain.
(B) The price level Explain.
(C) Unemployment Explain.
PR
ICE
LE
VE
L
INT
ER
ES
T R
ATE
INT
ER
ES
T R
ATE
(D) Interest rates Explain.
(E) Investment Explain.
REAL GDP QUANTITY OF MONEY QUANTITY OFLOANABLE FUNDS
ACTIVITY 5-5 (CONTINUED)
CEE-APE_MACROSE-12-0101-MASM-Book.indb 178 27/07/12 10:46 PM

Advanced Placement Economics Macroeconomics: Student Resource Manual © Council for Economic Education, New York, N.Y. 179
5 Macroeconomics
3. The unemployment rate is 6 percent, and the inflation rate is 5 percent. The federal government cuts personal income taxes and maintains current spending. The Fed sells bonds on the open market.
Figure 5-5.3Contractionary Monetary Policy and Expansionary Fiscal Policy
(A) Real GDP Explain.
(B) The price level Explain.
(C) Unemployment Explain.
PR
ICE
LE
VE
L
INT
ER
ES
T R
ATE
INT
ER
ES
T R
ATE
(D) Interest rates Explain.
(E) Investment Explain.
REAL GDP QUANTITY OF MONEY QUANTITY OFLOANABLE FUNDS
ACTIVITY 5-5 (CONTINUED)
CEE-APE_MACROSE-12-0101-MASM-Book.indb 179 27/07/12 10:46 PM

Advanced Placement Economics Macroeconomics: Student Resource Manual © Council for Economic Education, New York, N.Y. 181
5 Macroeconomics
The Deficit and the Debt
The two primary tools of discretionary fiscal policy are government spending (G) and taxes (T). When government conducts expansionary fiscal policy to counteract recession, G increases and/or T decreases. When G increases and/or T decreases, the government budget moves toward deficit. A budget deficit occurs when the government spends more than it collects in taxes and borrows to cover the difference. It does this by issuing bonds. The sum of past deficits is the debt. The debt incurs annual interest charges.
When the government conducts contractionary fiscal policy to alleviate inflationary pressures, G decreases and/or T increases. When G decreases and/or T increases, the government budget moves toward surplus. A budget surplus happens when the government taxes more than it spends. The surplus can be used to reduce the debt.
The effect of government borrowing can be modeled using the loanable funds market. A government budget deficit results in an increase in the demand (D) for loanable funds. A budget surplus reduces the demand for loanable funds. It results in an increase in the supply (S) of loanable funds if government pays off the debt.
1. Complete Table 5-6.1. Circle deficit or surplus, and in the other columns place an up arrow for increase, a down arrow for decrease, or NC for no change.
Table 5-6.1Budget Effects of Fiscal Policy
Fiscal policyTools of
fiscal policy
Effect on government’s
budgetEffect on
debt
Effect on loanable funds
marketEffect on real interest rate
Expansionary G__ T__ Deficit / Surplus D__ S__
Contractionary G__ T__ Deficit / Surplus D__ S__
The central bank of a country can counteract the effect of budget deficits on the real interest rate by conducting an open market purchase of government securities. When the central bank purchases the securities directly from the government, this is referred to as monetizing the debt and is seen as highly inflationary. The effect of an open-market purchase of government securities can be modeled using the money market.
ACTIVITY 5-6
CEE-APE_MACROSE-12-0101-MASM-Book.indb 181 27/07/12 10:46 PM

182 Advanced Placement Economics Macroeconomics: Student Resource Manual © Council for Economic Education, New York, N.Y..
5 Macroeconomics
2. Draw a graph of the money market showing how an open-market purchase of government securities affects the nominal interest rate.
3. How would the change in the nominal interest rate affect the real interest rate? Explain.
4. Why is monetizing the debt inflationary?
ACTIVITY 5-6 (CONTINUED)
CEE-APE_MACROSE-12-0101-MASM-Book.indb 182 27/07/12 10:46 PM

Advanced Placement Economics Macroeconomics: Student Resource Manual © Council for Economic Education, New York, N.Y. 183
5 Macroeconomics
Crowding Out
Expansionary fiscal policy increases aggregate demand and moves the budget toward deficit. If deficit spending is financed through borrowing, the government will demand loanable funds. The government’s demand for loanable funds (D
lf) added to the demand for loanable funds by private
borrowers. Thus expansionary fiscal policy increases Dlf and may cause interest rates to rise. Because
the government is borrowing money to finance its expansionary fiscal policy, consumers and businesses will be “crowded out” of financial markets. If consumers and businesses are not able to borrow to finance spending, it will lead to a decrease in aggregate demand (AD).
Crowding out occurs when the government borrows to pursue expansionary fiscal policy and such government borrowing replaces private borrowing and spending. Because some private borrowing and spending is “crowded out” of the economy, part of the increase in aggregate demand from increased government spending (and/or decreased taxes) is offset by a decrease in aggregate demand from decreased consumption and investment as interest rates rise.
Figure 5-7.1Crowding Out
PR
ICE
LE
VE
L SRAS
rPL
AD DlfY Qlf
REAL GDP QUANTITY LOANABLE FUNDS
Slf
RE
AL
INT
ER
ES
T R
AT
E
1. Assume fiscal policy is expansionary and the government funds the resulting deficit through borrowing. In Figure 5-7.1, shift one curve in each graph to illustrate the effect of the fiscal policy, and label the new equilibrium values.
2. How will the change in the equilibrium interest rate in the loanable funds market affect the short-run aggregate supply (SRAS) curve in the long run? Show on the AS/AD graph above, and explain.
ACTIVITY 5-7
CEE-APE_MACROSE-12-0101-MASM-Book.indb 183 27/07/12 10:46 PM

Advanced Placement Economics Macroeconomics: Student Resource Manual © Council for Economic Education, New York, N.Y. 185
5 Macroeconomics
Short-Run Phillips Curve
The Phillips curve relationship was first proposed by A. W. Phillips in 1958. Following up on Phillips’s research, other economists found an inverse relationship between the inflation rate and the unemployment rate. In other words, when inflation increased, the unemployment rate decreased, and when inflation decreased, the unemployment rate increased. A graphic representation of this trade-off became known as the Phillips curve.
Student Alert: Pay close attention to the axes when you graph Phillips curves!
Figure 5-8.1 shows a Phillips curve. The curve illustrates the trade-off between inflation and unemployment.
Figure 5-8.1Phillips Curve
Phillips curve
UNEMPLOYMENT RATE (%)
INF
LAT
ION
RAT
E (
%)
Data from the 1960s appeared to support the Phillips curve relationship. When inflation was low, the unemployment rate was high. The Phillips curve suggested that when the unemployment rate is higher than the natural rate of unemployment and the economy is not operating at its potential gross domestic product (GDP), decreasing unemployment would lead to higher inflation.
ACTIVITY 5-8
CEE-APE_MACROSE-12-0101-MASM-Book.indb 185 27/07/12 10:47 PM

186 Advanced Placement Economics Macroeconomics: Student Resource Manual © Council for Economic Education, New York, N.Y..
5 Macroeconomics
1. Assume that the economy begins in short-run equilibrium as shown in Figure 5-8.2. Graph the effect on the equilibrium price level (PL) and real GDP (Y) if there is a decrease in aggregate demand (AD). Label the equilibrium price level and real GDP after the decrease in aggregate demand as PL
2 and Y
2.
Figure 5-8.2Aggregate Demand Decrease
PR
ICE
LE
VE
L
REAL GDP
LRAS
PL1
Y1
SRAS
AD
2. What happens to each of the following in the short run?
Real GDP The unemployment rate
The price level Real wages
3. Draw a graph of a short-run Phillips curve on the following page. Make sure you label your axes correctly. You will plot PL
1 and PL
2 along with their corresponding unemployment rates. There are
no numbers for PL1 and PL
2, just plot PL
1 at some level and then plot PL
2 either above or below it,
as shown in the graph above. Then select some unemployment rate (U1) to go with PL
1 and then
plot U2 either above or below U
1 as shown on the graph above. Since the short-run Phillips curve
shows the relationship between the inflation rate and the unemployment rate and the aggregate demand/aggregate supply (AD/AS) graph shows the relationship between the price level and real GDP, you need to determine how the change in aggregate demand affects the unemployment rate when the output level changes. Remember that when the economy is in long-run equilibrium, it is at full employment (the unemployment rate is low), and as real GDP falls, the decrease in production causes employment to decrease the unemployment rate to increase.
ACTIVITY 5-8 (CONTINUED)
CEE-APE_MACROSE-12-0101-MASM-Book.indb 186 27/07/12 10:47 PM

Advanced Placement Economics Macroeconomics: Student Resource Manual © Council for Economic Education, New York, N.Y. 187
5 Macroeconomics
When the economy of the 1970s experienced high inflation and high unemployment at the same time (i.e., stagflation) the Phillips curve relationship no longer appeared to be true. Eventually, additional data showed that the negative relationship between the inflation rate and the unemployment rate still held, but that the short-run Phillips curve had shifted to the right, as shown in Figure 5-8.3. The rightward shift of the short-run Phillips curve was due to a negative supply shock—a decrease in aggregate supply caused by an increase the price of oil. A positive supply shock (e.g., an advance in technology) will shift the short-run Phillips curve to the left. A negative (positive) supply shock means that for every given unemployment rate, the corresponding inflation rate is higher (lower).
Figure 5-8.3Short-Run Phillips Curves
1960s
1970s
UNEMPLOYMENT RATE (%)
INF
LAT
ION
RA
TE
(%
)
ACTIVITY 5-8 (CONTINUED)
CEE-APE_MACROSE-12-0101-MASM-Book.indb 187 27/07/12 10:47 PM

188 Advanced Placement Economics Macroeconomics: Student Resource Manual © Council for Economic Education, New York, N.Y..
5 Macroeconomics
4. Assume the economy begins at long-run equilibrium as shown in Figure 5-8.4. Draw a new SRAS curve illustrating the effect of an increase in oil prices. Label the new curve SRAS
1, the new
equilibrium price level PL3, and the new level of real GDP Y
2.
Figure 5-8.4Effect of an Increase in Oil Prices
PR
ICE
LE
VE
L
REAL GDP
LRAS
PL1
Y1
SRAS
AD
5. Based on your graph, what happens to each of the following in the short run?
Real GDP The unemployment rate
The price level Real wages
6. On the short-run Phillips curve you drew before, plot the inflation and unemployment rates that result when the price of oil increases. Remember that a decrease in real GDP means there has been a decrease in production, and therefore employment will fall and the unemployment rate will increase. This point lies on as SRAS curve that has shifted to the right as a result of the higher oil prices.
Supply shocks are not the only thing that will shift the short-run Phillips curve. The expected rate of inflation will also cause the short-run Phillips curve to shift. When workers expect inflation they bargain for higher wage rates, and employers are more willing to grant higher wage rates when they expect to sell their product for higher prices in the future. When the expected rate of inflation is higher, the short-run Phillips curve shifts to the right, and the actual rate of inflation increases. If the expected rate of inflation decreases, the short-run Phillips curve will shift to the left and the actual inflation rate will decrease. Expectations for inflation lead to change in actual inflation—like a self-fulfilling prophecy.
ACTIVITY 5-8 (CONTINUED)
CEE-APE_MACROSE-12-0101-MASM-Book.indb 188 27/07/12 10:47 PM

Advanced Placement Economics Macroeconomics: Student Resource Manual © Council for Economic Education, New York, N.Y. 189
5 Macroeconomics
The Long-Run Phillips Curve and the Role of Expectations
Expectation and the Short-Run Phillips Curve
The short-run Phillips curve (SRPC) is drawn for a given expected rate of inflation and a specific natural rate of unemployment. Changes in inflationary expectations will shift the SRPC. People base their inflationary expectations on information and personal experience, which can result in gaps between the expected rate of inflation and the actual rate of inflation.
1. Suppose the economy is experiencing 2 percent inflation. News of rising energy costs increases people’s expectations of inflation. Graph the change in the SRPC.
2. If the government increases spending, how does it affect inflationary expectations? Explain.
3. If people are confident that a new Federal Reserve policy will achieve and maintain price stability, how does it affect inflationary expectations? Explain.
4. What will happen to the actual rate of inflation if people expect a higher inflation rate in the future? What will happen to the actual rate of inflation if people expect a lower inflation rate in the future? Explain.
ACTIVITY 5-9
CEE-APE_MACROSE-12-0101-MASM-Book.indb 189 27/07/12 10:47 PM

190 Advanced Placement Economics Macroeconomics: Student Resource Manual © Council for Economic Education, New York, N.Y..
5 Macroeconomics
The Long-Run Phillips Curve
The long-run Phillips curve (LRPC) represents the relationship between unemployment and inflation after the economy has adjusted to inflationary expectations. The LRPC corresponds to the long-run aggregate supply (LRAS) and occurs at the nonaccelerating inflation rate of unemployment (NAIRU). The NAIRU is the unemployment rate at which the unemployment rate does not change over time. The NAIRU corresponds to the full employment level of output and the natural rate of unemployment. Trying to keep the unemployment rate below the NAIRU leads to accelerating inflation rates and cannot be maintained in the long run. Unemployment rates above NAIRU will lead to accelerating deflation that cannot be maintained.
The LRPC is vertical because any unemployment rate above or below the NAIRU cannot be maintained. This means that there is no long-run trade-off between inflation and unemployment—that is, no policy can maintain unemployment rates below the NAIRU in the long run.
5. Draw a graph of the LRPC. Be sure to correctly label the axes and label the point at which the LRPC intersects the horizontal axis.
6. What does the slope of the LRPC indicate about the trade-off between the inflation rate and the unemployment rate?
7. Use the graph in problem 5 to show the effect on the LRPC if the natural rate of unemployment decreases. What happens to the LRAS when the natural rate of unemployment decreases?
ACTIVITY 5-9 (CONTINUED)
CEE-APE_MACROSE-12-0101-MASM-Book.indb 190 27/07/12 10:47 PM

Advanced Placement Economics Macroeconomics: Student Resource Manual © Council for Economic Education, New York, N.Y. 191
5 Macroeconomics
Figure 5-9.1Long-Run Adjustment
UNEMPLOYMENT RATE
INF
LAT
ION
RAT
E
A
LRPC
SRPC2
SRPC0
SRPC1
8. What change in inflationary expectations is shown by the shift in the short-run Phillips curve (SRPC) from SRPC
0 to SRPC
1 in Figure 5-9.1?
9. The LRPC is vertical at the unemployment rate that corresponds to an inflation rate equal to zero. What is the name for this rate of unemployment?
10. At point A on the graph, the actual rate of inflation is (greater than / less than) the expected rate of inflation, which will cause the SRPC to shift to the (right / left). Label point B on the graph where the economy will be in long-run equilibrium after the change in inflationary expectations. Label point C on the graph where the economy will be if policy makers attempt to keep the unemployment rate where it was at point A after the change in inflationary expectations.
ACTIVITY 5-9 (CONTINUED)
CEE-APE_MACROSE-12-0101-MASM-Book.indb 191 27/07/12 10:47 PM