the tioga-2 database on visualizati - stanford cs...
TRANSCRIPT

The Tioga-2 Database VisualizationEnvironmentAlexander Aiken?, Jolly Chen, Mark Lin, Mybrid Spalding,Michael Stonebraker and Allison Woodru�Department of Electrical Engineering and Computer SciencesUniversity of California, Berkeleyemail: [email protected]. This paper reports on user experience with Tioga, a DBMS-centric visualization tool developed at Berkeley. Based on this experience,we have designed Tioga-2 as a direct manipulation system that is morepowerful and much easier to program. We present a detailed design ofthe revised system together with an extensive example of its application.We also give a progress report on a Tioga-2 implementation.1 IntroductionDatabase system performance|as measured by either processing speed or thequantity of data that can be managed|has grown by an order of magnitudein recent years, making increasingly sophisticated applications feasible on ever-larger data sets. However, database query languages have changed relatively littleand are di�cult for non-experts to use. The vast majority of database users areunable to customize applications to their own needs, let alone develop their owncustom applications. Thus, at present the expanding capabilities of databasesystems can be exploited fully only by expert programmers. Making databaseseasier to use and program, and thereby more accessible, is an important issuetoday and will become more important as database technology becomes faster,cheaper, and more powerful [11].This paper reports on the design of Tioga-2, a new database visualization en-vironment. We use the term \visualization environment" rather than \program-ming environment" to emphasize that most programming operations in Tioga-2are performed by manipulating graphical representations of either programs ordata. Tioga-2 is based on a small set of primitive operations for transformingdata and its visualization. These primitives have been chosen carefully to haveclear, simple semantics and to be composable. Thus, Tioga-2 users can buildsophisticated applications|or modify existing applications|by successive com-position of the primitives. We believe that by providing a small set of general\building blocks", minimum language syntax, and immediate feedback on thee�ect of incremental program modi�cations, Tioga-2 makes it much easier fordatabase users to develop database applications.? This research was sponsored by NSF under grants IRI-9400773 and IRI-9411334.

Tioga-2 has not been designed in a vacuum. Previously, we reported onthe design and implementation of Tioga, a visualization system that is cou-pled closely with the POSTGRES DBMS [12]. The design of Tioga-2 has beenin uenced heavily by what we learned from user experiences with Tioga and acompanion commercial product, Illustra Object-Knowledge, based on the sameideas. In the rest of this introduction, we �rst discuss the problems and lessonsfrom Tioga and then outline our solution to those problems in Tioga-2.1.1 TiogaTioga adopts the \boxes-and-arrows" programming paradigm popularized byAVS [13], Data Explorer [7], and Khoros [9]. Every box is a user-de�ned function,which has been registered with POSTGRES. A programmer constructs a Tiogaprogram using a drag and drop editor to move and connect boxes on the screen.Every Tioga program has a designated viewer connected to the output ofa speci�ed box. The viewer provides the user with a two-dimensional canvasonto which the programmer places renderable objects. In addition, the viewerprovides a pan feature whereby the user can \ y over" the canvas viewing areasof interest. Furthermore, the user can zoom into areas of the canvas to see moredetail. Zoom is a powerful construct, as it supports so-called drill-down|theability to change the visual representation of data. For example, a state mapof the United States could become a county map upon suitable zooming. Inaddition, we speci�ed but never implemented the features of multiple viewers,viewers within viewers, cloning of viewers, slaving of viewers, and wormholes[14].Experience with Tioga and Illustra Object-Knowledge can be summarized asfollows:1. Programmer modelTioga is based on the idea that an expert programmer constructs POST-GRES user-de�ned functions (boxes) and that a second programmer usesan editor to \wire up" visualizations. In this way, Tioga implements a \bigprogrammer / little programmer" environment.It has been su�ciently hard to construct boxes-and-arrows programs thatthe little programmer must, in fact, be a big programmer. The key problemis that simplifying the speci�cation of control logic through a boxes-and-arrows notation does not simplify programming su�ciently. For example, toconstruct Tioga applications, the little programmer must understand locat-ing objects on a canvas and turning objects into graphical representations.It turns out that even expert programmers �nd these tasks di�cult. As aresult, little programmers have not been able to program in Tioga becauseit is not nearly easy enough to use.2. Programming environmentTioga has the familiar notion of building a program, compiling it, and thenrunning the compiled result. Novices have di�culty learning how to programe�ectively in this paradigm. For example, if nothing appears on the screen,

then there is a \bug" in the program. Bugs are hard for the programmerto �nd because Tioga provides a viewer only for the �nal result; it is notpossible to place a viewer on any edge in a diagram to visualize the datathat is owing along that edge.3. Expressive powerAs a result of trying to provide a simple programming model, Tioga is insome ways oversimpli�ed. To select only a single example, because every boxmust be a user-de�ned function, a box has a single output, which must beof a speci�c type. This makes it di�cult to implement functionality of theform:if condition then deliver data to box i else deliver data to box j1.2 Tioga-2: Guiding PrinciplesBased on our experiences, we are redesigning Tioga completely from scratch,and the result is Tioga-2, described in this paper. We begin with the principlesthat have guided the redesign.Much of the problem with the original Tioga system is that there is no wayto specify some aspects of a visualization except via ordinary statement- andexpression-oriented programming. Learning to write procedural code is a highhurdle for non-programmers, and some visualization aspects|such as writingfunctions to position data in a multi{dimensional space|are di�cult even forexpert programmers.There is an alternative way to specify data visualizations. Non-programmersintuitively understand how to specify desired computations \by example"|bymanipulating sample data. Instead of writing in a standard programming syntax,the programmer begins with very simple displays of data and composes themdirectly on the screen to construct elaborate visualizations. In moving from theboxes-and-arrows notation of Tioga to the direct manipulation programmingparadigm of Tioga-2, we have identi�ed a number of principles we believe to beimportant to a usable, exible, and powerful direct manipulation visualizationsystem:1. Every result of a user action has a valid visual representation.All data types constructible by Tioga-2 programs have a well-de�ned screenrepresentation. As such, the programmer obtains immediate visual feedbackon the e�ect of any change to a Tioga-2 program and can visually inspectintermediate results. This principle facilitates debugging activities and solvesproblem (2) noted above.2. Programming is incremental.Visualizations are constructed incrementally by successive composition of asmall number of simple primitives. Combined with the ability to visualizeresults of incremental changes immediately, we believe that we can empowerthe little programmer to construct Tioga-2 programs. In Tioga-2, there is nodistinction between constructing a program, modifying an existing program,and using an existing program.
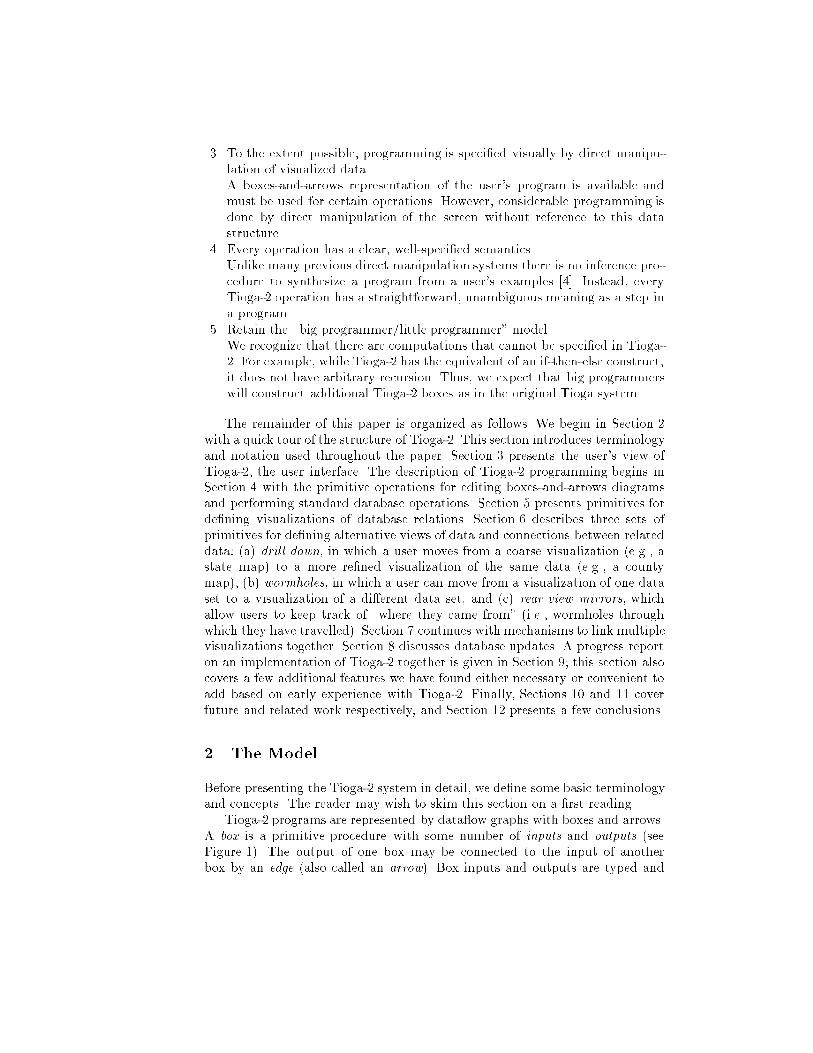
3. To the extent possible, programming is speci�ed visually by direct manipu-lation of visualized data.A boxes-and-arrows representation of the user's program is available andmust be used for certain operations. However, considerable programming isdone by direct manipulation of the screen without reference to this datastructure.4. Every operation has a clear, well-speci�ed semantics.Unlike many previous direct manipulation systems there is no inference pro-cedure to synthesize a program from a user's examples [4]. Instead, everyTioga-2 operation has a straightforward, unambiguous meaning as a step ina program.5. Retain the \big programmer/little programmer" model.We recognize that there are computations that cannot be speci�ed in Tioga-2. For example, while Tioga-2 has the equivalent of an if-then-else construct,it does not have arbitrary recursion. Thus, we expect that big programmerswill construct additional Tioga-2 boxes as in the original Tioga system.The remainder of this paper is organized as follows. We begin in Section 2with a quick tour of the structure of Tioga-2. This section introduces terminologyand notation used throughout the paper. Section 3 presents the user's view ofTioga-2, the user interface. The description of Tioga-2 programming begins inSection 4 with the primitive operations for editing boxes-and-arrows diagramsand performing standard database operations. Section 5 presents primitives forde�ning visualizations of database relations. Section 6 describes three sets ofprimitives for de�ning alternative views of data and connections between relateddata: (a) drill down, in which a user moves from a coarse visualization (e.g., astate map) to a more re�ned visualization of the same data (e.g., a countymap), (b) wormholes, in which a user can move from a visualization of one dataset to a visualization of a di�erent data set, and (c) rear view mirrors, whichallow users to keep track of \where they came from" (i.e., wormholes throughwhich they have travelled). Section 7 continues with mechanisms to link multiplevisualizations together. Section 8 discusses database updates. A progress reporton an implementation of Tioga-2 together is given in Section 9; this section alsocovers a few additional features we have found either necessary or convenient toadd based on early experience with Tioga-2. Finally, Sections 10 and 11 coverfuture and related work respectively, and Section 12 presents a few conclusions.2 The ModelBefore presenting the Tioga-2 system in detail, we de�ne some basic terminologyand concepts. The reader may wish to skim this section on a �rst reading.Tioga-2 programs are represented by data ow graphs with boxes and arrows.A box is a primitive procedure with some number of inputs and outputs (seeFigure 1). The output of one box may be connected to the input of anotherbox by an edge (also called an arrow). Box inputs and outputs are typed and

Fig. 1. Weather stations in Louisiana.edges connect outputs to inputs of compatible types. Any attempt to connect anoutput to an input of incompatible type is a type error. Tioga-2 programs havedata ow semantics; when data is present on all of a box's inputs, the box can\�re", producing results on one or more outputs. Execution is lazy, evaluatingonly what is required to produce the demanded visualization.A box input or output may be a scalar value (e.g., a runtime parametersupplied by the user) or a displayable, described below. Displayables de�ne vi-sualizations. Most Tioga-2 boxes compute displayable outputs from one or more

displayable inputs. Tioga-2 has three displayable types: extended relations, com-posites, and groups.The �rst displayable type is an extended database relation R. In Tioga-2,the visualization of R is de�ned by R's attributes. Intuitively, R \knows" howto display itself. We assume an object-relational DBMS in which a relation hasstored attributes as well as methods de�ning additional attributes. For eachtuple t of R, location attributes de�ne the position of t on the screen and adisplay attribute de�nes the screen representation of t. Tioga-2 visualizations areconstructed \tuple-wise"|the visualization R is the sum of the visualizations ofeach tuple of R.Every visualization has at least the two screen dimensions and a representa-tion for every tuple. Therefore, an extended relation has at least x and y locationattributes, corresponding to the two screen dimensions, and an attribute display.A relation R may have additional location attributes; the dimension of R is thenumber of R's location attributes. A relation may also have multiple displayattributes de�ning alternative representations of the data. We adopt a uniformnotation and write t:l to denote attribute l of tuple t, whether l is a stored orcomputed attribute. We stress that the location and display attributes used tode�ne visualizations are computed attributes and are not stored in the database.The second displayable type is a composite of relations C = Composite(R1; : : : ;Rn). A composite visualization is the overlay of the composite's components|the visualizations are simply superimposed. Thus, composites provide a way tocombine visualizations of di�erent relations in the same viewing space.The third type of displayable is a group of compositesG = Group(C1; : : : ; Cn).A group visualization is the visualization of each of the composites Ci arrangedeither side-by-side, top-to-bottom, or in a tabular fashion according to the user'sspeci�cation. Groups allow visualizations of di�erent viewing spaces to be com-bined. To render Group(C1; : : : ; Cn), a viewer displays each of the Ci in thespeci�ed layout. The viewer has a position for each of the n displayables|theuser may independently pan and zoom in each of the grouped visualizations.In summary, there are three kinds of displayable types, described as follows:G = Group(C1; : : : ; Cn)C = Composite(R1; : : : ; Rn)R = relations with attributes x; y; displayMany Tioga-2 operations presented in subsequent sections are de�ned onlyfor R or C inputs. To make programming easier, Tioga-2 extends such operationsto work on \higher" types. For example, theRestrict operation �lters a relation;it is a box that takes an R input and produces an R output. Given a group Ginput toRestrict, Tioga-2 asks the user for the composite within the group, andthe relation within that composite, to which the Restrict applies. After applyingthe Restrict to the selected relation, Tioga-2 reassembles the composite andthe group in the obvious way. This is all done graphically with point-and-clickoperations, so that the user need not be aware explicitly of how Restrict isoverloaded to work on group and composite displayables.

Displayable types are translated into screen output by viewer boxes. If ann-dimensional relation R is the input to a viewer, then the viewer has an n+ 1-dimensional position specifying the location of the viewer for each of the n di-mensions and the elevation. The user controls the position by panning in the nviewing dimensions and by zooming, which changes the elevation, moving theuser \closer to" or \further from" the data. A viewer displays the x and y di-mensions of R on the 2-D canvas; the remaining n�2 dimensions are available assliders. If R has location attributes x; y; l1; : : : ; ln�2 each tuple t of R is renderedby drawing t:display at position ht:x; t:y; t:l1; : : : ; t:ln�2i in n-space. Because avisualization space may be larger than the canvas, the viewer �lters tuples tothe ranges speci�ed by the sliders for dimensions l1; : : : ; ln�2, �lters tuples to thevisible area on the screen for dimensions x and y, and then renders the tuples'display attribute to the screen.3 User InterfaceThe Tioga-2 user interface contains several main windows. All may be visibleon the screen or iconi�ed. There is a single user interface both for building andfor using programs, but a user browsing a previously constructed visualizationwill not require all of the windows available. A screen dump of the interface isshown in Figure 1. The user interface windows are: a program window, containinga boxes-and-arrows representation of a Tioga-2 program, a canvas window foreach viewer in the current program, and a menu bar containing the pull-downmenus to invoke primitive operations.A canvas window shows data visible in a viewer at the current position. Inaddition, each canvas window includes: a rear view mirror, zero or more sliderbars, an elevation map, and an elevation control (a dashed line through theelevation map).The menu bar includes menus of all operations, tables, and boxes available,an undo button to undo the last operation performed, and a help button.A Tioga-2 program is constructed incrementally by applying program editingoperations to the program window (thereby modifying the boxes-and-arrows di-agram) and rendering and/or drill down operations to a canvas window (therebymaking modi�cations via direct manipulation). At any stage in the constructionof a program the current result is displayed on all non-iconi�ed canvases.Since a canvas may be much larger than the available screen real estate, weallow the user to change the viewer's position, altering the area visible in theviewer. Scroll bars control panning in the screen dimensions x and y; canvasslider bars control panning in any remaining dimensions. The elevation controlallows the user to drill down into data displayed on the screen. Elevation mapsare an interface for programming drill down (Section 6).

4 Program and Data Management OperationsThis section discusses the operations available in the programwindow and Tioga-2's database operations. These operations allow the incremental construction ofa boxes-and-arrows program specifying data the user wishes to visualize. Op-erations for constructing visualizations themselves are discussed beginning inSection 5.We use the following example to illustrate Tioga-2 programming. An agri-cultural specialist wishes to construct a visualization of temperature and precip-itation data for various sites in Louisiana. The data is stored in two relations:Stations, which contains a tuple describing each weather station, and Obser-vations, which contains all observations (e.g., date, time, conditions) from allstations. The data covers all of North America and contains a great deal ofinformation besides temperature and precipitation.As a �rst step toward constructing a temperature and precipitation visualiza-tion for Louisiana, the user limits the Stations relation to the stations of interest.For every relation known to the Tioga-2 system there is a box of the same namethat takes no inputs and produces as output the tuples of the relation. Beginningwith the Stations box, the user incrementally adds boxes to perform standarddatabase operations such as restricting the data to tuples satisfying a predicate(e.g., stations in Louisiana) and projecting out unneeded �elds (e.g., date ofconstruction). Figure 1 shows a boxes-and-arrows diagram and canvas. The lastbox in Figure 1 is a viewer, which in this case displays data using a default two-dimensional table format. The user can also inspect any of the partial results.If the user discovers that any step produces unexpected results, he can inspect,delete, and replace boxes as necessary to �x the program.For convenience, the operations in this section are subdivided into operationsthat manipulate program structure and database operations.4.1 Program OperationsThis group of primitives permits the initialization, loading, and saving of pro-grams, as well as the deletion, insertion, and connection of boxes into an existingprogram. There are also primitives that provide familiar language abstractionsanalogous to procedures and macros. The operations are listed in Figure 2; webrie y discuss the most interesting.If the user clicks on one or more edges in the current program, Apply Boxgives the user a menu of all boxes whose inputs match the types of the selectededges. This is a shorthand way to identify those boxes in the database that couldpossibly take the indicated edges as input.A design principle of Tioga-2 is that every operation preserves a visual repre-sentation. The thesis is that users are most likely to understand their programsand recognize errors if the results of every small, incremental change can be visu-alized and inspected. Deleting boxes from a program is dangerous, because inputsof other boxes may be left dangling and, therefore, their results unavailable forvisualization. To preserve the property that \everything is always visualizable",

arbitrary box deletions are not allowed in Tioga-2. A box may deleted if it hasno outputs connected to other boxes (in which case no box inputs are left dan-gling), or if it has a single input and output of the same type (in which case thesystem connects the deleted box's predecessor to its successor). A box may alsobe Replaced by another box with compatible types.A T box simply passes its input unchanged to both outputs, and allowsanother box, for example a viewer, to be connected to the T.Encapsulate permits the user to de�ne new boxes. The user speci�es aportion of the program to be encapsulated by drawing a closed curve around aregion of the program. Edges cut by the curve are the inputs and outputs of thenew box. The new box may be used like any other primitive box.Encapsulated boxes may also be parameterized to create something akin toa macro or (more accurately) a higher-order function. The user draws additionalclosed areas within the program region to be encapsulated. These areas become\holes"|they are not included in the encapsulated box, and edges cut by a holeare unconnected. To use an encapsulated box with holes, the user must specifya box|with compatible types|that can be plugged into each hole.Operation E�ectNew Program Erase the program canvas.Add Program Add a named program to the program canvas.Load Program Shorthand for New Program followed by Add Program.Save Program Save the current program in the database.Apply Box see discussionDelete Box see discussionReplace Box Replace one box by a di�erent box with compatible types.T Add a T-node to a designated edge.Encapsulate see discussionFig. 2. Operations that manipulate the boxes-and-arrows diagram.4.2 Database OperationsThe primitives in this group provide database operations, which are listed inFigure 3. Each operation adds a new box to the program. The type of the intro-duced box is indicated in Figure 3. Note that all input/output types are R. Asdiscussed in Section 2, these operations are extended to apply to composite (C)and group (G) types as well.As mentioned above, the Add Table operation adds a new \source" box tothe current program. The box is named for a table in the database and has asingle output edge. The parameters of many Tioga-2 operations can be speci�edin several ways; usually there is at least one textual and one graphical method.For example, the user may specify the table to add to the program by either

typing the name or selecting it from a menu of available relations. Note thatAdd Table is a special case of Apply Box with zero inputs.ARestrict box �lters its input, retaining only tuples that satisfy a restrictionpredicate. The user is prompted for the predicate to be applied. A Samplebox produces a random subset of an input relation on its output. Each inputis retained with a user-speci�ed probability. Sample is useful for improvinginteractive response by reducing the size of data sets to be processed.Operation Box Type E�ectAdd Table ; ! R Add the box producing a speci�ed relation as output.Project R! R0 Standard database projection;user is prompted for �elds.Restrict R! R Filter a relation to tuples satisfying a predicate.Sample R! R Randomly sample a relation.Join R� R0 ! R00 Standard join of two relations;user is prompted for join predicate.Fig. 3. Operations on relations.The result of applying these operations is to iteratively build up a boxes-and-arrows program in the program window. We now turn to the visualizationof the result of such programs.5 Rendering OperationsThe previous section has indicated how a Tioga-2 program can be built to re-trieve complex computations (relations) from the database. Now we must dealwith two additional questions:{ How are tuples positioned on the canvas?{ How are tuples rendered as screen pixels?As discussed in Section 2, these questions are addressed by location attributesspecifying the position of tuples in n-space and display attributes that spec-ify tuples' screen representations. This section describes location and displayattributes, default displays, and their associated operations.5.1 Location and Display AttributesFigure 4 shows a visualization of the Louisiana weather station data producedby the diagram shown in Figure 1. Each station in the state is represented byone tuple in the relation. The visualization shows a circle and the name ofeach station at its (longitude, latitude) coordinate. To position representations

Fig. 4. A visualization of weather station locations.of tuples on the screen, relations have location attributes. Every relation musthave x and y location attributes to specify the x and y dimensions of a 2-Dcanvas; in Figure 4, the x dimension is longitude and the y dimension is latitude.There may be additional location attributes, which specify slider dimensions. InFigure 4, there is a slider dimension Altitude. By setting the range of altitudevalues that are visible using the slider, the user can see any appropriate subsetof the stations. Location attributes are represented by oating point numbers.Tioga-2 requires that every relation have at least one display attribute. A
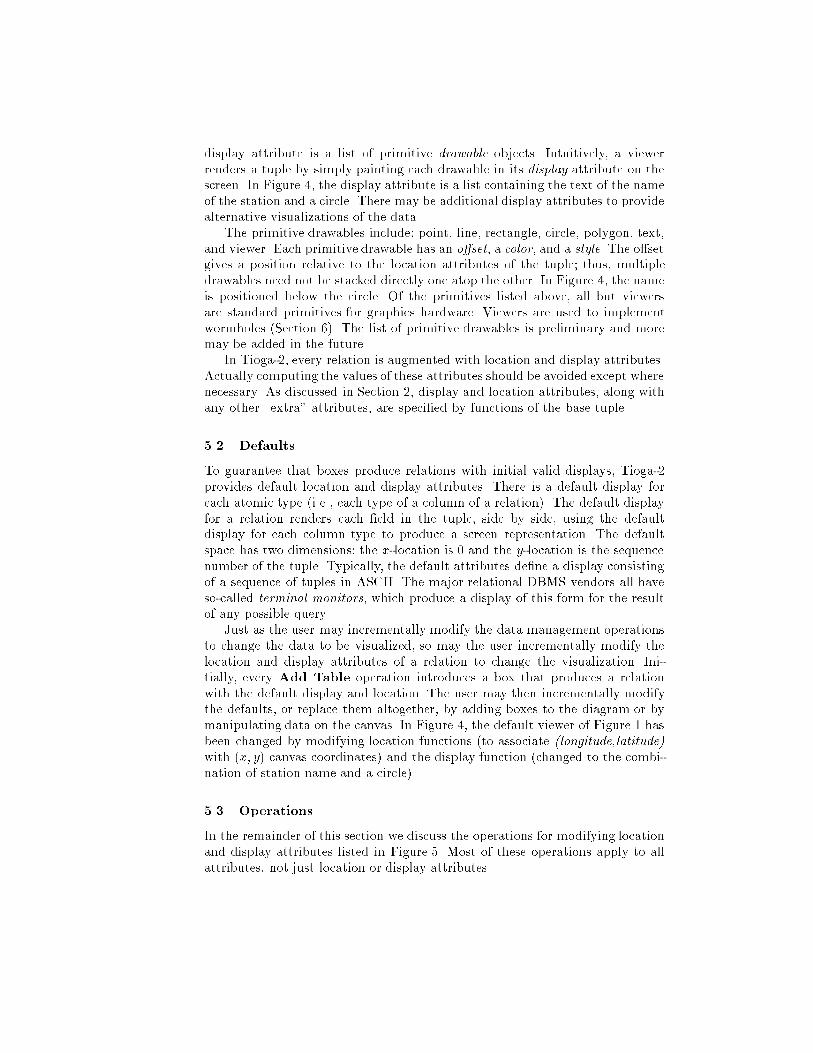
display attribute is a list of primitive drawable objects. Intuitively, a viewerrenders a tuple by simply painting each drawable in its display attribute on thescreen. In Figure 4, the display attribute is a list containing the text of the nameof the station and a circle. There may be additional display attributes to providealternative visualizations of the data.The primitive drawables include: point, line, rectangle, circle, polygon, text,and viewer. Each primitive drawable has an o�set, a color, and a style. The o�setgives a position relative to the location attributes of the tuple; thus, multipledrawables need not be stacked directly one atop the other. In Figure 4, the nameis positioned below the circle. Of the primitives listed above, all but viewersare standard primitives for graphics hardware. Viewers are used to implementwormholes (Section 6). The list of primitive drawables is preliminary and moremay be added in the future.In Tioga-2, every relation is augmented with location and display attributes.Actually computing the values of these attributes should be avoided except wherenecessary. As discussed in Section 2, display and location attributes, along withany other \extra" attributes, are speci�ed by functions of the base tuple.5.2 DefaultsTo guarantee that boxes produce relations with initial valid displays, Tioga-2provides default location and display attributes. There is a default display foreach atomic type (i.e., each type of a column of a relation). The default displayfor a relation renders each �eld in the tuple, side by side, using the defaultdisplay for each column type to produce a screen representation. The defaultspace has two dimensions: the x-location is 0 and the y-location is the sequencenumber of the tuple. Typically, the default attributes de�ne a display consistingof a sequence of tuples in ASCII. The major relational DBMS vendors all haveso-called terminal monitors, which produce a display of this form for the resultof any possible query.Just as the user may incrementally modify the data management operationsto change the data to be visualized, so may the user incrementally modify thelocation and display attributes of a relation to change the visualization. Ini-tially, every Add Table operation introduces a box that produces a relationwith the default display and location. The user may then incrementally modifythe defaults, or replace them altogether, by adding boxes to the diagram or bymanipulating data on the canvas. In Figure 4, the default viewer of Figure 1 hasbeen changed by modifying location functions (to associate (longitude,latitude)with (x; y) canvas coordinates) and the display function (changed to the combi-nation of station name and a circle).5.3 OperationsIn the remainder of this section we discuss the operations for modifying locationand display attributes listed in Figure 5. Most of these operations apply to allattributes, not just location or display attributes.

Operation Box Type E�ectAdd Attribute R! R0 Add an attribute to a relation;user is prompted for de�nition.Remove Attribute R! R0 Remove an attribute;cannot remove attributes x, y, or display.Set Attribute R! R0 Change the value of an existing attribute.Swap Attributes R! R0 Interchange two attributes.Scale Attribute R! R0 Multiply numerical attribute by a number.Translate AttributeR! R0 Add a number to a numerical attribute.Combine Displays R! R0 Combine two display attributes.Fig. 5. Location and display operations.The user may add new attributes, including new location and display at-tributes. Adding a location attribute adds a new dimension to the visualization.Adding a display attribute creates an alternative visualization of the data. AddAttribute prompts for the type and de�nition of the new attribute; the de�ni-tion may depend only on other attributes of the relation. Set Attribute changesthe type and de�nition of an existing attribute.In both Add and Set Attribute, an attribute's de�nition may be given ina general query language. However, the preferred method is to begin with a verysimple de�nition (e.g., a copy of another �eld, or a single primitive drawable)and then re�ne it using the other operations.Swap Attributes is handy for interchanging two dimensions (two locationattributes), thereby \rotating" the canvas, or interchanging the display attributewith one of the alternative displays, thereby changing the visualization of thedata.Scale and Translate Attribute are de�ned only for numeric �elds. Theseoperations are convenient shorthands for more complex Set Attribute com-mands.Scale and Translate are useful for changing location attributes, therebyscaling or translating dimensions of a visualization.Combine Display is the mechanism for combining primitive drawables toform more complex displays. The user positions the displays on top of one an-other graphically to establish the relative position; alternatively, an explicit o�setof one display to the other can be entered. The combined display becomes a newdisplay attribute. The user may combine any of the display attributes of therelation. In Figure 4, a circle display has been combined with a text displayshowing the name of the station.6 Drill DownDrill down allows users to see more details in data of interest. There are twodistinct, useful notions of drill down. The �rst provides a more re�ned view ofthe same data in the same visualization space (e.g., switching from a state to a

Operation Box TypeSet Range R! ROverlay Composite(R1; : : : ; Rn) �Composite(Rn+1; : : : ; Rm)!Composite(R1; : : : ; Rm)Shu�e Composite(R1; : : : ; Ri�1; Ri; Ri+1; : : :)!Composite(Ri; R1; : : : ; Ri�1; Ri+1; : : :)Fig. 6. Primitives for drill down.county map). The second allows movement between one space and a di�erent,but semantically related, space (e.g., after �nding a weather station, switch tolook at its temperature/precipitation data).Two mechanisms provide drill down in Tioga-2. First, the user can specifythat additional detail about screen objects becomes available as the user zoomsin. Second, we have a notion of wormholes, by which a user can move from onecanvas to another canvas.6.1 Additional DetailThe �rst formof drill down is de�ned as operations on relationsR and compositesC. There are three operations:{ Set RangeThis operation speci�es the maximum and minimum elevations at which arelation's display is de�ned. Outside of this range, the relation contributesnothing to the canvas.{ OverlayTwo composites may be overlaid. The relative position of one overlay to an-other may be given either by an explicit n-dimensional o�set, or by draggingone canvas over the other. If the component displays are de�ned with di�er-ent elevation ranges, then it is possible to program drill down by having thedisplayable at the lower elevation provide a specialization of the displayableat the higher elevation.{ Shu�eIt may be desirable to change the drawing order of the relations withina composite. The Shu�e command moves a relation to the \top" of thedrawing order.Figure 7 illustrates overlay and setting ranges. Weather stations are nowshown together with a map of Louisiana; this is achieved by overlaying the map(derived from a relation of lines de�ning the map) with the result of Figure 4. Inaddition, a third display is overlaid to give less detail at higher elevations. Thisdisplay shows only a circle at the station's location. The programmer has set theranges of the two weather station displays so that station names disappear athigh elevations, where they would be illegible. The range of the Lousiana mapis all elevations (the default).

Fig. 7. Overlaid displays with restricted ranges.There is a small di�culty with the overlay in Figure 7. The visualization ofthe state map of Louisiana has no Altitude dimension, and such a dimensionmakes no sense for a at map. However, the composite has an Altitude slider;how are changes in Altitude to be interpreted for the Louisiana map? If the userattempts to overlay relations with di�erent dimensions, Tioga-2 warns about themismatch. If the user wishes, the underlying relations are treated as invariantin the \extra" dimensions. This achieves the desired e�ect in Figure 7: the usercan change the Altitude slider to see di�erent subsets of the stations, but the

Louisiana map remains in place for reference.The elevation map is a bar-chart display of the maximum/minimum eleva-tions and drawing order of all elements of a composite on the current canvas (seeFigure 7). The elevation map can be manipulated directly by the user to adjustthe ranges and drawing order of overlaid relations. For a group displayable, aviewer shows an elevation map for only one member of the group at a time. Inthis case, the user can explicitly cycle through all of the elevation maps.6.2 WormholesIt is often desirable to associate objects in one visualization space directly withobjects in a di�erent visualization space. A wormhole is a viewer onto anothercanvas, i.e., what is visible inside a wormhole is a point on another canvasfrom some elevation. Figure 8 shows an example application of wormholes. Uponzooming into an individual station s, a wormhole appears (achieved by a com-bination of modifying display functions and overlaying and setting ranges) thattakes the user to a canvas displaying temperature data for each station as afunction of time. The user is initially positioned viewing the data for station s.Providing wormholes is technically straightforward. Viewers are primitivedrawable objects; thus, Tioga-2 programs may produce displays containing view-ers (wormholes). A viewer drawable requires several parameters, including thesize for the viewer, a destination canvas, the elevation from which the canvasis viewed, and the initial location; the user de�nes these values as part of thedisplay attribute. As with any drawables, wormholes can be overlaid with otherdrawables. In Figure 8, the axes labels are the result of overlaying text at ano�set from the wormhole (for brevity, these boxes are not shown).When a user zooms in on a wormhole and reaches zero elevation he passesthrough the wormhole and moves from the original canvas to the destinationcanvas. Needless to say, the user can pan and zoom on this second canvas, aswell as move to a third canvas. After changing canvases several times, there is ade�nite possibility the user will get lost. For this reason, we introduce the notionof a rear view mirror.6.3 Rear View MirrorsFor each canvas, we introduce an additional window called a rear view mirror.This window shows the \bottom side" of the canvas through which the user lastmoved. Hence, immediately after going through a wormhole, the user is lookingdown at a new canvas from some speci�c elevation and is at negative groundlevel for the canvas he just left. As the user descends toward the new canvas, thedistance from the previous canvas increases. In Figure 9, the rear view mirrorshows that the user came through the wormhole at New Orleans in Figure 8.Every Tioga-2 displayable has a minimum and maximum elevation. If bothare positive, then the viewer only shows objects on the top side of the canvas.If the minimum and maximum elevations are both negative, then the viewerplaces objects only on the underside of the canvas, and they are visible only in

Fig. 8. A visualization with wormholes.the rear view mirror after the user proceeds through a wormhole. If the minimumelevation is negative and the maximum is positive, then the objects can be seenon both sides of the canvas. Thus, the programmer can create overlays in such away that the top side and the underside of the canvas both have meaning. Oneis visible from above in the viewer window and one is visible from below in therear view mirror.A natural use of the rear view mirror is to illuminate the wormholes back tothe canvas from which the user came to this canvas. In this way, the user can

\�nd the way home" if he is lost. As such, the rear view mirror is a generalizationof the notion of \back" in a hypertext system.7 Additional OperationsThis section discusses the remaining Tioga-2 features, with the exception of up-dates (Section 8) and a few user-interface features discussed in Section 9. Slavingconstrains two viewers to move together. Magnifying glasses provide hierarchi-cal viewers (viewers within viewers). As discussed below, magnifying glasses arequite di�erent from wormholes. Stitch and replicate produce group displays. Slav-ing and magnifying glasses are operations on viewers, while stitch and replicateare operations on displayables.7.1 SlavingTwo viewers may be slaved together, in which case the system maintains therelative o�set between the two viewers. When a viewer is deleted, all of itsslaving relationships are also deleted. Slaving is only de�ned for two viewerswith the same dimensions.7.2 Magnifying GlassesA user may create a magnifying glass by placing a viewer inside another viewer.Typically, a user places a copy of the current viewer inside itself and then zoomsthe inner viewer to magnify what is in the outer viewer. A magnifying glass musthave the same dimensions as its containing viewer. The inner and outer viewersmay be slaved; magnifying glasses may also be deleted.A simple technique for correlating temperature and precipitation uses a mag-nifying glass in Figure 9. The user begins with a temperature vs. time display.The underlying relation that is being visualized has more information|in par-ticular, the precipitation data|that is not being utilized. An alternative displayattribute shows precipitation vs. time (the boxes de�ning the precipitation dis-play are not shown). By creating a magnifyingglass using this alternative display,the user sees the precipitation data for points underneath the magnifying glass.In Figure 9, the magnifying glass is realized by making the precipitation displaythe display attribute (done by the Swap Attribute box) and then viewing theresult.7.3 StitchAny number of composites can be stitched to form a group displayable. Groupscan be displayed side-by-side, arranged vertically, or laid out in a tabular fashion.If the user performs a window operation on one of the group members, such asmoving the window on the screen or iconifying it, then the same operation isperformed on the other members. Zooming and panning is de�ned for each of

Fig. 9. Using a magnifying glass.the constituent displays. That is, there is a separate focus for all components, aswell as separate x, y, slider, and zoom dimensions. Components may be slaved.In Figure 10, a display showing temperature vs. time is stitched to a dis-play showing precipitation vs. time. The precipitation display is slaved to thetemperature display, so that whenever the user changes the date range undertemperature, the precipitation display changes to display the same date range.

Fig. 10. An example of stitched viewers.7.4 ReplicateA relation can be replicated by specifying a partition. Replicated displays foreach partition are stitched together into a group. The user must specify the areato be given to each display and the initial point of focus.The partitioning predicate is speci�ed by giving a collection of predicates inthe underlying query language or an enumerated type. For example, the spec-i�cation may be that replication is tabular, with predicates salary � 5000and salary > 5000 in the horizontal dimension and the enumerated type

department in the vertical dimension.In Figure 11, a viewer showing temperature vs. time and precipitation vs.time has been replicated to show records for years prior to 1990 and after 1990separately. This example motivates the need for operator overloading discussedin Section 2. Because Replicate partitions a relation, it takes an R as inputand produces multiple R's as output. However, in this example the display is aG type (a group of two displays). Thus, before the replication can be performed,the user must specify the relation. When the user selects Replicate, the systemprompts the user for the group component on which the replication is to be done.8 Updates in Tioga-2Tioga-2 is oriented toward browsing a database. As such, we expect users towander around a canvas and possibly notice things they wish to update. Forexample, the quantity on hand of speci�c items could appear on a canvas. Theuser would �nd an item of interest and then wish to order a certain number of theitem, thereby decreasing the quantity on hand. The user could also notice dataerrors and simply wish to �x them. As a result, we focus on providing an updatecapability that allows speci�c screen objects to be updated in the database. Wedo not consider general SQL update statements in Tioga-2.For each primitive type, the type de�ner is required to implement a defaultdisplay function that is used by Tioga-2 to render tuples containing this type.Similarly, we require the type de�ner to write a second update function thatenables Tioga-2 to provide updates for instances of the type that appear onthe screen. When a user clicks on a screen object, the Tioga-2 run time systemactivates a generic update procedure, passing it the tuple corresponding to thescreen object. The function engages a dialog with the user to construct a newtuple|using the primitive update functions for the �elds|and then performan SQL update to install the new value in the database. This machinery is allencapsulated within the update function itself.When the user customizes a visualization, he can replace the default updatecommandwith one of his own choosing, if he so desires. In this way, he can makean update system with a desired \look and feel".9 ImplementationIn this section we discuss brie y how the design is evolving to address issuesencountered during implementation. The changes described here result from ob-servations about how users progressively render data in a multi-dimensionalspace. The changes include a paint program window to provide more intuitiverendering and two new object types for displaying objects that are not associatedwith database data.The current implementation of Tioga-2 is being developed on DEC Alphaworkstations using Postgres95 for the database engine, Tcl/Tk for the boxes-and-arrows editor, and OpenGL for the 3D graphic visualization.

Fig. 11. A replicated viewer.9.1 Overall DesignTioga-2 is currently being constructed as four major modules:{ a boxes-and-arrows editor for data programming (Section 4),{ a new paint program window for rendering display attributes and specifyingwormholes (Sections 5 and 6.2),{ a composite and group editor for additional operations (Section 7),{ and a menu bar.

The boxes-and-arrows editor is very similar to the one reported in [12] and isnot discussed here. The paint program implementation is largely complete, withthe exception of wormholes, and is described in Sections 9.2{9.5. The compositeand group editor is not yet implemented and is not discussed.9.2 The Paint ProgramTo make rendering intuitive for the user of Tioga-2, an interface similar to thosein paint programs has been constructed. This window has a palette of displayableprimitive objects (point, line, rectangle, circle, polygon, and text) on the leftside of the screen.2 Like conventional paint programs, a displayable primitive isrendered by selecting that primitive from the paint palette and then placing itin the canvas window.The paint program includes a window that shows tuples from the visualizedrelation in the default format, constructed by converting all objects to a tex-tual representation. Postgres95 requires such a function for every valid type andTioga-2 simply uses it. Note that this display is in addition to any visualizationthe user constructs; thus, the Tioga-2 programmer can see both the visualizationand attribute values of sample tuples simultaneously. Access to the actual databeing visualized helps users quickly interpret unexpected results of incrementalchanges to a visualization. For example, suppose that weather station data is vi-sualized using a rectangle whose height is set to an attribute representing averageannual rainfall. If the relation is �ltered to include only stations in the world'sdriest areas, then the height of each rectangle may be zero. Upon noticing thatall displayed rectangles are, in fact, lines, the Tioga-2 programmer instantly cancheck the attribute values in the tuple window to con�rm that the correspondingattribute values indeed produce this result.9.3 Displayable ObjectsThe paint program can also draw displayables that are not associated with anytuple. These displayables are useful for \trim" such as borders, titles, companylogos, etc. Semantically, these displayables are objects associated with an overlay.We introduce two such types of objects: static and sticky (a term borrowed fromthe Pad project [8]).An example static object is a scale for the (x; y) dimensions with tick markson the axes. These objects are static because they have constant position in the(x; y) dimensions. Panning and zooming of a static object has the same visuale�ect as panning and zooming in the rendered data.An example sticky object is a window title. The object sticks to a particularposition in the window and does not have an (x; y) position. As such, panninghas no e�ect on a sticky object. Zooming on a sticky object produces a screenrepresentation so long as the sticky object's overlay is visible at a particularviewing elevation.2 Thus, the appearance of the current interface has evolved to look somewhat di�erentfrom the screenshots shown in this paper.

9.4 Dimensia DisorientationEarly in our implementation e�orts we noticed an unanticipated problem: certainoperations could leave the Tioga-2 user suddenly visualizing a region with nodata in it, resulting in a blank screen. The most important case arises when theuser changes the dimensions of the visualization space. For example, supposethat employee tuples are being viewed and the �elds are salary, name and age.Further suppose that the tuple (10000; john; 18) appears on the screen and thatthe x dimension is set to the salary attribute (i.e., the x location of theviewer is approximately 10,000). Now suppose that the programmer changes thex dimension to age. In all likelihood the tuple disappears from the viewer|infact, all data disappears from the viewer|and the Tioga-2 programmer su�ersfrom dimensia disorientation.To allow the user to keep the focus of a visualization in an area of inter-est when performing dimension operations, we have added sticky tuple mode toTioga-2. This mode ensures that a particular tuple remains on the screen whenthe dimensions of the visualization space are altered.9.5 Painting DisplayablesA Tioga-2 visualization of a relation is the sum of the visualizations of each tupleof the relation. Each time the programmer modi�es the display it is potentiallynecessary to recalculate the visualization of each tuple of the relation. Thisis especially expensive when the user is actively modifying the visualizationinstead of simply browsing|in this case the underlying relation and the desiredvisualization may both change.To make visual programming as interactive as possible, we have added onetuple mode, a restriction of sticky tuple mode. In this mode, only the single stickytuple appears on the screen and, therefore, the screen can be painted withoutaccess to the database. The user edits the visualization of the single exampletuple to his liking and then switches to viewing the entire relation to con�rmthat the visualization is as desired.The sticky tuple is speci�ed by the programmer by selecting an example tuplein the default data window and then clicking on a One Tuple Mode button inthe paint program.10 Future WorkTioga-2 raises several interesting issues that we plan to address in future work.A few of these problems are discussed brie y in this section.10.1 Caching Data vs. Caching GraphicsTioga-2 is designed for visualizing large databases, and thus not all data canbe held in memory at any one time. For this reason, and because browsing has

locality (i.e., panning and zooming move to nearby points in the viewing space),caching both the database data that is being graphically represented as wellas the actual graphical representation appears to be bene�cial. However, giventhat there is limited space available for all caches, any space used for cachingdata is not available for caching graphics and vice versa. This is not a trivialoptimization problem because the graphical representation is typically muchlarger than the data representation. As a result the graphical coverage will likelybe much smaller than the data coverage; on the other hand, fast response time topanning operations is only possible with a graphical cache. We expect to explorethese multi-cache issues in detail.10.2 SamplingWhen programming a visualization from a very large data base, it may be desir-able to construct a visualization for a random sample of the data. In this way, theprogrammer can move from initial rendering to a �nal product on a small dataset. Only when he is satis�ed with the result should he move to execution onthe complete data set. Hence, a possible extension (or alternative) to Tioga-2's\one tuple mode" is the seamless integration of random sampling.10.3 ClutterIn many cases data is very non-uniform when placed on the canvas. For example,if the population of the United States is rendered at the (x; y) coordinates ofeach citizen's home address, then the spacing appropriate in Montana yieldsincredible clutter in New York City. Conversely, a spacing appropriate in NewYork City places people much too far apart in Montana. We plan to search forsolutions to the problem of intelligently displaying non-uniform or \cluttered"data.10.4 Foreign SystemsIt is possible that a Tioga-2 application would entail some browsing of a can-vas, along with the display of reports, spreadsheets, and forms. How Tioga-2should interact with other subsystems, such as spreadsheets, is a topic for futureinvestigation.11 Related WorkWhile developing browsers for exploring data is a relatively new research area,the literature is already substantial. This section surveys a cross-section of re-lated work.As discussed in Section 1, Tioga-2 retains the boxes-and-arrows notation forprograms originally developed for data ow languages and popularized for vi-sualization by AVS [13], Data Explorer [7], and Khoros [9]. These systems are

similar to Tioga in their reliance on simplifying programming by using data owgraphs. Thus, these systems share Tioga's basic problem that boxes-and-arrowsnotation alone does not simplify programming su�ciently for novice program-mers (see Section 1.1). Weaves is another boxes-and-arrows system [3]. Weavesare intended to support visual programming, so the boxes-and-arrows program isitself the only visualization of interest. An extension of weaves supports limiteddrill down [5].Many browsing systems are based on a \paradigm". A classic example isthe Fisheye interface, which magni�es data in the center of focus to a greaterdegree than data at the periphery [10]. Another example is Magic Lenses, whichprovides a set of primitive lenses (windows akin to our magnifying glasses) thatcan be placed over data and over each other to modify a visualization [1]. Whilewe �nd paradigms appealing, we suspect a aw in the assumption that the spaceof possible visualizations can or must be greatly restricted in advance.3 In ourexperience, paradigms serve a class of users well and frustrate users with otherapplications. To be generally useful|as Tioga-2 aims to be|it is importantthat users be able to construct arbitrary ad hoc visualizations of their own, eveninventing their own paradigms if necessary. In short, visualizations should be asprogrammable as possible.A di�erent approach has been taken by the ambitious Pad project [8]. InPad, all data lives on a two-dimensional plane. As in our system, every entity (anobject in Pad, a tuple in Tioga-2) has a position and \knows" how to draw itself.Pad also provides facilities for overlay and drill down that are in some ways richerthan the facilities in Tioga-2. Pad allows a very large class of visualizations tobe built. However, Pad is not end-user programmable; it is designed as a toolkitfor expert programmers and provides a traditional programming interface.Within the area of browsers for databases, the work of Krishnamurthy andZloof on Rendering By Example (RBE) is closest to our own. In particular, RBEshares our view on the importance of a system that is both highly programmableand easy to program [6]. RBE provides a more declarative programming interfacethan Tioga-2, but RBE can construct a much less general class of visualizations.Finally, a database-centric visualization system raises the issue of how brows-ing queries are implemented with tolerable performance. This question is beyondthe scope of this paper; the interested reader is referred to [2] for related workon the optimization and e�cient implementation of browsing queries.12 ConclusionsWe are now hard at work implementing Tioga-2. An initial version of the systemis functional, and we expect to have a complete prototype by summer 1996. Weplan to systematically test the implementation on little programmers to ascertainwhether it lives up to its goals.3 In fairness, Magic Lenses is not intended strictly as a browsing paradigm, but as ageneral user interface paradigm.

References1. E. Bier, M. Stone, K. Pier, W. Buxton, and T. DeRose. Toolglass and magiclenses: The see-through interface. In Proc. of SIGGRAPH 1993, pages 73{80,Anaheim, CA, August 1993.2. J. Chen. Optimizing interactive browsing queries. Unpublished manuscript, Uni-versity of California, Berkeley, June 1995.3. P. Cox, M. Gorlick, and R. Razouk. Using weaves for software construction andanalysis. In Proc. of the 13th International Conference on Software Engineering,pages 23{34, Austin, TX, May 1991.4. Allen Cypher. Watch What I Do: Programming by Demonstration. MIT Press,Cambridge, MA, 1993.5. M. Gorlick and A. Quilici. Visual programming-in-the-large versus visualprogramming-in-the-small. In Proc. of the IEEE Symposium on Visual Languages,pages 137{144, St. Louis, MO, October 1994.6. R. Krishnamurthy and M. Zloof. RBE: Rendering by example. In Proc. of the 11thInternational Conference on Data Engineeering, pages 288{297, Taipei, Taiwan,March 1995.7. B. Lucas, G.D. Abram, N.S. Collins, D.A. Epstein, et al. An architecture for ascienti�c visualization system. In Proc. of the IEEE Visualization Conference,pages 107{114, Boston, MA, October 1992.8. K. Perlin and D. Fox. Pad: An alternative approach to the computer interface. InProc. of SIGGRAPH, pages 57{64, Anaheim, CA, August 1993.9. J. Rasure and M. Young. An open environment for image processing softwaredevelopment. In Proc. of the SPIE Symposium on Electronic Image Processing,pages 300{310, San Jose, CA, February 1992.10. M. Sarkar and M.H. Brown. Graphical �sheye views. Communications of theACM, pages 73{84, December 1994.11. M. Stonebraker, R. Agrawal, U. Dayal, E. Neuhold, and A. Reuter. DBMS re-search at a crossroads: The Vienna update. In Proc. of the 19th InternationalConference on Very Large Data Bases, pages 688{692, Dublin, Ireland, August1993.12. M. Stonebraker, J. Chen, N. Nathan, C. Paxson, and J. Wu. Tioga: Providingdata management support for scienti�c visualization applications. In Proc. of the19th International Conference on Very Large Data Bases, pages 25{38, Dublin,Ireland, August 1993.13. C. Upson et al. The application visualization system. IEEE Computer Graphicsand Applications, 9(4):30{42, July 1989.14. A. Woodru�, P. Wisnovsky, C. Taylor, M. Stonebraker, C. Paxson, J. Chen, andA. Aiken. Zooming and tunneling in Tioga: Supporting navigation in multidi-mensional space. In Proc. of the IEEE Symposium on Visual Languages, pages191{193, St. Louis, MO, October 1994.This article was processed using the LaTEX macro package with LLNCS style