the timing of asset sales: evidence of earnings management?poitras/jbfaf.pdf · the timing of asset...
TRANSCRIPT
The Timing of Asset Sales:Evidence of Earnings Management?
1. Introduction
Do firms attempt to manage reported earnings through the timing of asset sales? Because asset sales
have important economic, as well as accounting, motivations, the answer to this question is not straight
forward. While it is possible to manage accounting earnings through selective timing of the period in which
an asset is sold, the motivation for this type of activity may be small relative to economic factors motivating
asset sales, such as the changing market valuation of assets (Slovin et al., 1995) or operating performance
considerations (John and Ofek, 1995). Hence, in order to detect any earnings management features of an
asset sale it is necessary to provide an explanation for the economic aspects of the asset sale as well as the
associated incentive for management of reported earnings. In other words, there is a joint hypothesis involved
in empirical tests of whether asset sales have an earnings management motivation. Due to the presence of
a joint hypothesis, if earnings management is detected it will not typically be possible to identify whether the
earnings management aspect was a primary or secondary motive for the asset sale. Similarly, if earnings
management is rejected, this could be due to poor specification of the economic motives for the asset sale and
not necessarily evidence against an earnings management element in asset sales.
Bartov (1993), the first significant study directly concerned with the earnings management implications of
asset sales, examined the timing of asset sales and presents evidence from a sample of publicly traded U.S.
firms in favour of the hypothesis that "...managers take advantage of the acquisition-cost principle to
manipulate earnings" (p.84). A primary objective of this study is to verify whether a similar result holds for
a sample of publicly traded Singaporean firms. In the process, this paper discusses a number of substantive
differences between the sample used in this study and in Bartov. One important difference in institutional
arrangements is the discretion provided under Singapore’s GAAP to revalue assets and to take advantage
of the opportunity to transfer any balance remaining in revaluation surplus on sale of previously revalued
2
assets either to current income or to retained earnings. Such opportunities are not available to U.S. firms.
In this vein, Black, Sellers and Manly (1998) examine a sample of Australian, New Zealand and UK firms
and find that Bartov’s results do not extend to cases where firms have discretion to revalue the carrying
amount of assets without having to resort to timed asset sales to impact earnings. As Singapore uses a similar
accounting treatment, results similar to Black, Sellers and Manly are expected. In addition, there are other
differences between the Bartov sample and the sample of firms used in this study that also indicate there will
be only a limited degree of similarity in the results. As a consequence, the motivation, analysis and
conclusions provided in this study can be viewed as providing additional insight into whether there is an
earnings management aspect to asset sales and not as an attempt at verifying and replicating Bartov (1993).
The next section provides a literature review and a discussion of some relevant background issues. Section
three discusses differences in accounting rules between the Singaporean and U.S. jurisdictions, and examines
the financial statement impact insofar as it is relevant to understanding the results and implications of this
study. Section four reviews the sample characteristics and develops the theoretical arguments underlining
the earnings management hypotheses tested in this paper. This section explicitly states the specific empirical
tests for these hypotheses and discusses possible theoretical limitations. Section five presents the empirical
results. Both univariate and multivariate tests are used to test the relevant hypotheses. This section presents
empirical evidence is in favour of earnings smoothing by firms with decreasing earnings-per-share. The final
section summarizes the results.
2. Background and Literature Review
What are the incentives for firms to manipulate or manage earnings? Jiambalvo (1996) maintains that
various types of explicit and implicit contracts between stakeholders and the firm create incentives for
management to manage earnings. He lists seven different types of incentives, from debt covenants and
compensation contracts to the desire for external financing. At least two of the seven incentives listed by
3
Jiambalvo are relevant to this study: the desire for external financing; and, stakeholder costs associated with
implicit contracts. Incentives arising from stakeholder costs are associated with the role of reported earnings
in assessing the ability of the firm to honour implicit claims, such as warranties, employment contracts, use
of trade credit and so on. Controlling for traditional earnings management incentives such as debt covenant
restrictions and bonus compensation provisions, Bowen, DuCharme and Shores (1995) find that "for annual
samples of 1,342 to 2,908 firms implicit claims variables explain 10 percent to 15 percent of the variation in
the choice of accounting methods for inventory and depreciation" (Jiambalvo, p.39).
The desire to obtain external financing at the most favourable terms is another relevant incentive for
earnings management. More precisely, assets sales can provide an important alternative to external financing
as a source of funding for firm activities. Using a sample of firms subject to enforcement actions by the SEC,
Dechow, Sloan and Sweeney (1995, p.1) present evidence that "an important motivation for earnings
manipulation is the desire to attract external financing at low cost". Furthermore, one important characteristic
identified by Dechow et al.(1995) and Carlson and Bathala (1997) as typical of firms that manipulate earnings
is that such firms tend to be closely held, an ownership feature common to Singaporean firms. However,
there is also mixed evidence on the extent to which external financing does provide a general incentive for
earnings management. For example, Aharony, Lin and Loeb (1993) examine earnings reporting prior to initial
public offerings and find little evidence of earnings manipulation.
In addition to these general types of earnings management incentives, a number of other factors can also
influence the earnings management decision. Recent studies include Kinnunen et al. (1995) where earnings
management behaviour is found to differ across industries. Working with a sample of firms from industries
with high ratios of accounts receivable to total assets and bad debt expense to net income (publishing, business
services, and nondurable wholesalers), McNichols et al. (1988) also present evidence that earnings
management behaviour will differ across industries. Dechow et al. (1995) examine the general issue of
4
testing for earnings management behaviour and find that controlling for financial performance is important.
A key implication of these and other related studies (e.g., Burgstahler and Dichev, 1997) is that incentives
for earnings management tend to be asymmetric: firms with poor economic performance have greater, and
possibly different, incentives to manage earnings than firms exhibiting strong economic performance. In turn,
the ability of firms to engage in specific types of earnings management will depend on constraints imposed
by the type of economic activity in which the firm is involved.
This study examines the possibility of earnings management using actual asset sale transactions. This
method of earnings management requires decisions about the actual occurrence and timing of real
transactions in order to achieve a certain desirable level of reported earnings, rather than the use of more
observable techniques such as changing of accounting methods or making a classifactory choice. Indeed,
some authors claim that of the available methods for smoothing income, the timing of transactions is probably
the most direct and influential method of manipulating accounting income, e.g., Wolk et al. (1989, p.288). The
intent underlying real transactions decisions can be difficult to identify. In particular, asset sales may be
motivated by real economic decisions unrelated to earnings management considerations. Even if earnings
management is practised, some asset sales will be motivated by real economic considerations and will not be
amenable to factors such as timing adjustments. Certain types of asset sales will be more adaptable to
earnings management, generally those involving investment assets and, especially, highly liquid assets where
management is unlikely to possess superior information about intrinsic worth. Thus, different compositions
of fixed and investment assets across firms implies significant variation in the ability to engage in earnings
management.
Managers generally have some discretion over the sale of assets; typically, there is some degree of control
over which asset is to be sold and when. Even if the decision whether to sell assets is predetermined, the
process of ongoing sales provides the possibility of slowing down or speeding up the real variable transactions,
5
depending on the objective of the earnings management. The amount of discretion will vary depending on
a variety of factors, such as the type of activities the firm is engaged in, the financial situation of the firm, the
strategic investment plan, the degree of managerial control over firm ownership, and so on. For example, in
retailing companies, fixed asset sales would tend to be irregular, while property companies would tend to have
regular investment asset sales. In the sample of firms used in this study, all firms, except two, sold some
investment or fixed assets each year throughout the three-year sample period, with the earnings generated
from investment asset sales being much more significant relative to those generated from the fixed asset
sales. Due to the prevalence of asset sales, the timing of asset sales could provide a more efficient method
of earnings management compared to alternative techniques such as changing accounting methods or early
debt retirement, if only because of the requirement to disclose the effects of these techniques in the financial
statements.
Using a sample of 653 U.S. firm-years, Bartov (1993) tests two common motivations for a connection
between asset sales and earnings management: the earnings-smoothing hypothesis; and, the debt-equity
hypothesis. As typically presented, the earnings-smoothing hypothesis (e.g., Ronen and Sadan, 1981) implies
that managers purposefully manage reported earnings to achieve a level of variability which satisfies some
managerial objective. The debt-equity or debt covenant hypothesis (e.g., Smith, 1993; Sweeney, 1994) is
concerned with meeting the requirements of financial-statement-based restrictive covenants in debt contracts.
This hypothesis predicts that the higher the debt-to-equity ratio, the more likely earnings will be managed
(upwards). The empirical evidence presented in this study is only partially consistent with Bartov's conclusion
that managers attempt to "misrepresent" actual earnings through the timing of asset sales in order to achieve
an earnings smoothing objective. This study only finds that certain firms with deteriorating earnings appear
to engage in asset sales to smooth earnings. As such, the evidence from the sample of Singaporean firms
used in this study indicates that the process of timing asset sales is different from Bartov's large sample of

6
US firms in which firms with both deteriorating and improving earnings engage in earnings manipulation, albeit
under a different set of accounting rules..
In addition, the empirical evidence from the Singaporean sample is insufficient to support the debt-equity
hypothesis that was supported by Bartov's sample. This is likely due to a number of fundamental differences
between the samples used. In particular, unlike the U.S., Singaporean firms have opportunities to mix
accounting choice management with real variable management through discretionary asset revaluations that
increase assets and thereby reduce debt-to-equity ratios, and which can have both a current and future
(downwards) earnings effect arising from the higher depreciation of revalued depreciable assets.1 This
accounting treatment is similar to firms in countries such as Australia, the U.K. and New Zealand, e.g., Black,
Sellers and Manly (1998). Sales of previously revalued assets also permit Singaporean managers further
discretion to achieve earnings management objectives through the flexibility permitted in accounting for the
related ("realized") revaluation surplus following the sale. Managers may credit any such revaluation surplus
either to current profits or to retained earnings. Examination of the characteristics for the sample of
Singaporean firms used in this study also reveals that the debt-to-equity ratios are typically low, implying that
debt covenants are not likely to be either important or binding for most of the firms. Combined with the ability
to increase the book value of assets through asset revaluations rather than through asset sales, the evidence
against the debt-equity hypothesis cannot be taken as being directly in conflict with Bartov.
3. Institutional Background
The applicable accounting procedures are regulated by the Singaporean Statement of Accounting Standard
4, Depreciation Accounting. [SAS 4], Statement of Accounting Standard 14, Accounting for Property, Plant
and Equipment [SAS 14], and Statement of Accounting Standard 25, Accounting for Investments [SAS 25].
These respective standards are based on equivalent international accounting standards issued by the
International Accounting Standards Committee. These standards differ in one important respect from their

7
U.S. equivalents in permitting firms in jurisdictions such as Singapore, the UK and Australia to revalue assets.
The Singapore standards also differ from Australia and UK standards in some other minor respects. These
differences are important to understanding the results and implications of this study, especially for making
comparisons with the sample of US firms in Bartov (1993), and for understanding how they are intertwined
with earnings smoothing and debt covenant motivations for asset sales. SAS 14 and SAS 4 cover the
accounting requirements for property, plant and equipment assets, (PPE assets), their depreciation, and the
accounting for investment properties. These rules define property, plant and equipment assets as tangible
assets "acquired or constructed with the intention of being used on a continuing basis; and (which) are not
intended for sale in the ordinary course of business" [SAS 14, para.6], and which are "eliminated from the
financial statements when no further benefit to the enterprise is expected" [SAS 14, para. 29]. Thus, the
implied intention of these standards is that the timing of sales of such assets is determined by optimal investing,
financing and operating strategies and not as a conscious decision to "manage" or "smooth" earnings.
Consistent with intentions, the standards state that a "different accounting treatment is considered
appropriate for depreciable assets held as investments" (investment properties) (SAS 4, Appendix, para.2).
Such investment properties may be accounted for as long-term investments, or as property and depreciated
accordingly [SAS 4, Appendix, para.7, SAS 25, paras. 24, 45). If management chooses to account for such
assets as investments, they should be carried on the balance sheet at open market values, and be revalued
periodically on a systematic basis. Subsequent changes in carrying amounts are then generally credited to
or charged against the investment revaluation surplus, with any shortfall charged to profits [SAS 4, Appendix,
paras. 7, 9, 10; SAS 25, para. 23, 25, 48].
The accounting for investments other than investment properties generally conforms with Australian
practices. Current and long-term investments are to be classified and distinguished as: long-term investment
assets, which may be carried either at cost or at revalued amounts; and long-term marketable equity

8
securities, which may be carried at the lower of cost and market value applied on a portfolio basis [SAS 25,
paras. 43-44,47]. Increases in carrying amounts arising from the revaluation of long-tem investments are
generally credited to revaluation surplus [SAS 25, paras 4, 8, 48, 49]. The effect on the financial statements
resulting from sales of PPE and investment assets depends on whether the assets were carried at historical
cost or at revalued amounts. The difference between the net disposal proceeds and the net carrying amount
for both cost and revalued assets is recognised as either a gain or loss on sale in the income statement (SAS
14, paras. 31, 43; SAS 25, paras. 26, 50). However, on the sale of either a previously revalued PPE or
investment asset, the related balance in revaluation surplus may be transferred either to income or to retained
earnings (SAS 14, para. 32; SAS 25, para. 26, 50). The usual treatment in the accounts is to transfer realised
revaluation surpluses on disposal of PPE assets to current operating profits and that for investments to current
extraordinary items ‘below the line’.
4. Hypothesis Development
4.1 Sample Characteristics
The sample used in this study is based on 44 Singapore incorporated companies listed on the Mainboard
of the Stock Exchange of Singapore (SES). There are four general categories of SES companies available
for selection: industrial and commercial; hotel; property; and finance. Of these groups, all companies in the
finance category are excluded due to substantial differences in capital structure and financial reporting
requirements. The sample covers the three-year period from 1989 to 1991. Periods prior to 1989 are not
covered as SAS 25 became effective for accounting periods beginning on or after January 1988. The final
sample contains 44 companies which sold either fixed assets or investments in at least one of the three years.
This provides 132 firm year observations over the three year sample period. The sample represents about
25% of the Mainboard companies listed throughout the three-year period, excluding those in the finance
category. Of the 44 sample companies, 31 are from the industrial and commercial category; six from the

9
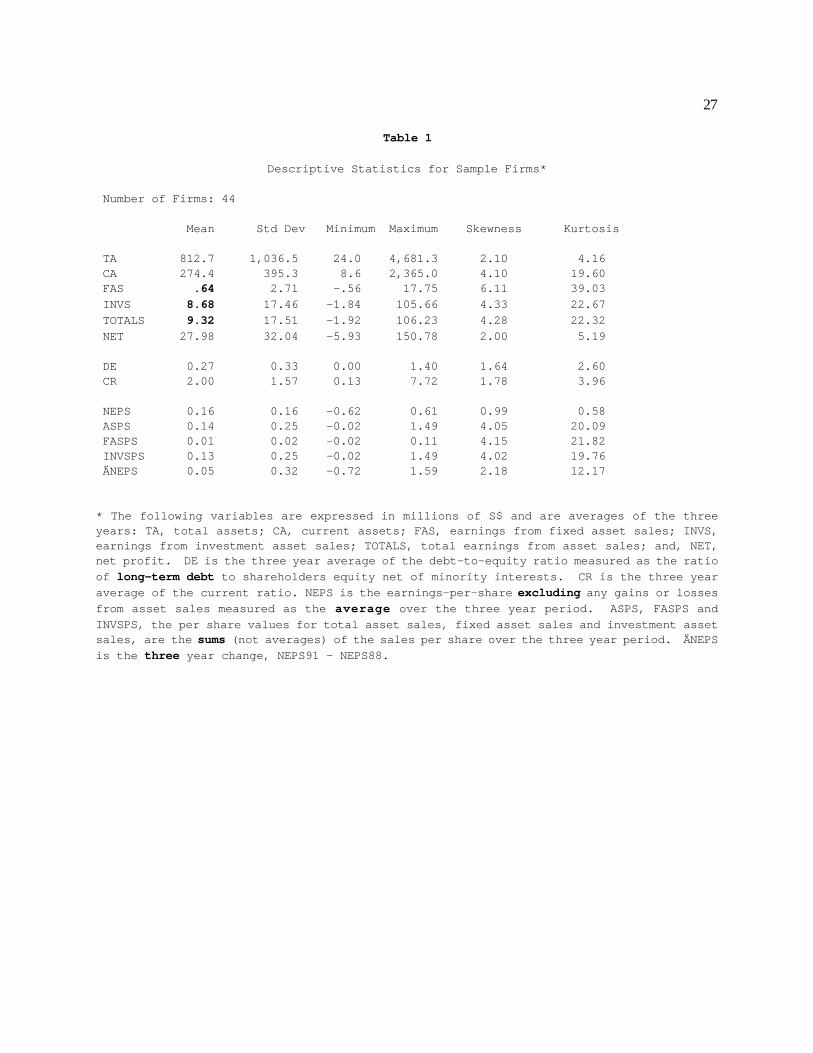
hotel category; and seven from the property category. Table 1 provides summary accounting data on the
sample firms._______________________________
INSERT TABLE 1 ABOUT HERE________________________________
Table 1 reveals that average firm size, measured using average total assets over the three year period (TA),
is S$812.7 million, with the smallest firm being S$24 million and the largest S$4.68 billion. Positive skewness
indicates that most companies are at the lower end of this range. The average debt-to-equity (D/E) ratio,
measured as the ratio of long term debt to shareholders equity net of minority interests, is only 0.276. In 1991,
for example, only two of the firms had D/E ratios greater than one and 12 of the 44 companies had a ratio
of zero. Combining the D/E information with various profitability-related measures such as NET (net profit),
NET/TA, NEPS (earnings-per-share net of asset sales) and ÄNEPS (the change in NEPS) reveals the
general financial strength of the companies used in the sample. This characteristic of the typical sample
company is important when interpreting the empirical results. Finally, Table 1 reveals that the relationship
of fixed asset sales to investment asset sales is, approximately, 4% of income from asset sales originated from
fixed assets and 96% from investment assets sales.2
4.2 General Hypothesis Development
Numerous studies and substantial anecdotal information provide evidence in favour of different forms of
earnings management. However, it is often the case that the underlying theory or motivation is not clearly
enough specified to draw strong conclusions from the evidence presented. This observation is germane for
studies testing earnings management involving real variables. Because earnings management using asset
sales can be a relatively costly activity, the managerial incentives have to be sufficiently beneficial to induce
this type of behaviour. For the specific case of Singaporean firms: why would managers resort to this
relatively costly method, especially when the discretionary asset revaluation opportunities available under

10
Singapore's GAAP provide a potentially less costly method of (asset-increasing) earnings management to,
say, avoid the costs associated with restrictiveness of debt covenants? The answer to this question lies in a
fundamental economic aspect of asset sales. Selling an asset generates a cash flow while an asset
revaluation does not. This cash flow can have significant economic as well as accounting implications. The
accounting implications result from the reported gain or loss on sale and from the discretionary treatment of
any realised revaluation surplus released upon the sale of a previously revalued asset as either current income
or retained earnings. Hence, for a sample of Singaporean firms, a joint hypothesis is required to specify
empirical tests of whether asset sales have an earnings management motivation.
Because asset revaluations are not permitted under U.S. GAAP, there is a greater incentive for asset
sales to be used for earnings management in the U.S. than in countries, such as Singapore, where such
revaluations are permitted. Using a sample of U.S. firms, Bartov (1993) tested two general motivations for
earnings management using asset sales: the achievement of a smoother stream of earnings; and, the
avoidance of costs associated with violation of debt covenants. This study adopts these two general
motivations, but restructures the hypotheses tested to suit the particulars of the Singaporean sample under
consideration. More precisely, it is not expected that debt covenants will provide as strong an incentive for
earnings management in Singapore, due to the ability to revalue assets and the generally low debt-equity for
the sample firms. Similarly, if the earnings smoothing incentive is valid for Singapore, this incentive will be
more closely tied to the economic motivation for generating the cash flow than would be observed for a
sample of U.S. firms. The upshot is that, despite certain similarities in design, this study does not provide a
direct test of Bartov. Rather, any significant differences between the results of this study and those of Bartov
provide evidence on the impact that permitted asset revaluation has for earning management decisions.
4.3 Earnings Smoothing Hypothesis
The earnings smoothing hypothesis proposes that managers have incentives to manage reported earnings
11
to achieve a level of earnings that is less variable than would be observed in the absence of management
intervention. The literature on earnings smoothing has extensive discussion of the purposes for smoothing,
the methods of smoothing and empirical studies of the occurrence of smoothing, e.g., Healy and Wahlen
(1999) and Dechow and Skinner (2000) are recent reviews. Explanations for earnings smoothing behaviour
vary. One explanation is that it is a way for a company to signal the level of future earnings that investors
can expect. A related explanation is that earnings smoothing may be employed to report a level of earnings
consistent with market expectations. Some studies also report that managers smooth reported earnings
because they believe that investors pay more for a firm with a smoother income stream (Ronen and Sadan,
1981). Similarly, reduced variability in a firm's earnings stream can improve its implicit or explicit contracting
terms (e.g., Bowen et al. 1995). Smoothing could have real benefits to companies if the cost of capital is
lowered due, say, to the removal of information asymmetries between management and investors (Botosan,
1997). However, smoothing activities could also impose costs that may outweigh any potential benefits.
Is the timing of asset sales used to smooth earnings? Specifying a testable hypothesis for this question
requires some statement about the economic rationale for asset sales in the absence of a smoothing
motivation. Significantly, for the present sample, sales of fixed assets are considerably less important than
sales of investment assets. The relative contribution of fixed and investment assets sales to income reflected
in Table 1 reveals that approximately 96% of income from asset sales originated from sales of investment
assets. One reason for this is that depreciation can have a significant impact on the earnings implication of
a fixed asset sale. There are also other factors specific to the sample being used. Many of the firms are in
an expansion phase and do not have sizeable amounts of fixed assets available for sale. In addition, due to
a combination of factors, the present sample of Singaporean firms has a sizable pool of investment assets
available for sale.3 Hence, in formulating the joint hypothesis for the present sample, it is the economic
motivations for investment asset sales which are of predominant interest.

12
What factors cause firms to sell investment assets? Some sales are due to portfolio management
considerations. This may involve eliminating the underperforming investment assets and attempting to
purchase other investment assets which will outperform. Other possible factors include a need to rebalance
the investment asset portfolio to achieve sufficient diversification in the face of ongoing investment asset
purchases. In many other cases, the cash flow generated by the sale of investment assets is used in the
purchase of fixed assets required to support and expand core businesses. For example, Lang et al. (1995)
argue that "management sells assets when doing so provides the cheapest funds to pursue its objectives rather
than for operating efficiency reasons alone." In terms of the costs associated with different sources of
financing, sales of investment assets would have a preference rank below current earnings but above debt
increases or new issues of equity. Firms with strong earnings growth will generally have a larger pool of
current earnings to finance expansion than firms with declining earnings.
Given this, there is a functional economic relationship between NEPS and asset sales in the absence of
earnings smoothing: firms with increasing NEPS have less incentive to sell investment assets to finance core
business growth and sustain dividend payments, compared to firms with decreasing NEPS, because there
would be a larger pool of retained earnings available to sustain economic activities.4 Hence, in formulating
the joint hypothesis there is a fundamental asymmetry between the motivations of firms with increasing NEPS
and decreasing NEPS. Now, consider the process of how the sale of assets can be used for managers to
report a smoother level of earnings. Assume that previous NEPS is the level below which managers do
not want earnings to fall. This assumption can be justified by the need for firms to avoid the implicit and
explicit contract costs associated with negative earnings surprises (ÄNEPS < 0). When current earnings fall
below the previous year's earnings, managers can sell undervalued assets so that the book gains from the sale
bring current earnings closer to previous earnings. However, if the current earnings are higher than previous
earnings, managers have little or no incentive to sell assets that will result in earnings losses in order to
13
decrease current earnings to a level closer to previous earnings.
This reasoning leads to the following hypothesis:
H1: When current NEPS is below the previous NEPS, managers time asset sales to increase the currentearnings per share. When NEPS is above previous NEPS, managers will not time asset sales todecrease the current earnings per share.
To test this hypothesis, the sample can be divided into firms with ÄNEPS being positive and negative. For
the negative ÄNEPS group, H1 implies that income from asset sales will be negatively correlated with
ÄNEPS. For the positive ÄNEPS group, H1 implies that income from asset sales will be positively correlated
with ÄNEPS.
To summarize: for a sample of financially healthy firms where earnings from asset sales come largely
from sales of investment assets, economic and accounting factors will produce an observed relationship
between earnings from assets sales and ÄNEPS that is asymmetric. Economically, negative ÄNEPS firms
will sell investment assets to support purchases of fixed assets and other expenditures required to sustain core
business. From an accounting perspective, these asset sales reduce the implicit and explicit contracting costs
associated with ÄNEPS < 0. Consistent with H1, this will produce a negative correlation between ÄNEPS
and earnings from asset sales. Firms with positive ÄNEPS will be better able to sustain core business with
current earnings. These firms also have potentially greater growth prospects. In addition, over time higher
ÄNEPS typically will generate a larger pool of retained earnings held as investment assets. A larger potential
stock of investment assets available for sale combined with better growth prospects may produce a positive
correlation between ÄNEPS and earnings from assets sales for firms with positive ÄNEPS. In effect, the
firms with the highest level of NEPS growth will tend to be 'cash-rich' and operating in high growth sectors.
On balance, these firms will make asset sales decisions based on economic fundamentals and are not likely
to be affected by earnings-smoothing considerations.
4.4 Debt-Equity Hypotheses

14
Since debt covenants are written in terms of accounting numbers, changes in these numbers can cause
changes in the restrictions imposed by debt contracts that could lead to wealth transfers between debtholders
and shareholders and alter the probability of covenant default. The general implication is that firms with
higher debt/equity ratios are motivated to engage in ‘real’ activities, such as timing asset sales, to reduce the
restrictions imposed by debt covenants and minimise the probability of covenant default. This reduction in
restrictions occurs because timing the recognition of the gains from sales of assets with market values
exceeding book values reduces the debt-to-assets ratios commonly used in debt covenants. This loosens the
covenant restrictions and, consequently, minimizes the probability of financial covenant default. Bartov (1993)
provides evidence supporting the hypothesis that U.S. firms used asset sales to satisfy debt covenant
restrictions. However, no actual debt contracts were examined for restrictions on asset sales or whether the
actual definitions of earnings and leverage permitted gains on sales of assets to be taken into account in the
calculation of the covenant restrictions. In this vein, Mohrman (1996) empirically examines innovation in debt
contract drafting and the increasing use of provisions specifying accounting methods in financial statement
covenants. Mohrman indicates that firms cannot typically reduce the probability of financial covenant
violation by selling assets. Furthermore, unlike U.S. firms, Singaporean firms can decrease their debt-to-
equity ratios by the less costly method of revaluing instead of selling an asset. In addition, Singaporean firms
characteristically have relatively low debt-to-equity ratios, again reducing the potential need for asset sales
to minimise debt covenant restrictions.
All this background leads to the following hypothesis:
H2: The debt-to-equity ratio will not affect managers' decisions to time asset sales.
The empirical implication is that there will be insignificant correlation between income from asset sales and
debt-equity ratios before the sale.5 Unfortunately, the current sample of firms is characterized by relatively
low debt-equity ratios. In this case, acceptance of H2 does not provide strong evidence against the impact
15
of debt covenant restrictions on asset sales decisions, only that no evidence of such behaviour was observed
in the current sample of firms. In an attempt to control for the absence of binding debt covenant restrictions
on firms with little or no debt, H2 is only expected to hold for firms with above average debt-equity ratios.
To summarize: if debt covenant restrictions do induce asset sales, it is expected that the higher is the debt-
equity ratio, the higher will be the level of asset sales. This implies a positive relationship between the debt-
equity ratio and asset sales. However, for the present sample of financially healthy firms, the ability to engage
in less costly revaluation of assets together with generally low debt-equity ratios indicates that an insignificant
correlation between earnings from assets sales and debt-equity ratios is a plausible hypothesis. In other
words, debt covenants have no discernable impact on asset sales. As was the case with H1, the H2
hypothesis is also a joint hypothesis which requires consistency with economic fundamentals. Because debt
is a more costly source of financing than retained earnings, firms with higher debt-equity ratios would tend
to have less investment assets to sell and, relative to expansion plans, a smaller fraction of current earnings
available to finance core activities. At best, the relationship between debt-equity ratios and financing
requirements produces an implied negative relationship between debt-equity ratios and earnings from asset
sales which is the opposite of what is expected under the 'Bartov debt-equity hypothesis' reasoning.
5. Empirical Evidence
5.1 Research Design6
A key variable used in the empirical results is total income from asset sales per share (ASPS), the income
from sales of fixed assets plus investment assets divided by the number of shares outstanding at the end of
the year. ASPS is the sum of gains and losses of all asset sales that are included in net income for the period.
A positive ASPS indicates a net gain from asset sales while a negative ASPS indicates a net loss from asset
sales. ASPS is further decomposed into income from fixed asset sales per share (FASPS) and investment
asset sales per share (INVSPS) respectively, where ASPS = FASPS + INVSPS. The variable used to filter
16
the sample to test H1 is the net change in earnings per share (ÄNEPS) where NEPS is EPS not of any gains
or losses associated with asset sales and ÄNEPSt = NEPSt - NEPSt-1. The variable used to filter the sample
to test H2 is D/E, the ratio of long term debt to shareholders' equity. Other variables of interest include the
log of TA (LTA) and RASS = NET/TA. The log of TA (LTA) is a proxy for firm size and RASS represents
a measure of firm profitability.
Both univariate (bivariate correlation) tests and multivariate regressions are used to examine the
hypotheses. Tables 2 to 4 present the univariate results and Table 5 presents selected regression results. In
Tables 2 to 4, summary statistics and correlations between relevant variables are provided for the unfiltered
sample and for two types of filtered samples. One type of filtered sample is created by sorting companies
according to whether ÄNEPS was positive or negative and, in the other filtered sample, companies are sorted
according to the relative D/E level. Results are reported for individual years as well as three year
averages/changes. At least two cautions about the results are in order. In conducting the relevant empirical
tests, it is implicitly assumed that each firm-year is an independent observation, even though this assumption
is not strictly accurate due to the interdependence of market and industry associations. Also, because the
number of shares has been used to scale the relevant variables, the univariate results may be influenced by
the size of the firm. This potential source of bias is accounted for in the regression analysis.________________________________
INSERT TABLES 2 TO 5 HERE________________________________
Why include results for the three year averages/changes? One reason for doing this concerns the
presumption that earnings smoothing occurs annually, with firms reacting to the most recent earnings number.
If this is correct, then averaging across time could obscure the association between smoothing and asset sales.
However, it is possible that the incentives for smoothing are less obvious and that smoothing occurs over a
longer time period. For example, a longer time period for smoothing could be due to the time lag involved
in selling certain types of assets or due to firms reacting to earnings behaviour over longer time horizons in
17
order to escape detection by investors. Another reason for including the three year values is that insights can
be obtained by comparing the three year values with individual year results. For example, the three year
correlations between ASPS and ÄNEPS incorporate not only the contemporaneous associations but also the
effect of the sale of investments on future ÄNEPS, information not captured by considering the
contemporaneous correlations alone. However, because the three year values are aggregated, some caution
is required in making inferences from these results.
In addition to the bivariate correlations reported in Tables 2 to 4, the two hypotheses are also jointly tested
using regression estimates. Though a number of slightly different variations are considered, the primary
multiple regression model takes the form:
ASPSt = a0 + a1ÄNEPSt + a2 D/Et + a3 LTAt + a4 DROB + et
where DROB is a dummy variable included to account for one firm outlier, Robinson's, a high ÄNEPS > 0
firm which sold its large investment in an associated company at a substantial profit ($71 million) in 1991. In
addition, some of the regressions also report a coefficient for a profitability variable RASS = NET/TA. Unlike
the univariate test results where Robinson's had to be censored, the inclusion of a dummy variable permits
the value of this outlier to be directly assessed. In the above model, a j represents coefficients for each of the
respective independent variables (j = 0,1,2,3,4) and e t is the residual of the model, which is assumed to possess
statistical properties required for ordinary least squares efficiency. Under H 1 and H 2, the expected coefficient
signs are a1 < 0 and a2 = 0. While not directly a component of H1 and H2, it is expected that a3 > 0 because
larger firms will be involved in a wider range of activities and will have more reasons to engage in asset sales.
Table 5 presents empirical results for the three year averages/changes.
5.2 Empirical Results
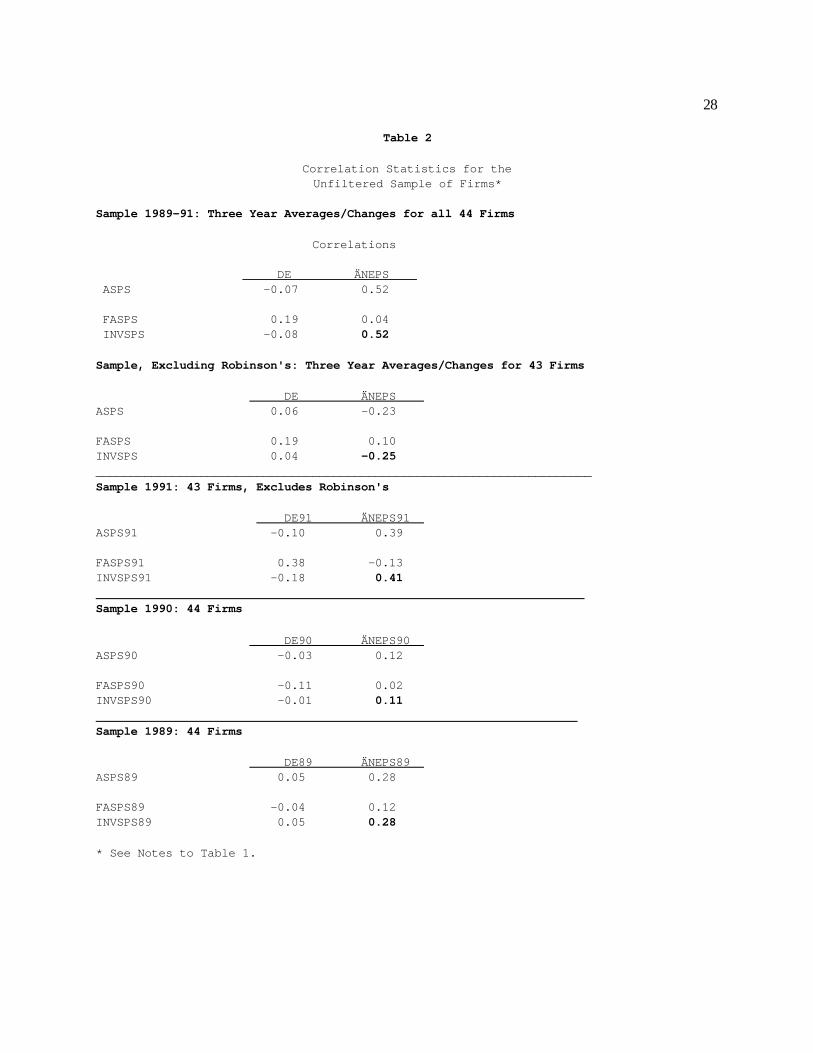
Tables 2 to 4 summarize the results of the bivariate correlation tests. Table 2 provides correlation
coefficients for the variables of relevance to H1 and H2 over the unfiltered sample. The three year
18
averages/changes reveal the importance of outliers. In particular, the correlation between ASPS and ÄNEPS
changes dramatically, from 0.52 to -.24 when one observation is dropped from the sample. There is also
some change in the correlation between DE and ASPS, though neither value (-.07 or .06) is statistically
significant. As expected, given that over 96% of ASPS arises from INVSPS, the information in the ASPS
correlations is also reflected in the correlations for investment asset sales. Fixed asset sales correlations
exhibit different behaviour. Examining the results for the individual years, 1989 to 1991, reveals the
importance of the aggregation procedures used to generate ASPS and ÄNEPS for the three year sample.
While the correlation coefficients for ASPS and DE are insignificant and consistent with the three year
sample results, the ASPS and ÄNEPS correlations are all positive with two of the three being highly
significant.
There are a number of possible explanations for the seeming inconsistency between the contemporaneous
and three year average results for ÄNEPS and ASPS. For example, assume that the smoothing hypothesis
does not hold (so that there is no association between contemporaneous ASPS and ÄNEPS) and that
management tends to sell investments at a profit. The sale of investments could cause next year's earnings
to drop (if a dividend were paid or if new investment purchases did not immediately generate income) which
would generate a negative association between ÄNEPS and ASPS thereby creating the observed negative
correlation for the three year results. Now consider the positive contemporaneous correlation. The
distribution of ASPS suggests a large portion of the income from asset sales is positive. Because the deflation
for size only uses the number of shares, firms with larger earnings per share may also have larger income
from asset sales and higher stock prices. Hence, the positive correlation may be purely a size effect. The
upshot is that testing of H1 and H2 requires a more detailed examination of the data than is available from the
unfiltered sample alone. The one conclusion which is suggested in Table 2 is provided by the insignificant
correlations between DE and ASPS, which provide strong evidence in favour of H2.
19
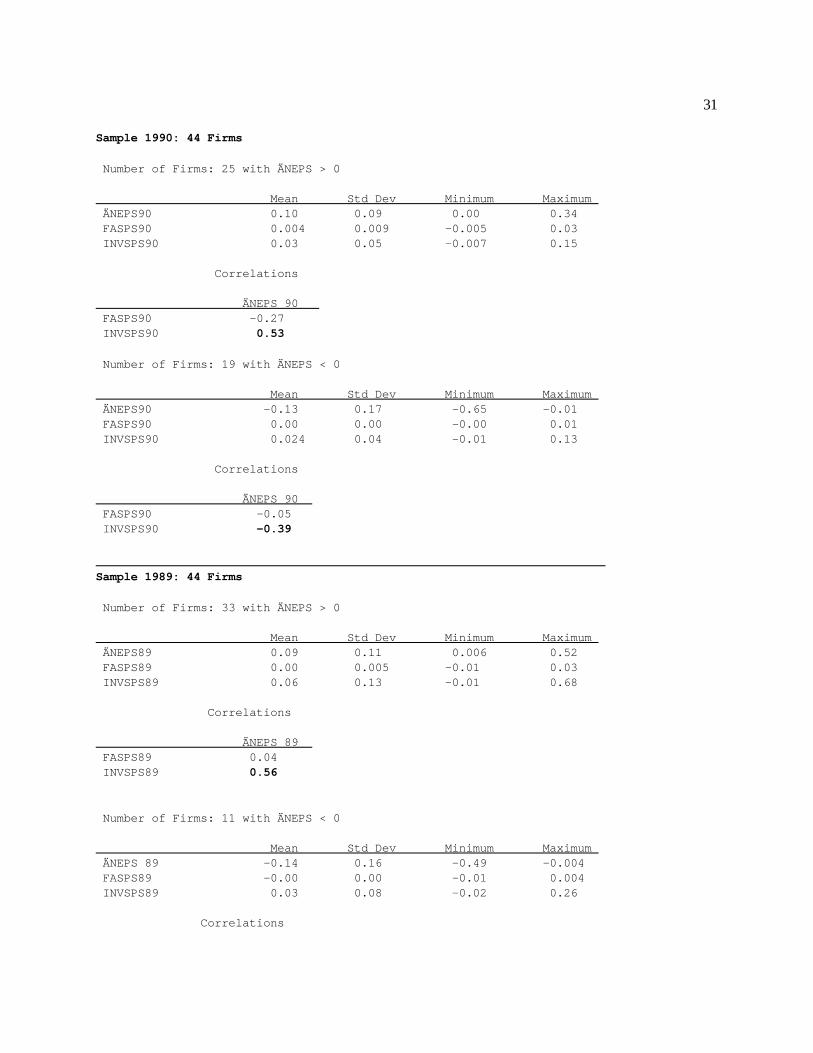
Table 3 produces more direct evidence on H1 for the three year and year-to-year samples. In this Table,
samples are filtered according to ÄNEPS being positive or negative. Examination of the correlation results
in Table 3 provides evidence in favour of an asymmetric relationship driving ASPS indicated by H1. For the
ÄNEPS < 0 three year sample and for two of the year-to-year samples, the correlation coefficient between
ÄNEPS and INVSPS is negative and statistically significant, consistent with the earnings smoothing
hypothesis. The one year (1991) where the observed correlation was contrary to H1, the mean and standard
deviations of income from asset sales were almost zero. Consistent with H1, for the ÄNEPS > 0 three year
sample and for each of the year-to-year samples, the correlation coefficient between ÄNEPS and INVSPS
is positive and statistically significant. This evidence is consistent with joint hypothesis that economic
considerations drive asset sales for firms with ÄNEPS > 0. Table 3 also suggests that the inconsistency
between the three year and year-to-year results observed in Table 2 is due to aggregating firms with different
incentives for income smoothing.
Table 4 provides results for the sample being filtered using the DE, a filtering procedure which is relevant
for testing H2. On balance, these results confirm the support for H2 provided in Table 2: debt covenant
restrictions do not have a significant impact on asset sale decisions for Singaporean firms. Table 4 also
provides some evidence on the economic component of the joint hypothesis. The three year results indicate
that the mean ASPS is higher for the higher DE firms, though the difference is not statistically significant.
This is consistent with the hypothesis that asset sales play an important role in the financing process. Firms
with higher D/E have a greater need to use asset sales as a source of funds, a result which is further
supported by the ÄNEPS = -.03 result for the three year sample of firms with higher than average D/E.
Further support for H2 is provided by the correlation between DE and INVSPS which is negative (non-
positive), as predicted by H2. On balance, the evidence in Table 4 indicates that the correlation between DE
and ASPS is either negative or zero, indicating that H2 can be accepted. The evidence that firms with higher
20
DE also have average ÄNEPS < 0 is also supportive of the economic component of the joint hypotheses
comprising H1 and H2.
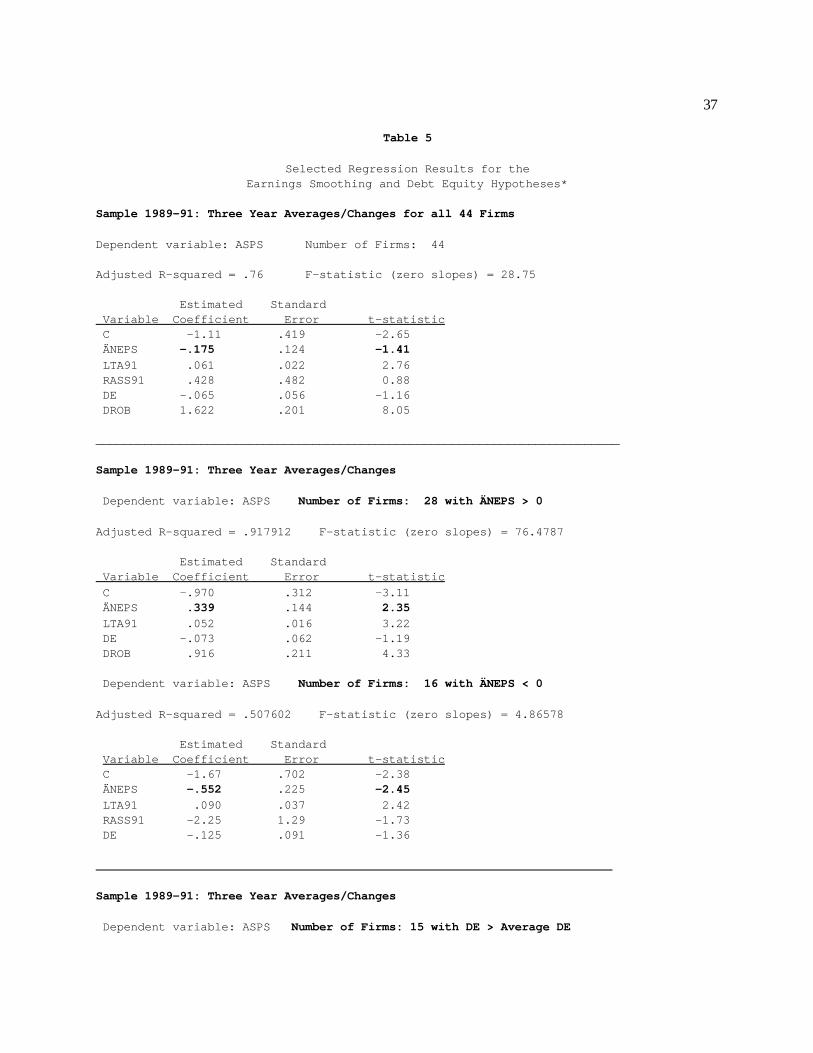
One possible explanation for the conflicting results presented in Table 2 was that the method of deflating
variables could leave room for a firm size effect. Table 5 addresses this issue by providing results for
regression equations which are specified to take account of firm size and profitability. Regression results for
the year-to-year results (not reported) are similar in content. The regression results provide further
confirmation for H1 and H2. In addition, the three year sample estimates also provide more detailed
information on the importance of outliers for the empirical testing process, with the dummy for Robinson's
being the most significant explanatory variable in the regressions in which it was included. As for the testing
H1 and H2, for the samples filtered using ÄNEPS the coefficients on ÄNEPS are negative and are significant
at the 5% level, supporting H1, while the coefficient on DE is the negative and is insignificant, supporting H2.
The Table 5 results for the unfiltered sample indicate that firm size does play a significant role in the
explaining the incongruent results observed in Table 2. When firm size is included in the regression, the
coefficient (on LTA) is significant and the sign of the coefficient of NEPS is negative, albeit insignificant.7
The coefficient estimates for the Robinson's dummy variable need some further discussion. One
conclusion of the combined theoretical and empirical results can be summarized as: asset sales triggered by
earnings smoothing incentives do not appear to be systematically present in the activities of all firms. Asset
sales decisions are motivated by a wide range of economic and accounting factors. However, certain firms
do appear to engage in asset sales for earnings smoothing objectives. One key characteristic of these firms
is the presence of declining NEPS. Similar phenomenon are detailed in Burgstahler and Dichev (1997) where
the incentives for earnings management are found to be asymmetric: firms with poor economic performance
tend to have greater, and possibly different, incentives to manage earnings than firms with strong economic
performance. Even within the group of firms with declining NEPS, the incentives for earnings smoothing
21
differ. In addition, many types of firms, with both increasing and decreasing NEPS, engage in asset sales for
economic reasons related to core business activities. For example, a property firm will sell an investment in
a shopping mall because a business decision is made that the sales price is attractive. Robinson's is a firm
with increasing NEPS (over the sample) which was engaged in substantial property related activities. One
particular transaction involved an investment in a shopping mall which was sold at a large profit. Engaging
in a process of eliminating such firms from the sample raises numerous questions about the criteria used to
censor specific observations. Given the multivariate nature of the asset sales decision, valid criteria for
censoring are especially complicated. As a consequence, no variables have been omitted and the presence
of special situations have been controlled by including dummy variables in the regression equations.
6. Conclusions
This study examines the issue of whether firms time asset sales to manage reported earnings. Bartov
(1993) hypothesized that managing earnings is either to achieve a smoother level of earnings or to satisfy debt
covenants. Empirical results are provided for a 1989-91 sample of 44 publicly traded Singaporean firms.
Specific results of interest indicate that for firms with ÄNEPS < 0, there is a negative relationship between
earnings from assets sales and ÄNEPS, consistent with a restricted version of the earnings smoothing
hypothesis. For firms with ÄNEPS > 0, there is a positive relationship, consistent with the joint hypothesis
that these firms have less economic incentive to smooth earnings. On balance, there is support for an
asymmetric form of the earnings smoothing hypothesis. This joint hypothesis recognizes that asset sales are
real variables, which are determined by economic as well as accounting considerations. The hypothesis that
managers do not time asset sales to satisfy debt covenants is also supported, though the evidence provided
in relatively weak given the types of firms included in the sample and other considerations. In particular, due
to a combination of generally low debt/equity ratios and the ability of Singaporean firms to revalue assets, this
result is not surprising.
22
Some caution is required in comparing the results of this study to those of Bartov (1993). In particular,
there are significant differences in the characteristics of the Singaporean sample and the U.S. firms used in
Bartov. The Singaporean companies used in this study are typically financially healthy and profitable, as
exhibited by generally low debt-equity ratios and increasing NEPS. These characteristics will tend to make
the sample firms less concerned about managing the accounting record of firm performance.8 As a
consequence, asset sales are more likely to be influenced by economic as opposed to accounting
considerations. In addition, unlike the US firms examined in Bartov, Singaporean firms can reduce debt-to-
asset ratios and alleviate debt covenant restrictions through asset revaluations. The results also show that
few firms took advantage of the additional flexibility to smooth earnings (downwards) through the
discretionary ability to transfer related revaluation surpluses following sales of fixed and investment assets
either to current income or to retained earnings. Thus, consistent with one of the general results of this study,
increasing NEPS firms did not take advantage of accounting procedures to smooth earnings streams
downwards.
23
Bibliography
Aharony, J., C. Lin and M. Loeb (1993), "Initial Public Offerings, Accounting Choices and EarningsManagement", Contemporary Accounting Research (Fall): 61-82.
Bartov, E. (1993), "The Timing of Assets Sales and Earnings Manipulation", Accounting Review (October)68: 840-55.
Black, E., K.Sellers and T. Manly (1998), “Earnings Management Using Asset Sales: An International Studyof Countries Allowing Noncurrent Asset Revaluation”, Journal of Business, Finance and Accounting(Nov/Dec) 25: 1287-1317.
Botosan, C.A. (1997), "Disclosure Level and the Cost of Equity Capital", Accounting Review (July) 72:323-49.
Bowen, R., L. DuCharme and D. Shores (1995), "Stakeholders' Implicit Claims and Accounting MethodChoice", Journal of Accounting and Economics (December): 255-96.
Burgstahler, D. and I. Dichev (1997), "Earnings Management to Avoid Earnings Decreases and Losses",Journal of Accounting and Economics (December) 24:99-126.
Carlson, S.J. and C.T. Bathala (1997), "Ownership Differences and Firms Income Smoothing Behavior",Journal of Business Finance of Accounting (March) 24:179-96.
Chan, Y. (1987), "Asset Revaluation Practices: Some Empirical Evidence", Singapore Accountant (March):16-18.
Dechow, Patricia M, R. Sloan, and A. Sweeney (1995), "Detecting earnings management", AccountingReview 70 (April): 193-225.
Dechow, P. and D. Skinner (2000), “Earnings Management: Reconciling the views of Accounting Academics,Practitioners and Regulators”, Accounting Horizons 14: 235-50.
Hand, J. (1989), "Did Firms Undertake Debt-Equity Swaps for an Accounting Profit or True Financial Gain?",Accounting Review 64 (October): 587-623.
Healy, P. and J. Wahlen (1999), “A Review of the Earnings Management Literature and its Implications forStandards Setting”, Accounting Horizons 13: 365-83.
Institute of Certified Public Accountants of Singapore, Statement of Accounting Standard 4, 'DepreciationAccounting', (March 1977), Statement of Accounting Standard 14, 'Accounting for Property, Plant andEquipment', (August 1983), Statement of Accounting Standard 25, 'Accounting for Investments', (October1988).
Jiambalvo, J. (1996), "Discussion of 'Causes and Consequences of Earnings Manipulation", ContemporaryAccounting Research (Spring): 37-47.

24
John, K and E. Ofek (1995), "Asset Sales and Increase in Focus", Journal of Financial Economics 37: 105-126.
Kinnunen, Juha, E. Kasanen and J. Niskanen (1995), "Earnings management and the economy sectorhypothesis: Empirical evidence on a converse relationship in the Finnish case", Journal of Business Finance& Accounting 22 (June): 497-520.
Lang, L., A. Poulsen and R. Stulz (1995), "Asset Sales, Firm Performance, and the Agency Costs ofManagerial Discretion", Journal of Financial Economics 37: 3-37.
McNichols, M., P. Wilson, and L. DeAngelo (1988), "Evidence of Earnings Management from the Provisionfor Bad Debts", Journal of Accounting Research 26: 1-40.
Mohrman, M. (1996), “The Use of Fixed GAAP Provisions in Debt Contracts”, Accounting Horizons 10: 78-91.
Ronen, J. and S. Sadan (1981), Smoothing Income Numbers: Objectives, Means and Implications, Reading,Mass.: Addison-Wesley.
Slovin, M., M. Sushka, and S. Ferraro (1995), "A Comparison of the Information Conveyed by Equity Carve-Outs, Spin-offs and Asset Sell-offs", Journal of Financial Economics 37: 89-104.
Smith, C. (1993), "A Perspective on Accounting-Based Debt Covenant Violations", Accounting Review 68:289-303.
Sweeney, A. (1994), "Debt-covenant Violations and Managers' Accounting Responses", Journal ofAccounting and Economics 17: 281-308.
Wolk, H, J. Francis and M. Tearney (1989), Accounting Theory: A Conceptual and Institutional Approach2nd ed., Boston: Kent Publishing.

GEOFFREY POITRAS, TREVOR WILKINS, AND YOKE SHANG KWAN
The Timing of Asset Sales:
Evidence of Earnings Management?*
May 2001
G. Poitras is Professor, Faculty of Business Administration, Simon Fraser University, T. Wilkins isAssociate Professor, Department of Finance and Accounting, National University of Singapore andY. Kwan is Credit Officer, Malayan Banking Berhad, Singapore. The authors would like to thank ananonymous referee for helpful comments which significantly improved the paper. The authors wouldalso like to thank participants at the JDBA 1996 Doctoral Seminar held at Chulalongkorn University,Bangkok, the 1997 Asia Pacific Finance Association Conference held in Kuala Lumpur and the 2000AAANZ Conference held in Queensland, Australia for helpful comments. This paper was partlywritten while G. Poitras was a Senior Fellow in the Department of Economics and Statistics at theNational University of Singapore.
Address for correspondence. Associate Professor Trevor Wilkins, Department of Finance andAccounting, National University of Singapore, 10 Kent Ridge Crescent, Singapore 119260. E-mail:[email protected]

The Timing of Asset Sales:Evidence of Earnings Management?
ABSTRACT
This paper presents empirical evidence from a sample of publicly traded Singaporean firms on the question:
to what extent do firms manage earnings through the timing of asset sales? Previous studies have focused
on accounting motives behind asset sales, ignoring the need to also consider economic motives. Some
empirical evidence is provided to support the hypothesis that managers of firms with decreasing net
earnings-per-share smooth earnings upwards using asset sales.
Keywords: Asset sales, earnings management, economic motivations, firm performance, earnings
smoothing.
27
Table 1
Descriptive Statistics for Sample Firms*
Number of Firms: 44 Mean Std Dev Minimum Maximum Skewness Kurtosis
TA 812.7 1,036.5 24.0 4,681.3 2.10 4.16 CA 274.4 395.3 8.6 2,365.0 4.10 19.60 FAS .64 2.71 -.56 17.75 6.11 39.03 INVS 8.68 17.46 -1.84 105.66 4.33 22.67 TOTALS 9.32 17.51 -1.92 106.23 4.28 22.32 NET 27.98 32.04 -5.93 150.78 2.00 5.19
DE 0.27 0.33 0.00 1.40 1.64 2.60 CR 2.00 1.57 0.13 7.72 1.78 3.96
NEPS 0.16 0.16 -0.62 0.61 0.99 0.58 ASPS 0.14 0.25 -0.02 1.49 4.05 20.09 FASPS 0.01 0.02 -0.02 0.11 4.15 21.82 INVSPS 0.13 0.25 -0.02 1.49 4.02 19.76 ÄNEPS 0.05 0.32 -0.72 1.59 2.18 12.17
* The following variables are expressed in millions of S$ and are averages of the threeyears: TA, total assets; CA, current assets; FAS, earnings from fixed asset sales; INVS,earnings from investment asset sales; TOTALS, total earnings from asset sales; and, NET,net profit. DE is the three year average of the debt-to-equity ratio measured as the ratioof long-term debt to shareholders equity net of minority interests. CR is the three yearaverage of the current ratio. NEPS is the earnings-per-share excluding any gains or lossesfrom asset sales measured as the average over the three year period. ASPS, FASPS andINVSPS, the per share values for total asset sales, fixed asset sales and investment assetsales, are the sums (not averages) of the sales per share over the three year period. ÄNEPSis the three year change, NEPS91 - NEPS88.
28
Table 2
Correlation Statistics for theUnfiltered Sample of Firms*
Sample 1989-91: Three Year Averages/Changes for all 44 Firms
Correlations
DE ÄNEPS ASPS -0.07 0.52
FASPS 0.19 0.04 INVSPS -0.08 0.52
Sample, Excluding Robinson's: Three Year Averages/Changes for 43 Firms
DE ÄNEPS ASPS 0.06 -0.23
FASPS 0.19 0.10INVSPS 0.04 -0.25_______________________________________________________________________Sample 1991: 43 Firms, Excludes Robinson's
DE91 ÄNEPS91 ASPS91 -0.10 0.39
FASPS91 0.38 -0.13INVSPS91 -0.18 0.41 Sample 1990: 44 Firms
DE90 ÄNEPS90 ASPS90 -0.03 0.12
FASPS90 -0.11 0.02INVSPS90 -0.01 0.11 Sample 1989: 44 Firms
DE89 ÄNEPS89 ASPS89 0.05 0.28
FASPS89 -0.04 0.12INVSPS89 0.05 0.28
* See Notes to Table 1.

29
Table 3
Descriptive Statistics and Correlations:Earnings Smoothing Hypothesis*
Sample 1989-91, Excluding Robinson's: Three Year Averages/Changes
Number of Firms: 27 with ÄNEPS > 0
Mean Std Dev Minimum Maximum ÄNEPS 0.14 0.11 0.00 0.51 FASPS 0.01 0.01 -0.01 0.04 INVSPS 0.10 0.10 -0.00 0.35
Correlations
ÄNEPS FASPS 0.17 INVSPS 0.27
Number of Firms: 16 with ÄNEPS < 0
Mean Std Dev Minimum Maximum ÄNEPS -0.20 0.19 -0.72 -0.01 FASPS 0.01 0.03 -0.02 0.11 INVSPS 0.12 0.20 -0.02 0.69
Correlations
ÄNEPS FASPS 0.10 INVSPS -0.56________________________________________________________________________Sample 1991: Excluding Robinson's
Number of Firms: 25 with ÄNEPS > 0
Mean Std Dev Minimum Maximum ÄNEPS 91 0.04 0.05 0.00 0.16 FASPS91 0.00 0.00 -0.01 0.01 INVSPS91 0.04 0.08 -0.00 0.32
Correlations
ÄNEPS 91 FASPS91 -0.35 INVSPS91 0.37
Number of Firms: 18 with ÄNEPS < 0
Mean Std Dev Minimum Maximum ÄNEPS91 -0.09 0.06 -0.20 -0.00 FASPS91 0.005 0.02 -0.01 0.09

30
INVSPS91 0.002 0.03 -0.12 0.04
Correlations
ÄNEPS 91 FASPS91 0.07 INVSPS91 0.27
31
Sample 1990: 44 Firms
Number of Firms: 25 with ÄNEPS > 0
Mean Std Dev Minimum Maximum ÄNEPS90 0.10 0.09 0.00 0.34 FASPS90 0.004 0.009 -0.005 0.03 INVSPS90 0.03 0.05 -0.007 0.15
Correlations
ÄNEPS 90 FASPS90 -0.27 INVSPS90 0.53
Number of Firms: 19 with ÄNEPS < 0
Mean Std Dev Minimum Maximum ÄNEPS90 -0.13 0.17 -0.65 -0.01 FASPS90 0.00 0.00 -0.00 0.01 INVSPS90 0.024 0.04 -0.01 0.13
Correlations
ÄNEPS 90 FASPS90 -0.05 INVSPS90 -0.39
Sample 1989: 44 Firms
Number of Firms: 33 with ÄNEPS > 0
Mean Std Dev Minimum Maximum ÄNEPS89 0.09 0.11 0.006 0.52 FASPS89 0.00 0.005 -0.01 0.03 INVSPS89 0.06 0.13 -0.01 0.68
Correlations
ÄNEPS 89 FASPS89 0.04 INVSPS89 0.56
Number of Firms: 11 with ÄNEPS < 0
Mean Std Dev Minimum Maximum ÄNEPS 89 -0.14 0.16 -0.49 -0.004 FASPS89 -0.00 0.00 -0.01 0.004 INVSPS89 0.03 0.08 -0.02 0.26
Correlations

32
ÄNEPS89 FASPS89 -0.26 INVSPS89 -0.79
*See Notes to Tables 1.

33
Table 4
Descriptive Statistics and Correlations:Debt-Equity Hypothesis*
Sample 1989-91, Excluding Robinsons: Three Year Averages/Changes
Number of Firms: 15 with DE > Average DE
Mean Std Dev Minimum Maximum ÄNEPS -0.03 0.20 -0.41 0.24 DE 0.64 0.31 0.37 1.40 FASPS 0.009 0.03 -0.02 0.11 INVSPS 0.13 0.19 -0.02 0.69
Correlations DE FASPS 0.22 INVSPS -0.28
Number of Firms: 28 with DE < Average DE
Mean Std Dev Minimum Maximum ÄNEPS 0.04 0.23 -0.72 0.51 DE 0.07 0.08 0.00 0.23 FASPS 0.005 0.01 -0.01 0.04 INVSPS 0.09 0.11 -0.002 0.35
Correlations DE FASPS 0.10 INVSPS 0.25________________________________________________________________________
Sample 1991: 43 Firms, Excluding Robinsons
Number of Firms: 15 with DE > Average 1991 DE
Mean Std Dev Minimum Maximum ÄNEPS 91 -0.06 0.09 -0.20 0.03 DE91 0.69 0.45 0.32 1.88 FASPS91 0.006 0.02 -0.02 0.09 INVSPS91 0.006 0.05 -0.12 0.14
Correlations DE91 FASPS91 0.36 INVSPS91 -0.17
Number of Firms: 28 with DE < Average 1991 DE
Mean Std Dev Minimum Maximum ÄNEPS 91 0.01 0.07 -0.14 0.16 DE91 0.06 0.08 0.00 0.27

34
FASPS91 0.00 0.004 -0.007 0.01 INVSPS91 0.03 0.07 -0.001 0.32
Correlations DE91 FASPS91 0.45 INVSPS91 -0.05

35
Sample 1990: 44 Firms
Number of Firms: 15 with DE > Average 1990 DE
Mean Std Dev Minimum Maximum ÄNEPS 90 -0.02 0.22 -0.65 0.31 DE90 0.68 0.34 0.34 1.30 FASPS90 0.00 0.002 -0.005 0.004 INVSPS90 0.036 0.05 -0.014 0.15
Correlations DE90 FASPS90 0.17 INVSPS90 -0.30
Number of Firms: 29 with DE < Average 1990 DE
Mean Std Dev Minimum Maximum ÄNEPS 90 0.01 0.14 -0.39 0.34 DE90 0.07 0.09 0.00 0.26 FASPS90 0.00 0.01 -0.004 0.035 INVSPS90 0.026 0.04 -0.007 0.13
Correlations DE90 FASPS90 0.08 INVSPS90 0.06
Sample 1989: 44 Firms
Number of Firms: 15 with DE > Average 1989 DE
Mean Std Dev Minimum Maximum ÄNEPS 89 0.01 0.15 -0.49 0.19 DE89 0.59 0.28 0.29 1.10 FASPS89 0.002 0.008 -0.007 0.03 INVSPS89 0.06 0.10 -0.019 0.29
Correlations DE89 FASPS89 -0.17 INVSPS89 0.13
Number of Firms: 29 with DE < Average 1989 DE
Mean Std Dev Minimum Maximum ÄNEPS 89 0.04 0.17 -0.31 0.52 DE89 0.06 0.09 0.00 0.26 FASPS89 0.001 0.003 -0.005 0.01 INVSPS89 0.046 0.13 -0.002 0.68
Correlations

36
DE89 FASPS89 -0.21 INVSPS89 -0.14
*See Notes to Table 1.
37
Table 5
Selected Regression Results for theEarnings Smoothing and Debt Equity Hypotheses*
Sample 1989-91: Three Year Averages/Changes for all 44 Firms
Dependent variable: ASPS Number of Firms: 44
Adjusted R-squared = .76 F-statistic (zero slopes) = 28.75
Estimated Standard Variable Coefficient Error t-statistic C -1.11 .419 -2.65 ÄNEPS -.175 .124 -1.41 LTA91 .061 .022 2.76 RASS91 .428 .482 0.88 DE -.065 .056 -1.16 DROB 1.622 .201 8.05
___________________________________________________________________________
Sample 1989-91: Three Year Averages/Changes
Dependent variable: ASPS Number of Firms: 28 with ÄNEPS > 0
Adjusted R-squared = .917912 F-statistic (zero slopes) = 76.4787
Estimated Standard Variable Coefficient Error t-statistic C -.970 .312 -3.11 ÄNEPS .339 .144 2.35 LTA91 .052 .016 3.22 DE -.073 .062 -1.19 DROB .916 .211 4.33
Dependent variable: ASPS Number of Firms: 16 with ÄNEPS < 0
Adjusted R-squared = .507602 F-statistic (zero slopes) = 4.86578
Estimated Standard Variable Coefficient Error t-statistic C -1.67 .702 -2.38 ÄNEPS -.552 .225 -2.45 LTA91 .090 .037 2.42 RASS91 -2.25 1.29 -1.73 DE -.125 .091 -1.36
Sample 1989-91: Three Year Averages/Changes
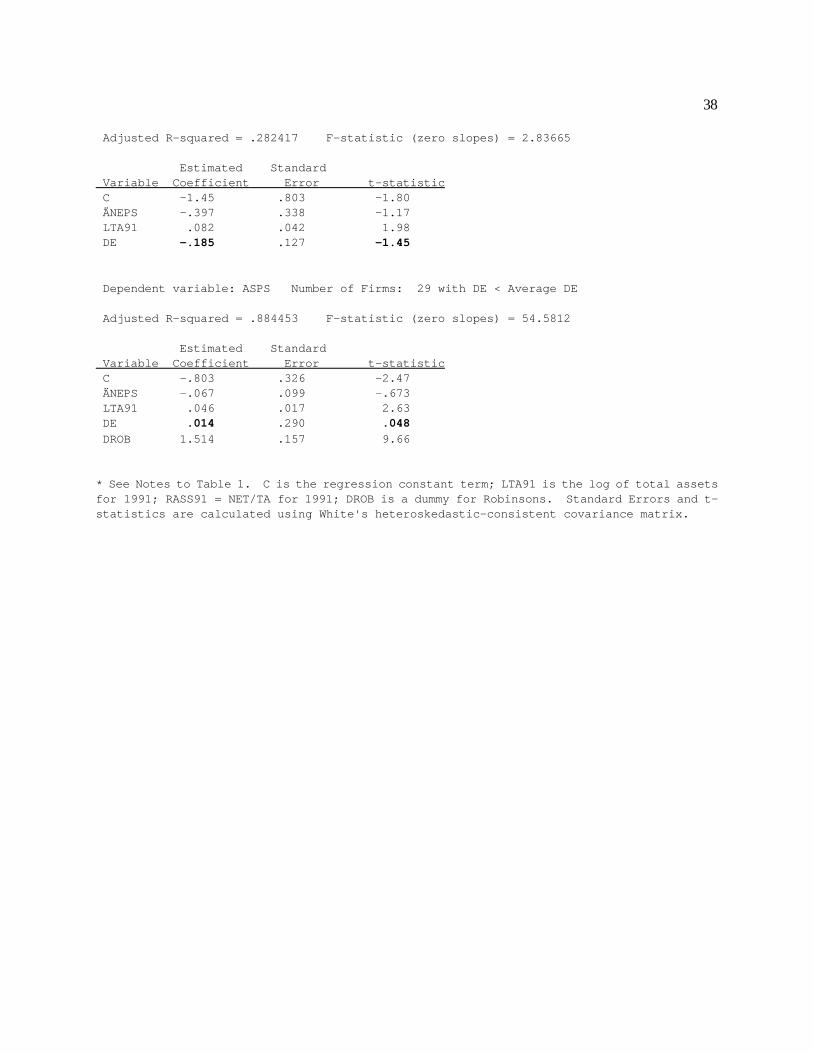
Dependent variable: ASPS Number of Firms: 15 with DE > Average DE
38
Adjusted R-squared = .282417 F-statistic (zero slopes) = 2.83665
Estimated Standard Variable Coefficient Error t-statistic C -1.45 .803 -1.80 ÄNEPS -.397 .338 -1.17 LTA91 .082 .042 1.98 DE -.185 .127 -1.45
Dependent variable: ASPS Number of Firms: 29 with DE < Average DE
Adjusted R-squared = .884453 F-statistic (zero slopes) = 54.5812
Estimated Standard Variable Coefficient Error t-statistic C -.803 .326 -2.47 ÄNEPS -.067 .099 -.673 LTA91 .046 .017 2.63 DE .014 .290 .048 DROB 1.514 .157 9.66
* See Notes to Table 1. C is the regression constant term; LTA91 is the log of total assetsfor 1991; RASS91 = NET/TA for 1991; DROB is a dummy for Robinsons. Standard Errors and t-statistics are calculated using White's heteroskedastic-consistent covariance matrix.

39
1. In a study of 243 listed Singaporean and Malaysian companies, Chan (1987) finds that upward
revaluations account for 91% of the total revaluations occurring from 1980 to 1984.
2. NEPS is an essential variable in the empirical results to be presented. The calculation of this variable
involved starting with reported the earnings per share (EPS) and then working back to the various income
statement items which are associated with gains and losses from sales. For example, the asset may be
included as an extraordinary or as an above-the-line profit or loss on investment asset sale.
3. These factors include the economic and financial strength of the sample firms, as well as a general
management preference for holding sizable reserves of investment assets, as reflected in the relationship
between CA and TA given in Table 1. Bartov (1993) did recognize the enhanced managerial flexibility of
using investments versus fixed assets to smooth income, but found the difference between the two types
of asset sales to be "inconclusive".
4. This position is based on a heuristic interpretation of the cash flow characteristics of firms with
increasing and decreasing NEPS. The argument underlying H1 is predicated on the implicit assumption
that firms with increasing NEPS have less incentive to sell assets to finance growth. It is plausible that
rapidly growing firms, even those with increasing NEPS, will experience substantial cash flow needs to
finance growth. Incentives for asset sales are related to both cash-requirements and cash-generation.
The arguments being advanced focus on the cash-generation incentives. There are certain
characteristics of Singaporean firms which come into play here. To be listed on the SES Mainboard,
Singaporean firms have to have a five year record of sustained profits. Hence, the firms are relatively
mature with an established capital asset base. (There is a SESDAQ in Singapore but such firms are not
included in the sample). Heuristically, such firms which are fast-growing (NEPS(t) – NEPS(t-1) > 0)
typically generate more cash than can be rapidly reinvested in the firm. This results in a balance sheet
NOTES

40
that is deep in near-cash investment assets. This also creates a reservoir of investment funds which can
be sold when earnings experience an unanticipated downturn (NEPS(t) – NEPS(t-1) < 0). In effect, the
cash requirements of fast growing firms can typically be more than satisfied out of retained earnings.
Hence, most asset sales decisions for these type of firms are impacted by investment considerations and
are unaffected by earnings smoothing incentives. This leaves declining NEPS firms to engage in earnings
smoothing, which is the basic point that the paper examines.
5. This version of the debt-equity hypothesis ignores the possibility that debt covenants may, and often do,
have restrictions on the sale of assets which, if taken literally, implies that asset sales will be negatively
correlated with debt-equity ratios.
6. Bartov (1993) differs fundamentally from this study in the use of market values to scale variables.
The selection of this scaling variable is unusual for a study on the impact of accounting numbers on asset
sales decisions. For example, the earnings variable in Bartov (1993) is not accounting earnings but,
rather, is directly related to the price-earnings ratio. This has substantive implications for interpretation of
the empirical results. This study uses number of shares, which converts variables to a per-share basis. It
is not clear which method of scaling is superior. One advantage of using per-share is comparability with
other studies, where the use of per-share data is more common. There is also the problem of selecting
the 'correct' stock price using Bartov's method. Under the efficient markets hypothesis, stock prices will
reflect information available at that time. Unless the accounting data and the stock prices are sampled at
precisely the same time, there may be a significant move in stock prices which has transpired since the
release of the accounting information. This disparity does not happen when per share data is used.
7. Other proxies for size, e.g, the log of total assets per share, were used without an appreciable change
in the results.
8. It is definitely possible that the Bartov sample contained a number of financially unhealthy firms. This

41
is consistent with the conclusion about asset sales by U.S. firms reached by Lang et al. (1995) who argue
that "firms selling assets have high leverage and/or poor performance".