the test results for deflection is much higher than the...
TRANSCRIPT

Review of the FEA and Testing Results for the 18-Turn Beam -with another approach to derive the material property E & G
Introduction
The measured modular coil deflections for flexural test of the 18-turn straight beam [1] are much higher than the FEA results that were computed on the basis of assumed material properties [2]. The test data are the measured values from the actual beam deflections and the FEA results are calculated from the sound analytical theory. They should be very close if the measurements and the analytical assumptions were doing correctly. The purpose of this review is to comment on the test and FEA results and to find an approach to evaluate the equivalent modulus of the modular coil.
Possible errors
To find out the discrepancy between the analytical and the test results, the following three areas will be examined:
A) The possible errors of the finite element model are from the assumed material properties and the beam shape. Here are the FEA input data [2]:
Conductor is 0.500 x 0.625 inches Turn insulation is 0.03 inches Ground wrap is 0.03 inches E of conductor is 9.5E6 psi E of turn insulation is 1.5E6 psi E of ground wrap is 1.5E6 psi Poissons’ ratio is 0.31
The FEA model consists of conductors, turn insulations, and ground wrap. In the analysis, the material properties were assumed to be isotropic. The analytical results are mainly determined by the assumed modulus values. Are the assumed values of material properties correct? Does the assumption of isotropic material property produce reasonable results?
B) The possible errors from the test are the accuracy of test instruments, the testing arrangement, and the reading and interpretation of the measured data. Do the load, extensometer, and reading instruments calibrated before the testing? Do any additional deformations due to the test setup exist during the test? What is the degree of accuracy of the instrument reading with respect to the actual deformation?
C) The another possibility is the precision of the test specimen. Are the beam dimensions and VPI process flawless? Does the beam have perfect bonding between components so that no nonlinear effects such as surface sliding occur during the test?

Discussions
1) Beam Shape and Conductor Material property from R & D Results
The total depth of beam modelled in the FEA is 5.1”, which is smaller than the actual beam height of 5.58”. The lower depth in beam shall predict a higher deflection, not the smaller deflection.
Since the isotropic material properties were utilized in the analysis, the shear modulus was automatically determined by the assumed Poissons’ ratio. A series of tests has been conducted by the Composite Technology Development, Inc. in 2003 [3] for the resin impregnated single conductor that comprised of four 0.3125” by 0.250” braided copper and wound with glass/kapton turn insulation. The test results were summarized in a report by Zatz [4] showing the dissimilarity in the elastic moduli due to axial compression, axial tension, and flexural bending. The standard deviations in the same group of test results are found to be large. The moduli also varied with the testing temperature but inconsistency in the trend with respect to the temperature ranges. Table 1 shows the modulus of elasticity caused by different loading conditions at the elected temperature of 150°K.
Table 1: Modulus of Coil Conductor at 150°K
Loading Temperature(K) Modulus(Mpsi)Axial Compression 150 7.9Axial Tension 150 14.1Flexural (Flatwise) 150 4.3Flexural (Edgewise) 150 4.1
The flexural moduli were tested following ASTM D790 in a three-point bending configuration. The specimens were tested in two different directions designated as “flatwise”, which has bending about its weaker axis with a depth/span ratio of 12.3, and “edgewise”, which has bending about its stiffer axis with a depth/span ratio of 10.3. The flexural modulus that involved the combining effects of axial modulus and shear modulus was calculated from the following equation [3], an equivalent modulus for bending moment:
EB=L3m/4 bd3
Where:EB = modulus of elasticity in bendingL = support spanb = width of specimen d = depth of specimenm = slope of the tangent to the initial straight-line portion of the load-deflection curve
In view of the less lateral stiffness under the axial compression due to the twisted copper strands, the tension modulus was expected to be larger than the compression modulus. For similar reason, the conductor is stiffer in the axial direction and softer in the transverse direction. If the beam is not too long, the deflection of beam will be produced by the bending moment and by the shear force, in the form of a mutual sliding of adjacent cross sections along each other. A better way of making the FEA model is to employ the orthotropic material property, from which a more accurate shear modulus can be entered for the conductor. Even with the orthotropic material property, it is still not able to simulate the actual property of the modular coil because of

the dissimilarity material properties in the axial tension and the axial compression.
2) Shear modulus in the Conductor
Lower modulus in the flexural test indicated the effect of shear deformation, which is caused by the shear modulus G of the composite modular coil. Because of the composite action in the modular coil, the shear modulus of conductor is considered to be smaller than the shear modulus of the solid copper conductor. The use of axial modulus as the isotropic elastic modulus will overestimate the stiffness of beam due to underestimate the shear deformation in the flexural analysis.
The short beam flexural tests (depth/span ratio of about 5.0) for the 2x2 modular coil bundles [3] revealed even smaller flexural moduli that ranged from 2.3 Mpsi at 76°K to 1.1 Mpsi at 295°K. The results pointed out that the shear modulus will be small at the room temperature. The conclusion was further proved by the plug longitudinal shear tests [5] of short conductor specimens that showed a very small average shear modulus of 0.139 Mpsi at the room temperature.
3) FEA Runs for Some Selected Material Properties
Assuming that the modulus of elasticity of the turn insulation and ground wrap is 1.5 Mpsi and a Poisson’s ratio is 0.31, four FEA runs were selected in Table 2 to test the changes of the conductor material properties due to 4000 pounds of center load.
Table 2: Material Property Selected for FEA Runs
The FEA model and results of Run No.1 has been documented in the previous report [2]. In the rectangular coordinate system, y-axis is in the vertical direction and z-axis is in the longitudinal direction of the beam. Nuxy is the minor Poissons’ ratio in ANSYS. The use of constant shear modulus G intends to simplify the parameters since the vertical shear deformation is primarily determined by the shear modulus Gyz. A 4000 lb concentrated load was applied on top of the beam at the mid-span within an one inch area. Table 3 illustrates the maximum vertical deflections at the mid-span, quarter span, and the maximum/minimum axial stresses that occur in the mid-span of the conductor. The stresses in the insulation were lower because of lower modulus.

Table 3: Vertical Displacements and Max./Min. Axial Stresses
Comparing the material input and the resulting structural response, several remarks may be drawn as follows:
Lowering shear modulus will increase both the vertical deformations and the axial stresses (comparing Runs #1 and #2)
Lowering elastic modulus will increase the vertical deformations but decrease the axial stresses in a less fraction (comparing Runs #2 and #3
Lower elastic modulus that perpendicular to the longitudinal direction will have negligible effects on the vertical deformations and the axial stresses (comparing Runs #2 and #4)
4) FEA Runs for Smeared Material Property
If the smeared material properties will be utilized for the analysis of the modular coil, it will need the equivalent material properties E and G for the modular coil model. Four more ANSYS runs were carried out using the identical material property for all components as shown in Table 4. The isotropic material property of the equivalent E in Run #5 was adopted from the calculated value in the test report [1], based on the central deflection of 0.11” and a central load of 5000 lb. The 3.04 Mpsi equivalent E was calculated by considering only the action of bending moment that caused the deflection.
Table 4: Smeared Material Property Selected for all Components
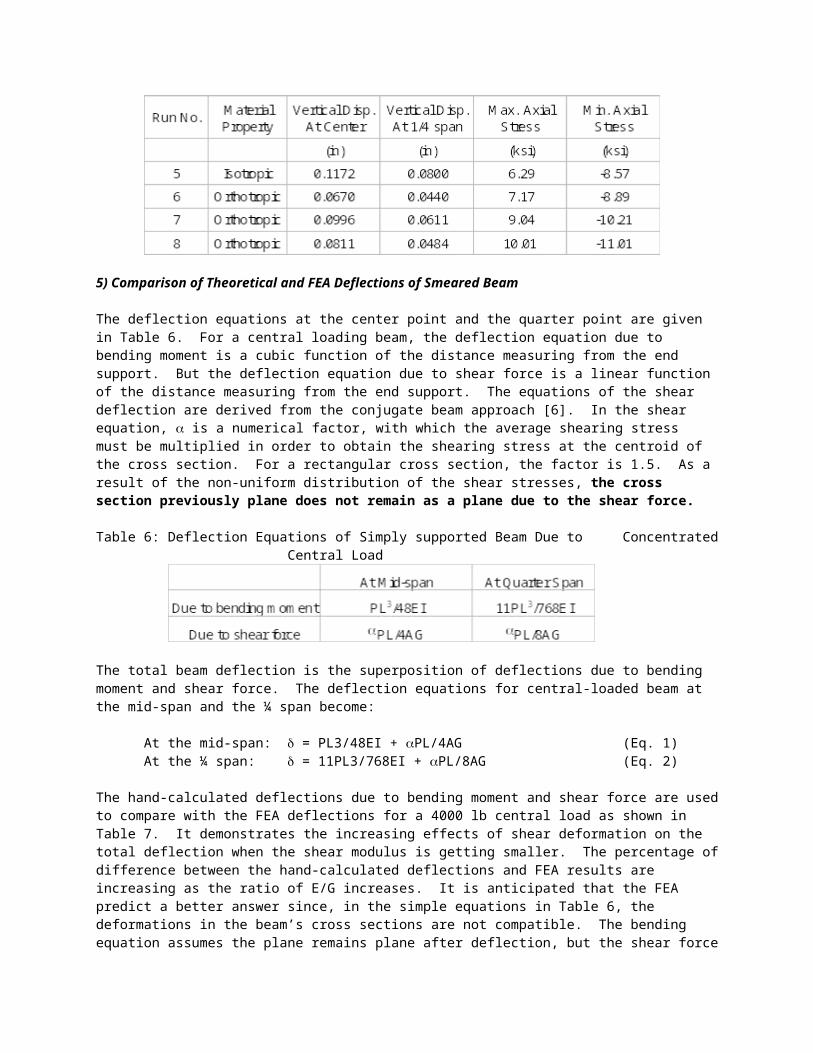
Table 5 illustrates the maximum vertical deflections and the maximum/minimum axial stresses for FEA runs #5 through #8, under a central loading of 4000 lb. The change of stresses and deflections has the similar trend as described in the previous section. The FEA results will be used to compare with the simple theoretical equations in the next section.
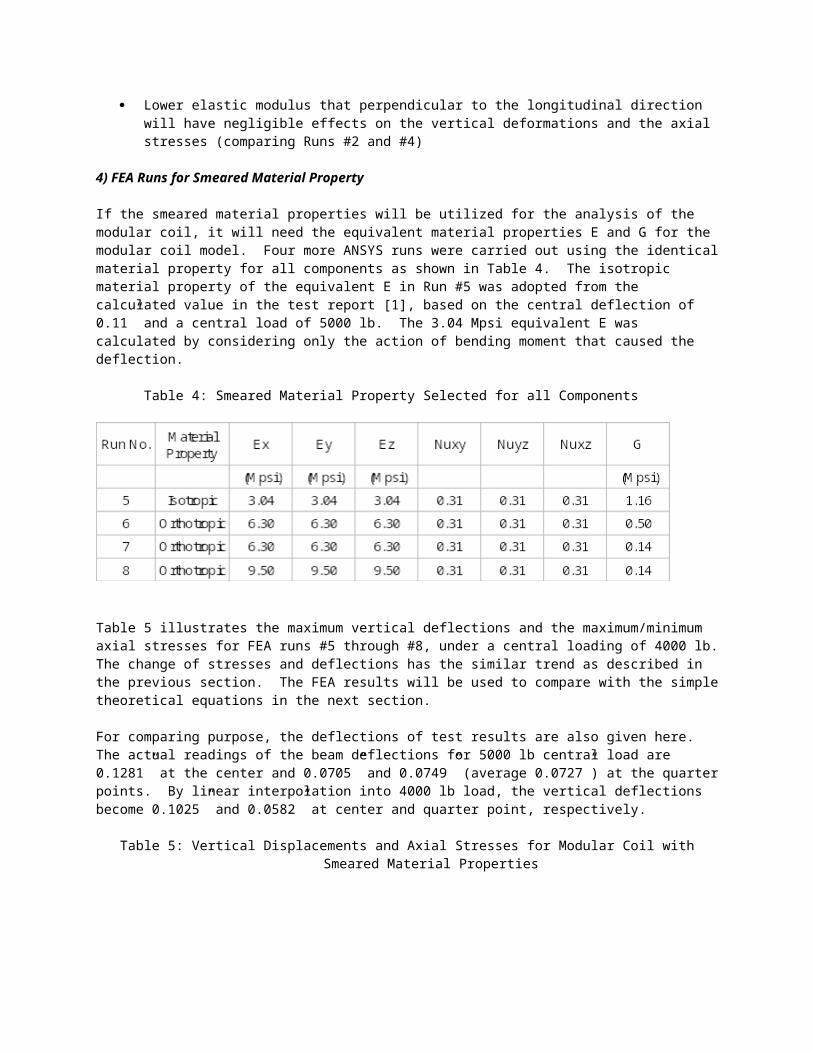
For comparing purpose, the deflections of test results are also given here. The actual readings of the beam deflections for 5000 lb central load are 0.1281” at the center and 0.0705” and 0.0749” (average 0.0727”) at the quarter points. By linear interpolation into 4000 lb load, the vertical deflections become 0.1025” and 0.0582” at center and quarter point, respectively.
Table 5: Vertical Displacements and Axial Stresses for Modular Coil with Smeared Material Properties
5) Comparison of Theoretical and FEA Deflections of Smeared Beam
The deflection equations at the center point and the quarter point are given in Table 6. For a central loading beam, the deflection equation due to bending moment is a cubic function of the distance measuring from the end support. But the deflection equation due to shear force is a linear function of the distance measuring from the end support. The equations of the shear deflection are derived from the conjugate beam approach [6]. In the shear equation, is a numerical factor, with which the average shearing stress must be multiplied in order to obtain the shearing stress at the centroid of the cross section. For a rectangular cross section, the factor is 1.5. As a result of the non-uniform distribution of the shear stresses, the cross section previously plane does not remain as a plane due to the shear force.
Table 6: Deflection Equations of Simply supported Beam Due to Concentrated Central Load
The total beam deflection is the superposition of deflections due to bending moment and shear force. The deflection equations for central-loaded beam at the mid-span and the ¼ span become:
At the mid-span: = PL3/48EI + PL/4AG (Eq. 1)At the ¼ span: = 11PL3/768EI + PL/8AG (Eq. 2)
The hand-calculated deflections due to bending moment and shear force are used to compare with the FEA deflections for a 4000 lb central load as shown in Table 7. It demonstrates the increasing effects of shear deformation on the total deflection when the shear modulus is getting smaller. The percentage of difference between the hand-calculated deflections and FEA results are increasing as the ratio of E/G increases. It is anticipated that the FEA predict a better answer since, in the simple equations in Table 6, the
deformations in the beam’s cross sections are not compatible. The bending equation assumes the plane remains plane after deflection, but the shear force will deform cross-sectional planes into curved surfaces. In addition, the simple equations in Table 6 neglect the effects of Poissons’ ratio in the material property. Figure 1 plots the deviations of deflections from the FEA results at the mid-span and the quarter span due to E/G ratios.
Table 7: Comparison of the Calculated and FEA Deflections
Theoretical Def. at center FEA Def. Theoretical Def. at ¼ Span FEA Def.
Run No.
Due to Bending
Due to Shear Total
Vertical Def. At Center
Diff. Due to Bending
Due to Shear Total
Vertical Def. At 1/4
spanDiff.
(in) (in) (in) (in) (%) (in) (in) (in) (in) (%)
5 0.1110 0.0071 0.1181 0.1172 0.7 0.0763 0.0035 0.0798 0.0800 -0.2
6 0.0536 0.0165 0.0700 0.0670 4.5 0.0368 0.0082 0.0450 0.0440 2.3
7 0.0536 0.0588 0.1123 0.0996 12.8 0.0368 0.0294 0.0662 0.0611 8.3
8 0.0355 0.0588 0.0943 0.0811 16.3 0.0244 0.0294 0.0538 0.0484 11.2
Figure 1: Deflection Deviations from FEA Results
-2.00.02.04.06.08.0
10.012.014.016.018.0
2.62 12.60 45.00 67.86
Ratio of E/G
Devi
atio
n (%
)
Midspan
Quarter Span
6) Evaluating Equivalent Material Properties from the FEA Results
The deflection equations 1 and 2 may be used to evaluate the equivalent elastic moduli E and G, assuming a smeared property in the beam cross sections. Table 7 provides the FEA deflections at the two designated points. By assuming the two unknown variables E and G and substituting the loading, beam span, and sectional properties into the Equations 1 and 2, the resulting E and G that match the FEA deflections are shown in Table 8. The ratios of the computed modulus to the actual modulus are also shown in the Table.
Table 8: Comparison of Computed and FEA Input Modulus

The computed modulus E is slightly smaller than the actual E while the computed shear modulus G is large than the actual shear modulus. Figure 2 plots the ratio of computed modulus to the actual modules. Except the values of shear modulus in the E/G range between 0 and 10, the linear interpolation of the ratio will provide good accuracy.
Fig. 2: Ratios of Computed Modulus to FEA Input Modulus
0.60
0.80
1.00
1.20
1.40
1.60
1.80
2.00
2.20
2.40
1.45 1.50 1.55 1.60 1.65 1.70 1.75
Ratio of Center Deflection to 1/4 Span Deflection
Mod
ulus
Rat
io
Ecomp / Efea Gcomp / Gfea
6) Evaluating Equivalent Material Properties from the Test Data
Equations 1 and 2 with Table 8 and Figure 2 provide an approach to predict the equivalent elastic moduli E and G for the testing beam, if a smeared property will be assumed in the beam cross sections.

The beam test data presents a list of deflections at the corresponding locations. At the peak of load, the deflections are 0.1281” at the center and 0.0705” and 0.0749” (average 0.0727”) at the quarter points for a 5000 lb central load. Substituting the loading, beam span, and sectional properties, the equations become:
0.1281 = 421739/E + 10284/G (eq. 3)0.0727 = 289945/E + 5142/G (eq. 4)
Solving the above two equations yields the equivalent computed moduli as:
E = 9.1417 MpsiG = 0.1255 Mpsi
The ratio of the central deflection to quarter-span deflection is 1.76. From the modification factors provided in Fig.2, the computed E will be divided by a factor of 0.80 while the computed G will be divided by a factor of 1.5. The modified modulus of elasticity becomes:
E = 11.427 MpsiG = 0.0837 Mpsi
To check the appraised values of equivalent E and G, the appraised values were used as input for the FEA model to evaluate and compare the beam deflections. A concentrated load of 5000 lb was applied at the beam center. Table 8 shows the smeared material property input. The FEA results for stresses and deflections are summarized in Table 9. In Table 9, Run #11 shows the differences to the test deflections are 1.72% and 2.34% for the center and quarter points, respectively.
Table 8: Smeared Material Property Selected for all Components
Table 9: Vertical Displacements and Axial Stresses for Modular Coil with Smeared Material Properties
7) Experiment Setup and Instruments Calibrations
It was assumed that all the testing instruments had been calibrated for the reading before the test.

The test beam was held at ends of beam by clevis loading frames which were supported by hanging rods and W12x26 WF beam on the top. The LVDTs were mounted between the LVDT support and the beam specimen to measure the deflections along the beam at 5 locations. It shows that at the maximum stroke of 0.2011” with maximum load of 4994.8 lb, the average LVDT readings at supports are about 0.04”, which could be caused by the displacements of hanger rods and top WF-beam. These deflections at the beam supports have been corrected to eliminate the effects of the end deflections.
It is important that the position of LVDT support keeps on the same level. If the LVDT are mounted on the clevis loading frames, the additional deformation due to the clevis loading frames should be taken in to consideration.
8) Accuracy of Experiment Readings
A look at the sample reading of test data as in Table 10 shows the actual deflections may have reading variation of as much as 0.0057”, which is 0.04684” minus 0.04115”. This is about 13.8% at the load level of 3200 lb. For the smaller load, the effects of reading inaccuracy may be larger. In the Table 10, the red deflection denotes the deflection at one of the quarter points of the beam while the white deflection denotes the deflection at another quarter point.
Table 10: Sample Test Data Readings
stroke load actual red actual white[in] [lb] deflection deflection0.135345 3198.85 0.04328 0.047490.135345 3200.07 0.04684 0.045400.135345 3202.82 0.04115 0.04792
The measured beam deflections at the center and quarter points are illustrated in Figure 3 with an increment of 500 lb up to 5000 lb. The deflections at the quarter span are the average readings of the right and left quarter points.

Fig. 3: Deflections Measured at Center and Quarter points
-0.02
0.00
0.02
0.04
0.06
0.08
0.10
0.12
0.14
0 1000 2000 3000 4000 5000 6000
Central Load (lb)
Defle
ctio
ns (i
n)
center- rising load 1/4 point- rising loadcenter- falling load 1/4 point- falling load
The load-deflection curves look linear up to 5000 lb load. There are no noticeable permanent deflections found at the end of loading. However, the large deviation from the smooth curve at 2500 lb load point indicates possible errors that may come from the accuracy of the reading device or the testing setup. The test data [1] shows the load increment to be 0.3052-lb during the test. The sample data of deflection readings near 2500-lb load are as shown in Table 11. The end deflections have been adjusted in the actual deflections in the Table 11.
At the 2499.695-lb loading step, the actual center deflection decreases as the loading increase. This could be due to the fact that the reading device has a variation of as much as 0.006” as demonstrated in the test data in Table 10. Table 11 also shows the negative values of quarter-point deflections at the load step of 2503.052 lb. The reading is certainly not reliable not only because the values should not be negative but also the magnitudes of deflections at the quarter points should be smaller than the magnitude of deflection at the mid-span.
Table 11: Beam Deflections near Load level of 2500 lb

9) Test Specimen
Theoretically, deflections at two the quarter points of the beam should be identical. The actual deflections (see Tables 10 and 11) reveal the differences that are in general within the reading tolerance. At the maximum load of 5000 lb, the deflections at the quarter points are 0.0705” for the left-hand side and 0.0749” for the right-hand side. As the difference is within the reading tolerance, it is difficult to question that the beam is not uniform along the length.
Except the center deflections between load range of 2500-lb and 4500-lb, Figure 3 show slight difference in the deflections during loading and unloading, but are within the reading tolerance. As the load-deflection curves look linear up to 5000 lb load there are no evidences indicating any nonlinear behaviors in the beam.
Assessment of Equivalent Material Properties The above discussions presented an approach to estimate the orthotropic properties of the modular coil on the basis of the measured beam deflections. The procedures are:
1) Select deflections at center and quarter points for a load range2) Solve for Equations 1 and 23) Modify shear modulus according to the ratio of deflections between mid-
span and quarter span
To minimize the effects of reading tolerance, it is better to pick the loading and deflection that are as large as possible. At the maximum load of 5000 lb, the deflection readings are 0.1281” at the center and 0.0705” and 0.0749” (average 0.0727”) at the quarter. When the loading went down to zero, the deflection readings are -0.0002” at the center and -0.0007” and -0.0011” (average -0.0009”) at the quarter. The actual deflections become:
0.1281” + 0.0002” = 0.1283” at the mid-span0.0727” + 0.0009” = 0.0736” at the quarter span
Substituting the deflections into Equations 1 and 2, the equivalent moduli turn out to be:

E = 8.368 MpsiG = 0.132 Mpsi
The ratio of deflections between mid-span and quarter span is 1.74. From the modification factors provided in Fig.2, the computed E will be divided by a factor of 0.80 while the computed G will be divided by a factor of 1.5. The modified modulus of elasticity becomes 10.460 Mpsi for E and 0.088 Mpsi for G. This material property was employed in the FEA model and the analysis yielded:
Deflection at mid-span – 0.1295” (0.9% from 0.1283”)Deflection at quarter span – 0.0746” (1.4% from 0.0736”)
Effects of Deflection Variation on Equivalent Material Properties
The test reading has been shown a possible variation of as much as 0.006”. The following study intends to observe how thus variation affects the calculated moduli E and G. If the deflection at center or at the quarter is changed by a small value of 0.002”, which is about one third of the possible reading deviation, the calculated modulus will be as in Table 12 for a center load of 5000lb.
Table 12: Muduli E and G Calculated from Variation of Center Deflection c and Quarter Span Deflection q
The increase of center deflection c results in the increase of E value and decrease of G value. In a different way, the increase of quarter-span deflection q results in the decrease of E value and increase of G value. Table 12 also shows that the calculated modulus is very sensitive to the deflection variation. For the same variation value, the discrepancy in the center point deflection produce smaller effects on the modulus of elasticity than the discrepancy in the quarter point deflection.
Conclusions
The following conclusions are obtained in this review:
1) Orthotropic material property should be used for the smeared material property of the beam. The use of axial modulus from R&D tests as the isotropic elastic modulus will overestimate the stiffness of beam.
2) The shear modulus of the modular coil test beam is less than 0.15 Mpsi, either from the test result [5] or predicted from the beam deflection.
3) Lowering shear modulus will increase both the vertical deformations and the axial stresses because shear deformation forms curve surface.
4) Lowering elastic modulus will increase the vertical deformations but decrease the axial stresses.
5) A reasonable approach is derived to predict the material property, on the basis of beam deflections at the mid-span and quarter-span points.

6) Based on the measured beam deflections, the estimated equivalent modulus of elasticity are E = 10.46 Mpsi and G = 0.088 Mpsi.
7) The test deflection reading may have a variation of as high as 0.006”.8) The estimated modulus of elasticity is very sensitive to the magnitude
of measured deflections.9) There are no obvious evidences indicating any nonlinear behaviors in the
beam.10) Strain gages may be added to read the strains in the beam for
additional check and comparison.
References
[1] “9nov04 beam test results.xls”, Brad Nelson’s email attachment, 11/9/2004
[2] Fan, H.M.., “Finite Element Analysis of the 18 Turn Beam”, email attachment, 11/5/2004
[3] Fabian, Paul E., Test Program to Determine the Mechanical and Thermal Properties of the Epoxy/Insulation System for the NCSX Modular Ciols, Subcontract S-04353-G Report, 11/21/2003
[4] Zatz, I., “Interim NCSX Modular Coil Material Properties and Allowables”, NCSX R&D Reports, 031212_MatProps_140_IJZ, 12/12/2003
[5] Kozub, T., NCSX Composite Coil Testing, NCSX Engineering R & D Results, 3/22/2004
[6] Timoshenko, S., “Strength of Materials, Part 1”, Third Edition, 19555