the temporary assistance for (tanf) to
TRANSCRIPT

The Temporary Assistance for
Needy Families (TANF) Block Grant:
Responses to Frequently Asked Questions
Updated December 14, 2021
Congressional Research Service
https://crsreports.congress.gov
RL32760

Congressional Research Service
SUMMARY
The Temporary Assistance for Needy Families (TANF) Block Grant: Responses to Frequently Asked Questions The Temporary Assistance for Needy Families (TANF) block grant funds a wide range of
benefits and services for low-income families with children. TANF was created in the Personal
Responsibility and Work Opportunity Act of 1996 (P.L. 104-193). This report responds to some
frequently asked questions about TANF; it does not describe TANF rules (see, instead, CRS
Report RL32748, The Temporary Assistance for Needy Families (TANF) Block Grant: A Primer
on TANF Financing and Federal Requirements, by Gene Falk).
TANF Funding and Expenditures TANF provides fixed funding for the 50 states, the District of Columbia, the territories (Puerto Rico, Guam, and the U.S.
Virgin Islands), and American Indian tribes. The basic block grant totals $16.5 billion per year. States are also required in
total to contribute, from their own funds, at least $10.3 billion annually under a maintenance-of-effort (MOE) requirement.
The basic block grant is not adjusted for changes in circumstances (e.g., inflation, population) over time. Adjusted for
inflation, in FY2021, the TANF basic block grant was 40% below what its value was in FY1997.
Though TANF is best known for funding basic assistance payments for needy families with children, the block grant and
MOE funds are used for a wide variety of benefits and activities. In FY2020, expenditures on basic assistance totaled $7.1
billion—22% of total federal TANF and MOE dollars. Basic assistance is often—but not exclusively—paid as cash and on an
ongoing basis (monthly). In addition to funding basic assistance, TANF also contributes funds for child care, employment
services (for both assistance recipients and others), state refundable tax credits for low-income families, pre-kindergarten and
Head Start programs, and services for children who have been, or are at risk of being, abused and neglected. Some states also
count expenditures in pre-kindergarten programs toward the MOE requirement.
The TANF Assistance Caseload A total of 1.0 million families, composed of 2.6 million recipients, received TANF- or MOE-funded assistance in November
2020. The bulk of the “recipients” were children—1.9 million in that month. The assistance caseload is heterogeneous. The
type of family once thought of as the “typical” assistance family—one with an unemployed adult recipient—accounted for
32% of all families on the rolls in FY2019. Additionally, 26% of cash assistance families had an employed adult, while 42%
of all TANF families were “child-only” and had no adult recipient. Child-only families include those with disabled adults
receiving Supplemental Security Income (SSI), adults who are nonparents (e.g., grandparents, aunts, uncles) caring for
children, and families consisting of citizen children and ineligible noncitizen parents.
Assistance Benefits TANF assistance benefit amounts are set by states. In July 2019, the maximum monthly benefit for a family of three ranged
from $1,066 in New Hampshire to $170 in Mississippi. Only New Hampshire (at 60% of the federal poverty guidelines) had
a maximum TANF assistance amount for this sized family in excess of 50% of poverty-level income.
Work Requirements TANF’s main federal work requirement is a performance measure that applies to the states. States determine the work rules
that apply to individual recipients. TANF law requires states to engage 50% of all families and 90% of two-parent families
with work-eligible individuals in work activities, though these standards can be reduced by “credits.” Therefore, the effective
standards states face are often less than the 50% or 90% targets, and vary by state. In FY2020, states achieved, on average, an
all-family participation rate of 39.6% and a two-parent rate of 46.9%. In FY2020, all jurisdictions met the all-family
participation standard, but six jurisdictions (California, Guam, Nevada, North Carolina, Rhode Island, and Wyoming) did not
meet the two-parent standard.
RL32760
December 14, 2021
Gene Falk Specialist in Social Policy
Patrick A. Landers Analyst in Social Policy
For a copy of the full report, please call 7-5700 or visit www.crs.gov.

The Temporary Assistance for Needy Families (TANF) Block Grant: FAQs
Congressional Research Service
Contents
Introduction ..................................................................................................................................... 1
Funding and Expenditures ............................................................................................................... 1
What Is TANF’s Funding Status? ............................................................................................. 1 How Are State TANF Programs Funded? ................................................................................. 1 How Much Has the Value of the TANF Basic Block Grant Changed Over Time? ................... 1 How Have States Used TANF Funds? ...................................................................................... 2 How Much of the TANF Grant Has Gone Unspent? ................................................................ 4
The Caseload ................................................................................................................................... 4
How Many Families Receive TANF- or MOE-Funded Benefits and Services? ....................... 4 How Many Families and People Currently Receive TANF- or MOE-Funded
Assistance? ............................................................................................................................. 4 How Does the Current Assistance Caseload Level Compare with Historical Levels? ............. 5 What Are the Characteristics of Families Receiving TANF Assistance? .................................. 6
TANF Cash Benefits: How Much Does a Family Receive in TANF Cash Per Month? .................. 7
TANF Work Participation Standards ............................................................................................... 8
What Is the TANF Work Participation Standard States Must Meet? ........................................ 9 Have There Been Changes in the Work Participation Rules Enacted Since the 1996
Welfare Reform Law? ............................................................................................................ 9 What Work Participation Rates Have the States Achieved?.................................................... 10
Figures
Figure 1. Uses of TANF Funds by Spending Category, FY2020 .................................................... 3
Figure 2. Number of Families Receiving Assistance, June 1959 to November 2020 ..................... 6
Figure 3. Composition of the AFDC/TANF Assistance Caseload by Family Type:
Selected Years, FY1988 to FY2019 ............................................................................................. 7
Figure 4. TANF Cash Assistance Maximum Monthly Benefit Amounts for a Single-
Parent Family with Two Children, 50 States and the District of Columbia, July 2019 ................ 8
Figure 5. National Average TANF Work Participation Rate for All Families,
FY2002-FY2020 ........................................................................................................................ 10
Tables
Table 1. TANF Basic Block Grant Funding in Nominal and Constant Dollars ............................... 2
Table 2. Families and Recipients of TANF Assistance, November 2020 ........................................ 5
Table A-1. Trends in the Cash Assistance Caseload: 1961-2019 ................................................... 12
Table A-2. Families Receiving AFDC/TANF Assistance by Family Category,
Selected Years, FY1988-FY2019 ............................................................................................... 14
Table B-1. Use of FY2020 TANF and MOE Funds by Category .................................................. 15
Table B-2. Uses of FY2020 TANF and MOE Funds by Category as a Percentage of Total
Federal TANF and State MOE Spending ................................................................................... 18

The Temporary Assistance for Needy Families (TANF) Block Grant: FAQs
Congressional Research Service
Table B-3. Unspent TANF Funds at the End of FY2020 ............................................................... 21
Table B-4. Number of Families, Recipients, Children, and Adults Receiving TANF
Assistance by Jurisdiction, November 2020 .............................................................................. 22
Table B-5. Number of Needy Families with Children Receiving Assistance
by Jurisdiction, November of Selected Years ............................................................................. 24
Table B-6. TANF Work Participation Standard and Rate, By Jurisdiction for All Families:
FY2020 ....................................................................................................................................... 26
Table B-7. TANF Work Participation Standard and Rate, By Jurisdiction, for Two-Parent
Families: FY2020 ....................................................................................................................... 28
Appendixes
Appendix A. Supplementary Tables .............................................................................................. 12
Appendix B. State Tables .............................................................................................................. 15
Contacts
Author Information ........................................................................................................................ 29

The Temporary Assistance for Needy Families (TANF) Block Grant: FAQs
Congressional Research Service 1
Introduction This report provides responses to frequently asked questions about the Temporary Assistance for
Needy Families (TANF) block grant. It is intended to serve as a quick reference to provide easy
access to information and data. Appendix A provides additional data on families receiving TANF
assistance over time. Appendix B presents a series of tables with state-level data on TANF
expenditures and families receiving assistance.
This report does not provide information on TANF program rules (for a discussion of TANF
rules, see CRS Report RL32748, The Temporary Assistance for Needy Families (TANF) Block
Grant: A Primer on TANF Financing and Federal Requirements, by Gene Falk).
Funding and Expenditures
What Is TANF’s Funding Status?
The Further Extending Government Funding Act (P.L. 117-70 ), enacted December 3, 2021, funds
TANF through February 18, 2022.
How Are State TANF Programs Funded?
TANF programs are funded through a combination of federal and state funds. In FY2018, TANF
has two federal grants to states. The bulk of the TANF funding is in a basic block grant to the
states, totaling $16.5 billion for the 50 states, the District of Columbia, Puerto Rico, Guam, the
Virgin Islands, and American Indian tribes. There is also a contingency fund available that
provides extra federal funds to states that meet certain conditions.
Additionally, states are required to expend a minimum amount of their own funds for TANF and
TANF-related activities under what is known as the maintenance of effort (MOE) requirement.
States are required to spend at least 75% of what they spent in FY1994 on TANF’s predecessor
programs. The minimum MOE amount, in total, is $10.3 billion per year for the 50 states, the
District of Columbia, and the territories.
How Much Has the Value of the TANF Basic Block Grant Changed
Over Time?
TANF was created by the Personal Responsibility and Work Opportunity Reconciliation Act of
1996 (PRWORA, P.L. 104-193). A TANF basic block grant amount—both nationally and for each
state—was established in the 1996 law. That amount for the 50 states, District of Columbia,
territories, and tribes was $16.6 billion in total. From FY1997 through FY2016, that amount
remained the same. The basic block grant was not adjusted for changes that occur over time, such
as inflation, the size of the TANF assistance caseload, or changes in the poverty population.
During this period, the real (inflation-adjusted) value of the block grant declined by one-third
(33.1%). Beginning with FY2017, the state family assistance grant was reduced by 0.33% from
its historical levels to finance TANF-related research and technical assistance. The reduced block
grant amount is $16.5 billion.
Table 1 shows the state family assistance grant, in both nominal (actual) and real (inflation-
adjusted) dollars for each year, FY1997 through FY2021. In real (inflation-adjusted) terms, the
FY2021 block grant was 40% below its value in FY1997.

The Temporary Assistance for Needy Families (TANF) Block Grant: FAQs
Congressional Research Service 2
Table 1. TANF Basic Block Grant Funding in Nominal and Constant Dollars
($ in billions)
Fiscal
Year
State Family
Assistance
Grant: 50
States, DC,
Tribes, and
Territories
State
Family
Assistance
Grant
Constant
1997 dollars
Cumulative
Percentage
Change,
Constant
1997 dollars
1997 $16.567 $16.567 —
1998 16.567 16.306 -1.6%
1999 16.567 15.991 -3.5
2000 16.567 15.498 -6.5
2001 16.567 15.020 -9.3
2002 16.567 14.792 -10.7
2003 16.567 14.456 -12.7
2004 16.567 14.124 -14.7
2005 16.567 13.680 -17.4
2006 16.567 13.190 -20.4
2007 16.567 12.893 -22.2
2008 16.567 12.345 -25.5
2009 16.567 12.382 -25.3
2010 16.567 12.182 -26.5
2011 16.567 11.859 -28.4
2012 16.567 11.585 -30.1
2013 16.567 11.394 -31.2
2014 16.567 11.217 -32.3
2015 16.567 11.179 -32.5
2016 16.567 11.082 -33.1
2017 16.512 10.820 -34.7
2018 16.512 10.564 -36.2
2019 16.512 10.372 -37.4
2020 16.512 10.224 -38.3
2021 16.512 9.893 -40.3
Source: Congressional Research Service (CRS), based on data from the U.S. Department of Health and Human
Services (HHS), Administration for Children and Families (ACF), Office of Family Assistance; and the U.S.
Department of Labor, Bureau of Labor Statistics (BLS).
Notes: Constant dollars were computed using the Consumer Price Index for all Urban Consumers (CPI-U).
How Have States Used TANF Funds?
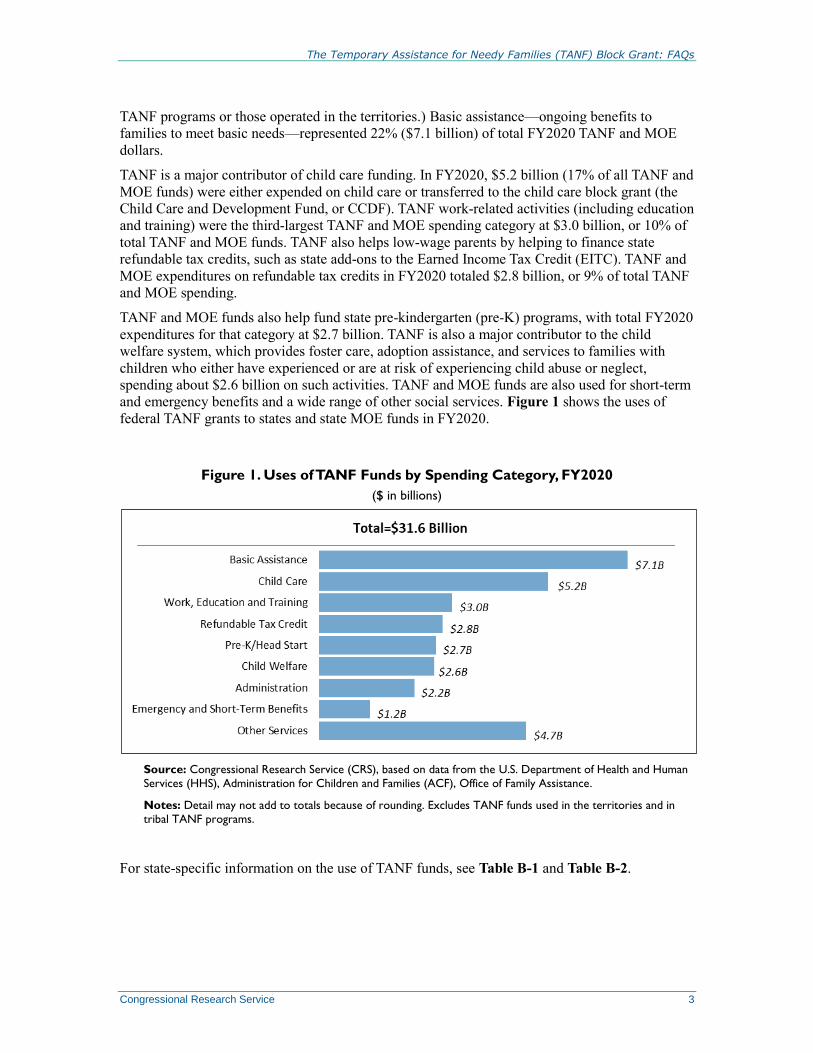
In FY2020, a total of $31.6 billion of both federal TANF and state MOE expenditures were either
expended or transferred to other block grant programs. (This total excludes expenditures in tribal
The Temporary Assistance for Needy Families (TANF) Block Grant: FAQs
Congressional Research Service 3
TANF programs or those operated in the territories.) Basic assistance—ongoing benefits to
families to meet basic needs—represented 22% ($7.1 billion) of total FY2020 TANF and MOE
dollars.
TANF is a major contributor of child care funding. In FY2020, $5.2 billion (17% of all TANF and
MOE funds) were either expended on child care or transferred to the child care block grant (the
Child Care and Development Fund, or CCDF). TANF work-related activities (including education
and training) were the third-largest TANF and MOE spending category at $3.0 billion, or 10% of
total TANF and MOE funds. TANF also helps low-wage parents by helping to finance state
refundable tax credits, such as state add-ons to the Earned Income Tax Credit (EITC). TANF and
MOE expenditures on refundable tax credits in FY2020 totaled $2.8 billion, or 9% of total TANF
and MOE spending.
TANF and MOE funds also help fund state pre-kindergarten (pre-K) programs, with total FY2020
expenditures for that category at $2.7 billion. TANF is also a major contributor to the child
welfare system, which provides foster care, adoption assistance, and services to families with
children who either have experienced or are at risk of experiencing child abuse or neglect,
spending about $2.6 billion on such activities. TANF and MOE funds are also used for short-term
and emergency benefits and a wide range of other social services. Figure 1 shows the uses of
federal TANF grants to states and state MOE funds in FY2020.
Figure 1. Uses of TANF Funds by Spending Category, FY2020
($ in billions)
Source: Congressional Research Service (CRS), based on data from the U.S. Department of Health and Human
Services (HHS), Administration for Children and Families (ACF), Office of Family Assistance.
Notes: Detail may not add to totals because of rounding. Excludes TANF funds used in the territories and in
tribal TANF programs.
For state-specific information on the use of TANF funds, see Table B-1 and Table B-2.

The Temporary Assistance for Needy Families (TANF) Block Grant: FAQs
Congressional Research Service 4
How Much of the TANF Grant Has Gone Unspent?
TANF law permits states to “reserve” unused funds without time limit. This permits flexibility in
timing of the use of TANF funds, including the ability to “save” funds for unexpected
occurrences that might increase costs (such as recessions or natural disasters).
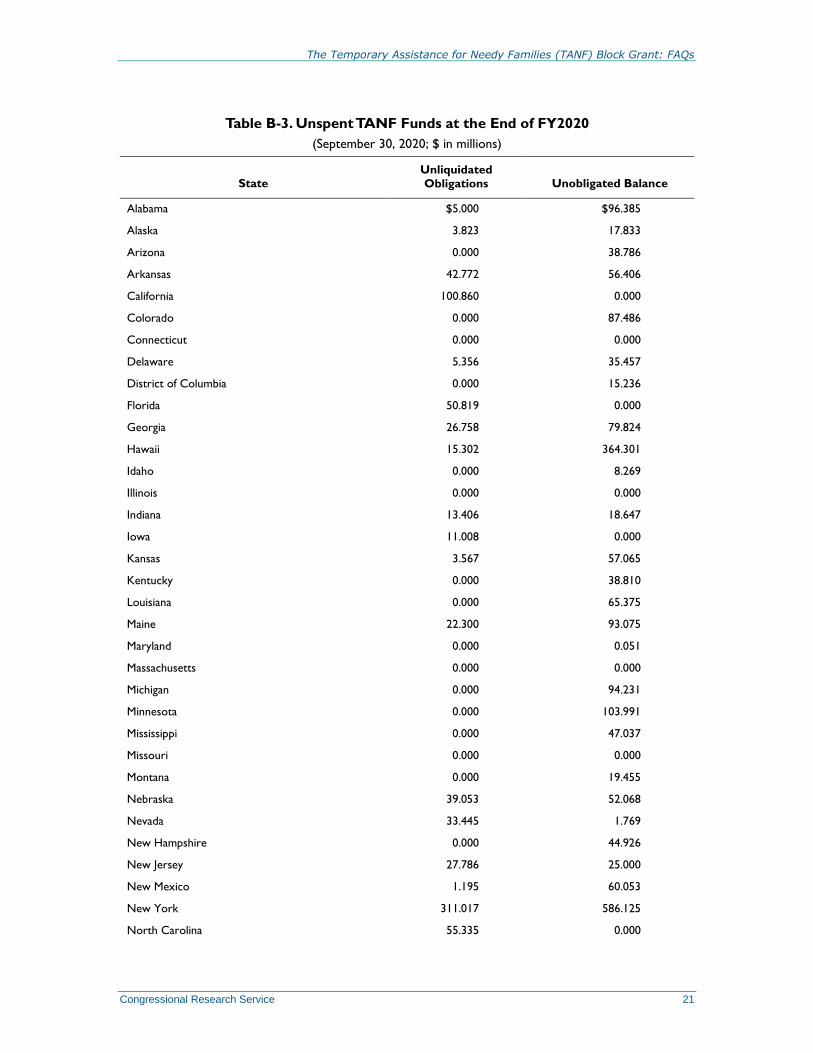
At the end of FY2020 (September 30, 2020), a total of $6.0 billion of federal TANF funding
remained neither transferred nor spent. However, some of these unspent funds represent monies
that states had already committed to spend later. Of this amount, states had made such
commitments to spend—that is, had obligated—a total of $0.9 billion. At the end of FY2020,
states had $5.2 billion of “unobligated balances.” These funds are available to states to make new
spending commitments. Table B-3 shows unspent TANF funds by state.
The Caseload
How Many Families Receive TANF- or MOE-Funded Benefits
and Services?
This number is not known. Federal TANF reporting requirements focus on families receiving
only ongoing assistance. There is no complete reporting on families receiving other TANF
benefits and services.
“Assistance” is defined as benefits provided to families to meet ongoing, basic needs.1 It is most
often paid in cash. However, some states use TANF or MOE funds to provide an “earnings
supplement” to working parents added to monthly Supplemental Nutrition Assistance Program
(SNAP) allotments. These earnings supplements are paid separately from the regular TANF cash
assistance program. Additionally, TANF MOE dollars are used to fund food assistance for
immigrants barred from regular SNAP benefits in certain states. These forms of nutrition aid meet
an ongoing need, and thus are considered TANF assistance.
As discussed in a previous section of this report, TANF basic assistance accounts for about 21%
of all TANF expenditures. Therefore, the federal reporting requirements that pertain to families
receiving assistance are likely to undercount the number of families receiving any TANF-funded
benefit or service.
How Many Families and People Currently Receive TANF- or
MOE-Funded Assistance?
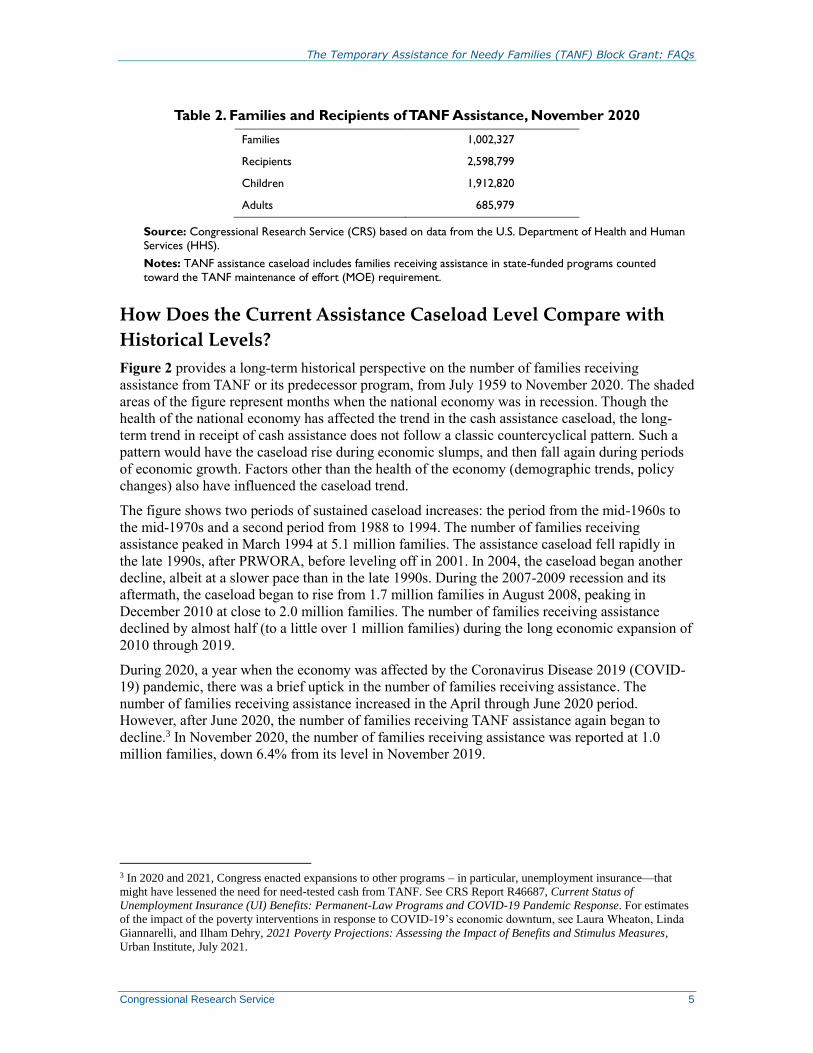
Table 2 provides assistance caseload information. A total of 1.0 million families, composed of 2.6
million recipients, received TANF- or MOE-funded assistance in November 2020.2 The bulk of
the “recipients” were children—1.9 million in that month. For state-by-state assistance caseloads,
see Table B-4.
1 The definition of TANF assistance is not in statute. However, because the statutory language has most TANF
requirements triggered by a family receiving “assistance,” the Department of Health and Human Services (HHS)
regulations define assistance at 45 C.F.R. §260.31.
2 The Department of Health and Human Services (HHS) has posted data on families and recipients of TANF assistance
through December 2020. However, the data reported for Oregon are erroneous. Therefore, this report will show TANF
assistance family and recipient data for November 2020, as the most recent data available for all states as of the update
of this report.
The Temporary Assistance for Needy Families (TANF) Block Grant: FAQs
Congressional Research Service 5
Table 2. Families and Recipients of TANF Assistance, November 2020
Families 1,002,327
Recipients 2,598,799
Children 1,912,820
Adults 685,979
Source: Congressional Research Service (CRS) based on data from the U.S. Department of Health and Human
Services (HHS).
Notes: TANF assistance caseload includes families receiving assistance in state-funded programs counted
toward the TANF maintenance of effort (MOE) requirement.
How Does the Current Assistance Caseload Level Compare with
Historical Levels?
Figure 2 provides a long-term historical perspective on the number of families receiving
assistance from TANF or its predecessor program, from July 1959 to November 2020. The shaded
areas of the figure represent months when the national economy was in recession. Though the
health of the national economy has affected the trend in the cash assistance caseload, the long-
term trend in receipt of cash assistance does not follow a classic countercyclical pattern. Such a
pattern would have the caseload rise during economic slumps, and then fall again during periods
of economic growth. Factors other than the health of the economy (demographic trends, policy
changes) also have influenced the caseload trend.
The figure shows two periods of sustained caseload increases: the period from the mid-1960s to
the mid-1970s and a second period from 1988 to 1994. The number of families receiving
assistance peaked in March 1994 at 5.1 million families. The assistance caseload fell rapidly in
the late 1990s, after PRWORA, before leveling off in 2001. In 2004, the caseload began another
decline, albeit at a slower pace than in the late 1990s. During the 2007-2009 recession and its
aftermath, the caseload began to rise from 1.7 million families in August 2008, peaking in
December 2010 at close to 2.0 million families. The number of families receiving assistance
declined by almost half (to a little over 1 million families) during the long economic expansion of
2010 through 2019.
During 2020, a year when the economy was affected by the Coronavirus Disease 2019 (COVID-
19) pandemic, there was a brief uptick in the number of families receiving assistance. The
number of families receiving assistance increased in the April through June 2020 period.
However, after June 2020, the number of families receiving TANF assistance again began to
decline.3 In November 2020, the number of families receiving assistance was reported at 1.0
million families, down 6.4% from its level in November 2019.
3 In 2020 and 2021, Congress enacted expansions to other programs – in particular, unemployment insurance—that
might have lessened the need for need-tested cash from TANF. See CRS Report R46687, Current Status of
Unemployment Insurance (UI) Benefits: Permanent-Law Programs and COVID-19 Pandemic Response. For estimates
of the impact of the poverty interventions in response to COVID-19’s economic downturn, see Laura Wheaton, Linda
Giannarelli, and Ilham Dehry, 2021 Poverty Projections: Assessing the Impact of Benefits and Stimulus Measures,
Urban Institute, July 2021.

The Temporary Assistance for Needy Families (TANF) Block Grant: FAQs
Congressional Research Service 6
Figure 2. Number of Families Receiving Assistance, June 1959 to November 2020
Source: Congressional Research Service (CRS), with data from the U.S. Department of Health and Human
Services (HHS).
Notes: Shaded areas denote months when the national economy was in recession. Information represents
families receiving cash assistance from Aid to Dependent Children (ADC), Aid to Families with Dependent
Children (AFDC), and TANF. For October 1999 through the last month shown, includes families receiving
assistance from Separate State Programs (SSPs) with expenditures countable toward the TANF maintenance of
effort requirement. See Table A-1 for average annual data on families, recipients, adult recipients, and child
recipients of ADC, AFDC, and TANF cash assistance for 1961 to 2019.
Table B-5 shows recent trends in the number of cash assistance families by state.
What Are the Characteristics of Families Receiving TANF
Assistance?
Before PRWORA, the “typical” family receiving assistance had been headed by a single parent
(usually the mother) with one or two children. That single parent had also typically been
unemployed. However, since 1996, the assistance caseload decline has occurred together with a
major shift in the composition of the rolls.
Figure 3 shows the change in the size and composition of the assistance caseload under both
AFDC (1988 and 1994) and TANF. In FY1988, an estimated 84% of AFDC families were headed
by an unemployed adult recipient. In FY2019, families with an unemployed adult recipient
represented 32% of all cash assistance families. This decline occurred, in large part, as the
number of families headed by unemployed adult recipients declined more rapidly than other
components of the assistance caseload. In FY1994, a monthly average of 3.8 million families per
month who received AFDC cash assistance had adult recipients who were not working. In
FY2019, a monthly average of 359,000 families per month had adult recipients or work-eligible
individuals, with no adult recipient or work-eligible individual working.
With the decline in families headed by unemployed adults, the share of the caseload represented
by families with employed adults and “child-only” families has increased. The first category
includes families in “earnings supplement” programs separate from the regular TANF cash

The Temporary Assistance for Needy Families (TANF) Block Grant: FAQs
Congressional Research Service 7
assistance program. In FY2019, families with an employed adult comprised 26% of all TANF
families.
Child-only TANF families are those where no adult recipient receives benefits in their own right;
the family receives benefits on behalf of its children. The share of the caseload that was child-
only in FY2019 was 42%. In FY2019, families with a nonrecipient, nonparent relative
(grandparents, aunts, uncles) represented 17% of all assistance families. Families with ineligible,
noncitizen adults or adults who have not reported their citizenship status made up 10% of the
assistance caseload in that year. Families where the parent received Supplemental Security
Income (SSI) and the children received TANF made up 9% of all assistance families in FY2019.
Figure 3. Composition of the AFDC/TANF Assistance Caseload by Family Type:
Selected Years, FY1988 to FY2019
Source: Congressional Research Service (CRS) tabulations of the TANF national data files.
Note: TANF assistance caseload includes families receiving assistance in state-funded programs counted toward
the TANF maintenance of effort (MOE) requirement.
TANF Cash Benefits: How Much Does a Family
Receive in TANF Cash Per Month? There are no federal rules that help determine the amount of TANF cash benefits paid to a family.
(There are also no federal rules that require states to use TANF to pay cash benefits, though all
states do so.) Benefit amounts are determined solely by the states.
Most states base TANF cash benefit amounts on family size, paying larger cash benefits to larger
families on the presumption that they have greater financial needs. The maximum monthly cash
benefit is usually paid to a family that receives no other income (e.g., no earned or unearned
income) and complies with program rules. Families with income other than TANF often are paid
a reduced benefit. Moreover, some families are financially sanctioned for not meeting a program
requirement (e.g., a work requirement), and are also paid a lower benefit.

The Temporary Assistance for Needy Families (TANF) Block Grant: FAQs
Congressional Research Service 8
Figure 4 shows the maximum monthly TANF cash benefit by state for a single parent caring for
two children (family of three) in July 2019.4 For a family of three, the maximum TANF benefit
paid in July 2019 varied from $170 per month in Mississippi to $1,066 per month in New
Hampshire. The map shows a regional pattern to the maximum monthly benefit paid, with lower
benefit amounts in the South than in other regions. Only New Hampshire (at 60% of the federal
poverty guidelines) had a maximum TANF cash assistance amount for this sized family in excess
of 50% of poverty-level income.
Figure 4. TANF Cash Assistance Maximum Monthly Benefit Amounts for a Single-
Parent Family with Two Children, 50 States and the District of Columbia, July 2019
Source: Congressional Research Service (CRS), based on data from the Urban Institute’s Welfare Rules
Database. The welfare rules database has information for the 50 states and District of Columbia. It does not have
information on TANF assistance programs in Puerto Rico, Guam, and the Virgin Islands or tribal TANF
programs.
TANF Work Participation Standards TANF’s main federal work requirement is actually a performance measure that applies to the
states, rather than individual recipients. States determine the work rules that apply to individual
recipients.
4 States are not required to report to the federal government their cash assistance benefit amounts in either the TANF
state plan (under Section 402 of the Social Security Act) or in annual program reports (under Section 411 of the Social
Security Act). The benefit amounts shown are from the “Welfare Rules Database,” maintained by the Urban Institute
and funded by the Department of Health and Human Services (HHS). Some states vary their benefit amounts for other
family types such as two-parent families or “child-only” cases. States also vary their benefits by other factors such as
housing costs and substate geography.

The Temporary Assistance for Needy Families (TANF) Block Grant: FAQs
Congressional Research Service 9
What Is the TANF Work Participation Standard States Must Meet?
The TANF statute requires states to have 50% of their caseload meet standards of participation in
work or activities—that is, a family member must be in specified activities for a minimum
number of hours.5 There is a separate participation standard that applies to the two-parent portion
of a state’s caseload, requiring 90% of the state’s two-parent caseload to meet participation
standards.
However, the statutory work participation standards are reduced by a “caseload reduction credit.”
The caseload reduction credit reduces the participation standard one percentage point for each
percentage point decline in a state’s caseload. Additionally, under a regulatory provision, a state
may get “extra” credit for caseload reduction if it spends more than required under the TANF
MOE. Therefore, the effective standards states face are often less than the 50% and 90% targets,
and vary by state and by year.
States that do not meet the TANF work participation standard are at risk of being penalized
through a reduction in their block grant. However, penalties can be forgiven if a state claims, and
the Secretary of HHS finds, that it had “reasonable cause” for not meeting the standard. Penalties
can also be forgiven for states that enter into “corrective compliance plans,” and subsequently
meet the work standard.
Have There Been Changes in the Work Participation Rules Enacted
Since the 1996 Welfare Reform Law?
The 50% and 90% target standards that states face, as well as the caseload reduction credit, date
back to the 1996 welfare reform law. However, the Deficit Reduction Act of 2005 (DRA, P.L.
109-171) made several changes to the work participation rules effective in FY2007.
The caseload reduction credit was changed to measure caseload reduction from
FY2005, rather than the original law’s FY1995.
The work participation standards were broadened to include families receiving
cash aid in “separate state programs.” Separate state programs are programs run
with state funds, distinct from a state’s “TANF program,” but with expenditures
countable toward the TANF MOE.
HHS was instructed to provide definition to the allowable TANF work activities
listed in law. HHS was also required to define what is meant by a “work-eligible”
individual, expanding the number of families that are included in the work
participation calculation.
States were required to develop plans and procedures to verify work activities.
The American Recovery and Reinvestment Act of 2009 (ARRA, P.L. 111-5), a law enacted in
response to the sharp economic downturn of 2007-2009, held states “harmless” for caseload
increases affecting the work participation standards for FY2009 through FY2011. It did so by
allowing states to “freeze” caseload reduction credits at pre-recession levels through the FY2011
standards.
5 Families without a work-eligible individual are excluded from the participation rate calculation. It excludes families
where the parent is a nonrecipient (for example, disabled receiving Supplemental Security Income or an ineligible
noncitizen) or the children in the family are being cared for by a nonparent relative (e.g., grandparent, aunt, uncle) who
does not receive assistance on his or her behalf.

The Temporary Assistance for Needy Families (TANF) Block Grant: FAQs
Congressional Research Service 10
What Work Participation Rates Have the States Achieved?
HHS computes two work participation rates for each state that are then compared with the
effective (after-credit) standard to determine if it has met the TANF work standard. An “all-
families” work participation rate is computed and compared with the all-families effective
standard (50% minus the state’s caseload reduction credit). HHS also computes a two-parent
work participation rate that is compared with the two-parent effective standard (90% minus the
state’s caseload reduction credit).
Figure 5 shows the national average all-families work participation rate for FY2002 through
FY2020. For the period FY2002 through FY2011, states achieved an average all-families work
participation rate hovering around 30%. The work participation rate increased since then. In
FY2016, it exceeded 50% for the first time since TANF was established. However, it is important
to note that the increase in the work participation rate has not come from an increase in the
number of recipients in regular TANF assistance programs who are either working or in job
preparation activities. This increase stems mostly from states creating new “earnings supplement”
programs that use TANF funds to aid working parents in the Supplemental Nutrition Assistance
Program (SNAP, formerly food stamps) or who have left the regular TANF assistance programs
for work.6 The national average TANF work participation rate for all families declined in 2018
and 2019 from its 2017 high of 53.0%. In FY2020, a year affected by the COVID-19 virus and its
economic fallout, the national average all-families rate fell by 7.5 percentage points. However, in
FY2020 all states met their all-families TANF work participation standards despite this decline
(in FY2019, only Montana did not meet its standard).
Figure 5. National Average TANF Work Participation Rate for All Families,
FY2002-FY2020
Source: Congressional Research Service (CRS) based on data from the U.S. Department of Health and Human
Services (HHS).
6 See CRS In Focus IF10856, Temporary Assistance for Needy Families: Work Requirements.

The Temporary Assistance for Needy Families (TANF) Block Grant: FAQs
Congressional Research Service 11
In FY2020, 5 states (California, Nevada, North Carolina, Rhode Island, and Wyoming) as well as
Guam failed the separate, higher two-parent standard. Table B-6 provides information for each
jurisdiction on the TANF work standard, caseload reduction credit, and work participation rate for
all families for FY2020. Table B-7 provides that information for two-parent families. The table
shows that 26 jurisdiction did not have two-parent families receiving assistance funded by TANF
or MOE funds (denoted with an “NA” in the table).
The U.S. Department of Health and Human Services (HHS) has the ability to reduce or waive the
penalty on states for failing to meet the TANF work participation standard. HHS, under the
Administration of President Donald Trump, said that it would exercise its authority to provide
states with relief from the penalty for not meeting participation standards “to the maximum extent
possible.”7 HHS has not revised this statement under the current, Biden Administration.
7 U.S. Department of Human Services, Administration for Children and Families, Office of Family Assistance,
Questions and answers about TANF and the Coronavirus Disease 2019 (COVID-19) pandemic, TANF-ACF-Pi-2020-
01, https://www.acf.hhs.gov/ofa/resource/tanf-acf-pi-2020-01.

The Temporary Assistance for Needy Families (TANF) Block Grant: FAQs
Congressional Research Service 12
Appendix A. Supplementary Tables
Table A-1. Trends in the Cash Assistance Caseload: 1961-2019
TANF Child Recipients
Year
Families
(millions)
Recipients
(millions)
Adults
(millions)
Children
(millions)
As a
Percentage
of All
Children
As a
Percentage
of All Poor
Children
1961 0.873 3.363 0.765 2.598 3.7% 14.3%
1962 0.939 3.704 0.860 2.844 4.0 15.7
1963 0.963 3.945 0.988 2.957 4.1 17.4
1964 1.010 4.195 1.050 3.145 4.3 18.6
1965 1.060 4.422 1.101 3.321 4.5 21.5
1966 1.096 4.546 1.112 3.434 4.7 26.5
1967 1.220 5.014 1.243 3.771 5.2 31.2
1968 1.410 5.702 1.429 4.274 5.9 37.8
1969 1.696 6.689 1.716 4.973 6.9 49.7
1970 2.207 8.462 2.250 6.212 8.6 57.7
1971 2.763 10.242 2.808 7.435 10.4 68.5
1972 3.048 10.944 3.039 7.905 11.1 74.9
1973 3.148 10.949 3.046 7.903 11.2 79.9
1974 3.219 10.847 3.041 7.805 11.2 75.0
1975 3.481 11.319 3.248 8.071 11.8 71.2
1976 3.565 11.284 3.302 7.982 11.8 76.2
1977 3.568 11.015 3.273 7.743 11.6 73.9
1978 3.517 10.551 3.188 7.363 11.2 72.8
1979 3.509 10.312 3.130 7.181 11.0 68.0
1980 3.712 10.774 3.355 7.419 11.5 63.2
1981 3.835 11.079 3.552 7.527 11.7 59.2
1982 3.542 10.358 3.455 6.903 10.8 49.6
1983 3.686 10.761 3.663 7.098 11.1 50.1
1984 3.714 10.831 3.687 7.144 11.2 52.3
1985 3.701 10.855 3.658 7.198 11.3 54.4
1986 3.763 11.038 3.704 7.334 11.5 56.0
1987 3.776 11.027 3.661 7.366 11.5 56.4
1988 3.749 10.915 3.586 7.329 11.4 57.8
1989 3.798 10.992 3.573 7.419 11.5 57.9
1990 4.057 11.695 3.784 7.911 12.1 57.9
1991 4.497 12.930 4.216 8.715 13.2 59.8

The Temporary Assistance for Needy Families (TANF) Block Grant: FAQs
Congressional Research Service 13
TANF Child Recipients
Year Families
(millions)
Recipients
(millions)
Adults
(millions)
Children
(millions)
As a
Percentage
of All
Children
As a
Percentage
of All Poor
Children
1992 4.829 13.773 4.470 9.303 13.9 59.9
1993 5.012 14.205 4.631 9.574 14.1 60.0
1994 5.033 14.161 4.593 9.568 13.9 61.7
1995 4.791 13.418 4.284 9.135 13.1 61.5
1996 4.434 12.321 3.928 8.600 12.3 58.7
1997 3.740 10.376 NA NA 10.0 50.1
1998 3.050 8.347 NA NA 8.1 42.9
1999 2.578 6.924 NA NA 6.7 39.4
2000 2.303 6.143 1.655 4.479 6.1 38.1
2001 2.192 5.717 1.514 4.195 5.7 35.3
2002 2.187 5.609 1.479 4.119 5.6 33.6
2003 2.180 5.490 1.416 4.063 5.5 31.3
2004 2.153 5.342 1.362 3.969 5.4 30.2
2005 2.061 5.028 1.261 3.756 5.1 28.9
2006 1.906 4.582 1.120 3.453 4.6 26.7
2007 1.730 4.075 0.956 3.119 4.2 23.2
2008 1.701 4.005 0.946 3.059 4.1 21.6
2009 1.838 4.371 1.074 3.296 4.4 21.2
2010 1.919 4.598 1.163 3.435 4.6 20.9
2011 1.907 4.557 1.149 3.408 4.6 20.9
2012 1.852 4.402 1.104 3.298 4.4 20.3
2013 1.726 4.042 0.993 3.050 4.1 19.1
2014 1.650 3.957 1.007 2.950 4.0 18.9
2015 1.609 4.126 1.155 2.971 4.0 20.4
2016 1.479 3.780 1.037 2.743 3.7 20.7
2017 1.358 3.516 0.930 2.577 3.5 20.1
2018 1.196 3.150 0.833 2.317 3.2 19.5
2019 1.093 2.866 0.747 2.199 2.9 20.2
Source: Congressional Research Service (CRS), based on data from the U.S. Department of Health and Human
Services (HHS) and the U.S. Census Bureau.
Notes: NA denotes not available. During transition reporting from AFDC to TANF, caseload statistics on adult
and child recipients were not collected. For those years, TANF children as a percent of all children and percent
of all poor children were estimated by HHS and published in Welfare Indicators and Risk Factors, Annual Report to
Congress, Table TANF 2, p. A-7. See https://aspe.hhs.gov/sites/default/files/private/pdf/116161/
FINAL%20Fourteenth%20Report%20-%20FINAL%209%2022%2015.pdf. For 2019, the ratio of TANF recipient
children to all children in poverty might be overstated. This is because child poverty might have been
underestimated, as responses to the survey used to estimate poverty were affected by the COVID-19 pandemic.
The Temporary Assistance for Needy Families (TANF) Block Grant: FAQs
Congressional Research Service 14
See Jonathan Rothbaum and Adam Bee, Coronavirus Infects Surveys, Too: Nonresponse Bias During the Pandemic in
the CPS ASEC, U.S. Census Bureau, SEHSD Working Paper no. 2020-10, September 15, 2020.
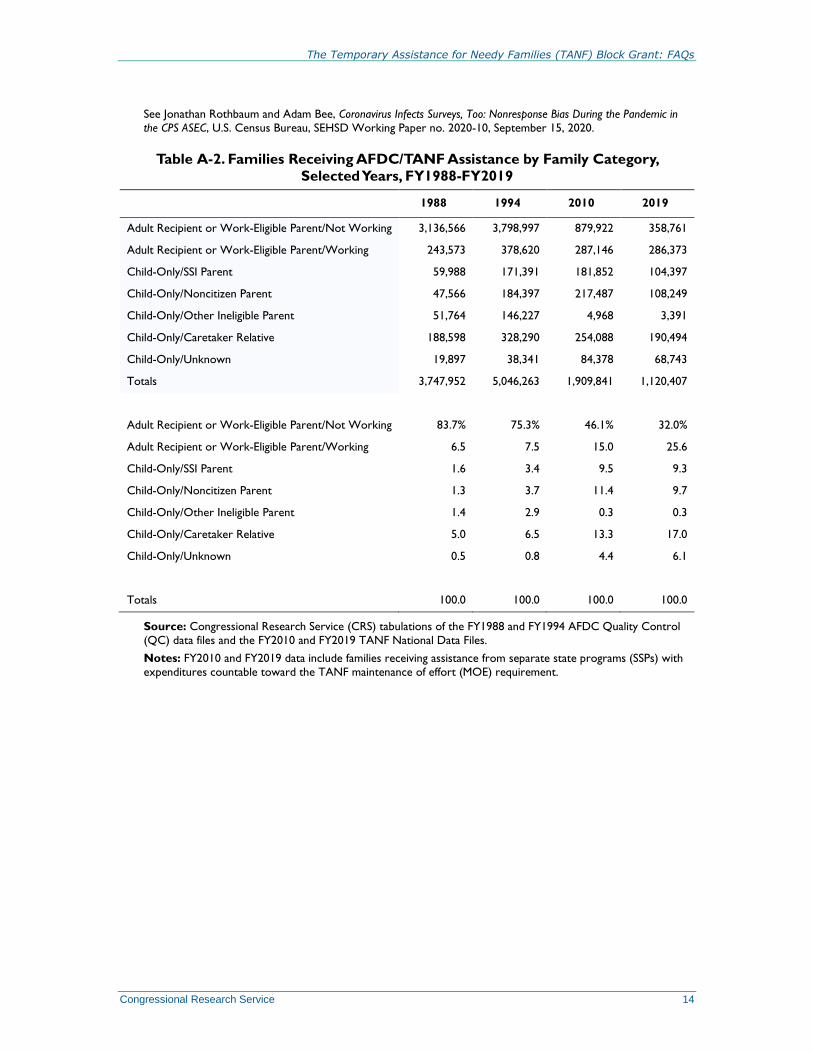
Table A-2. Families Receiving AFDC/TANF Assistance by Family Category,
Selected Years, FY1988-FY2019
1988 1994 2010 2019
Adult Recipient or Work-Eligible Parent/Not Working 3,136,566 3,798,997 879,922 358,761
Adult Recipient or Work-Eligible Parent/Working 243,573 378,620 287,146 286,373
Child-Only/SSI Parent 59,988 171,391 181,852 104,397
Child-Only/Noncitizen Parent 47,566 184,397 217,487 108,249
Child-Only/Other Ineligible Parent 51,764 146,227 4,968 3,391
Child-Only/Caretaker Relative 188,598 328,290 254,088 190,494
Child-Only/Unknown 19,897 38,341 84,378 68,743
Totals 3,747,952 5,046,263 1,909,841 1,120,407
Adult Recipient or Work-Eligible Parent/Not Working 83.7% 75.3% 46.1% 32.0%
Adult Recipient or Work-Eligible Parent/Working 6.5 7.5 15.0 25.6
Child-Only/SSI Parent 1.6 3.4 9.5 9.3
Child-Only/Noncitizen Parent 1.3 3.7 11.4 9.7
Child-Only/Other Ineligible Parent 1.4 2.9 0.3 0.3
Child-Only/Caretaker Relative 5.0 6.5 13.3 17.0
Child-Only/Unknown 0.5 0.8 4.4 6.1
Totals 100.0 100.0 100.0 100.0
Source: Congressional Research Service (CRS) tabulations of the FY1988 and FY1994 AFDC Quality Control
(QC) data files and the FY2010 and FY2019 TANF National Data Files.
Notes: FY2010 and FY2019 data include families receiving assistance from separate state programs (SSPs) with
expenditures countable toward the TANF maintenance of effort (MOE) requirement.

CRS-15
Appendix B. State Tables
Table B-1. Use of FY2020 TANF and MOE Funds by Category
($ in millions)
State Basic
Assistance
Child
Care
Work,
Educa-
tion, and
Training
Refundable
Tax
Credits
Pre-
K/Head
Start
Child
Welfare
Adminis-
tration
Emergency
and Short-
Term
Benefits
Other
Benefits
and
Services
Total
Spending
Alabama $16.378 $24.228 $6.875 $0.000 $10.660 $40.010 $24.372 $46.281 $35.511 $204.316
Alaska 45.590 13.968 12.085 0.000 0.000 0.000 6.905 0.326 12.898 91.771
Arizona 45.033 0.000 0.565 0.000 0.000 238.209 18.940 9.179 43.640 355.567
Arkansas 4.257 7.798 12.439 0.000 26.742 0.913 14.984 5.902 11.093 84.129
California 2,598.201 762.874 1,574.497 0.000 0.101 0.062 549.893 261.704 955.710 6,703.043
Colorado 80.602 15.238 8.473 72.077 91.198 53.148 51.730 21.549 57.943 451.957
Connecticut 36.207 62.591 10.506 58.091 70.878 68.389 42.288 18.565 138.266 505.781
Delaware 11.544 82.878 6.475 0.000 0.000 0.000 5.367 2.433 17.632 126.329
District of Columbia 185.408 37.433 39.216 23.842 0.000 0.000 11.578 11.552 7.327 316.355
Florida 133.883 341.154 50.224 0.000 0.000 244.252 97.793 0.877 81.413 949.598
Georgia 109.858 22.183 8.286 0.000 0.000 228.090 22.445 5.799 87.628 484.290
Hawaii 38.679 9.974 41.531 0.000 0.000 1.417 15.754 7.929 105.609 220.893
Idaho 7.915 10.965 2.946 0.000 1.487 1.726 6.480 11.798 0.415 43.731
Illinois 50.912 560.158 17.587 86.933 104.551 239.565 0.000 0.879 96.901 1,157.486
Indiana 16.013 114.016 5.707 24.845 0.000 2.759 28.415 0.290 141.256 333.302
Iowa 30.373 52.604 8.490 25.390 0.000 46.660 6.518 0.347 20.756 191.137
Kansas 13.061 6.673 0.641 38.493 18.375 42.921 9.903 0.000 47.006 177.072

CRS-16
State Basic
Assistance
Child
Care
Work,
Educa-
tion, and
Training
Refundable
Tax
Credits
Pre-
K/Head
Start
Child
Welfare
Adminis-
tration
Emergency
and Short-
Term
Benefits
Other
Benefits
and
Services
Total
Spending
Kentucky 179.973 32.666 29.722 0.000 0.000 0.000 12.107 0.000 9.214 263.682
Louisiana 15.122 12.653 35.222 19.933 51.151 26.963 16.848 6.898 29.031 213.821
Maine 37.473 19.990 11.593 7.579 0.507 9.802 6.317 5.177 29.047 127.485
Maryland 153.087 5.484 30.478 154.133 76.530 29.930 23.337 27.518 44.909 545.407
Massachusetts 240.784 265.421 203.514 220.172 0.000 6.559 33.135 103.344 78.870 1,151.798
Michigan 129.478 27.019 1.958 43.518 191.413 78.645 53.354 20.648 794.532 1,340.566
Minnesota 93.963 159.106 52.951 177.877 5.700 0.000 42.407 22.554 18.005 572.564
Mississippi 4.074 1.715 22.769 0.000 0.000 21.756 9.419 0.000 17.110 76.844
Missouri 31.551 27.504 62.874 0.000 0.000 112.570 9.297 73.252 54.188 371.236
Montana 17.448 10.621 2.664 0.000 0.000 1.927 4.709 2.038 9.057 48.464
Nebraska 28.344 18.375 12.299 32.472 0.000 6.100 2.977 0.090 3.238 103.896
Nevada 33.047 13.902 1.302 0.000 0.000 28.275 9.894 8.956 18.736 114.112
New Hampshire 34.201 4.582 7.225 0.000 0.000 4.544 11.407 2.373 16.217 80.549
New Jersey 82.639 218.423 73.767 361.436 614.997 0.000 50.883 16.103 72.455 1,490.702
New Mexico 68.684 34.278 20.737 74.691 70.361 1.019 6.133 6.369 22.966 305.238
New York 1,444.193 479.272 120.136 1,296.116 496.529 348.868 431.817 212.620 330.864 5,160.413
North Carolina 34.722 226.371 4.005 0.000 92.153 135.889 43.433 3.574 44.245 584.392
North Dakota 3.857 1.239 3.915 0.000 0.000 24.228 4.941 0.079 0.926 39.184
Ohio 247.480 423.168 82.829 0.000 0.158 18.212 99.060 76.521 248.456 1,195.884
Oklahoma 19.303 59.713 9.208 0.000 0.000 13.408 8.399 0.587 34.063 144.682
Oregon 83.504 11.102 18.507 3.381 11.599 14.496 36.467 23.731 42.954 245.739

CRS-17
State Basic
Assistance
Child
Care
Work,
Educa-
tion, and
Training
Refundable
Tax
Credits
Pre-
K/Head
Start
Child
Welfare
Adminis-
tration
Emergency
and Short-
Term
Benefits
Other
Benefits
and
Services
Total
Spending
Pennsylvania 130.776 482.527 86.953 0.000 219.345 0.000 62.785 9.851 142.789 1,135.026
Rhode Island 21.679 41.607 9.897 22.214 1.190 26.256 5.141 0.000 26.679 154.664
South Carolina 48.818 4.085 8.203 0.000 27.777 5.063 18.961 0.000 53.150 166.057
South Dakota 13.022 0.803 2.798 0.000 0.000 3.494 2.205 3.792 2.823 28.937
Tennessee 23.612 57.000 23.053 0.000 83.207 0.000 32.009 0.000 2.907 221.788
Texas 45.249 0.000 85.947 0.000 339.179 377.214 68.821 4.337 63.466 984.212
Utah 17.343 22.619 14.777 0.000 12.486 1.348 6.507 1.983 19.620 96.684
Vermont 13.144 33.365 0.734 19.246 0.000 8.364 5.114 0.674 14.094 94.735
Virginia 65.836 38.566 36.533 0.186 6.635 56.980 48.434 5.392 41.402 299.964
Washington 139.722 150.607 131.210 0.000 51.343 28.400 54.971 76.080 424.139 1,056.473
West Virginia 40.212 21.096 0.587 0.000 0.000 26.446 14.834 13.620 27.733 144.529
Wisconsin 73.364 195.758 28.987 69.700 0.000 7.317 28.730 32.356 129.978 566.190
Wyoming 11.461 1.554 5.192 0.000 1.709 0.000 3.517 3.220 2.841 29.494
Totals 7,051.079 5,226.926 3,049.091 2,832.324 2,677.958 2,632.197 2,181.733 1,169.148 4,731.712 31,552.168
Source: Congressional Research Service (CRS), based on data from the U.S. Department of Health and Human Services (HHS), Administration for Children and Families
(ACF), Office of Family Assistance.
Notes: Excludes TANF funds used in the territories and in tribal TANF programs.

CRS-18
Table B-2. Uses of FY2020 TANF and MOE Funds by Category as a Percentage of Total Federal TANF and
State MOE Spending
State Basic
Assistance
Child
Care
Work,
Education,
and
Training
Refund-
able Tax
Credits
Pre-
K/Head
Start
Child
Welfare
Adminis-
tration
Emergency
and Short-
Term
Benefits
Other
Benefits
and
Services
Total
Spending
Alabama 8.0% 11.9% 3.4% 0.0% 5.2% 19.6% 11.9% 22.7% 17.4% 100.0%
Alaska 49.7 15.2 13.2 0.0 0.0 0.0 7.5 0.4 14.1 100.0
Arizona 12.7 0.0 0.2 0.0 0.0 67.0 5.3 2.6 12.3 100.0
Arkansas 5.1 9.3 14.8 0.0 31.8 1.1 17.8 7.0 13.2 100.0
California 38.8 11.4 23.5 0.0 0.0 0.0 8.2 3.9 14.3 100.0
Colorado 17.8 3.4 1.9 15.9 20.2 11.8 11.4 4.8 12.8 100.0
Connecticut 7.2 12.4 2.1 11.5 14.0 13.5 8.4 3.7 27.3 100.0
Delaware 9.1 65.6 5.1 0.0 0.0 0.0 4.2 1.9 14.0 100.0
District of Columbia 58.6 11.8 12.4 7.5 0.0 0.0 3.7 3.7 2.3 100.0
Florida 14.1 35.9 5.3 0.0 0.0 25.7 10.3 0.1 8.6 100.0
Georgia 22.7 4.6 1.7 0.0 0.0 47.1 4.6 1.2 18.1 100.0
Hawaii 17.5 4.5 18.8 0.0 0.0 0.6 7.1 3.6 47.8 100.0
Idaho 18.1 25.1 6.7 0.0 3.4 3.9 14.8 27.0 0.9 100.0
Illinois 4.4 48.4 1.5 7.5 9.0 20.7 0.0 0.1 8.4 100.0
Indiana 4.8 34.2 1.7 7.5 0.0 0.8 8.5 0.1 42.4 100.0
Iowa 15.9 27.5 4.4 13.3 0.0 24.4 3.4 0.2 10.9 100.0
Kansas 7.4 3.8 0.4 21.7 10.4 24.2 5.6 0.0 26.5 100.0
Kentucky 68.3 12.4 11.3 0.0 0.0 0.0 4.6 0.0 3.5 100.0
Louisiana 7.1 5.9 16.5 9.3 23.9 12.6 7.9 3.2 13.6 100.0

CRS-19
State Basic
Assistance
Child
Care
Work,
Education,
and
Training
Refund-
able Tax
Credits
Pre-
K/Head
Start
Child
Welfare
Adminis-
tration
Emergency
and Short-
Term
Benefits
Other
Benefits
and
Services
Total
Spending
Maine 29.4 15.7 9.1 5.9 0.4 7.7 5.0 4.1 22.8 100.0
Maryland 28.1 1.0 5.6 28.3 14.0 5.5 4.3 5.0 8.2 100.0
Massachusetts 20.9 23.0 17.7 19.1 0.0 0.6 2.9 9.0 6.8 100.0
Michigan 9.7 2.0 0.1 3.2 14.3 5.9 4.0 1.5 59.3 100.0
Minnesota 16.4 27.8 9.2 31.1 1.0 0.0 7.4 3.9 3.1 100.0
Mississippi 5.3 2.2 29.6 0.0 0.0 28.3 12.3 0.0 22.3 100.0
Missouri 8.5 7.4 16.9 0.0 0.0 30.3 2.5 19.7 14.6 100.0
Montana 36.0 21.9 5.5 0.0 0.0 4.0 9.7 4.2 18.7 100.0
Nebraska 27.3 17.7 11.8 31.3 0.0 5.9 2.9 0.1 3.1 100.0
Nevada 29.0 12.2 1.1 0.0 0.0 24.8 8.7 7.8 16.4 100.0
New Hampshire 42.5 5.7 9.0 0.0 0.0 5.6 14.2 2.9 20.1 100.0
New Jersey 5.5 14.7 4.9 24.2 41.3 0.0 3.4 1.1 4.9 100.0
New Mexico 22.5 11.2 6.8 24.5 23.1 0.3 2.0 2.1 7.5 100.0
New York 28.0 9.3 2.3 25.1 9.6 6.8 8.4 4.1 6.4 100.0
North Carolina 5.9 38.7 0.7 0.0 15.8 23.3 7.4 0.6 7.6 100.0
North Dakota 9.8 3.2 10.0 0.0 0.0 61.8 12.6 0.2 2.4 100.0
Ohio 20.7 35.4 6.9 0.0 0.0 1.5 8.3 6.4 20.8 100.0
Oklahoma 13.3 41.3 6.4 0.0 0.0 9.3 5.8 0.4 23.5 100.0
Oregon 34.0 4.5 7.5 1.4 4.7 5.9 14.8 9.7 17.5 100.0
Pennsylvania 11.5 42.5 7.7 0.0 19.3 0.0 5.5 0.9 12.6 100.0
Rhode Island 14.0 26.9 6.4 14.4 0.8 17.0 3.3 0.0 17.2 100.0

CRS-20
State Basic
Assistance
Child
Care
Work,
Education,
and
Training
Refund-
able Tax
Credits
Pre-
K/Head
Start
Child
Welfare
Adminis-
tration
Emergency
and Short-
Term
Benefits
Other
Benefits
and
Services
Total
Spending
South Carolina 29.4 2.5 4.9 0.0 16.7 3.0 11.4 0.0 32.0 100.0
South Dakota 45.0 2.8 9.7 0.0 0.0 12.1 7.6 13.1 9.8 100.0
Tennessee 10.6 25.7 10.4 0.0 37.5 0.0 14.4 0.0 1.3 100.0
Texas 4.6 0.0 8.7 0.0 34.5 38.3 7.0 0.4 6.4 100.0
Utah 17.9 23.4 15.3 0.0 12.9 1.4 6.7 2.1 20.3 100.0
Vermont 13.9 35.2 0.8 20.3 0.0 8.8 5.4 0.7 14.9 100.0
Virginia 21.9 12.9 12.2 0.1 2.2 19.0 16.1 1.8 13.8 100.0
Washington 13.2 14.3 12.4 0.0 4.9 2.7 5.2 7.2 40.1 100.0
West Virginia 27.8 14.6 0.4 0.0 0.0 18.3 10.3 9.4 19.2 100.0
Wisconsin 13.0 34.6 5.1 12.3 0.0 1.3 5.1 5.7 23.0 100.0
Wyoming 38.9 5.3 17.6 0.0 5.8 0.0 11.9 10.9 9.6 100.0
Totals 22.3 16.6 9.7 9.0 8.5 8.3 6.9 3.7 15.0 100.0
Source: Congressional Research Service (CRS), based on data from the U.S. Department of Health and Human Services (HHS), Administration for Children and Families
(ACF), Office of Family Assistance.
Notes: Excludes TANF funds used in the territories and in tribal TANF programs.
The Temporary Assistance for Needy Families (TANF) Block Grant: FAQs
Congressional Research Service 21
Table B-3. Unspent TANF Funds at the End of FY2020
(September 30, 2020; $ in millions)
State Unliquidated
Obligations Unobligated Balance
Alabama $5.000 $96.385
Alaska 3.823 17.833
Arizona 0.000 38.786
Arkansas 42.772 56.406
California 100.860 0.000
Colorado 0.000 87.486
Connecticut 0.000 0.000
Delaware 5.356 35.457
District of Columbia 0.000 15.236
Florida 50.819 0.000
Georgia 26.758 79.824
Hawaii 15.302 364.301
Idaho 0.000 8.269
Illinois 0.000 0.000
Indiana 13.406 18.647
Iowa 11.008 0.000
Kansas 3.567 57.065
Kentucky 0.000 38.810
Louisiana 0.000 65.375
Maine 22.300 93.075
Maryland 0.000 0.051
Massachusetts 0.000 0.000
Michigan 0.000 94.231
Minnesota 0.000 103.991
Mississippi 0.000 47.037
Missouri 0.000 0.000
Montana 0.000 19.455
Nebraska 39.053 52.068
Nevada 33.445 1.769
New Hampshire 0.000 44.926
New Jersey 27.786 25.000
New Mexico 1.195 60.053
New York 311.017 586.125
North Carolina 55.335 0.000

The Temporary Assistance for Needy Families (TANF) Block Grant: FAQs
Congressional Research Service 22
State Unliquidated
Obligations Unobligated Balance
North Dakota 0.000 1.500
Ohio 0.000 582.599
Oklahoma 0.000 264.061
Oregon 0.000 45.203
Pennsylvania 88.075 410.985
Rhode Island 0.000 25.051
South Carolina 0.000 0.000
South Dakota 0.000 22.795
Tennessee 0.000 789.634
Texas 0.000 281.369
Utah 0.000 59.430
Vermont 0.000 0.000
Virginia 7.366 125.804
Washington 25.809 105.845
West Virginia 0.000 101.445
Wisconsin 0.000 204.997
Wyoming 0.000 27.231
Totals 890.054 5,155.608
Source: Congressional Research Service (CRS), based on data from the U.S. Department of Health and Human
Services (HHS), Administration for Children and Families (ACF), Office of Family Assistance.
Note: Excludes TANF funds used in the territories and in tribal TANF programs.
Table B-4. Number of Families, Recipients, Children, and Adults Receiving TANF
Assistance by Jurisdiction, November 2020
State Families Recipients Children Adults
Alabama 7,228 16,719 13,642 3,077
Alaska 2,013 5,376 3,692 1,684
Arizona 7,581 15,342 12,680 2,662
Arkansas 1,953 4,492 3,431 1,061
California 308,432 984,915 704,151 280,764
Colorado 12,359 30,023 22,338 7,685
Connecticut 6,320 13,403 9,791 3,612
Delaware 2,650 7,356 4,296 3,060
District of Columbia 7,465 21,847 16,103 5,744
Florida 41,491 75,073 59,340 15,733

The Temporary Assistance for Needy Families (TANF) Block Grant: FAQs
Congressional Research Service 23
State Families Recipients Children Adults
Georgia 8,060 15,222 13,889 1,333
Guam 437 1,078 834 244
Hawaii 6,881 21,265 13,595 7,670
Idaho 1,773 2,496 2,456 40
Illinois 10,735 21,098 18,996 2,102
Indiana 8,327 19,721 15,351 4,370
Iowa 7,504 17,947 13,759 4,188
Kansas 3,520 3,520 1,882 1,638
Kentucky 14,168 28,696 24,903 3,793
Louisiana 3,855 8,982 7,555 1,427
Maine 11,778 39,372 24,821 14,551
Maryland 23,055 56,580 39,938 16,642
Massachusetts 41,560 108,953 77,773 31,180
Michigan 10,762 26,774 21,444 5,330
Minnesota 19,680 47,585 35,101 12,484
Mississippi 1,877 3,158 2,888 270
Missouri 8,776 20,513 15,579 4,934
Montana 2,438 5,696 4,557 1,139
Nebraska 4,737 11,759 9,644 2,115
Nevada 6,658 17,198 12,826 4,372
New Hampshire 4,422 10,342 7,713 2,629
New Jersey 9,459 22,892 16,902 5,990
New Mexico 11,582 29,935 21,739 8,196
New York 113,201 289,625 198,575 91,050
North Carolina 13,775 25,289 22,273 3,016
North Dakota 1,078 2,820 2,244 576
Ohio 51,566 94,341 84,268 10,073
Oklahoma 5,592 12,901 10,932 1,969
Oregon 25,192 72,859 48,144 24,715
Pennsylvania 29,869 71,549 55,079 16,470
Puerto Rico 4,357 11,800 7,195 4,605
Rhode Island 2,577 6,094 4,622 1,472
South Carolina 8,133 18,749 15,127 3,622
South Dakota 2,716 5,495 5,051 444
Tennessee 15,578 32,436 26,923 5,513
Texas 21,404 44,545 37,455 7,090
Utah 2,657 6,195 4,621 1,574

The Temporary Assistance for Needy Families (TANF) Block Grant: FAQs
Congressional Research Service 24
State Families Recipients Children Adults
Vermont 2,052 4,305 3,233 1,072
Virgin Islands 69 225 156 69
Virginia 18,311 34,337 26,552 7,785
Washington 41,979 99,966 66,093 33,873
West Virginia 5,703 11,121 9,379 1,742
Wisconsin 16,495 37,683 30,420 7,263
Wyoming 487 1,136 869 267
Totals 1,002,327 2,598,799 1,912,820 685,979
Source: Congressional Research Service (CRS), based on data from the U.S. Department of Health and Human
Services (HHS).
Note: TANF cash assistance caseload includes families receiving assistance in state-funded programs counted
toward the TANF maintenance of effort (MOE) requirement.
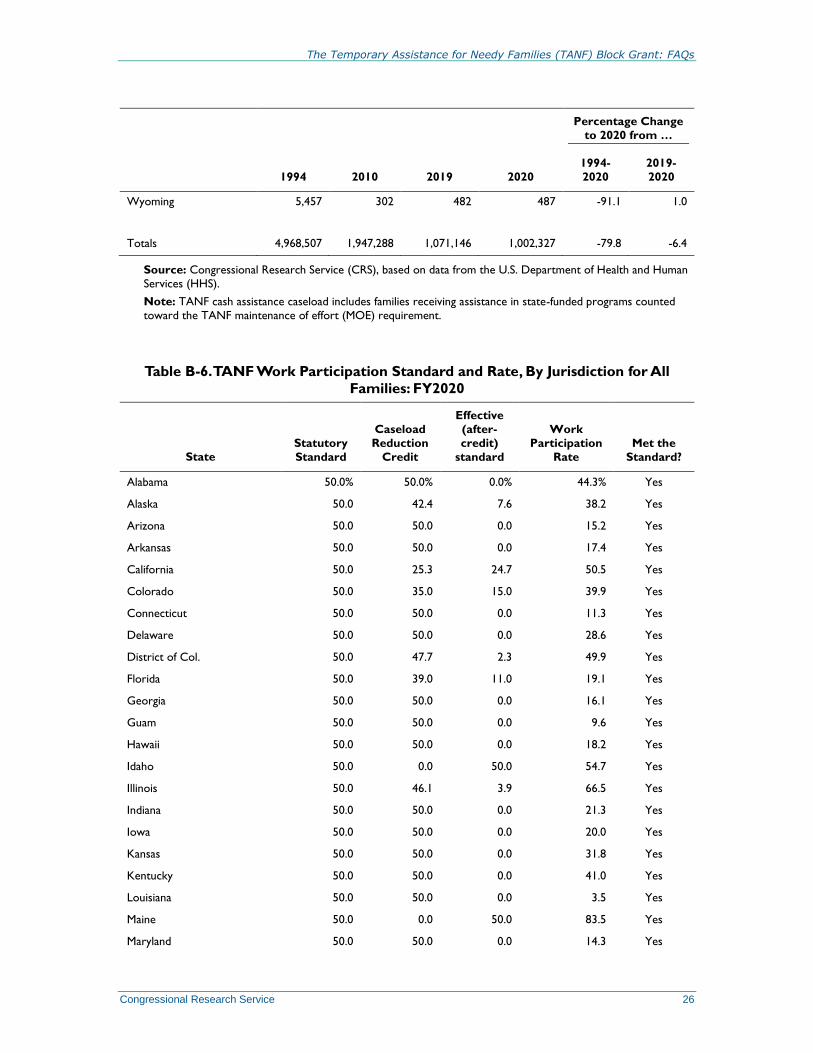
Table B-5. Number of Needy Families with Children Receiving Assistance
by Jurisdiction, November of Selected Years
Percentage Change
to 2020 from …
1994 2010 2019 2020
1994-
2020
2019-
2020
Alabama 48,142 23,954 7,456 7,228 -85.0% -3.1%
Alaska 12,145 3,423 2,110 2,013 -83.4 -4.6
Arizona 72,171 19,406 7,108 7,581 -89.5 6.7
Arkansas 25,039 8,525 2,364 1,953 -92.2 -17.4
California 914,344 593,714 363,509 308,432 -66.3 -15.2
Colorado 39,171 11,998 13,671 12,359 -68.4 -9.6
Connecticut 60,846 16,922 7,659 6,320 -89.6 -17.5
Delaware 11,102 5,794 3,226 2,650 -76.1 -17.9
District of Columbia 27,390 9,963 7,243 7,465 -72.7 3.1
Florida 239,902 57,861 38,479 41,491 -82.7 7.8
Georgia 141,307 20,630 8,719 8,060 -94.3 -7.6
Guam 2,060 1,289 422 437 -78.8 3.6
Hawaii 21,415 10,019 4,022 6,881 -67.9 71.1
Idaho 8,608 1,809 2,014 1,773 -79.4 -12.0
Illinois 239,840 26,014 10,957 10,735 -95.5 -2.0
Indiana 70,161 33,553 5,410 8,327 -88.1 53.9
Iowa 37,941 21,478 8,787 7,504 -80.2 -14.6
Kansas 28,774 15,563 3,984 3,520 -87.8 -11.6

The Temporary Assistance for Needy Families (TANF) Block Grant: FAQs
Congressional Research Service 25
Percentage Change
to 2020 from …
1994 2010 2019 2020
1994-
2020
2019-
2020
Kentucky 77,403 31,175 16,234 14,168 -81.7 -12.7
Louisiana 84,031 11,062 4,478 3,855 -95.4 -13.9
Maine 21,782 15,397 14,586 11,778 -45.9 -19.3
Maryland 80,480 25,347 16,761 23,055 -71.4 37.6
Massachusetts 106,736 50,878 50,505 41,560 -61.1 -17.7
Michigan 211,259 68,790 11,119 10,762 -94.9 -3.2
Minnesota 61,352 24,759 15,087 19,680 -67.9 30.4
Mississippi 53,652 12,052 3,011 1,877 -96.5 -37.7
Missouri 91,205 39,737 9,687 8,776 -90.4 -9.4
Montana 11,464 3,650 3,266 2,438 -78.7 -25.4
Nebraska 15,543 8,381 4,346 4,737 -69.5 9.0
Nevada 15,330 10,778 7,821 6,658 -56.6 -14.9
New Hampshire 11,154 6,097 5,286 4,422 -60.4 -16.3
New Jersey 113,444 34,996 9,003 9,459 -91.7 5.1
New Mexico 34,906 21,447 9,901 11,582 -66.8 17.0
New York 462,309 157,247 112,549 113,201 -75.5 0.6
North Carolina 127,829 23,879 14,236 13,775 -89.2 -3.2
North Dakota 5,290 1,967 972 1,078 -79.6 10.9
Ohio 239,144 104,370 43,736 51,566 -78.4 17.9
Oklahoma 45,863 9,380 5,650 5,592 -87.8 -1.0
Oregon 39,763 32,548 36,514 25,192 -36.6 -31.0
Pennsylvania 209,875 59,090 39,133 29,869 -85.8 -23.7
Puerto Rico 56,378 13,953 4,410 4,357 -92.3 -1.2
Rhode Island 22,581 6,648 3,846 2,577 -88.6 -33.0
South Carolina 50,351 19,371 8,220 8,133 -83.8 -1.1
South Dakota 6,434 3,247 2,928 2,716 -57.8 -7.2
Tennessee 107,498 63,925 18,804 15,578 -85.5 -17.2
Texas 281,897 52,970 21,904 21,404 -92.4 -2.3
Utah 17,387 7,097 3,133 2,657 -84.7 -15.2
Vermont 9,691 3,264 2,665 2,052 -78.8 -23.0
Virgin Islands 1,222 526 101 69 -94.4 -31.7
Virginia 73,692 37,478 16,586 18,311 -75.2 10.4
Washington 102,718 67,762 35,846 41,979 -59.1 17.1
West Virginia 39,299 10,747 6,361 5,703 -85.5 -10.3
Wisconsin 73,730 25,056 14,839 16,495 -77.6 11.2
The Temporary Assistance for Needy Families (TANF) Block Grant: FAQs
Congressional Research Service 26
Percentage Change
to 2020 from …
1994 2010 2019 2020
1994-
2020
2019-
2020
Wyoming 5,457 302 482 487 -91.1 1.0
Totals 4,968,507 1,947,288 1,071,146 1,002,327 -79.8 -6.4
Source: Congressional Research Service (CRS), based on data from the U.S. Department of Health and Human
Services (HHS).
Note: TANF cash assistance caseload includes families receiving assistance in state-funded programs counted
toward the TANF maintenance of effort (MOE) requirement.
Table B-6. TANF Work Participation Standard and Rate, By Jurisdiction for All
Families: FY2020
State Statutory
Standard
Caseload
Reduction
Credit
Effective
(after-
credit)
standard
Work
Participation
Rate
Met the
Standard?
Alabama 50.0% 50.0% 0.0% 44.3% Yes
Alaska 50.0 42.4 7.6 38.2 Yes
Arizona 50.0 50.0 0.0 15.2 Yes
Arkansas 50.0 50.0 0.0 17.4 Yes
California 50.0 25.3 24.7 50.5 Yes
Colorado 50.0 35.0 15.0 39.9 Yes
Connecticut 50.0 50.0 0.0 11.3 Yes
Delaware 50.0 50.0 0.0 28.6 Yes
District of Col. 50.0 47.7 2.3 49.9 Yes
Florida 50.0 39.0 11.0 19.1 Yes
Georgia 50.0 50.0 0.0 16.1 Yes
Guam 50.0 50.0 0.0 9.6 Yes
Hawaii 50.0 50.0 0.0 18.2 Yes
Idaho 50.0 0.0 50.0 54.7 Yes
Illinois 50.0 46.1 3.9 66.5 Yes
Indiana 50.0 50.0 0.0 21.3 Yes
Iowa 50.0 50.0 0.0 20.0 Yes
Kansas 50.0 50.0 0.0 31.8 Yes
Kentucky 50.0 50.0 0.0 41.0 Yes
Louisiana 50.0 50.0 0.0 3.5 Yes
Maine 50.0 0.0 50.0 83.5 Yes
Maryland 50.0 50.0 0.0 14.3 Yes

The Temporary Assistance for Needy Families (TANF) Block Grant: FAQs
Congressional Research Service 27
State Statutory
Standard
Caseload
Reduction
Credit
Effective
(after-
credit)
standard
Work
Participation
Rate
Met the
Standard?
Massachusetts 50.0 25.1 24.9 56.9 Yes
Michigan 50.0 50.0 0.0 32.2 Yes
Minnesota 50.0 44.6 5.4 22.3 Yes
Mississippi 50.0 50.0 0.0 40.3 Yes
Missouri 50.0 50.0 0.0 17.1 Yes
Montana 50.0 18.4 31.6 35.5 Yes
Nebraska 50.0 50.0 0.0 10.2 Yes
Nevada 50.0 39.2 10.8 27.0 Yes
New Hampshire 50.0 0.0 50.0 55.1 Yes
New Jersey 50.0 50.0 0.0 17.4 Yes
New Mexico 50.0 50.0 0.0 25.8 Yes
New York 50.0 48.9 1.1 17.8 Yes
North Carolina 50.0 47.7 2.3 10.0 Yes
North Dakota 50.0 50.0 0.0 35.2 Yes
Ohio 50.0 42.5 7.5 29.4 Yes
Oklahoma 50.0 50.0 0.0 20.1 Yes
Oregon 50.0 0.0 50.0 59.6 Yes
Pennsylvania 50.0 50.0 0.0 14.5 Yes
Puerto Rico 50.0 50.0 0.0 6.6 Yes
Rhode Island 50.0 50.0 0.0 6.8 Yes
South Carolina 50.0 50.0 0.0 20.4 Yes
South Dakota 50.0 0.0 50.0 52.7 Yes
Tennessee 50.0 50.0 0.0 33.6 Yes
Texas 50.0 50.0 0.0 11.3 Yes
Utah 50.0 50.0 0.0 13.0 Yes
Vermont 50.0 46.7 3.3 39.7 Yes
Virgin Islands 50.0 50.0 0.0 4.1 Yes
Virginia 50.0 45.5 4.5 29.3 Yes
Washington 50.0 50.0 0.0 41.8 Yes
West Virginia 50.0 48.6 1.4 24.8 Yes
Wisconsin 50.0 42.2 7.8 37.3 Yes
Wyoming 50.0 0.0 50.0 76.0 Yes
Source: Congressional Research Service (CRS) based on data from the U.S. Department of Health and Human
Services (HHS).

The Temporary Assistance for Needy Families (TANF) Block Grant: FAQs
Congressional Research Service 28
Table B-7. TANF Work Participation Standard and Rate, By Jurisdiction, for
Two-Parent Families: FY2020
(NA Denotes that the Jurisdiction Did Not Have Two-Parent Families Receiving TANF or MOE-Funded
Assistance)
State Statutory
Standard
Caseload
Reduction
Credit
Effective
(after-
credit
standard)
Work
Participation
Rate
Met the
Standard?
Alabama 90.0% 90.0% 0.0% 48.1% Yes
Alaska 90.0 54.8 35.2 52.1 Yes
Arizona 90.0 76.0 14.0 27.1 Yes
Arkansas 90.0 75.8 14.2 16.8 Yes
California 90.0 30.5 59.5 27.5 No
Colorado NA NA NA NA NA
Connecticut NA NA NA NA NA
Delaware NA NA NA NA NA
District of Col. NA NA NA NA NA
Florida 90.0 86.7 3.3 17.1 Yes
Georgia NA NA NA NA NA
Guam 90.0 52.9 37.1 9.5 No
Hawaii 90.0 77.9 12.1 26.4 Yes
Idaho NA NA NA NA NA
Illinois NA NA NA NA NA
Indiana 90.0 83.2 6.8 29.3 Yes
Iowa 90.0 84.5 5.5 13.1 Yes
Kansas 90.0 77.1 12.9 33.8 Yes
Kentucky 90.0 56.0 34.0 43.0 Yes
Louisiana NA NA NA NA NA
Maine 90.0 0.0 90.0 94.0 Yes
Maryland NA NA NA NA NA
Massachusetts 90.0 25.1 64.9 86.0 Yes
Michigan NA NA NA NA NA
Minnesota NA NA NA NA NA
Mississippi NA NA NA NA NA
Missouri NA NA NA NA NA
Montana 90.0 54.8 35.2 41.8 Yes
Nebraska NA NA NA NA NA
Nevada 90.0 39.2 50.8 38.3 No
New Hampshire NA NA NA NA NA
New Jersey 90.0 82.9 7.1 94.2 Yes

The Temporary Assistance for Needy Families (TANF) Block Grant: FAQs
Congressional Research Service 29
State Statutory
Standard
Caseload
Reduction
Credit
Effective
(after-
credit
standard)
Work
Participation
Rate
Met the
Standard?
New Mexico 90.0 64.4 25.6 32.0 Yes
New York NA NA NA NA NA
North Carolina 90.0 47.7 42.3 11.1 No
North Dakota NA NA NA NA NA
Ohio 90.0 88.6 1.4 27.8 Yes
Oklahoma NA NA NA NA NA
Oregon 90.0 0.0 90.0 97.8 Yes
Pennsylvania 90.0 89.6 0.4 20.5 Yes
Puerto Rico NA NA NA NA NA
Rhode Island 90.0 62.4 27.6 7.3 No
South Carolina NA NA NA NA NA
South Dakota NA NA NA NA NA
Tennessee 90.0 77.4 12.6 30.9 Yes
Texas NA NA NA NA NA
Utah NA NA NA NA NA
Vermont 90.0 63.7 26.3 63.0 Yes
Virgin Islands NA NA NA NA NA
Virginia NA NA NA NA NA
Washington 90.0 51.9 38.1 62.4 Yes
West Virginia NA NA NA NA NA
Wisconsin 90.0 63.4 26.6 45.9 Yes
Wyoming 90.0 0.0 90.0 78.6 No
Source: Congressional Research Service (CRS) based on data from the U.S. Department of Health and Human
Services (HHS).
Author Information
Gene Falk
Specialist in Social Policy
Patrick A. Landers
Analyst in Social Policy
Acknowledgments
Amber Wilhelm and Calvin DeSouza produced this report’s data visualizations.

The Temporary Assistance for Needy Families (TANF) Block Grant: FAQs
Congressional Research Service RL32760 · VERSION 204 · UPDATED 30
Disclaimer
This document was prepared by the Congressional Research Service (CRS). CRS serves as nonpartisan
shared staff to congressional committees and Members of Congress. It operates solely at the behest of and
under the direction of Congress. Information in a CRS Report should not be relied upon for purposes other
than public understanding of information that has been provided by CRS to Members of Congress in
connection with CRS’s institutional role. CRS Reports, as a work of the United States Government, are not
subject to copyright protection in the United States. Any CRS Report may be reproduced and distributed in
its entirety without permission from CRS. However, as a CRS Report may include copyrighted images or
material from a third party, you may need to obtain the permission of the copyright holder if you wish to
copy or otherwise use copyrighted material.