the tech museum of innovation financial statements june 30 ... · the tech museum of innovation...
TRANSCRIPT

Frank, Rimerman + Co. LLP
The Tech Museum of Innovation
Financial Statements
June 30, 2015 and 2014


The Tech Museum of InnovationStatements of Financial Position
Temporarily Permanently Temporarily Permanently
Unrestricted Restricted Restricted Total Unrestricted Restricted Restricted Total
ASSETS
Cash and Cash Equivalents 1,990,920$ 518,995$ -$ 2,509,915$ 1,785,395$ 3,547,331$ -$ 5,332,726$
Grants and Other Receivables 353,548 - - 353,548 50,276 - - 50,276
Pledges Receivable, net of discount and allowance for
doubtful accounts of $25,000 ($50,000 in 2014) - 6,604,828 11,000 6,615,828 - 9,080,946 11,000 9,091,946
Prepaid Expenses and Other Assets 306,109 - - 306,109 236,168 - - 236,168
Investments 1,504,564 9,562,692 12,704,706 23,771,962 648,354 6,648,234 12,704,706 20,001,294
Property, Exhibits and Equipment, net 11,058,337 - - 11,058,337 7,265,358 - - 7,265,358
Beneficial Interest in Use of Facility, net - 20,916,156 - 20,916,156 - 21,056,751 - 21,056,751
Total assets 15,213,478$ 37,602,671$ 12,715,706$ 65,531,855$ 9,985,551$ 40,333,262$ 12,715,706$ 63,034,519$
LIABILITIES AND NET ASSETS
Liabilities
Accounts payable 920,943$ -$ -$ 920,943$ 804,299$ -$ -$ 804,299$
Accrued expenses 683,653 - - 683,653 416,836 - - 416,836
Deferred revenue 500,601 - - 500,601 578,653 - - 578,653
Capital lease obligations 30,122 - - 30,122 37,427 - - 37,427
Total liabilities 2,135,319 - - 2,135,319 1,837,215 - - 1,837,215
Commitments (Notes 4, 7 and 8)
Net Assets
Unrestricted 13,078,159 - - 13,078,159 8,148,336 - - 8,148,336
Temporarily restricted - 37,602,671 - 37,602,671 - 40,333,262 - 40,333,262
Permanently restricted - - 12,715,706 12,715,706 - - 12,715,706 12,715,706
Total net assets 13,078,159 37,602,671 12,715,706 63,396,536 8,148,336 40,333,262 12,715,706 61,197,304
Total liabilities and net assets 15,213,478$ 37,602,671$ 12,715,706$ 65,531,855$ 9,985,551$ 40,333,262$ 12,715,706$ 63,034,519$
June 30, 2015 June 30, 2014
See Notes to Financial Statements- 3 -

The Tech Museum of InnovationStatements of ActivitiesYears Ended June 30, 2015 and 2014
Temporarily Permanently Temporarily Permanently
Unrestricted Restricted Restricted Total Unrestricted Restricted Restricted Total
Revenues and Other Support
Public support 1,169,283$ -$ -$ 1,169,283$ 1,149,750$ -$ -$ 1,149,750$
Contributed support 1,426,614 10,103,191 - 11,529,805 1,093,871 6,476,863 - 7,570,734
In-kind contributions 1,575,891 - - 1,575,891 1,416,613 - - 1,416,613
Donated use of facilities 1,263,405 - - 1,263,405 1,271,363 - - 1,271,363
Admissions and fees 3,040,923 - - 3,040,923 5,082,317 - - 5,082,317
Investment income, net 23,210 530,255 - 553,465 43,341 2,515,879 - 2,559,220
Rental and other income 1,653,529 - - 1,653,529 1,758,634 - - 1,758,634
Net assets released from restrictions 13,364,037 (13,364,037) - - 9,745,302 (9,745,302) - -
Total revenues and other support 23,516,892 (2,730,591) - 20,786,301 21,561,191 (752,560) - 20,808,631
Expenses
Program services
Exhibits, programs and experiences 10,304,726 - - 10,304,726 11,876,176 - - 11,876,176
Education 1,802,569 - - 1,802,569 1,528,858 - - 1,528,858
Visitor services 2,188,168 - - 2,188,168 1,835,094 - - 1,835,094
Support services
Fundraising and membership 1,781,036 - - 1,781,036 1,467,285 - - 1,467,285
General and administrative
Marketing 1,133,496 - - 1,133,496 1,078,671 - - 1,078,671
Administration 1,377,074 - - 1,377,074 1,426,565 - - 1,426,565
Total expenses 18,587,069 - - 18,587,069 19,212,649 - - 19,212,649
Change in Net Assets 4,929,823 (2,730,591) - 2,199,232 2,348,542 (752,560) - 1,595,982
Net Assets, beginning of year 8,148,336 40,333,262 12,715,706 61,197,304 5,799,794 41,085,822 12,715,706 59,601,322
Net Assets, end of year 13,078,159$ 37,602,671$ 12,715,706$ 63,396,536$ 8,148,336$ 40,333,262$ 12,715,706$ 61,197,304$
2015 2014
See Notes to Financial Statements- 4 -

The Tech Museum of InnovationStatement of Functional ExpensesYear Ended June 30, 2015
Exhibits,
Programs and Visitor Total Program Fundraising and Total Support
Experiences Education Services Services Membership Marketing Administration Services Total
Salaries 2,833,454$ 799,161$ 1,265,711$ 4,898,326$ 694,924$ 554,509$ 730,021$ 1,979,454$ 6,877,780$
Payroll Taxes 193,028 56,106 88,610 337,744 48,751 38,981 51,177 138,909 476,653
Benefits 238,454 69,881 108,433 416,768 60,129 48,623 60,371 169,123 585,891
Professional Fees 219,416 68,656 500 288,572 58,460 30,982 140,655 230,097 518,669
Materials and Supplies 355,146 52,283 73,512 480,941 53,682 49,102 52,538 155,322 636,263
Advertising and Public Relations 6,777 6,121 - 12,898 56,133 224,264 - 280,397 293,295
Fees and Services 92,935 12,372 13,379 118,686 3,558 55,151 73,504 132,213 250,899
Royalties 371,080 - - 371,080 8,933 - - 8,933 380,013
Bankcard Fees 88,164 - - 88,164 - - - - 88,164
In-kind Contributions - 85,583 - 85,583 55,564 - 50,939 106,503 192,086
Travel and Transportation 94,833 3,042 4,187 102,062 14,729 7,165 49,105 70,999 173,061
Occupancy 776,343 198,056 508,079 1,482,478 91,015 65,966 76,112 233,093 1,715,571
Building and Equipment Rental 140,914 28,914 2,569 172,397 544 937 2,156 3,637 176,034
Depreciation and Amortization 1,609,978 48,040 39,662 1,697,680 28,610 38,147 23,842 90,599 1,788,279
Donated Rent 1,224,049 91,359 39,172 1,354,580 24,710 12,355 12,355 49,420 1,404,000
Tech Awards 1,984,714 - - 1,984,714 506,160 - - 506,160 2,490,874
Other 75,441 282,995 44,354 402,790 75,134 7,314 54,299 136,747 539,537
Total expenses 10,304,726$ 1,802,569$ 2,188,168$ 14,295,463$ 1,781,036$ 1,133,496$ 1,377,074$ 4,291,606$ 18,587,069$
Percent of Total Expenses 55% 10% 12% 77% 10% 6% 7% 23% 100%
Programs Support Services
General and Administrative
See Notes to Financial Statements- 5 -

The Tech Museum of InnovationStatement of Functional ExpensesYear Ended June 30, 2014
Exhibits,
Programs and Visitor Total Program Fundraising and Total Support
Experiences Education Services Services Membership Marketing Administration Services Total
Salaries 2,359,168$ 727,635$ 1,012,635$ 4,099,438$ 650,541$ 492,197$ 769,844$ 1,912,582$ 6,012,020$
Payroll Taxes 166,245 51,800 71,788 289,833 45,716 34,540 54,166 134,422 424,255
Benefits 224,908 68,972 96,414 390,294 61,812 47,044 75,270 184,126 574,420
Professional Fees 217,397 60,906 36,000 314,303 130,818 14,939 150,345 296,102 610,405
Materials and Supplies 476,165 48,482 80,263 604,910 49,647 28,935 57,729 136,311 741,221
Advertising and Public Relations 303,425 19,417 8,767 331,609 391 224,519 - 224,910 556,519
Fees and Services 987,630 14,274 9,718 1,011,622 1,468 86,481 78,876 166,825 1,178,447
Royalties 243,025 - - 243,025 2,921 - - 2,921 245,946
Bankcard Fees 122,221 - - 122,221 - - - - 122,221
In-kind Contributions 3,600 17,896 - 21,496 72,752 - 21,507 94,259 115,755
Travel and Transportation 158,788 13,506 9,380 181,674 10,782 3,583 34,215 48,580 230,254
Occupancy 996,127 151,452 392,663 1,540,242 92,699 95,219 69,684 257,602 1,797,844
Building and Equipment Rental 310,979 25,633 935 337,547 427 147 1,132 1,706 339,253
Depreciation and Amortization 1,297,078 35,000 41,567 1,373,645 26,682 32,018 36,936 95,636 1,469,281
Donated Rent 1,224,051 91,359 39,154 1,354,564 24,718 12,359 12,359 49,436 1,404,000
Tech Awards 2,554,463 - - 2,554,463 231,280 - - 231,280 2,785,743
Other 230,906 202,526 35,810 469,242 64,631 6,690 64,502 135,823 605,065
Total expenses 11,876,176$ 1,528,858$ 1,835,094$ 15,240,128$ 1,467,285$ 1,078,671$ 1,426,565$ 3,972,521$ 19,212,649$
Percent of Total Expenses 62% 8% 9% 79% 8% 6% 7% 21% 100%
Programs
General and Administrative
Support Services
See Notes to Financial Statements- 6 -

The Tech Museum of InnovationStatements of Cash Flows
2015 2014
Cash Flows from Operating Activities:Change in net assets 2,199,232$ 1,595,982$ Adjustments to reconcile change in net assets to net cash provided by operating activities:
Depreciation and amortization 1,788,279 1,469,281Change in allowance for doubtful accounts for
pledges receivable (25,000) (2,000)In-kind contribution of marketable securities (2,421,890) -In-kind donation of property, exhibits and equipment (627,375) (15,038)In-kind rent expense related to contributed use of facility, net 140,595 132,637Net realized and unrealized gain on investments (330,067) (2,318,302)Change in discount on pledges receivable 50,749 (226,598)Retirement of exhibits 71,595 144,910Changes in operating assets and liabilities:
Grants and other receivables (303,272) 1,264,581Pledges receivable 2,450,369 3,236,738Prepaid expenses and other assets (69,941) (27,311)Accounts payable and accrued expenses (463,623) (445,231)Deferred revenue (78,052) 193,556
Net cash provided by operating activities 2,381,599 5,003,205
Cash Flows from Investing Activities:Net proceeds from sale and distribution of investments 1,273,571 1,099,815Purchase of investments (2,292,282) (1,156,850)Purchase of property, exhibits and equipment (4,178,394) (1,874,466)
Net cash used in investing activities (5,197,105) (1,931,501)
Cash Flows from Financing Activities:Payments on capital lease obligations (7,305) (10,135)
Net cash used in financing activities (7,305) (10,135)
Net increase (decrease) in cash and cash equivalents (2,822,811) 3,061,569
Cash and Cash Equivalents, beginning of year 5,332,726 2,271,157
Cash and Cash Equivalents, end of year 2,509,915$ 5,332,726$
Supplemental Schedule of Noncash Investing and Financing Activities
Amounts payable for construction in progress 847,084$ 489,149$
Equipment financed through capital lease obligation -$ 35,708$
Years Ended June 30,
See Notes to Financial Statements- 7 -

The Tech Museum of Innovation Notes to Financial Statements
- 8 -
1. Nature of Activities The mission of The Tech Museum of Innovation (the Museum) is to inspire the innovator in everyone. The Museum accomplishes this by engaging visitors in hands-on learning experiences involving science and technology. The overall mission is that through its exhibits and programs, the Museum will inspire learning and invigorate innovation locally, nationally, and globally. The Museum offers interactive exhibits, hands-on science labs, after-school activities, and standards-based educational IMAX films. Additionally, the Museum hosts two annual signature programs. The Tech Challenge is a team competition that inspires thousands of students in grades 5-12 to design and build devices that solve a real world problem. For the past 28 years, The Tech Challenge has reached out to different ethnic and socioeconomic communities to introduce students not only to Science, Technology, Engineering, and Mathematics (STEM) concepts, but also to the thrill of hands-on learning and real-world design. The Tech Awards, which commenced in 2001, is an international program that identifies and honors individuals and teams that develop technological solutions to humanity’s most pressing problems. The Museum’s staff and volunteers welcome approximately 400,000 visitors annually to the permanent galleries and traveling exhibitions. They also assist visitors with ticketing, choosing programs, and assessing educational opportunities, such as IMAX film presentations. More than 7,000 member households help support the Museum.
2. Significant Accounting Policies Basis of Presentation: The Museum prepares its financial statements on the accrual basis of accounting under accounting principles generally accepted in the United States of America.

The Tech Museum of Innovation Notes to Financial Statements
- 9 -
2. Significant Accounting Policies (continued) Basis of Presentation: (continued) The Museum segregates its assets, liabilities and operations into three categories: unrestricted, temporarily restricted and permanently restricted. The Museum’s net assets and changes therein are classified and reported as follows:
Unrestricted net assets consist of net assets for which there are no donor-imposed restrictions or such donor-imposed restrictions were temporary and expired during the current or previous years. Temporarily restricted net assets are those whose use is restricted by the donor based on time or purpose. Generally, these funds will be expended for a specified purpose or for a period of time and not currently available for general use. When a donor restriction expires, temporarily restricted net assets are reclassified to unrestricted net assets and reported in the Statements of Activities as net assets released from restriction. Permanently restricted net assets are assets restricted by the donor in perpetuity. These assets consist of investments and pledges receivable. Income from these assets is recorded as unrestricted or temporarily restricted net assets unless otherwise permanently restricted by donor stipulations.
Estimates: The preparation of financial statements in conformity with accounting principles generally accepted in the United States of America requires management to make estimates and assumptions that affect the reported amounts of assets and liabilities, disclosure of contingent assets and liabilities and reported amounts of revenues and expenses in the financial statements and accompanying notes. Actual results could differ from those estimates. Revenue Recognition: The Museum recognizes grants, contributions and unconditional promises to give (pledges) as revenue at their fair value in the period the donor makes the contribution or pledge that is, in substance, unconditional. Conditional promises to give and support are not recognized until the conditions are met. The Museum distinguishes among contributions that increase any of the three categories of net assets, with recognition being made of the expiration of donor-imposed restrictions in the period in which the restrictions expire. Grants and contributions to be received after one year are reflected at the present value of estimated future cash flows.

The Tech Museum of Innovation Notes to Financial Statements
- 10 -
2. Significant Accounting Policies (continued) Revenue Recognition: (continued) Admissions are recorded when received. Membership dues are deferred upon receipt and recognized ratably over the membership period, generally for one year following the period of receipt. Amounts received for services or events not yet provided are classified as deferred revenue, and are recognized in the period in which the service is provided or the event takes place. In-Kind Donations: The Museum records various types of in-kind donations including professional services, tangible assets and the use of tangible assets. Contributed professional services are recognized if the services received (a) create or enhance long-lived assets or (b) require specialized skills, are provided by individuals possessing those skills, and would typically need to be purchased if not provided by donation. Contributions of tangible assets, or the use thereof, are recognized when promised or received, whichever is earlier. The amounts reflected in the accompanying financial statements as in-kind donations are offset by like amounts of expenses or in the case of long-term assets, over the period benefited. Additionally, the Museum receives a significant amount of contributed time related to program services and fundraising, which does not meet the recognition criteria described above. Accordingly, the value of this contributed time has not been determined and is not reflected in the accompanying financial statements. In 2015, the Museum recognized in-kind contribution revenue of $1,576,000 (in-kind contribution revenue of $1,417,000 in 2014). Expenses related to these in-kind donations are recognized in the Statement of Functional Expenses as in-kind contributions of $192,000 (in-kind contributions of $116,000 in 2014) and Tech Awards expense of $757,000 (Tech Awards expense of $1,286,000 in 2014). The remaining $627,000 represents donated property, exhibits and equipment ($15,000 represents donated property, exhibits and equipment in 2014). Cash Equivalents: The Museum considers all short-term, highly liquid investments purchased with an original maturity of three months or less to be cash equivalents.

The Tech Museum of Innovation Notes to Financial Statements
- 11 -
2. Significant Accounting Policies (continued) Fair Value Measurements: Investments in marketable securities and money market funds are reported at fair value based on quoted market prices. Certificates of deposit that have original maturities of greater than three months are included in investments and are reported at fair value based on cost and accumulated interest. Investment income is recorded on the accrual basis and dividends are recorded at the ex-dividend date. Unrealized gains and losses are included in investment income or loss. Investments in private equity, fixed income and venture capital funds are reported at fair value based on quoted market prices, to the extent these funds are invested in publicly traded investments. The remaining investments are carried at estimated fair values as determined by the investment managers and general partners of these funds after giving consideration to operating results, financial condition, recent sales prices of issuers’ securities and other pertinent information. These investments are valued based on the Museum’s percentage interest owned in each fund. Because of the inherent uncertainty of valuations, however, the estimated fair values may differ significantly from the values that would have been used had a ready market for the securities existed, and the differences could be material. Income and gains on restricted investments are reported as increases in unrestricted or temporarily restricted net assets unless otherwise restricted by the donor. Pledges receivable that are not due within one year are recorded at estimated fair value. The Museum estimated fair value by discounting future cash flows to present value using the discount rate at the date of the financial statements, which considers the risk free-rate and a risk premium based on the donor’s credit worthiness. At June 30, 2015 and 2014, the Museum applied a discount rate of 2.25%. Concentrations of Credit Risk: Financial instruments that potentially subject the Museum to concentrations of credit risk consist primarily of cash and cash equivalents, investments, pledges receivable and other receivables. The Museum maintains most of its cash accounts at one commercial bank. The Museum’s cash and cash equivalents generally exceed the amount insured by the Federal Deposit Insurance Corporation. The Museum’s investment balances exceed the limit insured by the Securities Investor Protection Corporation.

The Tech Museum of Innovation Notes to Financial Statements
- 12 -
2. Significant Accounting Policies (continued) Concentrations of Credit Risk: (continued) Receivables are generally from local donors and these donors’ credit worthiness is evaluated by the Museum on a regular basis. The Museum makes judgments as to the ability to collect all of its outstanding receivables and provides allowances for potential credit losses as needed. Credit losses have historically been within management’s expectation. Property, Exhibits and Equipment: The Museum capitalizes property, exhibits and equipment acquisitions over $3,000. Purchased or constructed property, exhibits and equipment are recorded at cost. Donated property, exhibits and equipment are recorded at their estimated fair value. Depreciation is computed using the straight-line method over the estimated useful lives of the respective assets ranging from three to 20 years. Leasehold improvements are amortized over the shorter of the asset life or the remaining lease term. Gifts of property, exhibits and equipment are reported as unrestricted support unless explicit donor stipulations specify how the donated assets must be used. Gifts of long-lived assets with explicit restrictions that specify how the assets are to be used and gifts of cash or other assets that must be used to acquire long-lived assets are reported as temporarily restricted support. Absent explicit donor stipulations about how long those long-lived assets must be maintained, expirations of donor restrictions are reported when the donated or acquired long-lived assets are placed in service. Accounting for Impairment of Long-Lived Assets: The Museum reviews its long-lived assets for impairment whenever events or changes in circumstances indicate the carrying value may not be recoverable. When it is determined the carrying value of long-lived assets may not be recoverable, the Museum measures any impairment based on projected discounted cash flows using a discount rate commensurate with the risk inherent in its current operation model. To date, the Museum has not recorded any impairment of its long-lived assets.

The Tech Museum of Innovation Notes to Financial Statements
- 13 -
2. Significant Accounting Policies (continued) Income Taxes: The Museum has been determined to be exempt from federal income taxes under Section 501(a) of the Internal Revenue Code (Code) as an organization described in Section 501(c)(3) of the Code. The Museum is also exempt from California income taxes under Section 23701 of the California Revenue and Taxation Code. Although an organization is recognized as tax exempt, it is still liable for tax on its unrelated business taxable income (UBTI). The Museum does not believe it has UBTI that will result in an income tax liability. The Museum’s federal exempt organization business income tax returns are subject to examination by the Internal Revenue Service, generally for three years after they were filed. The Museum applies the provisions set forth in FASB Accounting Standards Codification Topic 740 to account for uncertainty in income taxes. The Museum assessed all income tax positions taken where the statute of limitation remained open. The Museum believes that its tax filing positions will be sustained upon tax examinations; therefore, no liability for unrecognized income tax benefits has been recorded at June 30, 2015. The Museum does not anticipate any significant increases or decreases to unrecognized income tax benefits during the next 12 months. Functional Expenses: The costs of providing the Museum’s various programs and services have been summarized on a functional basis in the Statements of Functional Expenses. Directly identifiable expenses are charged to the related program or service benefited. Indirect expenses are allocated to programs and services based principally on the percentage of personnel time spent in each area or square footage utilized by the program or service. Certain costs incurred for the Tech Awards Gala are considered to be joint costs. These costs have been allocated to the Tech Awards program ($270,000 in 2015 and $240,000 in 2014), which is included in exhibits, programs and experiences, and to fundraising and membership ($90,000 in 2015 and $80,000 in 2014) in the Statements of Functional Expenses. Advertising: Costs associated with advertising are expensed when incurred. Advertising expenses, including in-kind services, were $667,000 in 2015 ($1,296,000 in 2014).

The Tech Museum of Innovation Notes to Financial Statements
- 14 -
2. Significant Accounting Policies (continued) Reclassifications: Certain prior year balances have been reclassified to conform to current year presentation. Recent Accounting Pronouncement Not Yet Effective: In May 2015, the Financial Accounting Standards Board (FASB) issued Accounting Standards Update (ASU) No. 2015-07, Fair Value Measurement (Topic 820): Disclosures for Investments in Certain Entities That Calculate Net Asset Value per Share (or its Equivalent). ASU 2015-07 removes the requirement to categorize within the fair value hierarchy all investments for which fair value is measured using net asset value per share as a practical expedient. ASU 2015-07 becomes effective for the Museum as of July 1, 2017. Early adoption is permitted; however, the Museum has not elected to adopt the standard in these financial statements. The Museum is currently evaluating the effect ASU 2015-07 will have on its financial statements and believes the adoption of the standard will simplify the methodology for valuation of certain of its non-marketable investments and the related footnote disclosures.
3. Pledges Receivable The following table represents pledges receivable at June 30:
2015 2014
The Tech 3.0 Campaign $ 5,536,000 $ 6,882,000 Other 1,080,000 2,210,000
Net pledges receivable $ 6,616,000 $ 9,092,000 Receivable in less than one year $ 2,807,000 $ 5,437,000 Receivable in one to five years 4,013,000 3,833,000
Subtotal 6,820,000 9,270,000 Less: allowance for doubtful accounts (25,000) (50,000) Less: unamortized discount to present value (179,000) (128,000)
Net pledges receivable $ 6,616,000 $ 9,092,000

The Tech Museum of Innovation Notes to Financial Statements
- 15 -
3. Pledges Receivable (continued) In 2012, the Museum established The Tech 3.0 Campaign (the Campaign) with a goal to raise $50,000,000 by 2017. The amounts raised will be used to fund various programs and functions of the Museum, including construction and ongoing staffing and maintenance of new exhibits. Through June 30, 2015, the Museum has raised $28,407,000 in relation to the Campaign, of which $22,744,000 had been received.
4. Investments Investments consist of the following at June 30: 2015 2014 Unrestricted and temporarily restricted investments: Certificates of deposit $ 9,167,764 $ 4,168,428 Equity funds 1,805,724 2,060,561 Money market funds 93,768 1,067,599
Total $ 11,067,256 $ 7,296,588
Permanently restricted investments: Equity funds $ 7,678,794 $ 7,311,778 Fixed income funds 3,786,222 3,838,954 Venture capital funds 1,239,690 1,171,474 Commodity fund - 382,500
Total $ 12,704,706 $ 12,704,706
Investment income represents earned income and gains and losses, net of investment management expenses. Realized gains and losses on investments are calculated as the difference between proceeds received and the original cost of the investment. Unrealized gains and losses represent the difference between the current fair value of the investments and their cost basis, if purchased during the year, or their fair value at the beginning of the year. Investment income comprise of the following for the years ended June 30: 2015 2014
Interest and dividends $ 265,287 $ 284,725 Net realized and unrealized gains 330,067 2,318,302 Investment management expenses (41,889) (43,807)
$ 553,465 $ 2,559,220

The Tech Museum of Innovation Notes to Financial Statements
- 16 -
4. Investments (continued) The Museum categorizes its investments into a three-level hierarchy for fair value measurements based on the nature of inputs used in the valuation of an asset or liability as of the measurement date. The Museum defines fair value as the price that would be received to sell an asset or paid to transfer a liability in an orderly transaction between market participants at the measurement date. The inputs or methodology used for valuing investments are not necessarily an indication of the risk associated with investing in those investments. The three-level hierarchy for fair value measurements is defined as follows:
Level I: Inputs to the valuation methodology are quoted prices (unadjusted) for identical assets or liabilities in active markets.
Level II: Inputs to the valuation methodology include quoted prices for similar assets and
liabilities in active markets, and inputs that are observable for the asset or liability, either directly or indirectly, for substantially the full term of the financial instrument.
Level III: Inputs to the valuation methodology are unobservable and significant to the fair value
measurement. An investment’s categorization within the valuation hierarchy is based upon the lowest level of input that is significant to the fair value measurement. The following table presents the investments carried at fair value as of June 30, 2015 under the three-level hierarchy: Level I Level II Level III Total
Certificates of deposit $ 9,167,764 $ - $ - $ 9,167,764 Money market funds 93,768 - - 93,768 Equity funds: Domestic 8,981,151 - - 8,981,151 International 503,367 - - 503,367 Fixed income funds - 3,786,222 - 3,786,222 Venture capital funds - - 1,239,690 1,239,690
Total $ 18,746,050 $ 3,786,222 $ 1,239,690 $ 23,771,962

The Tech Museum of Innovation Notes to Financial Statements
- 17 -
4. Investments (continued) The following table presents the investments carried at fair value as of June 30, 2014 under the three-level hierarchy:
Level I Level III Total
Certificates of deposit $ 4,168,428 $ - $ 4,168,428 Money market funds 1,067,599 - 1,067,599 Equity funds: Domestic - 8,825,661 8,825,661 International - 546,678 546,678 Fixed income funds - 3,838,954 3,838,954 Venture capital funds - 1,171,474 1,171,474 Commodity fund - 382,500 382,500
Total $ 5,236,027 $ 14,765,267 $ 20,001,294 At June 30, 2015, the Museum’s investment in equity, fixed income and venture funds includes four funds offered by the same investment firm (five funds at June 30, 2014). The four funds are comprised of cash and cash equivalents, common stock, equities, commodities and a wide range of other investment categories. The redemption frequency of these funds ranges from weekly to monthly, with five business days’ notice. When a determination is made to classify an investment within Level III, the determination is based upon the significance of the unobservable inputs to the overall fair value measurement. During 2015, $3,786,222 of fund investments were transferred from Level III to Level II and $9,484,518 were transferred from Level III to Level I of the three-level hierarchy. Based on the underlying investment portfolios in the funds, management has determined that the unobservable inputs within each fund are no longer significant to the overall fair value measurement. The following tables include a roll-forward of the amounts in the Statements of Financial Position for the years ended June 30, 2015 and 2014 (including the change in fair value) for non-marketable securities. The gains and losses in the table below may include changes in fair value on Level III investments due in part to unobservable inputs that are a component of the valuation methodology.

The Tech Museum of Innovation Notes to Financial Statements
- 18 -
4. Investments (continued) Investment activity in in the Museum’s non-marketable securities consists of the following for the year ended June 30, 2015:
Realized and July 1, Unrealized Investment June 30, 2014 Contributions Gain (Loss) Income (Loss) Distributions 2015
Commonfund Institutional Multi-Strategy Equity Fund, LLC $ 8,825,661 $ 195,929 $ 380,548 $ 81,876 $ (502,863) $ 8,981,151 Commonfund Institutional Multi-Strategy Bond Fund, LLC 1,920,275 97,550 (38,879) 60,941 (108,616) 1,931,271 Commonfund Institutional High Quality Bond Fund, LLC 1,918,679 - (18,639) 59,330 (104,419) 1,854,951 Commonfund Institutional International Equity Fund, LLC 546,678 - (23,942) 8,733 (28,102) 503,367 Commonfund Institutional Commodities LTD 382,500 - (89,051) 30 (293,479) - Legacy Venture V, LLC 720,058 60,000 176,108 (5,625) (125,117) 825,424 Legacy Venture VII, LLC 28,066 135,002 2,119 (2,932) - 162,255 University Technology Ventures, LP 423,350 - (60,364) - (110,975) 252,011
Total $ 14,765,267 $ 488,481 $ 327,900 $ 202,353 $ (1,273,571) $ 14,510,430
Investment activity in in the Museum’s non-marketable securities consists of the following for the year ended June 30, 2014:
Realized and July 1, Unrealized Investment June 30, 2013 Contributions Gain (Loss) Income (Loss) Distributions 2014
Commonfund Institutional Multi-Strategy Equity Fund, LLC $ 7,684,510 $ - $ 1,726,645 $ 78,761 $ (664,255) $ 8,825,661 Commonfund Institutional Multi-Strategy Bond Fund, LLC 1,814,010 - 48,899 59,598 (2,232) 1,920,275 Commonfund Institutional High Quality Bond Fund, LLC 1,787,857 36,721 34,531 59,570 - 1,918,679 Commonfund Institutional International Equity Fund, LLC 604,404 - 105,248 16,666 (179,640) 546,678 Commonfund Institutional Commodities LTD 242,701 126,406 13,353 40 - 382,500 Legacy Venture V, LLC 539,739 90,000 187,046 (11,120) (85,607) 720,058 Legacy Venture VII, LLC - 30,000 (1,302) (632) - 28,066 University Technology Ventures, LP 392,857 - 198,574 - (168,081) 423,350
Total $ 13,066,078 $ 283,127 $ 2,312,994 $ 202,883 $ (1,099,815) $ 14,765,267
The Tech Museum of Innovation Notes to Financial Statements
- 19 -
4. Investments (continued)
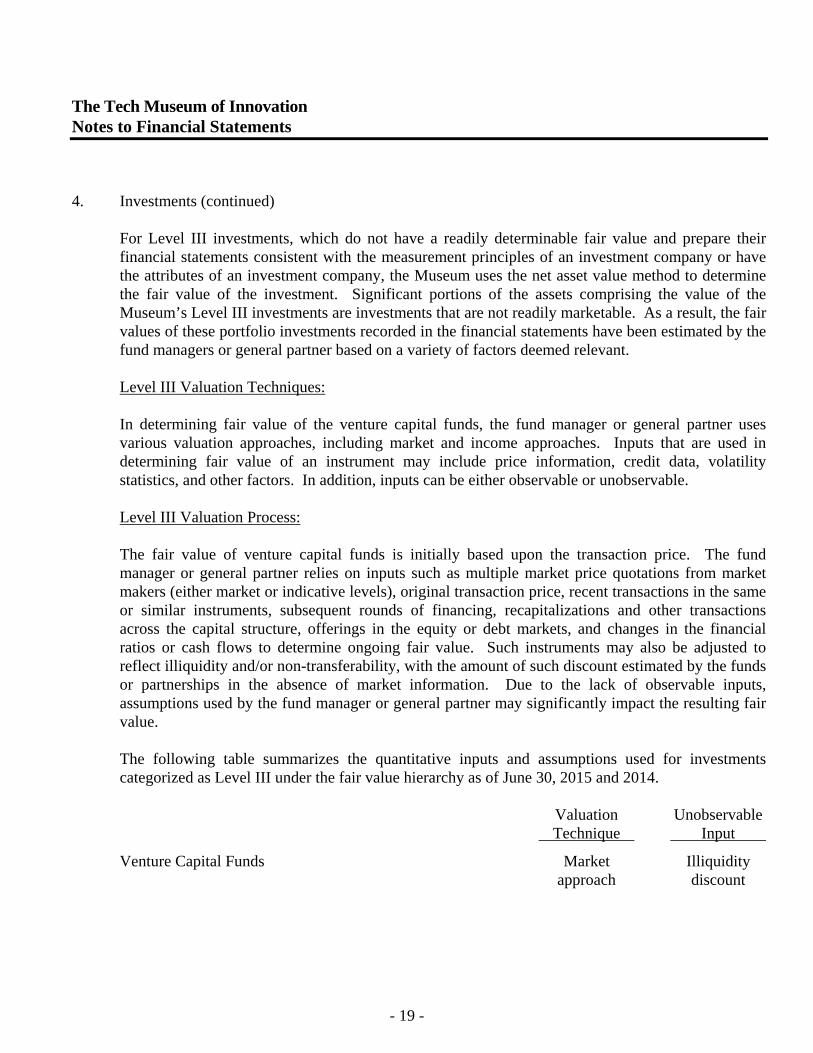
For Level III investments, which do not have a readily determinable fair value and prepare their financial statements consistent with the measurement principles of an investment company or have the attributes of an investment company, the Museum uses the net asset value method to determine the fair value of the investment. Significant portions of the assets comprising the value of the Museum’s Level III investments are investments that are not readily marketable. As a result, the fair values of these portfolio investments recorded in the financial statements have been estimated by the fund managers or general partner based on a variety of factors deemed relevant. Level III Valuation Techniques: In determining fair value of the venture capital funds, the fund manager or general partner uses various valuation approaches, including market and income approaches. Inputs that are used in determining fair value of an instrument may include price information, credit data, volatility statistics, and other factors. In addition, inputs can be either observable or unobservable. Level III Valuation Process: The fair value of venture capital funds is initially based upon the transaction price. The fund manager or general partner relies on inputs such as multiple market price quotations from market makers (either market or indicative levels), original transaction price, recent transactions in the same or similar instruments, subsequent rounds of financing, recapitalizations and other transactions across the capital structure, offerings in the equity or debt markets, and changes in the financial ratios or cash flows to determine ongoing fair value. Such instruments may also be adjusted to reflect illiquidity and/or non-transferability, with the amount of such discount estimated by the funds or partnerships in the absence of market information. Due to the lack of observable inputs, assumptions used by the fund manager or general partner may significantly impact the resulting fair value. The following table summarizes the quantitative inputs and assumptions used for investments categorized as Level III under the fair value hierarchy as of June 30, 2015 and 2014.
Valuation Unobservable Technique Input
Venture Capital Funds Market Illiquidity approach discount

The Tech Museum of Innovation Notes to Financial Statements
- 20 -
4. Investments (continued) While the fund manager or general partner believes the valuation methods used are appropriate and consistent with those used by other market participants, the use of different methodologies or assumptions to determine the fair value of the non-marketable investments could result in a different estimate of fair value at the reporting date. Estimated fair values may differ significantly from the values that would have been used had a readily available market for such investments existed, or had such investments been liquidated, and these differences could be material to the financial statements. The Museum has commitments to invest additional capital to fund certain of its non-marketable investments. At June 30, 2015, the Museum had future capital call commitments of $691,000, which are payable when required by the fund manager.
5. Property, Exhibits and Equipment Property, exhibits and equipment consist of the following at June 30: 2015 2014
Exhibits $ 12,806,967 $ 11,483,656 Building and leasehold improvements 11,255,326 10,246,417 Equipment 5,572,852 4,717,052 Construction in progress 2,804,862 2,453,420
32,440,007 28,900,545
Accumulated depreciation and amortization (21,381,670) (21,635,187)
Property, exhibits and equipment, net $ 11,058,337 $ 7,265,358 Museum exhibits are generally constructed by the Museum and consist of materials, supplies, salaries and related benefits. Exhibits under construction are recorded as construction in progress, which will be recorded as exhibits and depreciated when placed in service. In 2015, the Museum recognized a retirement loss of $36,000 on exhibits under construction that were capitalized in prior years that would not be placed into service ($145,000 in 2014).

The Tech Museum of Innovation Notes to Financial Statements
- 21 -
6. Beneficial Interest in Use of Facility In 1998, the Museum entered into a 55 year agreement with the City of San Jose to lease its primary facility for $1 per year. The Museum has recorded an asset to reflect a beneficial interest in the use of the facility, representing the estimated fair value of the lease at its inception. The asset is being amortized over the lease term to revenue as donated use of facility. The beneficial interest in the use of facility is as follows at June 30: 2015 2014
Total benefit in interest in use of facility $ 54,054,000 $ 55,458,000 Less discount at 6% to net present value (33,137,844) (34,401,249)
Net beneficial interest in use of facility $ 20,916,156 $ 21,056,751 The following amounts have been recognized in the Statements of Activities in connection with the beneficial interest in use of facility for the years ended June 30: 2015 2014
Rent expense $ 1,404,000 $ 1,404,000 Amortization of discount (1,263,405) (1,271,363)
Net decrease in temporarily restricted net assets $ 140,595 $ 132,637
7. Line of Credit The Museum has a $2,000,000 line of credit with a bank, which the bank has extended annually. The line of credit expires in January 2017. Borrowings under the agreement bear interest at the bank’s prime rate (3.25% at June 30, 2015) and are secured by all deposits and accounts maintained with the bank. The Museum did not borrow any amounts against the line in 2015 (borrowed and repaid $1,000,000 in 2014).
The Tech Museum of Innovation Notes to Financial Statements
- 22 -
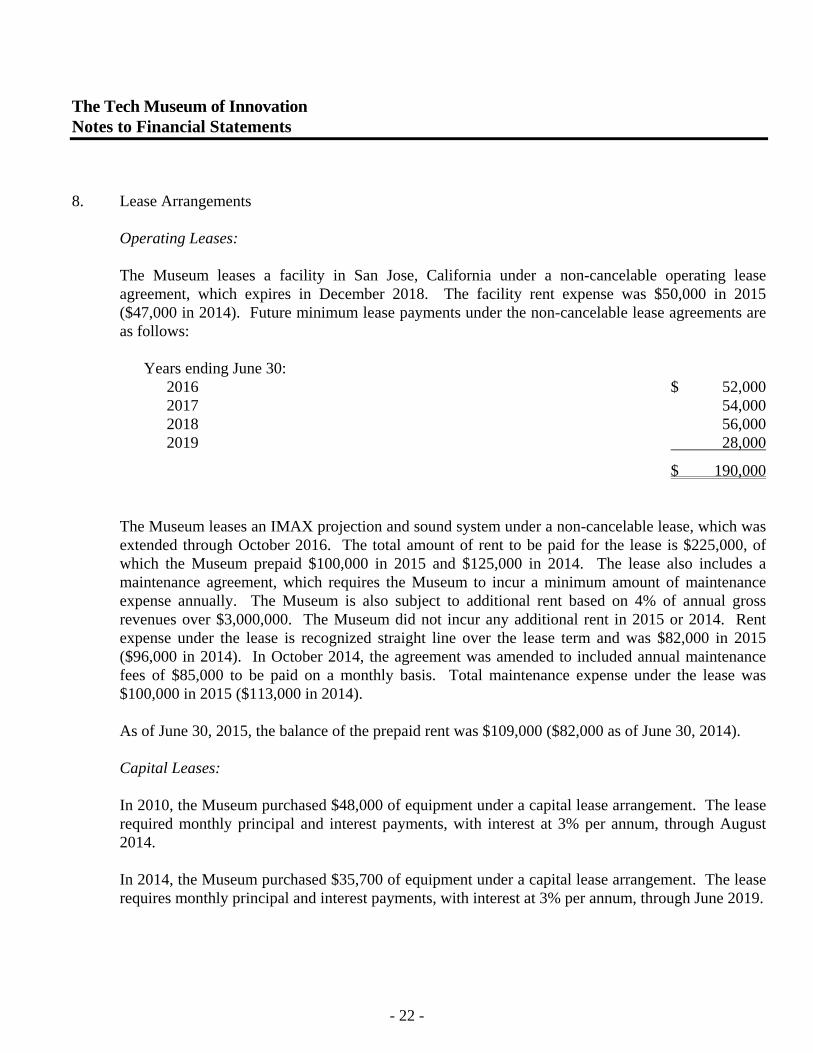
8. Lease Arrangements Operating Leases: The Museum leases a facility in San Jose, California under a non-cancelable operating lease agreement, which expires in December 2018. The facility rent expense was $50,000 in 2015 ($47,000 in 2014). Future minimum lease payments under the non-cancelable lease agreements are as follows: Years ending June 30: 2016 $ 52,000 2017 54,000 2018 56,000 2019 28,000
$ 190,000 The Museum leases an IMAX projection and sound system under a non-cancelable lease, which was extended through October 2016. The total amount of rent to be paid for the lease is $225,000, of which the Museum prepaid $100,000 in 2015 and $125,000 in 2014. The lease also includes a maintenance agreement, which requires the Museum to incur a minimum amount of maintenance expense annually. The Museum is also subject to additional rent based on 4% of annual gross revenues over $3,000,000. The Museum did not incur any additional rent in 2015 or 2014. Rent expense under the lease is recognized straight line over the lease term and was $82,000 in 2015 ($96,000 in 2014). In October 2014, the agreement was amended to included annual maintenance fees of $85,000 to be paid on a monthly basis. Total maintenance expense under the lease was $100,000 in 2015 ($113,000 in 2014). As of June 30, 2015, the balance of the prepaid rent was $109,000 ($82,000 as of June 30, 2014). Capital Leases: In 2010, the Museum purchased $48,000 of equipment under a capital lease arrangement. The lease required monthly principal and interest payments, with interest at 3% per annum, through August 2014. In 2014, the Museum purchased $35,700 of equipment under a capital lease arrangement. The lease requires monthly principal and interest payments, with interest at 3% per annum, through June 2019.

The Tech Museum of Innovation Notes to Financial Statements
- 23 -
8. Lease Arrangements (continued) Operating Leases: (continued) Future minimum lease payments under the capital leases are as follows: Years ending June 30, 2016 $ 8,000 2017 8,000 2018 8,000 2019 7,000
Total lease payments 31,000 Less: amount representing interest (1,000)
Capital lease obligation $ 30,000
9. Employee Retirement Plans The Museum has a defined contribution retirement plan for employees meeting certain employment service requirements. Eligible employees may elect to contribute to the plan and the Museum may make qualified non-elective discretionary contributions. The Museum did not make any contributions to the plan in 2015 or 2014. In 1999, the Museum initiated a key employee option plan (the Option Plan) whereby selected employees entered into pre-tax compensation reduction option agreements with the Museum, concurrent with being awarded non-qualified options to purchase shares in a fund. The number of options granted was based on actual compensation reduction amounts assuming a 25% discount from fair value to be paid upon exercise of the options. The funds were created with monies contributed by the Museum and employees as specified in their respective compensation reduction agreements. In 1999, the Museum awarded options to four employees, all of which were exercisable. The Museum subsequently froze participation in the Option Plan. In 2014, the last employee remaining exercised her option, causing the Option Plan to terminate. Accrued expenses at June 30, 2014 included $12,000 associated with the Option Plan.
The Tech Museum of Innovation Notes to Financial Statements
- 24 -
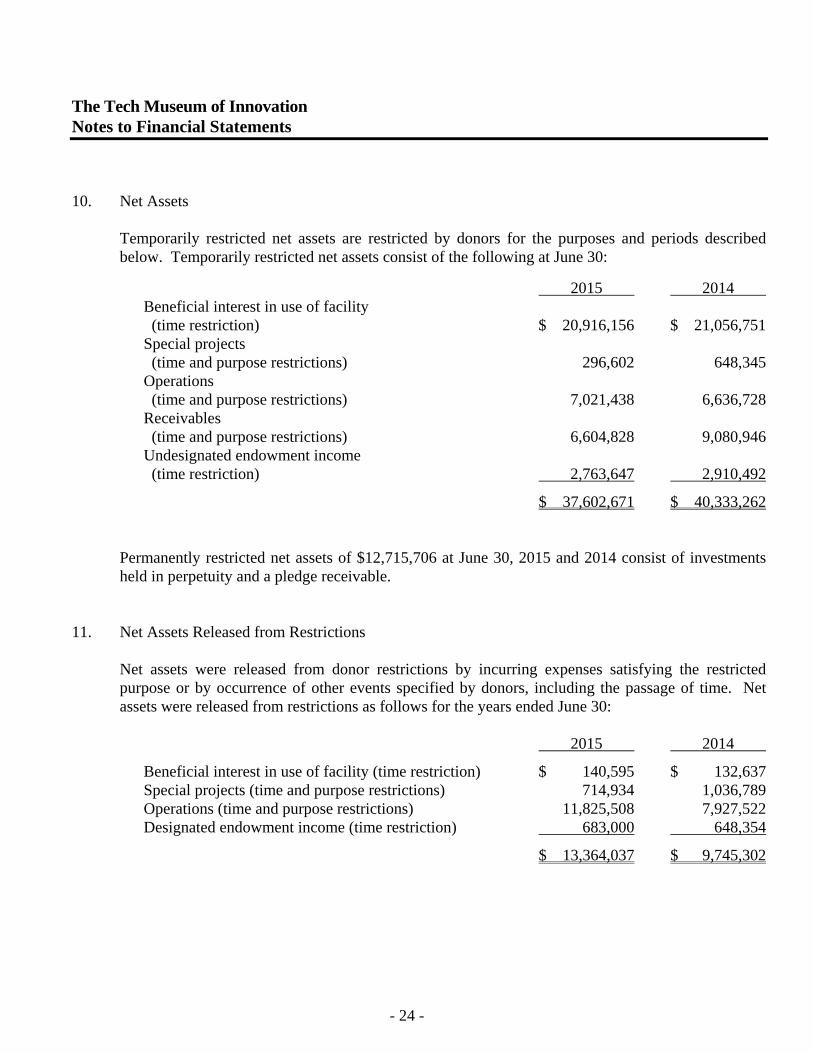
10. Net Assets Temporarily restricted net assets are restricted by donors for the purposes and periods described below. Temporarily restricted net assets consist of the following at June 30:
2015 2014 Beneficial interest in use of facility (time restriction) $ 20,916,156 $ 21,056,751 Special projects (time and purpose restrictions) 296,602 648,345 Operations (time and purpose restrictions) 7,021,438 6,636,728 Receivables (time and purpose restrictions) 6,604,828 9,080,946 Undesignated endowment income (time restriction) 2,763,647 2,910,492
$ 37,602,671 $ 40,333,262
Permanently restricted net assets of $12,715,706 at June 30, 2015 and 2014 consist of investments held in perpetuity and a pledge receivable.
11. Net Assets Released from Restrictions Net assets were released from donor restrictions by incurring expenses satisfying the restricted purpose or by occurrence of other events specified by donors, including the passage of time. Net assets were released from restrictions as follows for the years ended June 30: 2015 2014
Beneficial interest in use of facility (time restriction) $ 140,595 $ 132,637 Special projects (time and purpose restrictions) 714,934 1,036,789 Operations (time and purpose restrictions) 11,825,508 7,927,522 Designated endowment income (time restriction) 683,000 648,354
$ 13,364,037 $ 9,745,302

The Tech Museum of Innovation Notes to Financial Statements
- 25 -
12. Endowment The Museum’s endowment consists of contributions receivable or received, which are permanently restricted by the donors. As required by generally accepted accounting principles, net assets associated with endowment funds are classified and reported based on the existence or absence of donor-imposed restrictions. The Museum’s Board of Directors has interpreted the State Prudent Management of Institutional Funds Act (SPMIFA) as requiring the preservation of the fair value of the original gift as of the gift date of the donor-restricted endowment funds, absent explicit donor stipulations to the contrary. As a result of this interpretation, the Museum classifies as permanently restricted net assets (a) the original value of gifts donated to the permanent endowment, (b) the original value of subsequent gifts to the permanent endowment, and (c) accumulations to the permanent endowment made in accordance with the direction of the applicable donor gift instrument at the time the accumulation is added to the fund. The remaining portion of the donor-restricted endowment fund that is not classified as permanently restricted net assets is classified as temporarily restricted net assets until those amounts are appropriated for expenditure by the Museum in a manner consistent with the standard of prudence prescribed by SPMIFA. Once appropriated, these amounts are classified as unrestricted net assets. In accordance with SPMIFA, the Museum considers the following factors in making a determination to appropriate or accumulate donor-restricted endowment funds:
(1) The duration and preservation of the fund; (2) The purposes of the Museum and the donor-restricted endowment fund; (3) General economic conditions; (4) The possible effect of inflation and deflation; (5) The expected total return from income and the appreciation of investments; (6) Other resources of the Museum; (7) The Museum’s investment policies.

The Tech Museum of Innovation Notes to Financial Statements
- 26 -
12. Endowment (continued) Endowment net assets consist of the following at June 30, 2015: Temporarily Permanently Unrestricted Restricted Restricted Total
Donor-Restricted Endowment Funds $ - $ - $ 12,715,706 $ 12,715,706
Undesignated Endowment Income - 2,763,473 - 2,763,473
$ - $ 2,763,473 $ 12,715,706 $ 15,479,179 Endowment net assets consist of the following at June 30, 2014: Temporarily Permanently Unrestricted Restricted Restricted Total
Donor-Restricted Endowment Funds $ - $ - $ 12,715,706 $ 12,715,706
Undesignated Endowment Income - 2,910,492 - 2,910,492
$ - $ 2,910,492 $ 12,715,706 $ 15,626,198 Changes in endowment net assets for the year ended June 30, 2015 are as follows: Temporarily Permanently Unrestricted Restricted Restricted Total Endowment Net Assets, beginning of year $ - $ 2,910,492 $ 12,715,706 $ 15,626,198 Net appreciation - 535,981 - 535,981 Appropriated for
expenditure - (683,000) - (683,000) Endowment Net Assets, end of year $ - $ 2,763,473 $ 12,715,706 $ 15,479,179

The Tech Museum of Innovation Notes to Financial Statements
- 27 -
12. Endowment (continued)
Changes in endowment net assets for the year ended June 30, 2014 are as follows:
Temporarily Permanently Unrestricted Restricted Restricted Total Endowment Net Assets, beginning of year $ - $ 1,042,967 $ 12,715,706 $ 13,758,673 Net appreciation - 2,515,879 - 2,515,879 Appropriated for
expenditure - (648,354) - (648,354) Endowment Net Assets, end of year $ - $ 2,910,492 $ 12,715,706 $ 15,626,198 The Museum has adopted an investment policy for endowment assets with the primary objectives to preserve the real purchasing power of the principal and provide a stable source of perpetual financial support. Under this policy, the investments are diversified to help minimize the overall risk of the portfolio. On an annualized, net-of-fee basis, the total return of the portfolio will be expected to equal or exceed the spending rate (targeted at a minimum of 5% per annum) plus inflation based on the consumer price index over a rolling five year period. Additionally, the returns should show favorable, relative performance characteristics. It is the Museum’s policy, subject to maximum distribution defined as 5% of the three-year moving average of the endowment fund assets, to determine the appropriate annual cash distribution from the fund to support its operations; however, in no event will the spending policy adopted result in the fair value of the endowment fund to be less than the amount the donor or SPMIFA require to be held in perpetuity. At June 30, 2015, the fair value of endowment assets exceeded their cost by $2,763,473 ($2,910,492 at June 30, 2014).

The Tech Museum of Innovation Notes to Financial Statements
- 28 -
13. Related Parties The Museum’s Board of Directors (the Board) is active in oversight of fundraising events, activities and in making private contributions. Contributions received from the Board or from companies with which Board members are affiliated with were $4,390,000 in 2015 ($2,778,000 in 2014). Amounts due from the Board and affiliates are $3,235,000 at June 30, 2015 ($8,151,000 at June 30, 2014).
14. Subsequent Events Subsequent events have been evaluated through the date of the independent auditors’ report, which is the date the financial statements were approved by the Museum and available to be issued.