the teamlease employment outlook report - oct-mar, 2015-16
TRANSCRIPT
Comprehensive overview of the mechanics of hiring, job growth, salaries and their drivers,
trends and forecasts across eight cities and nine sectors in India.
EMPLOYMENT OUTLOOK REPORT
TEAMLEASE SERVICES
HY-2, 2015-16

1
PREFACE The TeamLease Employment Outlook Report provides a rich overview
of hiring sentiments and trends across 9 key sectors and 8 major cities
in India. They are a half-yearly exercise in capturing and reporting on
Talent Acquisition plans by Indian employers.
Over the years, the Employment Outlook – defined in the enclosure
alongside –has come to reflect an accurate, forward looking, sense of
the inclination to hire by organizations, thus helping Talent Managers
across India with highly relevant decision support.
The report aims to:
1. Measure trends in hiring sentiment across the country, and
estimate Job Growth, by city and sector.
2. Drill across geographies, business size and hierarchy to provide
additional dimensions of the statistic.
3. Identify the key drivers of hiring sentiment at a ‘big-picture’ as
well as sector-level.
ABOUT TEAMLEASE
TeamLease is a pioneer, and India’s largest and foremost people
supply chain company, with 8 regional offices and 1,100 core
employees. We began business in 2002 delivering Temporary Staffing
and have subsequently added Permanent Recruitment, Regulatory
Compliance, Payroll Processing and Learning Services to our bouquet
of offerings. Today, we serve 2,200 clients working across industry
verticals in India.
Besides Employment, over time, we have developed a triangulated
focus that includes Education and Employability.
Our core business is providing staffing solutions across industry sectors
and diverse functional areas. The majority of our associate employees
are engaged in sales, logistics and customer service functions. We
focus on people, processes and technology to enhance business
productivity by enabling our clients to outsource their staffing
requirements and allowing them to focus on operating and growing
their core businesses.
THIS
EDITION
[Type the sidebar
content. A sidebar is a
standalone
supplement to the
main document. It is
often aligned on the
left or right of the
page, or located at the
top or bottom. Use the
Drawing Tools tab to
change the formatting
of the sidebar text
box.]
THE
EMPLOYMENT
OUTLOOK
is a measure of the
probable hiring activity
across India over the
forthcoming half-year. It
captures hiring sentiment in
terms of a percentage
increase / decrease and
summarizes a net statistic.
NET
EMPLOYMENT
OUTLOOK
is the difference between
the number of respondents
who are inclined to hire and
the number of respondents
who are disinclined to hire,
over the next 6 months of
the financial year (October
through March, 2015-16).

2
Contents
1. Executive Summary
2. Employment Outlook
2.1. Reporting convention – how to interpret outlook statistics
2.2. Employment Outlook for the Current HY
2.3. Employment Outlook Trend over the years
3. Employment Outlook Trends
3.1. By sector, city andgeography
3.2. By organization size,functional area and experience levels
4. Top Sectors and Cities
5. Sector-wise Analysis
6. City-wise Analysis
7. Research Methodology
7.1. Approach
7.2. Sample Design
7.2.1. Employers: City-Sector breakup
7.2.2. Employers: Business size-wise breakup
7.2.3. Candidates: City-wise breakup
8. Annexure-1: The big picture: what factors drive Employment Outlook
9. Annexure-2: The Salary Scene: what employers will pay
10. Annexure-3: Business Outlook
11. Annexure-4:City-Sector sweet spots
12. Annexure-5:Functional area-Sector sweet spots

3
EXECUTIVE SUMMARY
� Favourable prognosis for the economy by the United Nations, corporate citizenry expectant of the new
government taking a leap of faith on reforms, and the continuing flurry of innovation activity result in an
incremental improvement in the number of employers looking to increase hiring and help keep up
employment sentiment at 89%, a small, but significant, increase of 3 basis points over the previous
half-year forecast.
� Large and medium-sized businesses [+4 and +3 percentage points respectively] are likely to fill entry-
and senior-level positions [+10 and +2 points]. The numbers are coming in from metros, tier-1 and tier-
2 cities, all of the functional areas sans Sales and Marketing, and all,of the sectors sans Financial
Services and Telecommunications.
� Modest growth in outlook is seen across sectors, most notably Information Technology, Infrastructure
and Health & Pharmaceuticals [+3 percentage points each], and there is significant uptick in outlook
across cities, with sentiments in Bangalore and Mumbai improving by 5 and 4 points, respectively. In
Mumbai and Pune, these trends juxtapose to create a host of city-sector clusters that see upwards of
3-point increases in outlook.
� The recurring theme of consumer maturity and technological innovation is now being ferociously
leveraged by ecommerce businesses and technology startups. They debut impressively on our sector
list with 84% of the respondents from the sector indicating the intent to increase hiring. Businesses in
the sector are as much driven by demand growth and hyper-competition as they are by severe attrition.
� The Infrastructure sector seems to be an early beneficiary of the ‘Make in India’ initiative with
Manufacturing, the actual intended beneficiary, expected to benefit with a lag effect. Swelling foreign
exchange reserves and the government’s acceleration of projects have aided the sector in this growth.
The number of jobs in the sector is projected to double over the next decade. Information Technology
and Health & Pharmaceuticals are the other two sectors that stack up equally high [+3 points each].
� The positive – albeit incremental – sentiment seen across most sectors and cities is only slightly
negated by the few, even less incremental, negative sentiment in Financial Services and
Telecommunications [-3 and -2 points, respectively] among sectors, and Delhi [-2 points] among cities.
The negative outlook, in all these cases,is attributable to the number of respondents intending to lower
the pace of hiring.

4
EMPLOYMENT OUTLOOK
1. Reporting convention: how to interpret outlook statistics
The Net Employment Outlook is the difference between the number of respondents who are
inclined to hire and the number of respondents who are disinclined to hire, over the next 6
months of the financial year (October through March, 2015-16). The Outlook is expressed as a
percentage of the total number of respondents.
For the forthcoming half year, for which the Outlook is being reported here, 93% responded
positively (hire would increase), 4% responded negatively (hiring would decrease) and 3%
responded saying there would not be any change in the volume of hiring, from the previous half
year. The Net Employment Outlook, therefore, would be 89%.
2. Employment Outlook for the Current HY
Increase Decrease No Change Net Employment
Outlook
Apr – Sep, 2013 84 5 11 79
Oct – Mar, 2014 83 7 10 76
Apr – Sep, 2014 85 5 10 80
Oct – Mar, 2015 93 5 2 88
Apr – Sep, 2015 91 5 4 86
Oct – Mar, 2016 93 4 3 89
79
80
86
76
88
89
65 70 75 80 85 90
2013-14
2014-15
2015-16
Employment Outlook - Over the years
HY-2
HY-1

5
Hiring sentiments have inched up to a 3-year high, rather cautiously and as a matter of a second
coming within a year, reflecting renewed confidence in a new regime as well as buoyed by a favourable
growth forecast for the Indian economy.
The United Nations’ reaffirmation of a spectacular near-future for India – a growth rate of 8.1% in 2015
which is projected to only get better at 8.2% in 2016 – is a major factor in employers inclined to put their
foot forward and hire. The primary cause underlying this acceleration in growth is fast-clipped consumer
spending fueling consumer maturity – a long term trend we have discussed over the past year.

6
EMPLOYMENT OUTLOOK TRENDS BY GEOGRAPHY, BUSINESS SIZE, HIERARCHY AND FUNCTIONAL AREA Geography
Increase Decrease No Change Net Employment Outlook
METRO & TIER-1
Apr – Sep, 2015 94 3 3 91
Oct – Mar, 2016 96 3 1 93
TIER-2
Apr – Sep, 2015 27 7 66 20
Oct – Mar, 2016 25 3 72 22
TIER-3
Apr – Sep, 2015 15 5 80 10
Oct – Mar, 2016 12 4 84 8
RURAL
Apr – Sep, 2015 4 3 93 1
Oct – Mar, 2016 4 2 94 2
Business Size
Increase Decrease No Change Net Employment Outlook
SMALL
Apr – Sep, 2015 76 6 18 70
Oct – Mar, 2016 73 9 18 64
MEDIUM
Apr – Sep, 2015 85 11 4 74
Oct – Mar, 2016 85 8 7 77
LARGE
Apr – Sep, 2015 89 7 4 82
Oct – Mar, 2016 91 5 4 86
Hierarchy
Increase Decrease No Change Net Employment Outlook
ENTRY LEVEL
Apr – Sep, 2015 62 7 31 55
Oct – Mar, 2016 70 5 25 65
JUNIOR LEVEL
Apr – Sep, 2015 86 8 6 78
Oct – Mar, 2016 83 8 9 75
MID-LEVEL
Apr – Sep, 2015 53 4 43 49
Oct – Mar, 2016 50 5 45 45
SENIOR LEVEL

7
Apr – Sep, 2015 31 2 67 29
Oct – Mar, 2016 34 3 63 31
Functional Area
Increase Decrease No Change Net Employment Outlook
SALES
Apr – Sep, 2015 95 4 1 91
Oct – Mar, 2016 93 3 4 90
MARKETING
Apr – Sep, 2015 95 4 1 91
Oct – Mar, 2016 83 8 9 75
INFORMATION TECHNOLOGY
Apr – Sep, 2015 78 5 17 73
Oct – Mar, 2016 83 4 13 79
ENGINEERING
Apr – Sep, 2015 78 5 17 73
Oct – Mar, 2016 86 5 9 81
OFFICE SERVICES
Apr – Sep, 2015 24 9 67 15
Oct – Mar, 2016 27 8 65 19
HUMAN RESOURCES
Apr – Sep, 2015 N.A. N.A. N.A. N.A.
Oct – Mar, 2016 73 10 17 63
BLUE COLLAR
Apr – Sep, 2015 57 2 41 55
Oct – Mar, 2016 72 7 21 65
Employment Outlook trends across Geography, Business Size, Hierarchy and Functional Area are
clear indicators of a broad-based sense of confidence – albeit a few exceptions, as is discussed in
the later pages – in employers. While Metro and Tier-1 cities continue to dominate the landscape,
Tier-2 cities have appreciably come further up the radar for organizations that have been tapping
into the hinterland for talent volumes that the former set of cities may not help fulfill on.
That businesses of all sizes are likely to accelerate hiring is a matter of optimism, while the
significant impetus to Entry-level, as well as a moderate push to Senior-level, hiring seems to
reinforce positivity.
Amongst functional areas, Information Technology and Engineering lead by far and substantially
improve their standing. Blue Collar workforce sees an appreciable increase in demand and,
therefore, hiring sentiment.
BY SECTOR AND CITY Employment Outlook by Sector

8
H2, 2015-16 H1, 2015-16 % change
LEADERS
Information Technology & Knowledge Services
96 93 3
Retail 95 93 2
Infrastructure 89 86 3
Health & Pharmaceuticals 88 85 3
Ecommerce & Technology Startups 84 - -
LAGGARDS
Financial Services 82 85 -3
Telecommunications 80 82 -2
Fast Moving Consumer Goods 75 74 1
Manufacturing & Engineering 70 68 2
Employment Outlook by City
H2, 2015-16 H1, 2015-16 % change
LEADERS
Bangalore 93 88 5
Pune 82 78 4
Mumbai 75 72 3
Ahmedabad 74 72 2
LAGGARDS
Chennai 72 70 2
Delhi 68 70 -2
Hyderabad 63 60 3
Kolkata 59 56 3
The growth boosters – amongst sectors and cities – happen to be the ones that showcase a
combination of technological prowess and consumption power. Information Technology and
Knowledge Services and Retail lead the sector-stack with appreciable proportions of the
respondents willing to up people numbers, while Ecommerce & Technology Startups – a new-
comer in our bucket list – has debuted with a sharps upward trajectory.
The spectacular emergence of Ecommerce & Technology Startups on the hiring horizon is
noteworthy, and its addition must come as no surprise. With droves of new businesses being
incubated, by the month, rapidly scaling up and hiring in the hundreds, this sector is adding rocket
fuel to consumer-spending as well as to talent / labour market growth.
Add to all this, the direct beneficiary of the UN’s growth forecast – the already upwardly-mobile
Infrastructure sector – and we have a good looking sectoral outlook. The cities have a predictable
line up although Delhi is a sore exception, with Infrastructure being the lone high-growth sector that
is unable to offset the lack of active participation from most other sectors.
.

9
SECTOR-WISE ANALYSIS
INFORMATION TECHNOLOGY& KNOWLEDGE SERVICES
Increase Decrease No Change Net Employment Outlook
Apr – Sep, 2015 96 3 1 93
Oct – Mar, 2016 97 1 2 96
Job Growth: 13.7% (previous HY: 12.2%)
The sector is driven by the fast-recovering American economy and a slew of entrepreneurial activity on
the back of technological innovation in the software-product ecosystem. New software-product
businesses are emerging and scaling up rapidly, while a host of existing IT companies are focusing on
and catering to product companies, primarily, in the U.S.
The Knowledge Services sector is dominated by the buzz around the SMAC stack – Social-Mobile-
Analytics-Cloud ecosystem, and technologies such as Big Data and Predictive Analytics are seeing a
relentless demand for high-caliber talent.
FAST MOVING CONSUMER GOODS
Increase Decrease No Change Net Employment Outlook
Apr – Sep, 2015 83 9 8 74
Oct – Mar, 2016 85 10 5 75
Job Growth: 10.8% (previous HY: 10.27%)
Consumer maturity is the long term trend on the back of which the Fast Moving Consumer Goods
sector has been witnessing healthy growth over the past couple of years. With consumers loosening
purse strings more than ever before, and with the enabling Retail sector growing in spurts, the FMCG
sector has been on an upswing.
The forthcoming half-year, however, is a small dampener for the sector. Retail / Ecommerce is stealing
substantial growth off the consumer spend trend and the discretionary rupee is split across proliferating
consumption categories, many of which fall under lifestyle retail. The one savior for the FMCG sector is
rural spending which, again, has been on an uptick over the past half a decade.
FINANCIAL SERVICES
Increase Decrease No Change Net Employment Outlook
Apr – Sep, 2015 91 6 3 85
Oct – Mar, 2016 90 8 2 82
Job Growth: 8.5% (previous HY: 8.2%)

10
With the Achilles heel of corporate debt being a significant bother, and the interest rates not entirely in a
favourable range, the Financial Services sector does not seem to be in the best of its hiring spirits. The
coming half-year, however, is the period during which fiscal policy is likely to be shaped and the annual
budget announcement would address concerns surrounding interest rates.
Add to this, the sector is a heavy spender on technology. The modest outlook, somewhat, camouflages
a healthy intake of technological talent aimed at fostering innovations in areas such as payments –
where a slew of startups are ushering in what Mr. Nandan Nilekani calls a ‘whatsapp-like’ revolution.
This space is, therefore, a bright spark for the Financial Services sector.
INFRASTRUCTURE
Increase Decrease No Change Net Employment Outlook
Apr – Sep, 2015 92 6 2 86
Oct – Mar, 2016 94 5 1 89
Job Growth: 10.6% (previous HY: 9.33%)
The Infrastructure sector is likely to add annual employment of almost 17 million by 2025, up from the
current level of about 7 million. Economic growth forecasts – and the reinforcements from a surge in
foreign fund flows – are key drivers behind an ebullient hiring outlook for the sector, besides the
government accelerating several infrastructural projects that were either on the backburner or were
seeing a slow burn.
The ‘Make in India’ initiative, although aimed at Manufacturing & Engineering, has rather direct fallout
for the Infrastructure sector as well. Investments in defense equipment, railways and construction are
already on an upward trajectory and are likely to further the pace of hiring in the sector.
RETAIL
Increase Decrease No Change Net Employment Outlook
Apr – Sep, 2015 95 2 3 93
Oct – Mar, 2016 96 1 3 95
Job Growth: 13.4% (previous HY: 12.11%)
Product and brand proliferation in the consumer market have enormously benefited the retail sector,
and the mature Indian consumer – across cities and towns – is increasingly preferring organized
environs to shop in. There is a worrying downside to the hiring sentiment Retail displays, however.
Alarming levels of attrition, and the exorbitant training cost, of front-end store staff is a major attribute
influencing the hiring sentiment.
The intense competition from ecommerce businesses is the other key factor necessitating large volume
hiring – which good news is. As retailers strive to protect their turf from the onslaught of the newbies,
they are investing in acquiring the right talent – in addition to the right technologies. This protracted
battle, likely to prolong for the foreseeable future, bodes well for the Indian talent / labour market.

11
MANUFACTURING & ENGINEERING
Increase Decrease No Change Net Employment Outlook
Apr – Sep, 2015 74 6 20 68
Oct – Mar, 2016 73 3 24 70
Job Growth: 8.33% (previous HY: 7.2%)
The direct, intended, beneficiary of the ‘Make in India’ initiative is witnessing a lag effect of the Prime
Minister’s ardent push for the sector. While investments are trickling in, a major push to the
Infrastructure sector is seen to be a prerequisite for the Manufacturing & Engineering sector to start
thriving and for the talent / labour market to benefit.
On the other hand, capacity creation in sectors such as Infrastructure, Oil & Gas, Power, Mining,
Automobiles, Auto components, Steel, Refinery, and the like, is driving growth of the engineering
industry. As foreign investment inflows accelerate, and as the primary sector picks up pace, the
Manufacturing & Engineering sector is set to see substantial traction.
TELECOMMUNICATION
Increase Decrease No Change Net Employment Outlook
Apr – Sep, 2015 89 7 4 82
Oct – Mar, 2016 89 9 2 80
Job Growth: 9.2% (previous HY: 9.73%)
With mobile subscriber volumes racing toward a billion and internet – specifically, mobile-internet
cornering a third of this volume – penetration levels growing at 17% over the first 6 months of this fiscal,
the Telecommunication sector has been on a roll. The Net Neutrality, and call drops, debates
notwithstanding, the sector is witnessing enormous user - and revenue - growth. All this is, however,
not exactly translating into as healthy an addition to the workforce as it actually warrants.
The sector is in consolidation mode, and a lack of requisite investments – thanks perhaps, to the
burdening license fee – and intense competition are a spoke in the sector’s wheel. The industry is, in
fact, likely to ever so slightly reduce the quantum of hiring over the next 6 months.
HEALTHCARE & PHARMACEUTICALS
Increase Decrease No Change Net Employment Outlook
Apr – Sep, 2015 87 2 11 85
Oct – Mar, 2016 88 0 12 88
Job Growth: 12.6% (previous HY: 10.95%)

12
Modern healthcare and Research are the two areas of robust growth that primarily contribute to talent
acquisition in the Healthcare and Pharmaceuticals sector. Companies in the sector – and a good
proportion of these are global entrants – are seen to be making investments in domains such as
Genomics, Proteonomics and Epigenetics, besides Electronic Medical Records.
Growing urbanization has meant that metro and tier-I towns will continue to be significant drivers of
growth. The consumer maturity factor, however, is a big boost to healthcare facilities not just in cities,
but increasingly in smaller towns as well. The perennially short-on-talent sector is doubling down on
both the quantity and quality of hiring over the next 6 months.
ECOMMERCE & TECH STARTUPS
Increase Decrease No Change Net Employment Outlook
Oct – Mar, 2016 92 8 - 84
Job Growth: 22% (previous HY: N.A.)
The pinnacle of consumer maturity – and the sector most benefitting from the phenomenon – is
evidenced by the trailblazing growth of the ecommerce sector. The sector is single handedly standing
the retail industry business model on its head, and driving adoption to app- and mobile-based shopping
in a big way. Venture funding, and SiliconValley inspired innovation, are fueling the frenzy and all this is
resulting in two major areas of talent acquisition – technology and logistics.
This, two-dimensional, growth of talent requirements in the Ecommerce & Tech startups sector is
seemingly insatiable. While the baseline talent demand is itself substantial, seasonal spikes in talent
demand – especially for logistics profiles – is seen to be bordering on the unmanageable. A sector
marked by turbulence – thanks to rapid innovation, fast changing consumer preferences and hyper
competition – is turning to all avenues to hire software developers and delivery personnel, in addition to
high quality managerial talent.
13
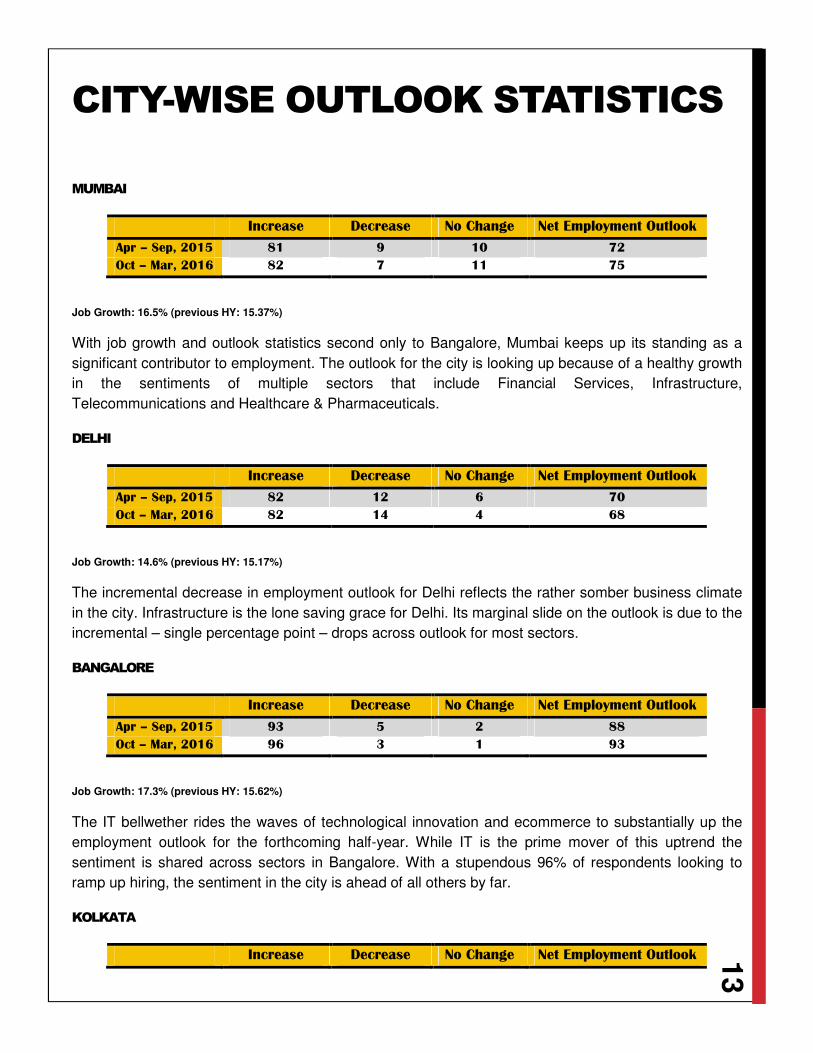
CITY-WISE OUTLOOK STATISTICS
MUMBAI
Increase Decrease No Change Net Employment Outlook
Apr – Sep, 2015 81 9 10 72
Oct – Mar, 2016 82 7 11 75
Job Growth: 16.5% (previous HY: 15.37%)
With job growth and outlook statistics second only to Bangalore, Mumbai keeps up its standing as a
significant contributor to employment. The outlook for the city is looking up because of a healthy growth
in the sentiments of multiple sectors that include Financial Services, Infrastructure,
Telecommunications and Healthcare & Pharmaceuticals.
DELHI
Increase Decrease No Change Net Employment Outlook
Apr – Sep, 2015 82 12 6 70
Oct – Mar, 2016 82 14 4 68
Job Growth: 14.6% (previous HY: 15.17%)
The incremental decrease in employment outlook for Delhi reflects the rather somber business climate
in the city. Infrastructure is the lone saving grace for Delhi. Its marginal slide on the outlook is due to the
incremental – single percentage point – drops across outlook for most sectors.
BANGALORE
Increase Decrease No Change Net Employment Outlook
Apr – Sep, 2015 93 5 2 88
Oct – Mar, 2016 96 3 1 93
Job Growth: 17.3% (previous HY: 15.62%)
The IT bellwether rides the waves of technological innovation and ecommerce to substantially up the
employment outlook for the forthcoming half-year. While IT is the prime mover of this uptrend the
sentiment is shared across sectors in Bangalore. With a stupendous 96% of respondents looking to
ramp up hiring, the sentiment in the city is ahead of all others by far.
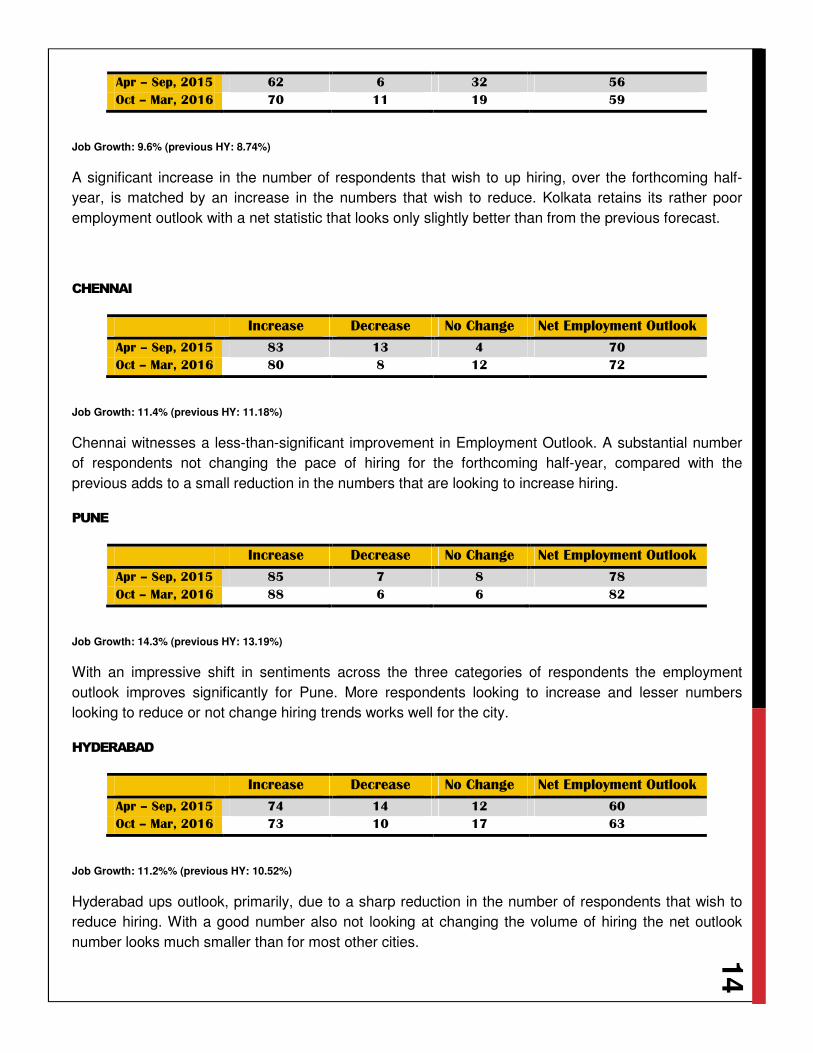
KOLKATA
Increase Decrease No Change Net Employment Outlook
14
Apr – Sep, 2015 62 6 32 56
Oct – Mar, 2016 70 11 19 59
Job Growth: 9.6% (previous HY: 8.74%)
A significant increase in the number of respondents that wish to up hiring, over the forthcoming half-
year, is matched by an increase in the numbers that wish to reduce. Kolkata retains its rather poor
employment outlook with a net statistic that looks only slightly better than from the previous forecast.
CHENNAI
Increase Decrease No Change Net Employment Outlook
Apr – Sep, 2015 83 13 4 70
Oct – Mar, 2016 80 8 12 72
Job Growth: 11.4% (previous HY: 11.18%)
Chennai witnesses a less-than-significant improvement in Employment Outlook. A substantial number
of respondents not changing the pace of hiring for the forthcoming half-year, compared with the
previous adds to a small reduction in the numbers that are looking to increase hiring.
PUNE
Increase Decrease No Change Net Employment Outlook
Apr – Sep, 2015 85 7 8 78
Oct – Mar, 2016 88 6 6 82
Job Growth: 14.3% (previous HY: 13.19%)
With an impressive shift in sentiments across the three categories of respondents the employment
outlook improves significantly for Pune. More respondents looking to increase and lesser numbers
looking to reduce or not change hiring trends works well for the city.
HYDERABAD
Increase Decrease No Change Net Employment Outlook
Apr – Sep, 2015 74 14 12 60
Oct – Mar, 2016 73 10 17 63
Job Growth: 11.2%% (previous HY: 10.52%)
Hyderabad ups outlook, primarily, due to a sharp reduction in the number of respondents that wish to
reduce hiring. With a good number also not looking at changing the volume of hiring the net outlook
number looks much smaller than for most other cities.

15
AHMEDABAD
Increase Decrease No Change Net Employment Outlook
Apr – Sep, 2015 80 8 12 72
Oct – Mar, 2016 86 12 2 74
Job Growth: 11.9% (previous HY: 11.76%)
An impressive improvement in the number of respondents that intend to up hiring this forthcoming half-
year is nearly offset by the numbers that spell the contrary. The net result is a marginal increase in the
outlook for Ahmedabad.

16
RESEARCH METHODOLOGY
.APPROACH
• Business environment, influencers: Secondary research / literature review
• Industry and Job trends, Sentiment and # Jobs, Salaries and Skills: Quantitative research [email
/ tele-surveys]
• Attrition, root causes and talent retention: Depth surveys
SAMPLE DESIGN
Employers Mumbai Delhi Bangalore Kolkata Chennai Pune Hyderabad Ahmedabad Total
IT & KS 10 9 9 8 10 9 10 9 74
ECOM 7 5 10 - 4 6 4 2 38
FMCG 10 9 8 9 9 8 10 10 73
BFSI 9 10 10 9 8 9 9 8 72
RET 8 9 8 9 8 8 9 10 69
INF 10 10 9 8 10 9 10 9 75
M&E 10 8 9 10 9 8 8 8 70
TEL 8 9 10 9 8 8 9 9 70
H&P 11 9 10 8 9 9 9 10 75
Total 83 78 83 70 75 74 78 75 616
Business
Size
Small [Up to 249 employees]
Medium [250 – 999 employees]
Large [1,000 + employees]
Total
Mumbai 12 52 19 83
Delhi 9 56 13 78
Bangalore 11 57 15 83
Kolkata 18 42 10 70
Chennai 14 46 15 75
Pune 12 50 12 74
Hyderabad 13 52 13 78
Ahmedabad 14 52 9 75
Total 103 407 106 616
Candidates
Mumbai 18
Delhi 14
Bangalore 19
Kolkata 15
Chennai 19
Pune 20
Hyderabad 14
Ahmedabad 21
Totals 140

17
ANNEXURE-1
The big picture: what factors drive employment outlook
A hope-filled future marks the hiring sentiment for the forthcoming half year. With most sectors and
cities, sans Financial Services, Telecommunications and Delhi, looking to increase hiring the causal
factors – macroeconomic and otherwise – are aligned right for talent demand.
1. Economic growth forecast at 8.1%:
The United Nations reports that the Indian economy is set to lead the way in Asia with a stupendous
8.1% growth rate in 2015 and follow it up with an 8.2% in 2016. The growth is expected to come on
the back of acceleration of infrastructure projects, improved consumer spending, lower inflation and
monetary easing besides a general improvement in market sentiment.
2. Consumer maturity moves to the next level:
Mobile-internet is proving to transform the consumer attitude and preference way more than
organized retail did, and in way shorter a time frame. With consumer spending finding its way
through the labyrinths of a multitude of apps, finger tips in cities and towns big and small are
rejoicing – with the direct fallout of tech startups mushrooming and craving talent.
3. Tech talent lured by ecommerce and product companies :
Top Indian engineering campuses are abuzz with magnanimous offers from startups, multinational
companies and homegrown technology giants. These early movers have, of late, being joined by
organized retailers that are upgrading their technological capabilities as well.
4. Infrastructure projects pace likely to come of age:
The Government is pushing through and accelerating infrastructural projects, an action meant to be
a booster dose to the ‘Make in India’ initiative. The ripple effects of this push are believed to likely
result in an uptick in the growth rate of the Manufacturing & Engineering sector.
The concerns surrounding capital formation and corporate debt, which the previous edition of the
Employment Outlook had brought up in this section, still remain. But industry is looking to a two-
pronged approach to market growth – consumer spending and government will.
18
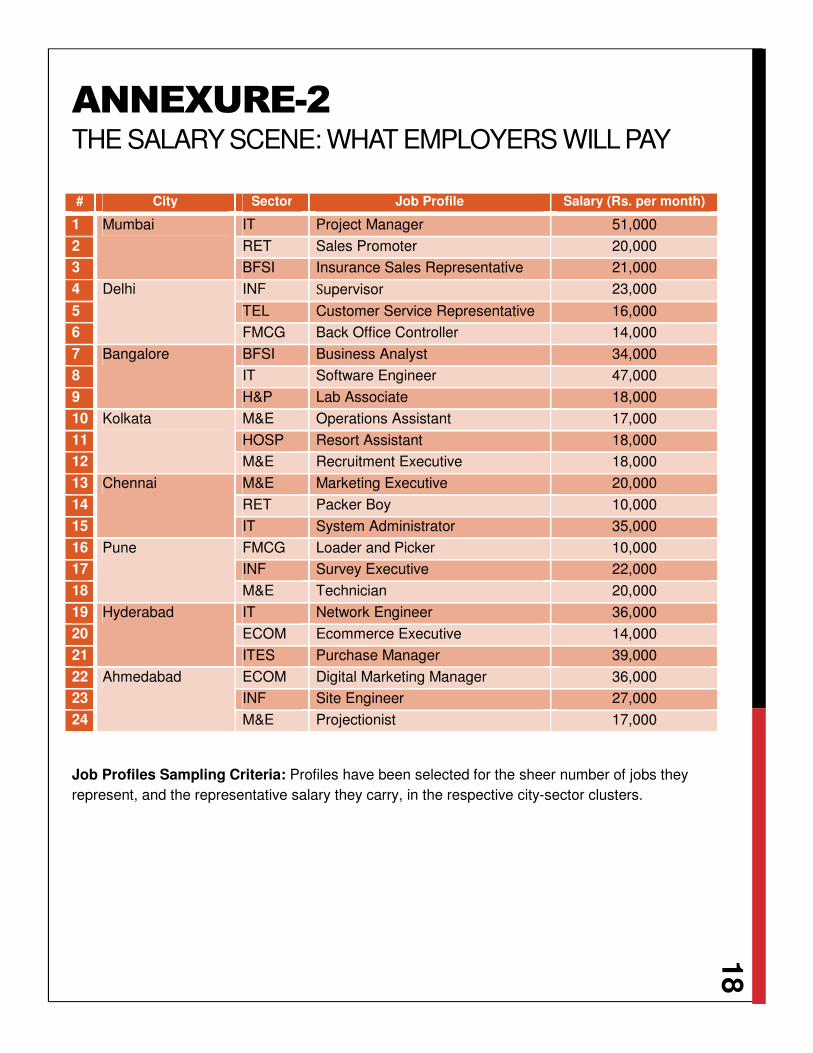
ANNEXURE-2 THE SALARY SCENE: WHAT EMPLOYERS WILL PAY
# City Sector Job Profile Salary (Rs. per month)
1 Mumbai IT Project Manager 51,000
2 RET Sales Promoter 20,000
3 BFSI Insurance Sales Representative 21,000
4 Delhi INF Supervisor 23,000
5 TEL Customer Service Representative 16,000
6 FMCG Back Office Controller 14,000
7 Bangalore BFSI Business Analyst 34,000
8 IT Software Engineer 47,000
9 H&P Lab Associate 18,000
10 Kolkata M&E Operations Assistant 17,000
11 HOSP Resort Assistant 18,000
12 M&E Recruitment Executive 18,000
13 Chennai M&E Marketing Executive 20,000
14 RET Packer Boy 10,000
15 IT System Administrator 35,000
16 Pune FMCG Loader and Picker 10,000
17 INF Survey Executive 22,000
18 M&E Technician 20,000
19 Hyderabad IT Network Engineer 36,000
20 ECOM Ecommerce Executive 14,000
21 ITES Purchase Manager 39,000
22 Ahmedabad ECOM Digital Marketing Manager 36,000
23 INF Site Engineer 27,000
24 M&E Projectionist 17,000
Job Profiles Sampling Criteria: Profiles have been selected for the sheer number of jobs they
represent, and the representative salary they carry, in the respective city-sector clusters.

19
ANNEXURE-3 BUSINESS OUTLOOK
Increase Decrease No Change Net Employment
Outlook
Apr – Sep, 2013 81 7 12 74
Oct – Mar, 2014 82 5 13 77
Apr – Sep, 2014 87 5 8 82
Oct – Mar, 2015 94 3 3 91
Apr – Sep, 2015 94 4 2 90
Oct – Mar, 2016 95 3 2 92

20
ANNEXURE-4
CITY-SECTOR SWEET SPOTS
EMPLOYMENT OUTLOOK
Positive growth (>3) in hiring sentiment.
Negative growth (< -3) in hiring sentiment.
Mumbai stars in a multiple-sector high-performance role, with as many as 4 sectors (Fast Moving
Consumer Goods, Infrastructure, Telecommunication and Healthcare & Pharmaceuticals) showcasing
% r
esp
on
de
nts

21
appreciable improvement in hiring sentiment. Pune also does well and is the lone cheerer of the
Financial Services sector, in addition to having an ebullient sentiment from the Infrastructure and
Healthcare & Pharmaceuticals sectors. The mostly positive sentiment upshots across city-sector
clusters are an evidence of a healthy hiring ground for the forthcoming half year.

22
ANNEXURE-5
FUNCTIONAL AREA-SECTOR
SWEET SPOTS
All of the functional areas sans Sales and Marketing, and all sectors sans Financial Services and Telecommunications seem to be sharing a generally positive sentiment. The clusters with significant positivity are generally spread across functional areas, with Blue Collar dominating the scene.

23
Technology and Analytics Partner:
http://valuvox.com
http://facebook.com/valuvox
http://twitter.com/valuvox