the tax compliance costs - university of...
TRANSCRIPT

Page | 1
THE MAGNITUDE AND THE FEATURES OF TAX COMPLIANCE COSTS OF
LARGE COMPANIES IN INDONESIA1
Budi Susila2 and Jeff Pope3
ABSTRACT In this first research on the compliance costs of large corporate taxpayers in Indonesia, it is discovered
that the aggregate costs are significant, estimated to be IDR 12.3 trillion, and account for 3.16% of tax
revenue for large corporations and 0.19% of the Gross Domestic Product in 2010.The average costs per
large company are IDR420,933,442 (around A$55,000 with the exchange rate at the time when the
research was undertaken). The costs differ across the various economic sectors. The majority of the costs
are incurred on human resources in the companies (staff, managers, directors). The research shows that
costs are regressive in terms of the number of employees, the amount of total assets, the annual
turnover, and the tax payments. The components of compliance costs are broken down into: routine and
non-routine costs 86% and 14%, internal and external costs 73% and 27%, computational costs and
planning costs 73% and 27%, respectively. Cash flow benefits and tax deductibility benefits, both being
offsets of gross costs, represent 24% and 25% of gross compliance costs respectively. Regarding the
attitude toward the tax administration and its tax reform, the majority of respondents agree (with
various percentages) that in general the administration is now better in terms of the quality of human
resources, technology, system and procedures. However, around half of the respondents (53.62%) state
that closer guidance and supervision to the taxpayers does not affect the compliance costs.
Keywords: Indonesia, tax, compliance costs, large corporate taxpayers, 2010
1 INTRODUCTION
In developing countries, research on the compliance costs of taxation, which started in 1990s, has been
well behind that of developed countries where it has been undertaken since 1930s, presumably because
of the other pressing issues that need to be addressed urgently. This paper reports the results of the
first research on the tax compliance costs of Indonesian taxpayers, in this case large corporate taxpayers
as they are the biggest contributors of Indonesian tax revenue. Also reported are the attitude of
taxpayers toward the tax administration and the effect of the Indonesian tax reform on the compliance
costs. This paper is organised as follows. Initially the key literature is reviewed. This covers the
development of leading research in the field from the beginning to its spread to other parts of the
world, including Asia, Africa, and the transition countries. Following this review, the methodology of the
research is presented to illustrate what steps have been taken before, during, and after the data
1An earlier version of this paper has been published in the Australian Tax Forum Volume 27 No. 4, 2012.
2Budi Susila is a Doctoral Candidate at the School of Economics and Finance, Curtin University, Western Australia
and an employee at the Directorate General of Taxes, Ministry of Finance, Republic of Indonesia. 3Jeff Pope is a Professor and the Director of the Tax Policy Research Unit, School of Economics and Finance, Curtin
University.

Page | 2
collection phase. The main results of the research are presented next which discuss the magnitude and
the features of the costs and a succinct comparison with other countries. Finally, several limitations are
acknowledged and concluding remarks are drawn, including future research directions.
2 LITERATURE REVIEW
Even though the importance of minimising costs to taxpayers in fulfilling tax obligations has been long
recognised, the systematic study of compliance costs only started in 1935 in the United States by Haig
(cited in leading studies by Sandford, Godwin, and Hardwick 1989, p. 27; Allers 1994, p. 242; Pope 2003,
p. 204; Tran-Nam et al. 2000, p. 229). Several different reasons for this negligence have been offered,
including the reduced role of tax in the economy (Sandford, Godwin, and Hardwick 1989, p. 27); the
complexity and costliness of compliance studies (Allers 1994, p. 7); the complexity and the lack of
political will (Pope, Chen, and Fayle 1993, p. 68-69); the notion that the costs have been immaterial, the
unavailability of a robust model to reduce the costs, and the difficulty of obtaining needed data (Tran-
Nam et al. 2000, p. 229).
The development of compliance costs study generally are divided into three stages (see for examples
Sandford, Godwin, and Hardwick 1989; Pope 2003; Evans 2003), namely the initial studies in North
America in 1930s to 1960s; the start in European countries in 1960s and 1970s; and the spread
internationally from 1980. Following this three stages, compliance costs research in Australia started in
the late 1980s. It was pioneered by Pope with work on personal income tax (Pope, Fayle, and Duncanson
1990), public companies’ income taxation (Pope, Fayle, and Chen 1991), employment-related taxation
(Pope, Chen, and Fayle 1993), wholesale sales tax (Pope, Fayle, and Chen 1993), and companies’ income
tax (Pope, Fayle, and Chen 1994). Subsequent research in Australia has been conducted on small
businesses (Wallschutzky and Gibson 1993) and there were two major research studies both on
businesses and individuals sponsored by the Australian Taxation Office (Evans et al. 1998).
The period after 2000 witnessed the spread of compliance costs research in transition and developing
countries and the involvement of the World Bank Group in this area as well as the exploration of other
aspects of compliance costs in developed countries. As a result, there are at least 27 known compliance
cost research studies from 2000 until now. A summary of the research conducted from 2000 is
presented chronologically in Appendix 1. This summary covers the researchers, the countries studied,
the taxes and taxpayers being investigated, the research methodology, and the main results of each
study. This summary is intended to complement previous compilations of research on compliance costs
(Sandford, Godwin, and Hardwick 1989; Pope 1993; Allers 1994; Evans 2003, 2008).
In Asia, the research on the compliance costs has been undertaken in Singapore (Ariff, Loh, and Talib
1995; Ariff, Ismail, and Loh 2002), Malaysia (Loh et al. 1995; Henefah, Ariff, and Kasipillai 2001), Hong
Kong (Cheung et al. 1999) , and India (Chattopadhyay and Das-Gupta 2002, 2002). The studies in
Singapore, Malaysia, and Hong Kong form the basis of further analysis in Ariff and Pope (2002)4. In
4 The South-East Asian studies were based on the questions and method used in the Australian study on public
companies by Pope, Fayle and Chen (1991).

Page | 3
transition countries, it has been conducted in Slovenia (Klun 2004, 2004), Armenia (Jrbashyan and
Harutyunyan 2006), and Ukraine (The Investment Climate Advisory Service 2009). The World Bank group
also investigate the costs of compliance of taxation in South Africa, Peru, and Yemen (Coolidge 2010).
Compliance costs research in Indonesia has been lagging behind that of other Asian countries. The
reason behind this is probably because it is not urgent issue for there are more pressing issues such as
corruption or modernisation in tax administration, as suggested by Ariff and Pope (2002, p. 28).
However, there are two research regarding compliance costs (Heij 1993; Prasetyo 2003), even though
both did not quantify the costs. In short, the subject of compliance costs in Indonesia is still at the
second level of awareness, which is ‘qualitative recognition by professionals’, a term introduced by Pope
(1993, p. 2-7) as one of six levels of awareness of compliance costs in one country or jurisdiction.
3 TAXATION AND TAX REFORM IN INDONESIA
3.1 Tax System
Indonesia is a country in Southeast Asia with the population of 245 million (Biro Pusat Statistik 2010),
making it the fourth most populous country in the world. The Gross Domestic Product (GDP) of
Indonesia in 2009 is approximately US$540.273 billion(Bank Indonesia 2011; World Bank 2011), and
ranked 14th for the biggest economy in the world (CIA 2011). The GDP per capita is currently US$2,050,
categorized as a “lower middle income” country by the World Bank (2011).
Administratively, Indonesia is a unitary state, comprising one central government, 33 provinces, and 497
regencies and municipalities (Biro Pusat Statistik 2010). In order to finance central government
expenditure, Indonesia depends on tax revenue with the contribution of 70% of total domestic revenue
in its country’s budget (Directorate General of Taxes 2012). The structure of tax revenue is presented in
Table 1.
Table 1 Tax Revenue in Indonesia, 2010
No Type of Tax Revenue in 2010, IDR billion
%
1 Income tax 265,265.04 52.54
2 Value-Added Tax 236,162.90 46.77
3 Other taxes 3,473.51 0.69
Overall 504,941,06 100
Note: IDR=the Indonesian Rupiah, the official currency of the Republic of Indonesia. At the end of 2010,
US$1=IDR9,010. Source: Directorate General of Taxes, 2011.
The current tax rate for income tax is 25% for companies and ranges from 5% to 30% for individuals
depending on the income level (Income Tax Law, Directorate General of Taxes 2008). The rate for Value-
Added Tax is 10% (VAT Law, Directorate General of Taxes 2009).
Indonesia has implemented a self-assessment system since 1983 (Gillis 1985, p. 94) in which taxpayers
are required to calculate and report their obligation on a regular basis, either monthly or annually.
Besides reporting their own taxes, taxpayers are also subject to withholding taxes in which taxpayers

Page | 4
withhold tax payable on certain payments to other taxpayers and then remit said tax to the government.
Currently these withholding taxes cover five types of income tax, namely tax on employees’ salary, tax
on income from providing services, tax on income from assets (interest, rent, dividend), tax on payment
to foreigners, and tax on certain industries (paper, steel, automotive).
Taxation in Indonesia is administered by the Directorate General of Taxes (DGT) as a part of the Ministry
of Finance (MOF). It comprises one headquarters and 28 regional offices. Taxpayers in Indonesia are
registered based on their relative size either nationally or regionally.
3.2 Tax Reform
In 2002-2008, DGT executed a program named “Tax Reform Chapter One” which covered
administrative, policy, and tax intensification and extension (Directorate General of Taxes 2010, 38).
There are two significant aspects of this reform that affect the taxpayers; namely the formation of tax
offices based on the size of taxpayers, and the change in organizational structure of every tax office.
After the reform, the national largest taxpayers are administered in Large Taxpayers Offices (LTOs) while
the regional largest taxpayers are managed in Medium Taxpayers Office (MTOs) which also oversee
foreign investment companies and public companies. The remaining taxpayers are under the
administration of Small Taxpayers Offices (STOs). Currently there are four LTOs, 28 MTOs, and 299 STOs
(Directorate General of Taxes 2010, p. 24).
The change in organizational structure of tax office promotes closer guidance and supervision to
taxpayers with the creation of a new position in the tax office titled “Account Representatives” (ARs).
The main duties of the ARs are to provide guidance, to monitor and to supervise the compliance of
taxpayers assigned to them. The number of taxpayers administrated under one AR varies; it is 5-8
taxpayers for one AR in LTOs, 20-30 in MTOs, and 50-300 in STOs. The effect is that the bigger the size of
a taxpayer the closer is the supervision.
Beginning in 2009, DGT executed “Tax Reform Chapter Two’ which concentrates on human resources
and information and communication technology (Directorate General of Taxes 2010, 38).The program
has been continuing up to present.
4 RESEARCH METHODOLOGY
4.1 Pilot Study, Sample, Population, and Response Rate
Before the survey is undertaken, a pilot study was conducted in May 2011, a month after the due date
for taxpayers to submit their annual income tax returns. As many as 28 questionnaires were distributed
directly by the Account Representatives (ARs) to the taxpayers in the Large Taxpayers Office Two (LTO2)
in Jakarta with one AR per one taxpayer. After a three week period, three completed responses were
received, a response rate of 10.7%.
In order to better compose the questionnaire, a series of discussions were held at the beginning of a
data collecting trip to Indonesia (by the first author). The discussions were held separately with one tax

Page | 5
manager of one large taxpayer, two tax officials from DGT, and two ARs from LTO2. The final
questionnaire was modified from the initial version and consists of 8 A4-sized pages.
The population for this research is large corporate taxpayers, defined for the purpose of this research as
all taxpayers that are registered in the LTOs and MTOs. The total number of corporate taxpayers is
28,681, with any individual taxpayers who are registered in these LTOs and MTOs being excluded. The
sample size is 3,000, taken from the database of taxpayers registered in LTOs and MTOs. This sample
was selected using stratified random sampling with business sectors as the strata. Details are presented
in Table 2.
Table 2 Population and Samples
Business Sectors Population % of
Population Number in
Sample
Retail And Wholesale Trade 11,130 38.81 1,164
Manufacturing 6,545 22.82 685
Services 1,367 4.77 143
Transportation, Warehouse, Communication 1,470 5.13 154
Construction 1,486 5.18 155
Real Estate, Rent 1,941 6.77 203
Mining, Extraction 247 0.86 26
Others 4,495 15.67 470
Overall 28,681 100.00 3,000
Source: Directorate General of Taxes, 2012
The questionnaires were sent to selected taxpayers on 19 September 2011. As many as 500 first
reminders were sent on 10 October 2011 based on a random selection of the sample, followed by the
second and final reminders on 24 October 2011. A summary of survey activities is presented in Table 3.
Table 3 Summary of Questionnaire Mail-Out and Sample
No Activities Number
1 Questionnaires sent 3,000
2 Out of frame 6
3 Responses received 191
4 First reminder sent 500
5 Responses received after first reminder 37
6 Second reminder sent 500
7 Responses received after second reminder 19
8 Total responses received 247
9 Unusable responses 1
Usable responses 246
The overall response rate of this research is thus 8.2% (246 divided by 2,994).

Page | 6
4.2 Non-Response Bias
In order to address non-response bias, a method introduced by Allers (1994) is used. With this method,
the likelihood of the answers from non-respondents and those from responding samples could be
investigated, by providing a postcard containing one question for those who do not intend to respond.
The answers from these postcards are then compared to the answers on the same question from
respondents who answer full questionnaire. The comparison will determine the likelihood. The result is
presented in Table 4.
Table 4 Comparison of Responses on Compliance Costs from the ‘One Question Post Card’ and Full Questionnaire
No. Comparison of Compliance Costs with Similar Companies
Number of responses of One
question response
% Number of Responses of Full Questionnaires
%
1 Significantly lower 0 0.00 1 0.47
2 Somewhat lower 1 5.26 45 21.13
3 Relatively the same
13 68.42
139 65.26
4 Somewhat higher 4 21.05 18 8.45
5 Significantly higher
1 5.26
10 4.69
Overall 19 100.00 213 100.00
Coefficient correlation from those two sets of answers is 93.14%; meaning that the compliance costs of
respondents and non-respondents are similar.
4.3 Profile of Respondents
The composition based on the sectors in which the companies are operating is: retail and wholesale
trade 77 companies (31%), manufacturing 81 (33%), services 19 (8%), transportation and warehouse 13
(5%), construction 13 (5%), real estate 6 (2%), mining and extraction 8 (3%), and others 29 (12%). The
premises of the business are mainly in the Island of Java (193 companies; 78%), while the other 20 (8%)
are in Sumatera Island, six (2%) in Sulawesi Island, and 27 (11%) in other islands.
In terms of the duration of businesses, 184 companies (75%) have been operating for more than 10
years, while 50 companies (20%) are between 5 and 10 years in operation, and 12 companies (5%) have
been in business for one to five years. Likewise, a majority of the respondents (211 corporations; 86%)
have been registered in their current tax offices for more than five years; among those, 100 companies
(41%) have been registered for more than 10 years. There are 24 companies (10%) that have been
registered between one and five years, and 11 (4%) companies that have been registered for less than
one year.
Based on the number of employees, the composition is to some extent balanced: under 100 employees
64 companies (26%), between 101 and 500 employees 70 companies (28%), between 501 and 1,000

Page | 7
employees 69 companies (28%), between 1,001 and 5,000 employees 28 companies (11%), and over
5,000 employees 15 companies (6%).
The composition based on the amount of turnover is: below IDR3billion 6 companies (2%), between
IDR3,000,000,001 and IDR10billion 39 companies (16%), between IDR10,000,000,001 and IDR50billion
68 companies (28%), between IDR50,000,000,001 and IDR100billion 36 companies (15%), and over
IDR100billion 97 companies (39%). Similarly, based on the amount of total assets, the composition is:
below IDR3billion 18 companies (7%), between IDR3,000,000,001 and IDR10billion 53 companies (21%),
between IDR10,000,000,001 and IDR50billion 41 companies (17%), between IDR50,000,000,001 and
IDR100billion 29 companies (12%), and over IDR100billion 105 companies (43%).
Of the 246 respondents, 95 companies (39%) were audited in 2010, 36 companies (15%) proposed a tax
objection, and 14 corporations (6%) proposed a tax appeal.
4.4 Comparison with Government Statistical Data
Besides the definition of large taxpayer mentioned above, there is also a definition provided by the
Indonesian Statistical Bureau (BPS or Biro Pusat Statistik). The BPS defines a large company as a
company whose turnover is more than IDR3 billion per annum. Based on the latest census of BPS, the
number of large companies is 45,600; compared to 28,681 large companies in DGT version. In order to
test the proximity between those two sets of data, coefficient correlation for both locations of the
business and the sectors in which the companies mainly operate is used. The result shows that the
coefficient is 99.97% for location and 9.18% for business sector; showing that both data are similar, only
the DGT set of data is of smaller scale.
5 MAIN RESULTS
5.1 Average Tax Compliance Costs
Based on the received responses, it is known that in 2010 the average compliance costs per company
are estimated to be IDR420,933,4425 (around A$55,000 at the exchange rate in December 2010). The
costs differ across the economic sector in which the company is operating as shown in Table 5.
Table 5 Average Compliance Costs by Sector, 2010
No Sector Compliance Costs, IDR
1 Retail and wholesale trade 506,022,878
2 Manufacture 488,861,830
3 Service 249,647,368
4 Transportation, warehouse, communication 230,055,600
5 Construction 307,434,370
6 Real estate, rent 305,508,820
7 Mining, extraction 51,375,000
8 Others 379,770,152
5All figures relating to Indonesian tax compliance costs that follow are estimated; in other words they are
approximate rather than being a precise figure. This caveat is in line with previous studies in the field.
Page | 8
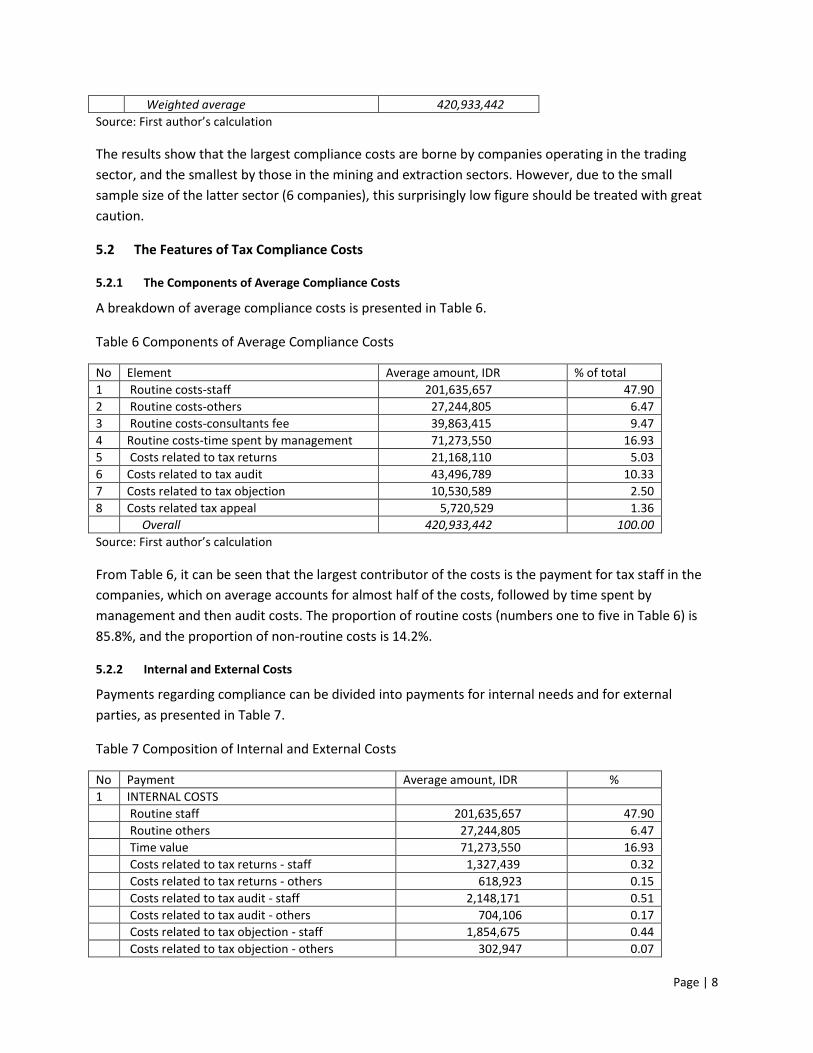
Weighted average 420,933,442
Source: First author’s calculation
The results show that the largest compliance costs are borne by companies operating in the trading
sector, and the smallest by those in the mining and extraction sectors. However, due to the small
sample size of the latter sector (6 companies), this surprisingly low figure should be treated with great
caution.
5.2 The Features of Tax Compliance Costs
5.2.1 The Components of Average Compliance Costs
A breakdown of average compliance costs is presented in Table 6.
Table 6 Components of Average Compliance Costs
No Element Average amount, IDR % of total
1 Routine costs-staff 201,635,657 47.90
2 Routine costs-others 27,244,805 6.47
3 Routine costs-consultants fee 39,863,415 9.47
4 Routine costs-time spent by management 71,273,550 16.93
5 Costs related to tax returns 21,168,110 5.03
6 Costs related to tax audit 43,496,789 10.33
7 Costs related to tax objection 10,530,589 2.50
8 Costs related tax appeal 5,720,529 1.36
Overall 420,933,442 100.00
Source: First author’s calculation
From Table 6, it can be seen that the largest contributor of the costs is the payment for tax staff in the
companies, which on average accounts for almost half of the costs, followed by time spent by
management and then audit costs. The proportion of routine costs (numbers one to five in Table 6) is
85.8%, and the proportion of non-routine costs is 14.2%.
5.2.2 Internal and External Costs
Payments regarding compliance can be divided into payments for internal needs and for external
parties, as presented in Table 7.
Table 7 Composition of Internal and External Costs
No Payment Average amount, IDR %
1 INTERNAL COSTS
Routine staff 201,635,657 47.90
Routine others 27,244,805 6.47
Time value 71,273,550 16.93
Costs related to tax returns - staff 1,327,439 0.32
Costs related to tax returns - others 618,923 0.15
Costs related to tax audit - staff 2,148,171 0.51
Costs related to tax audit - others 704,106 0.17
Costs related to tax objection - staff 1,854,675 0.44
Costs related to tax objection - others 302,947 0.07

Page | 9
Costs related to tax appeal - staff 675,102 0.16
Costs related to tax appeal - others 123,679 0.03
Overall Internal Costs 307,909,052 73.15
2 EXTERNAL COSTS
Routine costs-tax consultants 39,863,415 9.47
Costs related to tax returns 19,221,748 4.57
Costs related to tax audit 40,644,512 9.66
Costs related to tax objection 8,372,967 1.99
Costs related to tax appeal 4,921,748 1.17
Overall External Costs 113,024,390 26.85
Overall Compliance Costs 420,933,442 100
Source: First author’s calculation
From Table 7 it can be seen that nearly three-quarters of the costs are spent on internal factors, such as
for staff and other costs/ items (utilities, stationery, transportation), while the remaining (just over a
quarter) is spent for consultation and associated costs.
5.2.3 Computational and Planning Costs
The expenditure for staff salaries, for other costs such as utilities or stationery, and for tax consultants
can either be used to compute tax payable (computational costs) or to better manage and/or minimize
future tax liability (planning costs).The percentage of the costs across sectors is presented in Table 10.
Table 10 Computational and Planning Costs
COMPUTATIONAL COSTS (%) PLANNING COSTS (%)
SECTOR Staff Others Consultants Average Staff Others Consultants Average
Retail And Wholesale 46 54 64 55 54 46 36 45
Manufacture 70 76 84 77 30 24 16 23
Services 89 93 96 93 11 7 4 7
Transportation, Warehouse 85 84 40 70 15 16 60 30
Construction 76 89 13 59 24 11 87 41
Real Estate, Rent 77 84 49 70 23 16 51 30
Mining, Extraction 84 83 80 82 16 17 20 18
Others 76 86 81 81 24 14 19 19
Average 75 81 63 73 25 19 37 27
Source: First author’s calculation
From Table 10 it can be seen that on average the majority of the costs (73%) are incurred to compute
tax payable, while the remaining 27% is used for planning purposes. Based on the sector in which the
companies operate, the companies in the service sector incur the largest percentage of computational
costs (93%), while the lowest are those in the retail and wholesale sectors. Compared to other cost
drivers, costs for consultants related to planning purposes are the largest (37% compared to 25% for
staff and 19% for other costs).

Page | 10
5.2.4 Compliance Costs by Size
The average compliance costs, based on company size measured in terms of the number of employees,
the amount of turnover, and the amount of assets, are presented in Tables 11, 12, and 13, respectively.
Compliance costs per group are calculated by dividing the average compliance costs by the mid-point
unit of the size in each group, i.e. the number of employees, the amount of turnover, and the amount of
assets respectively.
Table 11 Compliance Costs Based on the Number of Employees
Group Number of Employees Average Compliance Costs, IDR
Compliance Costs per employee, IDR
1 Up to 100 employees 279,979,652 5,599,593
2 101-500 employees 311,705,581 1,246,822
3 501-1,000 employees 491,688,984 655,585
4 1,001-5,000 employees 614,801,978 245,920
5 More than 5,000 employees 828,287,813 110,438
Source: First author’s calculation
Table 12 Compliance Costs Based on Annual Turnover
Group Annual Turnover Average Compliance Costs, IDR
Compliance Costs per IDR of annual turnover
1 Less than IDR3,000,000,000 168,470,943 0.112
2 IDR3,000,000,001-IDR10,000,000,000 193,615,370 0.030
3 IDR10,000,000,001-IDR50,000,000,000 250,174,464 0.008
4 IDR50,000,000,001-IDR100,000,000,000 464,515,251 0.006
5 More than IDR100,000,000,000 631,478,239 0.004 a
Source: First author’s calculation. Note: a: A mid-point turnover of IDR150,000,000,000 is assumed for this group.
Table 13 Compliance Costs Based on Total Assets
Group Total Assets Average Compliance Costs, IDR
Compliance Costs per IDR of Assets
1 Less than IDR3,000,000,000 205,759,706 0.137
2 IDR3,000,000,001-IDR10,000,000,000 236,311,751 0.036
3 IDR10,000,000,001-IDR50,000,000,000 209,442,854 0.007
4 IDR50,000,000,001-IDR100,000,000,000 379,817,911 0.005
5 More than IDR100,000,000,000 644,948,123 0.004 a
Source: First author’s calculation. Note: a: A mid-point total assets of IDR150,000,00,000 is assumed for this group.
The data shows that the compliance costs are regressive in terms of size. In other words, costs per unit
decrease as the size increases, showing the economies of scale effect which is common to nearly all tax
compliance costs studies. As shown in Tables 11, 12, 13 the compliance costs per employee, IDR annual
turnover, and IDR total assets decrease consistently with the increase in the number of employees, the
amount of annual turnover and the amount of total assets, respectively.

Page | 11
5.2.5 Compliance Costs by Size of Tax Payments
Overall, large taxpayers face three main groups of tax, namely income tax, VAT and withholding taxes.
The comparison between the average compliance costs and tax payments for each group is presented in
Tables 14, 15, and 16.
Table 14 Compliance Costs Based on Income Tax Payment
Group Income Tax Payment Group Compliance Costs, IDR Compliance Costs per IDR Tax Payment
1 Less than IDR100,000,000 471,582,220 9.432
2 IDR100,000,001-IDR500,000,000 496,283,499 1.985
3 IDR500,000,001-IDR1,000,000,000 388,932,421 0.519
4 IDR1,000,000,001-IDR10,000,000,000 315,981,754 0.057
5 IDR10,000,000,001-IDR50,000,000,000 703,360,467 0.023
6 More than IDR50,000,000,000 382,206,088 0.005 a
Source: First author’s calculation. Note: a: A mid-point of IDR75,000,00,000 is assumed for this group.
Table 15 Compliance Costs Based on Value-Added Tax Payment
Group VAT Payment Group Compliance Costs, IDR Compliance Costs per IDR Tax Payment
1 Less than IDR100,000,000 246,639,488 4.933
2 IDR100,000,001-IDR500,000,000 368,385,516 1.474
3 IDR500,000,001-IDR1,000,000,000 398,501,588 0.531
4 IDR1,000,000,001-IDR10,000,000,000 611,977,315 0.111
5 IDR10,000,000,001-IDR50,000,000,000 855,414,088 0.029
Source: First author’s calculation.
Table 16 Compliance Costs Based on Withholding Taxes Payment
Group Withholding Taxes Payment Group Compliance Costs, IDR Compliance Costs per IDR Tax Payment
1 Less than IDR100,000,000 205,627,348 4.113
2 IDR100,000,001-IDR500,000,000 378,845,925 1.515
3 IDR500,000,001-IDR1,000,000,000 376,419,088 0.502
4 IDR1,000,000,001-IDR10,000,000,000 836,602,673 0.152
5 IDR10,000,000,001-IDR50,000,000,000 855,414,088 0.029
Source: First author’s calculation.
Again, the data shows that the costs are regressive, meaning that the larger the company paying tax, the
smaller the compliance costs per IDR tax payment.
5.2.6 Compliance Costs by the Types of Tax
Respondents were asked how they allocate their compliance costs into three different types of tax,
namely CIT, VAT and withholding taxes, with results shown in Table 18.
Table 17 Allocation of the Costs by Type of Tax
SECTOR CIT (%) VAT (%) Withholding Taxes
(%)

Page | 12
Retail And Wholesale 23 46 32
Manufacture 28 40 33
Services 51 28 37
Transportation, Warehouse 21 55 24
Construction 36 38 25
Real Estate, Rent 21 48 31
Mining, Extraction 20 41 39
Others 26 52 23
Average 28 44 29
Source: First author’s calculation.
From this it can be seen that, on average, VAT requires the most resources (44%) compared with other
types of tax (CIT 28% and withholding taxes 31%), except for those companies operating in the services
sector where VAT only accounts for 28% of total compliance costs.
5.2.7 Reasons for Using Tax Consultants
Respondents were asked the reasons why in 2010 they used tax consultants, and 122 respondents
provided answers (with multi responses possible), as presented in Table 18.
Table 18 Reasons of Using Tax Consultants
No. Reasons Number of Responses
%
1 It is difficult to obtain explanations from tax office 20 12.35
2 The benefits of using tax consultants exceeds the costs 44 27.16
3 It is the policy from taxpayers’ headquarters 85 52.47
4 Others 13 8.02
Overall 162 100.00
Note: “Others” comprise: Internal staff not capable (5 responses); to avoid the risk of audit (3), to avoid the risk of
miscalculation (2); tax forms are complicated (2); subject too difficult to understand (1). The total of 162 responses
does not match with the number of respondents completing the answers (122) because respondents were allowed
to choose more than one answer.
From Table 18, it can be seen that for those who use tax consultants, the main reason is that it is being
the policy established by the taxpayers’ head offices.
5.3 Gross Compliance Costs
To obtain (national) gross compliance costs, the mean compliance costs for each sector are multiplied by
the number of companies in each sector in the population.6 The computation of gross compliance costs
is presented in Table 19. A relative comparison of gross compliance costs with Indonesian tax revenue
and Gross Domestic Product (GDP) is presented in Table 20.
6 Grossing up by size of company is also possible. Unfortunately tax population data limitations preclude this in the
present study.

Page | 13
Table 19 Gross Large Taxpayers’ Compliance Costs, 2010
No. Sector Compliance Costs, IDR
Population Gross Compliance Costs, IDR million
(1) (2) (3) (4) (5)=(3)*(4)
1 Retail and wholesale trade 506,022,878 11,130 5,632,034
2 Manufacture 488,861,830 6,545 3,199,600
3 Service 249,647,368 1,367 341,267
4 Transportation, warehouse, communication 230,055,600
1,470 338,181
5 Construction 307,434,370 1,486 456,847
6 Real estate, rent 305,508,820 1,941 592,992
7 Mining, extraction 51,375,000 247 12,689
8 Others 379,770,152 4,495 1,707,066
Overall 420,933,442 28,681 12,280,681
Source: First author’s calculation
Table 20 Comparison of Gross Compliance Costs, Tax Revenue, and Gross Domestic Product, 2010
No. Item Amount
1 Gross Compliance Costs of Large Taxpayers, IDR trillion 12.280
2 National Tax Revenue from Large Taxpayers, IDR trillion 388
3 GDP in 2010, IDR trillion 6,422
Gross Compliance Costs as Percentage of Tax Revenue 3.16
Gross Compliance Costs as Percentage of GDP 0.19
Sources: First author’s calculation, Biro Pusat Statistik, and Directorate General of Taxes 2012
From Table 20, it can be seen that the gross compliance costs account for 3.16% of tax revenue from
large corporations, and 0.19% of GDP
5.4 Cash Flow Benefits
Cash flow benefits arise where there is a delay between the payable or collection date and the due date.
During that time interval, taxpayers enjoy risk-free funds before the funds are paid to the government.
The amount of cash flow benefits is obtained by multiplying the revenue of each type of tax with an
appropriate interest rate (reflecting the cost of borrowing) and the duration of this interest-free period;
or can be written in a formula as:
CFB = ∑ (
)
Where CFB = national cash-flow benefits; m, n = type and number of taxes; TR = tax revenue; P = interest-free period; and I= average interest rate.
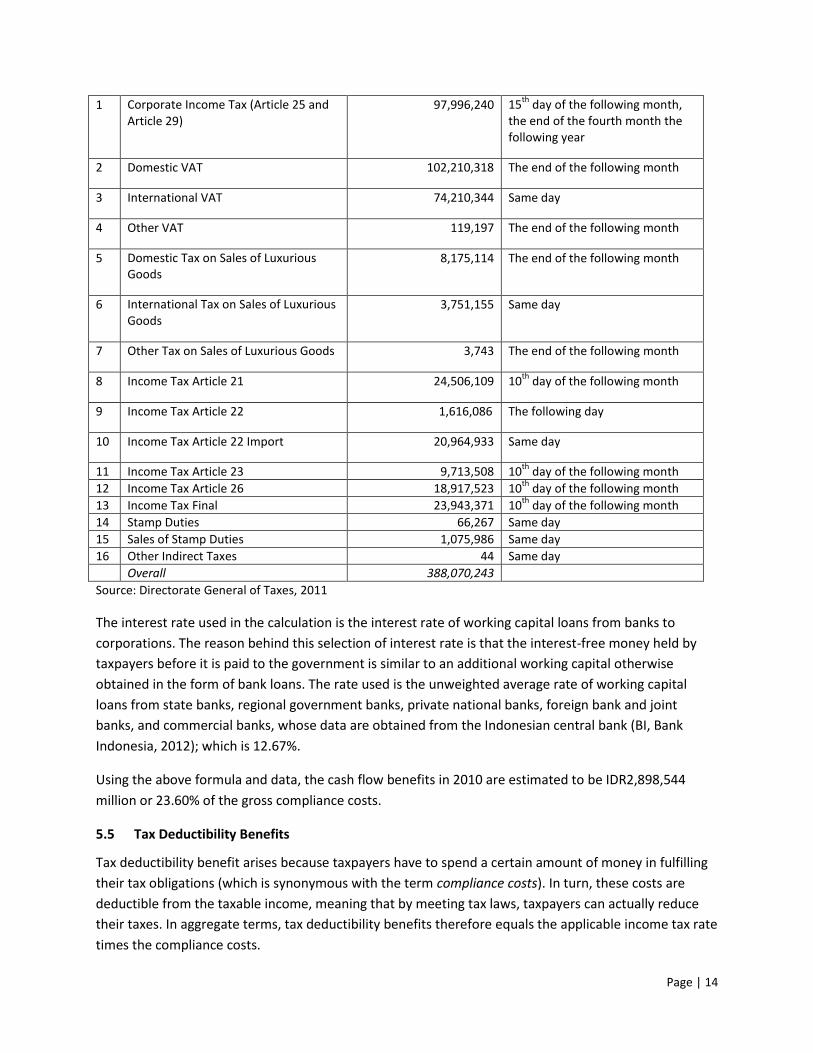
The revenue and the due date for each type of tax are presented in Table 21.
Table 21 Types, National Revenue, and Due Date of Each Type of Tax
No Type of Tax National Large Taxpayers Tax Revenue, IDR million
Due Date
Page | 14
1 Corporate Income Tax (Article 25 and Article 29)
97,996,240 15th
day of the following month, the end of the fourth month the following year
2 Domestic VAT 102,210,318 The end of the following month
3 International VAT 74,210,344 Same day
4 Other VAT 119,197 The end of the following month
5 Domestic Tax on Sales of Luxurious Goods
8,175,114 The end of the following month
6 International Tax on Sales of Luxurious Goods
3,751,155 Same day
7 Other Tax on Sales of Luxurious Goods 3,743 The end of the following month
8 Income Tax Article 21 24,506,109 10th
day of the following month
9 Income Tax Article 22 1,616,086 The following day
10 Income Tax Article 22 Import 20,964,933 Same day
11 Income Tax Article 23 9,713,508 10th
day of the following month
12 Income Tax Article 26 18,917,523 10th
day of the following month
13 Income Tax Final 23,943,371 10th
day of the following month
14 Stamp Duties 66,267 Same day
15 Sales of Stamp Duties 1,075,986 Same day
16 Other Indirect Taxes 44 Same day
Overall 388,070,243
Source: Directorate General of Taxes, 2011
The interest rate used in the calculation is the interest rate of working capital loans from banks to
corporations. The reason behind this selection of interest rate is that the interest-free money held by
taxpayers before it is paid to the government is similar to an additional working capital otherwise
obtained in the form of bank loans. The rate used is the unweighted average rate of working capital
loans from state banks, regional government banks, private national banks, foreign bank and joint
banks, and commercial banks, whose data are obtained from the Indonesian central bank (BI, Bank
Indonesia, 2012); which is 12.67%.
Using the above formula and data, the cash flow benefits in 2010 are estimated to be IDR2,898,544
million or 23.60% of the gross compliance costs.
5.5 Tax Deductibility Benefits
Tax deductibility benefit arises because taxpayers have to spend a certain amount of money in fulfilling
their tax obligations (which is synonymous with the term compliance costs). In turn, these costs are
deductible from the taxable income, meaning that by meeting tax laws, taxpayers can actually reduce
their taxes. In aggregate terms, tax deductibility benefits therefore equals the applicable income tax rate
times the compliance costs.

Page | 15
The current rate of corporate income tax is 25 per cent, so the estimated tax deductibility benefits are
25 per cent of the national compliance costs of IDR12.18 trillion, or IDR3.05 trillion.
5.6 Net Compliance Costs
Based on the above analysis, the net compliance costs are estimated at IDR 6.335 trillion, or around 1.63
per cent of tax revenue, and 0.10 per cent of Gross Domestic Product, as presented in Table 22.
Table 22 Net Compliance Costs in Monetary terms, and as a Percentage of Tax Revenue and Gross Domestic Product
No. Items Amount, IDR trillion
1 Gross Compliance Costs of Large Taxpayers, IDR trillion 12.280
2 Cash Flow Benefits, IDR trillion 2.898
3 Tax Deductibility Benefits, IDR trillion 3.046
4 Net Compliance Costs, IDR trillion 6.335
5 National Tax Revenue from Large Taxpayers, IDR trillion 388
6 GDP in 2010 6,422
Net Compliance Costs as Percentage of Tax Revenue 1.63
Net Compliance Costs as Percentage of GDP 0.10
Source: First author’s calculation, Biro Pusat Statistik 21012, Directorate General of Taxes 2012
5.7 The Attitude toward Tax Reform and the Effect of Tax Reform on the Compliance Costs
Related to tax reform, respondents are asked about their attitude toward tax administration in general;
their experience in current tax office where they are registered; and their interaction with the ARs. The
results show that the tax reform is beneficiary for taxpayers, as indicated by the responses that follow:
Almost all (97%) respondents agree that tax system is now better compared to that before
the reform
A vast majority (90.3%) of respondents agree with the statement that information system in
tax office is now better
More than half (55.6%) respondents agree that obtaining tax ruling or classification is now
easier, with 39.4% respondents neither agree nor disagree
With varying degrees, more than half of respondents find that several aspects in the tax
offices, namely the easiness of tax return submission, the competency of the tax officers,
the service, and the audit process, are now better
Regarding the closer guidance and supervision to the taxpayers, 53.6% of respondents say
that it does not affect the compliance costs, with more respondents (13.8%) saying that it
reduces these costs than otherwise (8%).
6 INTERNATIONAL COMPARISON
It should be noted here that international comparison is presented in order to confirm the broad
findings of the research, and not to identify the differences, as suggested by Sandford (1995, p. 407).

Page | 16
Any international comparison is fraught with difficulty because of differing tax systems, tax culture and
socio-economic characteristics, to name a few.
In general, the findings on the compliance costs in Indonesia are coherent with the international
context. Common features of compliance costs internationally as suggested by Pope (2003, p. 210) is
that the costs are significant; they are regressive; and they are (beginning to be) considered in the
political process. The compliance costs of large corporate taxpayers in Indonesia account for 3.16% of
tax revenue; which is well in the range of the international typical figures of two to ten per cent of each
country’s respective tax revenue (Evans 2008, p. 458). The Indonesian estimate is broadly comparable in
terms of its compliance costs to tax revenue ratio for large businesses with three developed countries,
namely the Netherlands at 4% (Allers 1994), the United States at 3.2% (Slemrod and Venkatesh 2002)
and Canada at 2.7% (Erard 1997). However, it is significantly lower compared to 11.4%-23.7% for public
companies’ income tax in Australia (Pope and Fayle 1991) or 9.3% for businesses’ overall taxes in
Australia (Evans et al. 1998).
The gross compliance costs estimate for large corporations in Indonesia in 2010, namely 3.16% of tax
revenue, is relatively higher compared to those of other Asian countries such as 0.36% in Malaysia (Loh
et al. 1995), 0.4% in Singapore (Ariff, Loh, and Talib 1995), and between 0.62% and 0.72% in India
(Chattopadhyay and Das-Gupta 2002).The United Kingdom is lower than Indonesia with corporation tax
compliance costs accounting for 2.22% of tax revenue from corporations (Sandford, Godwin, and
Hardwick 1989).
The costs are also regressive; again, confirms with international context as shown by Evans (2008, p.
458).
The gross compliance costs of large corporate taxpayers as a percentage of GDP in Indonesia are 0.19%.
This figure is lower than that in other countries where similar estimates have been made, such as in New
Zealand 2.5% (Sandford and Hasseldine 1992), the Netherlands 1.5% (Allers 1994), Australia 1.02%
(Evans et al. 1998) and Canada 0.4% (Plamondon and Zussman 1998).
7 LIMITATIONS
This paper discusses the compliance costs of large corporate taxpayers in Indonesia. In this research the
definition of “large taxpayers” does not refer to the exact parameter such as the amount of total assets
or turnover; rather, it is defined as the taxpayers that are registered in the Large Taxpayers Offices
(LTOs) and Medium Taxpayers Offices (MTOs) in Indonesian tax administration. There is a more exact
definition of large companies, which is provided by the Indonesian statistical bureau. However, the data
from this agency does not include other supporting features such as the identity of the companies from
which the sample could be drawn or the corresponding revenue for each type of tax that is useful in
data analysis. Nevertheless, Section 4.4 demonstrates that the data set from both sources is similar.
The compliance costs investigated here are those of large companies only. The costs of medium and
small companies, as well as individual taxpayers, need to be explored to obtain a more thorough picture
of the tax compliance costs of Indonesian taxpayers. Future studies are needed in these areas.

Page | 17
In addition, the response rate of this research is somewhat low at 8.2%, which is lower than that of
other Asian countries such as Malaysia at 16% (Loh et al. 1995), Singapore in 1994 at 23% (Ariff, Loh, and
Talib 1995) and in 1996 at 20% (Ariff, Ismail, and Loh 2002), and Hong Kong at 12% (Cheung et al. 1999).
Only India has a lower response rate of 1.15% (Chattopadhyay and Das-Gupta 2002). However, with a
total number of respondents of 246, the level of statistical confidence in this first (published) Indonesian
tax compliance costs study is arguably sound.
8 CONCLUDING REMARKS
There are a number of conclusions that could be drawn from the analysis. First, the average compliance
costs of large companies in Indonesia is IDR420 million in 2010 (around A$55,000 per year with the
December 2010 exchange rate); with the majority of the costs being payment to companies’ staff.
Secondly, the components of the costs comprise routine and non-routine costs 86% and 14%, internal
and external costs 73% and 27%, and computational and planning costs 73% and 27%, respectively.
Thirdly, the compliance costs are clearly regressive in terms of the number of employees, annual
turnover, total assets and tax payments. Fourthly, the gross and net national compliance costs of large
companies account for 3.16% and 1.63% of tax revenue from that segment of taxpayers and 0.19% and
0.10% of the Gross Domestic Product, respectively. Next, the cash flow benefits and tax deductibility
benefits offset the gross compliance costs significantly with 24% and 25% savings respectively. Finally,
the tax reform appears to be beneficial for taxpayers, although the closer guidance and supervision to
the taxpayers does not seem to affect the compliance costs.
Although comparison with other countries could be misleading due to vast differences among tax
system, preliminary data suggest that the costs in Indonesia are higher than in other Asian countries, but
are comparable with that in developed economies.
Being the first quantitative research in the compliance costs in Indonesia, the findings could be
beneficial both for the government in forms of better understanding and awareness; and for the
taxpayers in general to better position themselves in discussions with the Indonesian Government and
the tax administration now that the costs are known. Future research in other aspects such as the costs
for individual or small and medium business taxpayers is expected.
Page | 18
REFERENCES Alexander, W. Robert J., John D. Bell, and Stephen Knowles. 2004. Quantifying Compliance Costs of
Small Businesses. In Economics Discussion Papers. Dunedin: University of Otago. Allers, Maarten. 1994. Administrative and Compliance Costs of Taxation and Public Transfers in the
Netherlands. Groningen: Woltersgroep Groningen. Antara News Agency. 2010. Tax Compliance in Indonesia is Low 2010 [cited 3 September 2010].
Available from http://www.antaranews.com/view/?i=1201086345&c=EKB&s=. Ariff, M., Z. Ismail, and Alfred Loh. 2002. Compliance Costs of Corporate Income Taxation in Singapore,
1996. In Taxation & Compliance Costs in Asia Pacific Economies, edited by M. Ariff and J. Pope. Sintok: Universiti Utara Malaysia Press.
Ariff, Mohamed, Alfred Loh, and Ameen Talib. 1995. Compliance Costs of Corporate Income Taxation in Singapore, 1994. In Taxation & Compliance Costs in Asia Pacific Economies, edited by M. Ariff and J. Pope. Sintok: University Utara Malaysia Press.
Ariff, Mohamed, and Jeff Pope. 2002. Taxation & Compliance Costs in Asia Pacific Economies. Sintok: Universiti Utara Malaysia Press.
Austan, Goolsbee, and Zittrain Jonathan. 1999. Evaluating the Costs and Benefits of Taxing Internet Commerce. National Tax Journal 52 (3):413.
Bank Indonesia. 2011. Indonesian Economic Indicators 2011 [cited 23 March 2011]. Available from http://bi.go.id.
Biro Pusat Statistik. 2010. Trends of the Selected Socio-Economic Indicators of Indonesia. Jakarta: Biro Pusat Statistik.
Blažić, Helena. 2004. Tax Compliance Costs of Small Business in Croatia. Institute of Public Finance. Brunton, Colmar. 2005. Measuring the Tax Compliance Costs of Small and Medium-Sized Businesses – a
Benchmark Survey Final Report. Inland Revenue. Charron, Lucie, George Chow, and Janine Halbesma. 2008. The Hidden Tax Burden : A business
Perspective on the Cost of Complying with Taxes. In CFIB Tax Research Series. Toronto. Chattopadhyay, Saumen, and Arindam Das-Gupta. 2002. The Compliance Cost of the Personal Income
Tax and its Determinants. New Delhi: National Institute of Public Finance and Policy. Chattopadhyay, Saumen, and Arindam Das-Gupta. 2002. The Income Tax Compliance Cost of Indian
Corporations. New Delhi: National Institute of Public Finance and Policy. Cheung, D., S. Chan, M. Ariff, and A. Loh. 1999. Compliance Costs of Corporate Taxation in Hong Kong. In
Taxation & Compliance Costs in Asia Pacific Economies, edited by M. Ariff and J. Pope. Sintok: Universiti Utara Malaysia Press.
Chittenden, Francis, Saleema Kauser, and Panikkos Poutziouris. 2005. PAYE-NIC Compliance Costs : Empirical Evidence from the UK SME Economy. International Small Business Journal 23: 635.
CIA. 2011. The World Factbook-Indonesia 2011 [cited 1 April 2011 2011]. Available from https://www.cia.gov/library/publications/the-world-factbook/geos/id.html.
Coolidge, Jacqueline. 2010. Tax Compliance Cost Surveys: Using Data to Design Targeted Reforms. In Investment Climate In Practice: Investment Climate Advisory Services, World Bank.
Cordova-Novion, C, and C De Young. 2001. The OECD/Public Management Service Multi Country Business Survey-Benchmarking Regulatory and Administrative Business Environments in Small and Medium Sized Enterprises. In Tax Compliance Costs: A Festscrifts for Cedric Sandford, edited by C. Evans, J. Pope and J. Hasseldine. Sydney: Prospect.
CPA Australia. 2003. Small Business Survey Program: Compliance Burden. Melbourne: CPA Australia. DeLuca, Donald, Scott Stilmar, John Guyton, Wu-Lang Lee, and John O’Hare. 2007. Aggregate Estimates
of Small Business Taxpayer Compliance Burden. IRS Research Bulletin 1500. Directorate General of Taxes. 2008. Income Tax Law. Government of Indonesia.
Page | 19
Directorate General of Taxes. 2009. Value-added Tax and Sales Tax on Luxurious Goods Law. Government of Indonesia.
Directorate General of Taxes. 2010. Annual Report 2009. Jakarta: Directorate General of Taxes. Directorate General of Taxes. 2010. The Formation of Modern Tax Offices and Tax Regional Offices 2010
[cited 5 August 2010]. Available from http://www.pajak.go.id/dmdocuments/Pembentukan%207%28tujuh%29%20Kanwil%20DJP%20Modern%20dan%20Pembentukan%20KPP%20Pratama%20serta%20KP2KP%20di%2010%28sepuluh%29%20Kanwil%20DJP.pdf".
Directorate General of Taxes. 2012. Mbah Bejo Pun Bayar Pajak 2012 [cited 28 February 2012 2012]. Available from http://www.pajak.go.id/content/mbah-bejo-pun-bayar-pajak.
Erard, Brian. 1997. The Income Tax Compliance Burden on Canadian Big Business. Ottawa: Technical Committee on Business Taxation.
EU Project on Corporate Tax Compliance Costs. 2009. Expert Study on the Corporate Tax Compliance Costs for Businesses Going EU Cross Border – Comparison Under the Current Regime, the CCTB and the CCCTB Regime.
Evans, C, B Tran-Nam, and B Jordan. 2002. Assessing the Potential Compliance Costs/Benefits of the Tax Value Method. Australian Tax Forum 17 (1):33-58.
Evans, Chris. 2003. The Operating Costs of Taxing the Capital Gains of Individuals: A Comparative Study of Australia and the UK, with Particular Reference to the Compliance Costs of Certain Tax Design Features, Faculty of Law, University of New South Wales, Sydney.
Evans, Chris. 2003. Studying the Studies: An Overview of Recent Research into Taxation Operating Costs. eJournal of Tax Research 4.
Evans, Chris. 2008. Taxation Compliance and Administrative Costs: An Overview. In Tax Compliance Costs for Companies in an Enlarged European Community, edited by M. Lang, C. Obermair, J. Schuch, C. Staringer and P. Weninger: Kluwer Law International.
Evans, Chris, Katherine Ritchie, Binh Tran-Nam, and Mike Walpole. 1998. Taxation Compliance Costs: Some Recent Empirical Work and International Comparisons. Australian Tax Forum 14.
Gillis, Malcolm. 1985. Micro and Macroeconomics of Tax Reform. Journal of Development Economics 19 (1985):221-254.
Guyton, John L., John F. O'Hare, Michael P. Stavrianos, and Eric J. Toder. 2003. Estimating the Compliance Cost of the U.S. Individual Income Tax. National Tax Journal 56 (3):673.
Hasseldine, J, and A Hansford. 2002. The Compliance Burden of the VAT: Further Evidence from the UK. Australian Tax Forum 17 (4):187-191.
Heij, Gitte. 1993. Tax Administration and Compliance in Indonesia. Vol. II, Asia Research Centre Policy Paper 9 Perth: Murdoch University.
Henefah, M., M. Ariff, and J. Kasipillai. 2001. Compliance Cost of Small and Medium Enterprises in Malaysia. In Taxation & Compliance Costs in Asia Pacific Economies, edited by M. Ariff and J. Pope. Sintok: Universiti Utara Malaysia Press.
Jrbashyan, Tigran, and Davit Harutyunyan. 2006. Estimation of Transaction Costs during Tax Collection Process. Armenian International Policy Research Group.
Klun, Maja. 2004. Compliance Costs for Personal Income Tax in a Transition Country: The Case of Slovenia. Fiscal Studies 25 (1).
Klun, Maja. 2004. Taxation Compliance Costs for Companies in Slovenia. Economic and Business Review for Central and South - Eastern Europe 6 (4):325.
Lobo, Delgado, J M. Salinas-Jiminez, and J Sanz Sanz. 2001. Hidden Tax Burden of the Personal Income Tax: Evidence from Recent Tax Reform in Spain. Australian Tax Forum 16:463-482.

Page | 20
Loh, Alfred, M. Ariff, Z Ismail, Shamsher M, and M Ali. 1995. Compliance Costs of Corporate Income Taxation in Malaysia. In Taxation & Compliance Costs in Asia Pacific Economies, edited by M. Ariff and J. Pope. Sintok: Universiti Utara Malaysia Press.
Mathieua, Laurence, Catherine Waddams Pricea, and Francis Antwib. 2010. The Distribution of UK Personal Income Tax Compliance Costs. Applied Economics 42,:351–368.
Merrill, Peter, Qiang Ma, Fritz Scheuren, Ali Mustaq, Joel Slemrod, and Brian Erard. 2006. Retail Sales Tax Compliance Costs: A National Estimate. National Economic Consulting.
Moody, J. Scott, Wandy P. Warcholik, and Scott A. Hodge. 2005. The Rising Cost of Complying with the Federal Income Tax. Tax Foundation.
Plamondon, Robert E., and David Zussman. 1998. The Compliance Costs of Canada’s Major Tax Systems and the Impact of Single Administration. Canadian Tax Journal 46 (4):761-785.
Pope, J., D.L. Chen, and R. Fayle. 1993. The Compliance Costs of Employment-Related Taxation in Australia : Employers’ Pay-As-You-Earn, Fringe Benefits Tax, Prescribed Payments System and Payroll Tax 1989/1990. Sydney: Australian Tax Research Foundation.
Pope, J., R. Fayle, and D. L. Chen. 1991. The Compliance Costs of Public Companies' Income Taxation in Australia, 1986/87. Sydney: Australian Tax Research Foundation.
Pope, Jeff. 1993. The Compliance Costs of Major Commonwealth Taxes in Australia, School of Economics and Finance, Curtin University, Perth.
Pope, Jeff. 1993. The Compliance Costs of Taxation in Australia and Tax Simplification: The Issues. Australian Journal of Management 18(1).
Pope, Jeff. 2003. Researh Methodology for Estimating the Compliance Costs of the Goods and Services Tax in Australia. In Contemporary Issues in Taxation Reseach edited by A. Lymer and D. Salter. Hants: Ashgate Publishing Limited.
Pope, Jeff. 2003. Tax Compliance Costs. In Taxation: Interdisiplinary Approach to Reserach, edited by M. Lamb, A. Lymer, J. Freedman and S. James. Oxford: Oxforf University Press.
Pope, Jeff, R. Fayle, and D.L. Chen. 1993. The Compliance Cost of Wholesale Sales Tax in Australia. Sydney: Australian Tax Research Foundation.
Pope, Jeff, and Richard Fayle. 1991. The Compliance Costs of Public Companies' Income Taxation in Australia 1986/87: Empirical Results. Australian Tax Forum 8 (4):485.
Pope, Jeff, Richard Fayle, and D. L. Chen. 1994. The Compliance Costs of Companies' Incme Taxation in Australia. Sydney: Australian Tax Research Foundation.
Pope, Jeff, Richard Fayle, and M. Duncanson. 1990. The Complance Costs of Personal Income Taxation in Australia 1986/87. Sydney: Australian Tax Research Foundation.
Pope, Jeff, and Nthati Rametse. 2002. Small Business Start-Up Compliance Cost of the Goods and Services Tax: Estimates and Lessons From Tax Reform. Journal of Australian Taxation 12 (5(3)).
Prasetyo, Adinur. 2010. Transaction Cost in Tax Computation 2003 [cited 18 September 2010]. Available from http://jurnalskripsitesis.wordpress.com/2008/03/22/biaya-transaksi-dalam-penghitungan-pajak/.
Reekmans, Catherine, and Gudrun Simoens. 2009. How High Are the Tax Compliance Costs for Belgian SMEs, Faculty of Economics and Business, Ghent University.
Sandford, Cedric. 1995. Tax Compliance Costs Measurement and Policy. Bath: Fiscal Publications. Sandford, Cedric, M. Godwin, and Peter Hardwick. 1989. Administrative and Compliance Costs of
Taxation. Bath: Fiscal Publications. Sandford, Cedric, and John Hasseldine. 1992. The Compliance Costs of Business Taxes in New Zealand.
Wellington: Institute of Policy Studies. Skatteverket. 2006. Compliance Costs of Value Added Tax in Sweden. Slemrod, Joel, and Varsha Venkatesh. 2002. The Income Tax Compliance Cost of Large and Mid-Size
Businesses. Michigan: Ross School of Business.

Page | 21
The Investment Climate Advisory Service. 2007. South Africa-Tax Compliance Burden for Small Businesses: A Survey of Tax Practitioners. FIAS.
The Investment Climate Advisory Service. 2009. The Costs of Tax Compliance in Ukraine. Kyiv: World Bank.
Tran-Nam, B, and J Glover. 2002. Estimating the Transitional Compliance Costs of the GST in Australia: a case Study Approach. Australian Tax Forum 17 (4):499-536.
Tran-Nam, Binh, Chris Evans, Michael Walpole, and Katherine Ritchie. 2000. Tax compliance costs: Research methodology and empirical evidence from Australia. National Tax Journal 53 (2):229.
Wallschutzky, Ian Gregory, and Brian Gibson. 1993. Small Business Cost of Tax Compliance. Newcastle: Dept. of Commerce, University of Newcastle.
World Bank. 2011. Indonesia 2011 [cited 20 March 2011]. Available from http://data.worldbank.org/country/indonesia.
Page | 22
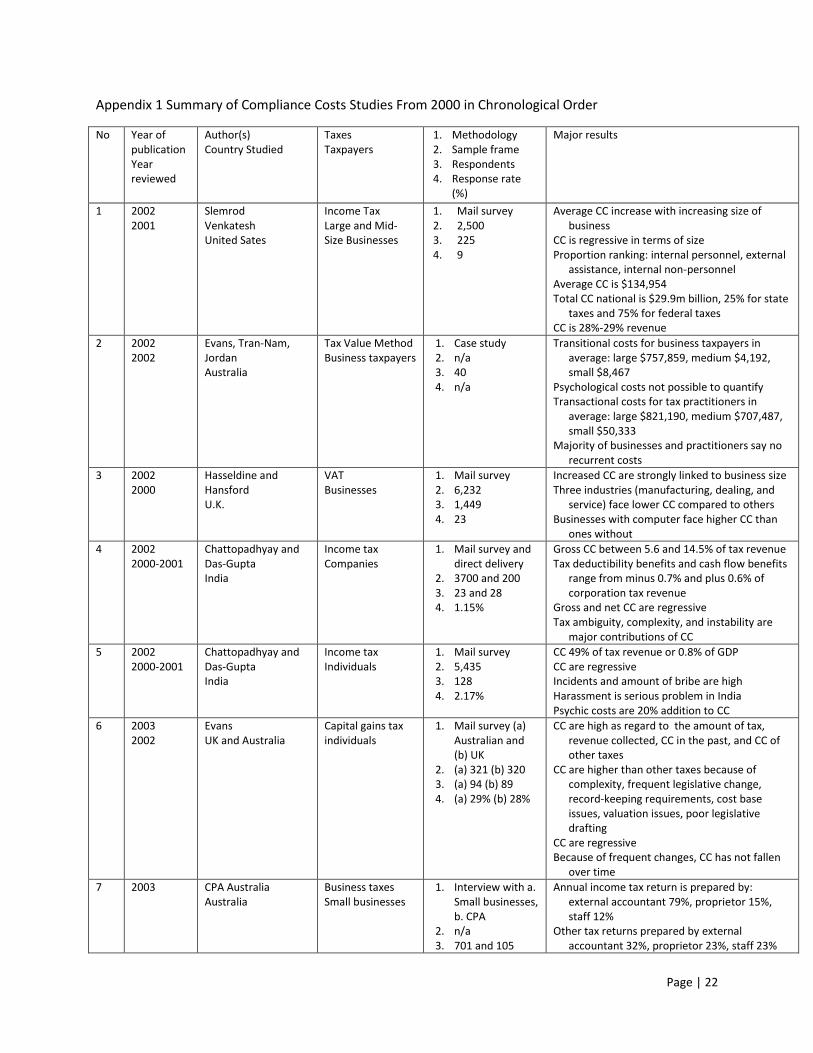
Appendix 1 Summary of Compliance Costs Studies From 2000 in Chronological Order
No Year of publication Year reviewed
Author(s) Country Studied
Taxes Taxpayers
1. Methodology 2. Sample frame 3. Respondents 4. Response rate
(%)
Major results
1 2002 2001
Slemrod Venkatesh United Sates
Income Tax Large and Mid-Size Businesses
1. Mail survey 2. 2,500 3. 225 4. 9
Average CC increase with increasing size of business
CC is regressive in terms of size Proportion ranking: internal personnel, external
assistance, internal non-personnel Average CC is $134,954 Total CC national is $29.9m billion, 25% for state
taxes and 75% for federal taxes CC is 28%-29% revenue
2 2002 2002
Evans, Tran-Nam, Jordan Australia
Tax Value Method Business taxpayers
1. Case study 2. n/a 3. 40 4. n/a
Transitional costs for business taxpayers in average: large $757,859, medium $4,192, small $8,467
Psychological costs not possible to quantify Transactional costs for tax practitioners in
average: large $821,190, medium $707,487, small $50,333
Majority of businesses and practitioners say no recurrent costs
3 2002 2000
Hasseldine and Hansford U.K.
VAT Businesses
1. Mail survey 2. 6,232 3. 1,449 4. 23
Increased CC are strongly linked to business size Three industries (manufacturing, dealing, and
service) face lower CC compared to others Businesses with computer face higher CC than
ones without
4 2002 2000-2001
Chattopadhyay and Das-Gupta India
Income tax Companies
1. Mail survey and direct delivery
2. 3700 and 200 3. 23 and 28 4. 1.15%
Gross CC between 5.6 and 14.5% of tax revenue Tax deductibility benefits and cash flow benefits
range from minus 0.7% and plus 0.6% of corporation tax revenue
Gross and net CC are regressive Tax ambiguity, complexity, and instability are
major contributions of CC
5 2002 2000-2001
Chattopadhyay and Das-Gupta India
Income tax Individuals
1. Mail survey 2. 5,435 3. 128 4. 2.17%
CC 49% of tax revenue or 0.8% of GDP CC are regressive Incidents and amount of bribe are high Harassment is serious problem in India Psychic costs are 20% addition to CC
6 2003 2002
Evans UK and Australia
Capital gains tax individuals
1. Mail survey (a) Australian and (b) UK
2. (a) 321 (b) 320 3. (a) 94 (b) 89 4. (a) 29% (b) 28%
CC are high as regard to the amount of tax, revenue collected, CC in the past, and CC of other taxes
CC are higher than other taxes because of complexity, frequent legislative change, record-keeping requirements, cost base issues, valuation issues, poor legislative drafting
CC are regressive Because of frequent changes, CC has not fallen
over time
7 2003 CPA Australia Australia
Business taxes Small businesses
1. Interview with a. Small businesses, b. CPA
2. n/a 3. 701 and 105
Annual income tax return is prepared by: external accountant 79%, proprietor 15%, staff 12%
Other tax returns prepared by external accountant 32%, proprietor 23%, staff 23%

Page | 23
4. n/a In past two years, 30% of respondents and 89% of consultants say the costs of compliance of taxes increase
8 2003 2000-2001
Guyton, O’Hare et al. United States
Income tax Individuals (wage & Investment (WI) and Self-employed (SE))
1. Interview 2. n/a 3. 6,366 WI and
9,081 SE 4. 60.5% WI and
56.4% SE
National CC is 3.21 billion hour and $18.8 billion Average CC for SE taxpayer is greater than WI
taxpayer Time spent rank: software-tax professionals-self
prepared returns Money spent rank: professionals-software-self
prepared If time spent is monetized, total CC is $67-99
billion
9 2004 2000
Klun Slovenia
Income tax Individuals
1. 50% mail, 50% visit
2. 350 3. 222 4. 64
Average time spent 1.7 hours Costs vs. revenue ratio: 2.5% Time cost is 89.6% of CC CC as % of income is regressive
10 2004 2002
Klun Slovenia
Income tax Companies
1. Mail survey & interview
2. 200 3. 126 4. 64
Average CC per company is 1,507 thousand SIT CC is 4.22% of tax revenue CC is 1% of GDP Structure of costs: labour 57.8%, consultation
26.1%, others 16.1% Structure of costs based on tax: VAT 66.9%, CIT
23%, deducted tax 10%
11 2004 2001/2002
Blazic Croatia
All taxes Small businesses
1. Interview 2. n/a 3. 257 4. n/a
CC is 0.8% of GDP CC is almost 100% of tax revenue The biggest proportion of CC is VAT Psychological cost not significant CC is regressive in terms of number of
employees and turnover Time of owner is the biggest contributor of CC
12 2004 2003
Alexander, Bell et al. New Zealand
All compliance costs Small business
1. Direct measurement through 13-week diary
2. 70 3. 25 4. 36
The most CC relate to taxes Most CC do not benefit the businesses Preparing GST and PAYE returns are dominant in
taxes-related CC
13 2005 2003
Brunton New Zealand
All taxes Small and medium enterprises
1. Mail survey 2. 5620 3. 1,907 4. 44-45
Internal costs, average 76.7 hours (56.3 owners, 18.4 paid employees, 3.4 unpaid helpers)
Internal hours based on taxes: GST 44.2, Income tax 29.2, PAYE 27.5, FBT 12.8 hours
Monetized time spent, average $1,224 Monetized time spent based on taxes: GST
$1.852, PAYE $937, FBT $416 External costs: 80% use it Mean external costs: $1,465 External costs based on taxes: GST $480, Income
tax $1,202, PAYE $141, FB $149 Combined internal and external, average $4,024 Psychological: 51% less than moderate stress,
24% moderate, 23% more than moderate stress
14 2005 2004
J. Scott Moody Wendy P. Warcholik, Scott A. Hodge
Federal taxes Individuals, businesses, non-profits
1. Estimation based on IRS data
2. n/a 3. n/a 4. n/a
Total CC=$265.1 billion Costs for businesses $148 billion (56%),
individuals $111 billion (42%), non-profits $7 billion (2.5%)
CC is regressive

Page | 24
CC is 22% of tax revenue The states with highest CC per capita: Wyoming,
Delaware, and Colorado The lowest: Mississippi, West Virginia,
Tennessee
15 2005 Chittenden, Kauser et al. UK
PAYE-NIC taxes Small businesses
1. Mail survey 2. 10,000 3. 431 4. 4.31
CC is regressive in terms of the number of employees
The bigger the company, the more costs relate to internal staff
CC per employee range from £335 (smallest companies to £21 (biggest companies)
Psychological costs range from £458 to £18 Opportunity costs range from £402 to £17
16 2006 2003
Peter Merrill Qiang Ma Fritz Scheuren Ali Mustaq Joel Slemrod Brian Erard United States
Retail taxes All taxpayers
1. Mail survey 2. 13,872 3. 796 4. 8
Gross CC=3.09% of national sales tax Gross CC=0.19% of taxable sales Average gross CC for small businesses is $2,388;
medium $5,279, and large $118,233 CC for small businesses is six times larger than
larger businesses in term of tax collected and taxable sales
Benefits for businesses are vendor discount and net float
Vendor discount is 0.5% of sales Net float is 0.1% of sales Overall vendor discount + net float is 19% of
gross CC Top three costs are preparing returns,
documentation, training
17 2006 2004
DeLuca, Stilmar et al. United States
All taxes Small businesses
1. Mail survey and interview
2. 20,000 3. 7,243 4. 36.2
Total time spent 1,709-1,944 million hours, average 236-255 hour per company
Total money spent $14,976-16,411 million, average $2,068-2,266
Time spent rank: record keeping, paid professionals, tax planning time
Money spent rank: paid professionals, software, others
Money spent per employee: 349-383 hours Monetized time and money spent: $1,346-1,458
per company As % of revenue: money spent 0.2-0.3%, money
+ time 0.9-1% As % of total asset: money spent 0.4-0.5%,
money + time 1.6-1.8% As % of tax receipt: money spent 0.2-0.3%,
money + time 0.9-1%
18 2006 2005
Skatteverket Sweden
VAT companies
1. Mail survey and interview
2. 5,463 3. 2,077 4. 43
National CC is 6.3 SEK thousand millions; 73% of 0-4 employees businesses and 4% of more than 500 employees businesses
Average CC 9,516 SEK Structure of internal CC: preparation 27%, filling
returns 62%, finishing 12% CC is 3% of VAT revenue
19 2006 2003
Jrbshyan and Harutyunyan Armenia
All taxes Companies
1. Interview 2. 1300 3. 328 4. 25.2
CC is regressive in terms of number of employees and sales volume
Industry sector account the biggest average CC compared to other sectors

Page | 25
Information gathering costs and measurement costs account for the biggest components of CC
CC is 1.1% of GDP CC is 11.5% of tax revenue
20 2007 2006
The Investment Climate Advisory Service South Africa
All taxes Small businesses
1. Electronic survey 2. 27,747 3. 3,429 4. 15.75
Recurring burden (preparing returns) is larger than once-off burdens (audits, inspections, objections)
Basic service of tax accounting costs R12,185 in average per year
Total service costs in average R36,343 per year Most burdensome tax is provisional tax
21 2008 2007
Charron, Chow et al. Canada
All taxes companies
1. Internet mail questionnaires
2. n/a 3. 6,939 4. n/a
Global CC amounts to $12.6 billion per year; of that 90% is on small and medium companies
Average CC per company is $18,321/year CC is regressive in terms of number of
employees In terms of time and money, the most
consuming is payroll taxes, followed by income tax and GST
CC is 2.7% of tax revenue The biggest contributor of CC is the amount of
paperwork
22 2009 n/a
Reekmans and Simoens Belgium
All taxes Small businesses
1. internet mail questionnaires
2. 10,300 3. 151 4. 1.87
VAT, social security tax, and income tax account for 82% of CC; VAT alone is 50% 0f CC
Average CC is £17,457 Total CC is 5.07% of value added CC is regressive in terms of the number of
employees Based on sectors, hotels and restaurants have
highest CC per company; construction is the lowest
23 2009 2007
Investment Climate Advisory Services Ukraine
All taxes Companies Proprietors
COMPANIES: 1. Interview 2. 8,000 3. 2,082 4. 26 PROPRIETORS: 1. Interview 2. 2,678 3. 1,004 4. 43
COMPANIES: Average time required per year is 1,335 hours Largest component of CC is staff time Costs ranking: tax accounting, visit to tax office,
inspections Taxes ranking: VAT, profit tax, pension funds Average CC is $3,769 per company CC is regressive in terms of turnover Total CC is 1% of GDP PROPRIETORS: Average time used: 155 hour Large component is owners’ time Costs ranking: tax accounting, visit, inspections Tax ranking: personal income tax, fixed
taxpayers Average CC is $438 CC is regressive in terms of turnover
24 2009 EU Project European countries
Cross border taxes under two different three regimes (current, CCTB and CCCTB) Medium and Large companies
1. Expert calculation on different scenarios in 6 countries
2. n/a 3. n/a 4. n/a
For large companies, CCTB could save 9.84% time and 2.64% money in CC. CCCTB could save 69.5% time and 62.35% money
For medium companies, CCTB could save 10.74% time and 0.54% money. CCCTB could save 71.12% time and 0.18% money

Page | 26
25 2010 The World Bank Group Yemen
All taxes Small businesses
n/a Internal report, not published
26 2010 The World Bank Group Peru
All taxes Small businesses
n/a Not yet published
27 2011 2000
Mathieua, Pricea et al. UK
All taxes Individuals
1. Mail survey 2. 1,000 3. 320 4. 32
Average time is 4.5 hours a year More than 27% use tax consultants Total CC is £285 Positive correlation of CC and income,
education, and difficulty in attending to tax affairs
Age and marital have no effect on CC
Note: CC=Compliance Costs n/a=not available
Sources: various (Slemrod and Venkatesh 2002; EU Project on Corporate Tax Compliance Costs 2009; Charron,
Chow, and Halbesma 2008; DeLuca et al. 2007; Merrill et al. 2006; Alexander, Bell, and Knowles 2004; Lobo, M.
Salinas-Jiminez, and Sanz Sanz 2001; Pope and Rametse 2002; Evans, Tran-Nam, and Jordan 2002; Hasseldine and
Hansford 2002; Tran-Nam and Glover 2002; Cordova-Novion and De Young 2001; Evans 2003; CPA Australia 2003;
Guyton et al. 2003; Klun 2004; Blažić 2004; Brunton 2005; Chittenden, Kauser, and Poutziouris 2005; Austan and
Jonathan 1999; Skatteverket 2006; Jrbashyan and Harutyunyan 2006; The Investment Climate Advisory Service
2007; Reekmans and Simoens 2009; The Investment Climate Advisory Service 2009; Coolidge 2010; Mathieua,
Pricea, and Antwib 2010; Moody, Warcholik, and Hodge 2005; Chattopadhyay and Das-Gupta 2002, 2002)