the tax burden of typical workers in the eu 28—2018 · 2 total cost of employment, social...
TRANSCRIPT

Institut Économique Molinari, Paris‐Bruxelles
The Tax Burden of Typical Workers in the EU 28—2018
James Rogers | Cécile Philippe

Institut Économique Molinari Page 2 of 15 Data provided by
TABLE OF CONTENTS
Abstract ................................................................................................... 3
Background ......................................................................................... 3
Main Results ........................................................................................... 4
On average, a respite for workers from ever-rising taxes… ........ 4
…while prevalence of “hidden” tax contributions grows ........... 4
Noteworthy in 2018 ............................................................................ 5
Gap between flat-tax and progressive-tax countries .................... 6
Outlook ................................................................................................ 7
Definitions and Methodology .............................................................. 8
2018 Tax Liberation Day Calendar ...................................................... 9
Data Summary ...................................................................................... 10
Research Notes ..................................................................................... 11
Appendix 1: Cost to employer of €1 net to employee .................... 13
Appendix 2: Rankings by total cost of employment, total tax
burden and real net salary .................................................................. 14

Institut Économique Molinari Page 3 of 15 Data provided by
Abstract
The purpose of this study is to compare the tax and social security burdens of individual
employees earning typical salaries in each of the 28 member states of the European Union
and, in doing so, to determine a “tax liberation day” – measuring how much of each year’s
work is devoted to paying taxes – for workers in each country.
In addition, the study tracks year-to-year trends in the total cost, including taxation, of hiring
salaried employees in the EU-28.
Background
Numerous studies rank political systems by various measures of “economic freedom”.
While valuable to economists, the aggregate data in these studies fail to shed light on the
working individual’s role in financing their state and social security.
In addition, many organizations determine an annual “tax freedom day” for their countries.
Unfortunately, conflicting approaches to this calculation make cross-border comparisons
difficult.
This study aims to create an “apples to apples” comparison of tax rates, with data that reflect
the reality experienced by real, working people in the European Union. Finally, it serves as a
guide to the true cost of hiring employees in each member state.

Institut Économique Molinari Page 4 of 15 Data provided by
Main Results
On average, a respite for workers from ever-rising taxes…
For the fourth consecutive year, typical workers in the European Union see their average
“real tax rate” decrease (0.3%) this year, from 44.8% to 44.5%. Still, workers’ tax rates remain
higher than in 2010, due in large part to VAT increases in 20 of the 28 member states during
this period.
…while prevalence of “hidden” tax contributions continues
Employer contributions to social security are paid “on top” of gross salaries and do not
appear on most workers’ payslips. These “invisible” taxes currently represent 43% of all
payroll taxes collected in the EU – down from 44% five years ago, due largely to Belgium’s
gradual reduction of these rates since 2016.
44,0%
44,2%
44,1%
45,1%
45,3% 45,2%
45,0% 44,8%
44,5%
43,0%
43,5%
44,0%
44,5%
45,0%
45,5%
2010 2011 2012 2013 2014 2015 2016 2017 2018
REAL TAX ON AVERAGE SALARIES IN THE EU-28
Institut Économique Molinari Page 5 of 15 Data provided by
Noteworthy in 2018
France retains its position as the EU member state that taxes labour at the highest rate. 56.7%
of the cost of a salary goes to the government there, making the French worker's tax
liberation day the 27th of July – nine days later than in Austria, home of the next-highest
taxed workers, where significant reductions in labour-related taxes are expected next year.
The Tax Liberation Day in Hungary (2 July) is now 34 days later than in the first edition of
this study (2010), when Hungarian workers’ salaries were the EU’s highest-taxed (06
August). Despite an increase in VAT from 20% to 27% in 2017, recent reforms including
lower personal income taxes and reduced employer contributions to social security have had
an impact: Hungarian workers’ real net pay is 55.2% in 2018 than in 2010, and Hungary’s
unemployment rate has fallen from a peak of nearly 12% to only 3.7% in July 2018.
In contrast, for the second consecutive year, the Tax Liberation Day in Greece (10 July) is
now 27 days later than in 2010 (13 June). Salaries have dropped as taxes have risen, such that
a typical Greek worker’s annual take-home pay has dropped 21%, (approximately 3,420 €)
from 2010-2018, and he began paying a higher rate of VAT last year.
The tax liberation day for workers in Belgium came 10 days earlier in 2018, on 17 July. The
ongoing implementation the “tax shift” provided about 500€ of income tax relief to workers
in Belgium, who now face higher taxes on electricity, diesel fuel, alcohol and other
consumables. Greater savings (approx. 2,200€) again went to their employers. Continuing
implementation of the new policies are expected to reduce employees’ take-home pay
further in 2019 and 2020.
For the first time since this study was published in 2010, none of the 28 EU members altered
VAT rates in 2018.

Institut Économique Molinari Page 6 of 15 Data provided by
Gap between flat-tax and progressive-tax countries continues
EU governments with “flat tax” policies continue to tax workers at higher rates than those in
progressive tax countries. Six EU member states – including the EU’s five poorest – have flat
tax policies.
Generally, flat tax policies impose a fixed rate on income tax, the lowest being 10% in
Bulgaria – where workers have the lowest gross salaries in the EU.
Social security contribution rates in these countries are higher than in progressive systems –
on average, social contributions make up 74.9% of payroll taxes collected in “flat tax”
countries. (Not that the flat income tax rates are lower, either: Of the 10 countries assessing
the lowest income tax rates on a typical worker’s salary, 8 have progressive income tax
systems.)
45,0%
44,4%
44,5%
43%
44%
45%
46%
47%
2010 2011 2012 2013 2014 2015 2016 2017 2018
EU AVERAGE REAL TAX RATES, 2010-2016
Flat Tax states Progressive Tax states Combined Average

Institut Économique Molinari Page 7 of 15 Data provided by
Outlook
Higher pension and health care expenditures are among the primary effects of the ageing of
Europe’s population, and there are fewer workers to pay for these costs; despite a decrease in
the unemployment rate (down from 9.7% in 2010 to 7.1% in 2018), only 239 million (47%) of
the EU’s 508 million citizens are in the labour force1; this figure has risen only 1.3% since
2011.
Economic growth remains European workers’ best hope against tax increases in the near
term.
1Estimates of EU population (2018) from Eurostat and labour force (2016) from CIA World Factbook.

Institut Économique Molinari Page 8 of 15 Data provided by
Definitions and Methodology
The following terms are used in this study:
Real Gross Salary represents the total cost of employing an individual, including social
security contributions made on top of an employee’s salary.
Real Net Salary is the “bottom line” figure: How much cash a worker has left over to spend
that will not be paid to the state (other additional taxes – such as those on petrol, airline
tickets and alcohol – are not considered in this study).
An individual’s Real Tax Rate is:
Social Security Contributions + Income Tax + VAT
Real Gross Salary
This percentage of 365 determines the Tax Liberation Day, the calendar date on which an
employee (beginning work, in theory, on January 1st), would earn enough to pay his annual
tax burden.

Institut Économique Molinari Page 9 of 15 Data provided by
2018 Tax Liberation Day Calendar
MARCH 27 Cyprus
APRIL 10 Malta
26 Ireland
MAY 8 United Kingdom
23 Bulgaria
30
31
Luxembourg
Denmark
JUNE 8 Spain
8 Estonia
10 Slovenia
11 Croatia
12 Portugal
12 Latvia
15 Poland
19 Romania
19 Finland
19 Lithuania
21 Czech Republic
21 Slovakia
21 Netherlands
23 Sweden
JULY 2 Hungary
8 Italy
10 Greece
10 Germany
17 Belgium
18 Austria
27 France

Institut Économique Molinari Page 10 of 15 Data provided by
Data Summary
Country Real
Gross Salary2
Employer Social
Security
Gross Salary3
Income Tax
Employee Social
Security
Take-home Pay (Net Income)
VAT Rate
Estimated VAT
Real Net
Salary
Real Tax
Rate
Tax Liberation Day 2015
Austria 57,887 13,478 44,409 8,080 8,047 28,282 20.0% 1,838 26,444 54.32% 18-Jul
Belgium 57,443 10,873 46,570 12,304 6,056 28,210 21.0% 1,925 26,285 54.24% 17-Jul
Bulgaria†4 6,862 1,106 5,756 496 793 4,466 20.0% 290 4,176 39.15% 23-May
Croatia5 14,623 2,146 12,477 1,095 2,495 8,887 25.0% 722 8,165 44.16% 11-Jun
Cyprus6 25,134 2,592 22,542 257 1,758 20,527 19.0% 1,268 19,259 23.37% 27-Mar
Czech Republic 17,336 4,399 12,937 1,626 1,423 9,888 21.0% 675 9,213 46.86% 21-Jun
Denmark 55,725 305 55,420 19,691 153 35,576 25.0% 2,891 32,685 41.35% 31-May
Estonia† 18,141 4,501 13,640 2,198 491 10,951 20.0% 712 10,239 43.56% 08-Jun
Finland 53,590 9,774 43,816 8,594 4,088 31,134 24.0% 2,428 28,705 46.44% 19-Jun
France 56,815 18,766 38,049 2,4857 9,273 26,291 20.0% 1,709 24,582 56.73% 27-Jul
Germany 57,072 9,263 47,809 8,871 9,813 29,125 19.0% 1,798 27,326 52.12% 10-Jul
Greece 25,105 5,031 20,074 3,817 3,212 13,045 24.0% 1,017 12,027 52.09% 10-Jul
Hungary† 12,962 2,250 10,712 1,607 1,982 7,124 27.0% 625 6,498 49.86% 02-Jul
Ireland 39,418 3,826 35,592 5,005 1,424 29,163 23.0% 2,180 26,983 31.55% 26-Apr
Italy 39,792 9,150 30,642 6,969 2,908 20,765 22.0% 1,485 19,280 51.55% 08-Jul
Latvia†8 12,791 2,483 10,308 1,583 1,134 7,483 21.0% 511 6,972 44.65% 12-Jun
Lithuania†9 12,309 3,026 9,283 1,381 835 7,067 21.0% 482 6,585 46.51% 19-Jun
Luxembourg 64,632 8,435 56,197 8,944 6,913 40,340 17.0% 2,229 38,111 41.03% 30-May
Malta10 21,273 1,934 19,339 996 1,934 16,409 18.0% 960 15,449 27.38% 10-Apr
Netherlands 60,495 9,642 50,853 9,671 6,799 34,383 21.0% 2,347 32,037 47.04% 21-Jun
Poland 13,844 2,366 11,478 824 2,465 8,189 23.0% 612 7,577 45.27% 15-Jun
Portugal 21,682 4,161 17,521 2,581 1,927 13,013 23.0% 973 12,041 44.47% 12-Jun
Romania†11 8,368 1,590 6,779 906 1,118 4,755 19.0% 294 4,461 46.69% 20-Jun
Slovakia 14,353 3,737 10,616 1,024 1,423 8,170 20.0% 531 7,639 46.78% 20-Jun
Slovenia 21,024 2,916 18,109 1,377 4,002 12,730 22.0% 910 11,820 43.78% 09-Jun
Spain 34,111 7,851 26,259 3,838 1,667 20,754 21.0% 1,416 19,337 43.31% 08-Jun
Sweden 58,059 13,881 44,178 10,939 0 33,240 25.0% 2,701 30,539 47.40% 23-Jun
United Kingdom 47,066 4,687 42,379 5,770 3,933 32,677 20.0% 2,124 30,553 35.08% 09-May
All figures in euros. Flat tax countries are marked with a dagger (†).
2 Total cost of employment, social security, income tax and net income calculated by EY. Other calculations by Institut Économique Molinari. 3 Unless otherwise noted, Average Gross Salary figures are from OECD’s Taxing Wages or Eurostat’s Annual gross earnings in industry and services. 4 Average Gross Salary figure for Bulgaria from the national statistics office: http://www.nsi.bg 5 Average Gross Salary figure for Croatia from the national statistics office: http://www.dzs.hr 6 Average Gross Salary figure for Cyprus from the national statistics office: www.mof.gov.cy
7 Année de transition: Income tax for 2017 is collected in 2018. Income tax will be deducted “at the source” (as in other countries) beginning in 2019. 8 Average Gross salary for Latvia from the national statistics office: http://csb.gov.lv 9 Average Gross salary for Lithuania from the national statistics office: http://osp.stat.gov.lt 10 Average Gross salary for Malta from the national statistics office: http://nso.gov.mt 11 Average Gross salary for Romania from the national statistics office: http://insse.ro

Institut Économique Molinari Page 11 of 15 Data provided by
Research Notes
Gross Salary
When available, salary figures come from the OECD’s Taxing Wages and from
Eurostat’s Average gross annual earnings in industry and services. Others are sourced
from government statistics offices (see footnotes on page 9).
In euros, gross salaries ranged from 5,756€ (Bulgaria) to 56,197€ (Luxembourg). The
average gross salary among the 28 states was 27,250€.
Employer Contributions to Social Security
These taxes – which are invisible to most employees, who see only deductions from
their gross salaries on their pay slips – vary to a great degree. For typical workers,
these costs range from less than 1% of gross salary (Denmark) to 49% (France).
Individual Contributions to Social Security
Visible on employees’ payslips, the lower and upper reaches of these deductions are
set, respectively, by Sweden and Denmark (less than 1 %) and Romania (35%).
Total Contributions to Social Security
France (74%) is the only country taking more than half of a typical worker’s gross
salary for social security contributions. Slovakia (49%) and Austria (48%) collect the
next-largest shares.
As a group, flat tax countries collected 37.2% of average gross salaries as social
security contributions, 2.7% more than in progressive systems.

Institut Économique Molinari Page 12 of 15 Data provided by
Personal Income Taxes
In Denmark, where combined social security contributions remain the lowest (as a
percentage), personal income taxes are the highest (35.5%). At 1.1% of gross salary,
typical workers in Cyprus have the lowest income tax rates in the EU.
Estimated Value-Added Tax (VAT)
20 of the 28 EU member states have increased VAT rates since 2009, with the largest
hikes implemented in Hungary (from 20% to 27%), the United Kingdom (from 15%
to 20%), Spain (from 16% to 21%), Romania (from 19% to 24%, then back to 19%) and
Greece (from 19% to 23%). The countries without VAT increases since 2009 are:
Austria, Belgium, Bulgaria, Denmark, Germany, Latvia, Malta, and Sweden.
To determine estimated VAT we assume, conservatively, that only 32.5% of a
worker’s net income will be subject to VAT. Estimated Rent is assumed to be 35% of
the employee’s net (take-home) income. After subtracting rent, remaining net income
is divided in half to estimate the sum left over that will be subject to VAT when
spent.
Institut Économique Molinari Page 13 of 15 Data provided by
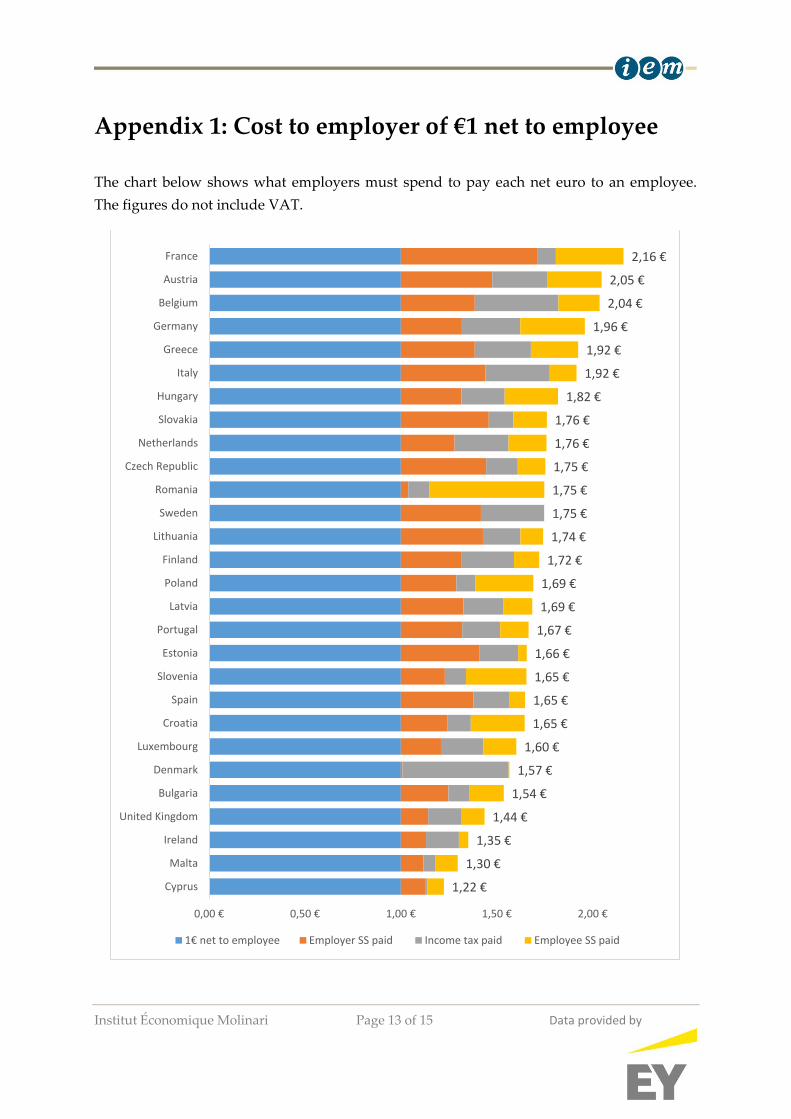
Appendix 1: Cost to employer of €1 net to employee
The chart below shows what employers must spend to pay each net euro to an employee.
The figures do not include VAT.
1,22 €
1,30 €
1,35 €
1,44 €
1,54 €
1,57 €
1,60 €
1,65 €
1,65 €
1,65 €
1,66 €
1,67 €
1,69 €
1,69 €
1,72 €
1,74 €
1,75 €
1,75 €
1,75 €
1,76 €
1,76 €
1,82 €
1,92 €
1,92 €
1,96 €
2,04 €
2,05 €
2,16 €
0,00 € 0,50 € 1,00 € 1,50 € 2,00 €
Cyprus
Malta
Ireland
United Kingdom
Bulgaria
Denmark
Luxembourg
Croatia
Spain
Slovenia
Estonia
Portugal
Latvia
Poland
Finland
Lithuania
Sweden
Romania
Czech Republic
Netherlands
Slovakia
Hungary
Italy
Greece
Germany
Belgium
Austria
France
1€ net to employee Employer SS paid Income tax paid Employee SS paid

Institut Économique Molinari Page 14 of 15 Data provided by
Appendix 2: Rankings by total cost of employment, total tax burden and real net salary12
Rank
TOTAL EMPLOYMENT COST
TOTAL TAX BURDEN
REAL NET SALARY
1 Luxembourg 64,632 France 32,233 Luxembourg 38,111
2 Netherlands 60,495 Austria 31,443 Denmark 32,685
3 Austria 57,887 Belgium 31,159 Netherlands 32,037
4 Belgium 57,443 Germany 29,745 United Kingdom 29,807
5 Germany 57,072 Netherlands 28,459 Sweden 29,683
6 France 56,815 Sweden 26,771 Finland 28,705
7 Sweden 56,454 Luxembourg 26,521 Germany 27,326
8 Denmark 55,725 Finland 24,884 Ireland 26,983
9 Finland 53,590 Denmark 23,039 Austria 26,444
10 United Kingdom 45,793 Italy 20,512 Belgium 26,285
11 Italy 39,792 United Kingdom 15,986 France 24,582
12 Ireland 39,418 Spain 15,077 Spain 19,619
13 Spain 34,696 Greece 13,077 Italy 19,280
14 Cyprus 25,134 Ireland 12,435 Cyprus 19,259
15 Greece 25,105 Portugal 9,642 Malta 15,449
16 Portugal 21,682 Slovenia 9,321 Portugal 12,041
17 Malta 21,273 Czech Republic 8,123 Greece 12,027
18 Slovenia 21,237 Estonia 7,902 Slovenia 11,916
19 Estonia 18,141 Slovakia 6,925 Estonia 10,239
20 Czech Republic 17,336 Hungary 6,463 Czech Republic 9,213
21 Slovakia 14,761 Croatia 6,458 Croatia 8,165
22 Croatia 14,623 Poland 6,267 Slovakia 7,836
23 Poland 13,844 Cyprus 5,875 Poland 7,577
24 Hungary 12,962 Malta 5,824 Latvia 6,972
25 Latvia 12,791 Lithuania 5,724 Lithuania 6,585
26 Lithuania 12,309 Latvia 5,711 Hungary 6,498
27 Romania 7,618 Romania 3,529 Bulgaria 4,176
28 Bulgaria 6,862 Bulgaria 2,686 Romania 4,089
12 All figures in Euros (€). Results include social charges, income taxes and estimated VAT.

Institut Économique Molinari Page 15 of 15 Data provided by
About the authors
James Rogers is Research Fellow at Institut Économique Molinari.
Cécile Philippe is General Director and founder of Institut Économique Molinari.
July 2018
Printed in Belgium
© 2018 James Rogers
For questions about this report, please contact:
James Rogers
Cécile Philippe