the sustainable ﻚﻳﺮﺸﻟا financial ﻞـــــﺜـﻣ ا partner ... annual report...
TRANSCRIPT

الـتـقــــــــــــــــريــر الـســنـــــــــــــوي 2012 م
م20
12ي
ـوـــــــ
نـــــســ
الـــر
ـريـــــــ
ــــــــقـ
لـتا
saib.com.sa | 800 124 8000|facebook.com/SAIB @saiblive
للتنمية المالية الشريك ا�مـثـــــل المستدامة...
AN
NU
AL
RE
PO
RT
20
12
A N N U A L R E P O R T 2 0 1 2
The sustainable financial partner of choice…
saib.com.sa | 800 124 8000|facebook.com/SAIB @saiblive

الشريك ا�مـثـــــل
للتنمية المالية المستدامة...
The sustainable financial partner of choice…


The sustainable financial partner of choice…...الشريك ا�مثل للتنمية المالية المستدامة
growth...focuson
A N N U A L R E P O R T 2 0 1 2
نهتم بالنمو
ونركز على التنمية...الــتــقــــــــــــــــــــــــــــــــــــــريــــــــــر الـســــنــــــــــــــــــــــــــــــــــــــــــوي 2012 م

فكرة التقرير
growth...focuson
A N N U A L R E P O R T 2 0 1 2
The Theme
نهتم بالنمو
ونركز على التنمية...الــتــقــــــــــــــــــــــــــــــــــــــريــــــــــر الـســــنــــــــــــــــــــــــــــــــــــــــــوي 2012 م
The Saudi Investment Bank has an important role to play in the lives of the Saudi People. Because finance and commerce are the processes that attach the world’s natural resource base to production and consumption, we believe the financial sector has an opportunity to bring back the balance between the three. The Saudi Investment Bank therefore recognizes Corporate Sustainability as a valuable and important concept to integrate within its strategy, culture and operational processes. Our Corporate Sustainability efforts should in turn have a positive impact on the overall performance and long term competitiveness of the Bank, including customer satisfaction, employee commitment, transparency, and strong governance.
The Saudi Investment BankThe Saudi Investment Bank is a Saudi Arabian Joint stock company established by Royal Decree no. M/31 dated June 23, 1976 with its headquarters in Riyadh. The Bank began operations in April 1977, and currently has a network of 48 branches located throughout the Kingdom. The Bank’s shareholders’ include:
Saudi Shareholders
• General Organization for Social Insurance 21.50%
• Public Pension Agency 17.30%
• Saudi Oger Ltd 8.50%
• National Commercial Bank 7.30%
• Other Saudi Shareholders 35.40%
90.00%
Non-Saudi Shareholders
• J.P. Morgan International Finance Limited 7.50%
• Mizuho Corporate Bank Limited 2.50%
10.00%
The Saudi Investment Bank operates through its three regional offices and its retail branch network in Saudi Arabia, providing conventional and shariah compliant banking services and products to individuals, small and medium size enterprises, corporates, and public sector entities, including:
• Current and deposit accounts • Treasury services
• Remittances • Cash management
• Letters of credit • Letters of guarantee
• Trade finance • Loan syndications
• Bridging finance • Fiduciary placements
• SIDF co-finance • E – Banking Services
• Personal banking • Foreign exchange
• Advisory services • Money market
• Short and medium – term lending• Hedging Solutions (FX, commodities and rates)
• Local and international shareholding
The Saudi Investment Bank, through its wholly-owned subsidiary, is also a leading participant in providing brokerage services in the Saudi and international markets, as well as offering a wide range of asset management products. Through its Associate companies, the Saudi Investment Bank is also leader in providing insurance, leasing, mortgage, and credit card related products and services in Saudi Arabia.

King Abdullah bin Abdul Aziz Al-SaudCustodian of the Two Holy Mosques
Prince Salman Bin Abdulaziz Al SaudCrown Prince and Minister of Defence
of Saudi Arabia
الملك عبد ا� بن عبد العزيزخادم الحرمين الشريفين
ا�مير سلمان بن عبد العزيز آل سعودولي العهد ونائب رئيس مجلس الوزراء ووزير الدفاع
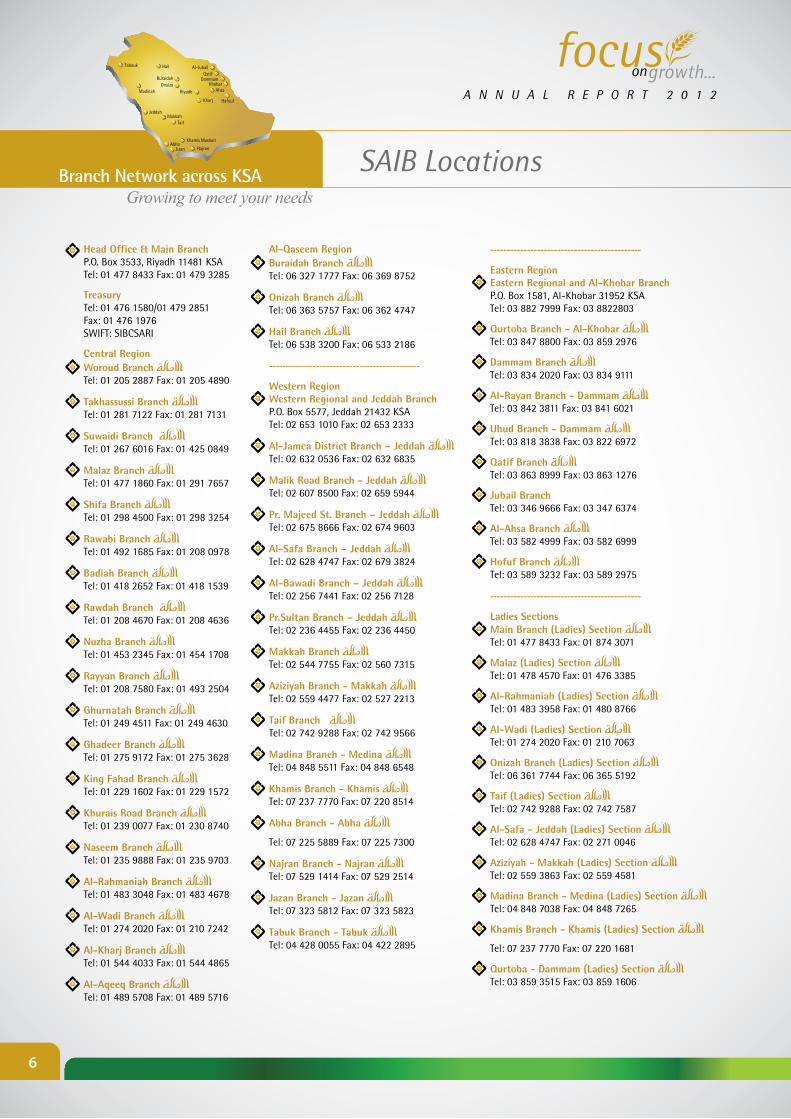
SAIB LocationsBranch Network across KSAمواقعنا
Kharj Hafouf
Qatif
AbhaJizan
Riyadh
Dammam
Al-Jubail
JeddahMakkah
Taif
Madinah
Tabouk Hail
BuraidahOnaiza
Khamis Mushait
Najran
KhobarAhsa
Growing to meet your needsفروعنا في المملكة العربية السعودية
تنمو وتتطور لتلبية احتياجاتكم
الخرج الهفوف
القطيف
أبهاجيزان
الرياض
الدمام
الجبيل
جـدةمكة المكرمة
الطائف
المدينة المنورة
تبوك حائل
بريدةعنيزة
خميس مشيطنجران
الخبرا�حساء
growth...focuson
A N N U A L R E P O R T 2 0 1 2
نهتم بالنمو
ونركز على التنمية...الــتــقــــــــــــــــــــــــــــــــــــــريــــــــــر الـســــنــــــــــــــــــــــــــــــــــــــــــوي 2012 م
Head Office & Main BranchP.O. Box 3533, Riyadh 11481 KSATel: 01 477 8433 Fax: 01 479 3285
TreasuryTel: 01 476 1580/01 479 2851Fax: 01 476 1976SWIFT: SIBCSARI
Central RegionWoroud Branch Tel: 01 205 2887 Fax: 01 205 4890
Takhassussi Branch Tel: 01 281 7122 Fax: 01 281 7131
Suwaidi Branch Tel: 01 267 6016 Fax: 01 425 0849
Malaz Branch Tel: 01 477 1860 Fax: 01 291 7657
Shifa Branch Tel: 01 298 4500 Fax: 01 298 3254
Rawabi Branch Tel: 01 492 1685 Fax: 01 208 0978
Badiah Branch Tel: 01 418 2652 Fax: 01 418 1539
Rawdah Branch Tel: 01 208 4670 Fax: 01 208 4636
Nuzha Branch Tel: 01 453 2345 Fax: 01 454 1708
Rayyan Branch Tel: 01 208 7580 Fax: 01 493 2504
Ghurnatah Branch Tel: 01 249 4511 Fax: 01 249 4630
Ghadeer Branch Tel: 01 275 9172 Fax: 01 275 3628
King Fahad Branch Tel: 01 229 1602 Fax: 01 229 1572
Khurais Road Branch Tel: 01 239 0077 Fax: 01 230 8740
Naseem Branch Tel: 01 235 9888 Fax: 01 235 9703
Al-Rahmaniah Branch Tel: 01 483 3048 Fax: 01 483 4678
Al-Wadi Branch Tel: 01 274 2020 Fax: 01 210 7242
Al-Kharj Branch Tel: 01 544 4033 Fax: 01 544 4865
Al-Aqeeq Branch Tel: 01 489 5708 Fax: 01 489 5716
Al-Qaseem RegionBuraidah Branch Tel: 06 327 1777 Fax: 06 369 8752
Onizah Branch Tel: 06 363 5757 Fax: 06 362 4747
Hail Branch Tel: 06 538 3200 Fax: 06 533 2186
---------------------------------------------
Western RegionWestern Regional and Jeddah BranchP.O. Box 5577, Jeddah 21432 KSATel: 02 653 1010 Fax: 02 653 2333
Al-Jamea District Branch – Jeddah Tel: 02 632 0536 Fax: 02 632 6835
Malik Road Branch - Jeddah Tel: 02 607 8500 Fax: 02 659 5944
Pr. Majeed St. Branch – Jeddah Tel: 02 675 8666 Fax: 02 674 9603
Al-Safa Branch – Jeddah Tel: 02 628 4747 Fax: 02 679 3824
Al-Bawadi Branch – Jeddah Tel: 02 256 7441 Fax: 02 256 7128
Pr.Sultan Branch – Jeddah Tel: 02 236 4455 Fax: 02 236 4450
Makkah Branch Tel: 02 544 7755 Fax: 02 560 7315
Aziziyah Branch - Makkah Tel: 02 559 4477 Fax: 02 527 2213
Taif Branch Tel: 02 742 9288 Fax: 02 742 9566
Madina Branch - Medina Tel: 04 848 5511 Fax: 04 848 6548
Khamis Branch - Khamis Tel: 07 237 7770 Fax: 07 220 8514
Abha Branch - Abha
Tel: 07 225 5889 Fax: 07 225 7300
Najran Branch - Najran Tel: 07 529 1414 Fax: 07 529 2514
Jazan Branch - Jazan Tel: 07 323 5812 Fax: 07 323 5823
Tabuk Branch - Tabuk Tel: 04 428 0055 Fax: 04 422 2895
---------------------------------------------
Eastern RegionEastern Regional and Al-Khobar BranchP.O. Box 1581, Al-Khobar 31952 KSATel: 03 882 7999 Fax: 03 8822803
Qurtoba Branch - Al-Khobar Tel: 03 847 8800 Fax: 03 859 2976
Dammam Branch Tel: 03 834 2020 Fax: 03 834 9111
Al-Rayan Branch - Dammam Tel: 03 842 3811 Fax: 03 841 6021
Uhud Branch - Dammam Tel: 03 818 3838 Fax: 03 822 6972
Qatif Branch Tel: 03 863 8999 Fax: 03 863 1276
Jubail Branch Tel: 03 346 9666 Fax: 03 347 6374
Al-Ahsa Branch Tel: 03 582 4999 Fax: 03 582 6999
Hofuf Branch Tel: 03 589 3232 Fax: 03 589 2975
---------------------------------------------
Ladies SectionsMain Branch (Ladies) Section Tel: 01 477 8433 Fax: 01 874 3071
Malaz (Ladies) Section Tel: 01 478 4570 Fax: 01 476 3385
Al-Rahmaniah (Ladies) Section Tel: 01 483 3958 Fax: 01 480 8766
Al-Wadi (Ladies) Section Tel: 01 274 2020 Fax: 01 210 7063
Onizah Branch (Ladies) Section Tel: 06 361 7744 Fax: 06 365 5192
Taif (Ladies) Section Tel: 02 742 9288 Fax: 02 742 7587
Al-Safa - Jeddah (Ladies) Section Tel: 02 628 4747 Fax: 02 271 0046
Aziziyah - Makkah (Ladies) Section Tel: 02 559 3863 Fax: 02 559 4581
Madina Branch - Medina (Ladies) Section Tel: 04 848 7038 Fax: 04 848 7265
Khamis Branch - Khamis (Ladies) Section
Tel: 07 237 7770 Fax: 07 220 1681
Qurtoba - Dammam (Ladies) Section Tel: 03 859 3515 Fax: 03 859 1606
6

Dr. Abdulaziz O’HaliChairman
Abdul Rahman Al-RawafBoard Member
Dr. Abdulraouf M. ManaaBoard Member
Abdullah S. Jum’ahBoard Member
Faysal Al-BassamBoard Member
Mishari I. Al-MishariBoard Member
Abdulaziz A. Al-KhamisBoard Member
Board of Directors’
growth...focuson
A N N U A L R E P O R T 2 0 1 2
مجلس ا�دارة
نهتم بالنمو
ونركز على التنمية...الــتــقــــــــــــــــــــــــــــــــــــــريــــــــــر الـســــنــــــــــــــــــــــــــــــــــــــــــوي 2012 م
Managing Director of SAVOLA Group. Former CEO of several major companies (such as SAVOLA Group, EMAAR Economic City). Bachelors Degree in Mechanical Engineering from King Fahad University of Petroleum and Minerals, Masters Degree from the University of California at Berkley, and a PhD from the University of Washington at Seattle.
Managing Director, Gulf Center Management Consultants. Prior to this Dr. O'Hali occupied numerous positions in government service. He received his BA and MBA from the University of Puget Sound, Tacoma, Washington and a PhD from Claremont Graduate School, Claremont, California.
Manager of the Investment Portfolios Department at the General Organization for Social Insurance. Has been a board member of many banks and other companies. Bachelors Degree in Business Administration from Arkansas State University and MPA from the University of Southern California.
Director General Financial Investments, Public Pension Agency. Held numerous positions with the Saudi Arabian Monetary Agency prior to assuming his current position in July 2006. Currently a board member of several companies. Bachelor in Economics degree from Northeastern University, Boston, Massachusetts.
د . عبدالعزيز العبدا� العوهليرئيس مجلس ا�دارة
ا�ستاذ عبدالرحمن محمد الروافعضو مجلس ا�دارة
د. عبدالرؤوف مناع عضو مجلس ا�دارة
ا�ستاذ عبدا� بن جمعةعضو مجلس ا�دارة
ا�ستاذ مشاري المشاريعضو مجلس ا�دارة
ا�ستاذ فيصل البسام عضو مجلس ا�دارة
ا�ستاذ عبدالعزيز الخميس عضو مجلس ا�دارة
Former President and CEO of Saudi Aramco. Has been Chairman and Board Member of many Saudi Aramco subsidiaries. Bachelors Degree in Political Science from the American University of Beirut.
Retired Vice President of Saudi Aramco and Board member of the Eastern Province Charitable Organization. Bachelor’s Degree in Economics, Pamona College, California – USA, and Advanced Management Program, Harvard University.
Former CEO and Board Member of Bank Al-Jazirah. Has extensive banking experience and currently a Board Member of many companies. Bachelors Degree in Business Administration from the University of Oregon.
7

1
7
8
910
1112
1314
1516
1718
23
45
6
Exec
utiv
e M
anag
emen
t Te
am w
ith n
ames
1.
Maj
ed A
. Fak
eeh
(G
M, C
orpo
rate
Ban
king
)
2.
Ram
zi A
l Nas
sar
(G
M, P
erso
nal B
anki
ng)
3.
Sula
iman
Al O
baid
(GM
, IT
& S
hare
d Se
rvic
es G
roup
)
4.
Mus
aed
Al M
inee
fi
(C
hief
Exe
cuti
ve O
ffic
er)
5.
Abdu
lmal
ik A
l San
e
(GM
, Bus
ines
s Pa
rtne
rs)
6.
Abdu
lrahm
an A
l Fad
da
(GM
, Tre
asur
y)
7.
Sam
er A
l Ray
yan
(A
GM
, Per
sona
l Ban
king
)
8.
Sam
path
Vel
amoo
r
(Chi
ef R
isk
Off
icer
)
9.
Badr
Al A
swad
(A
GM
, Qua
lity
Serv
ices
)
10.
Jam
al A
l Thu
kair
(Reg
iona
l Man
ager
Eas
ter
Regi
on)
11.
Sale
h Al
Aug
la
(AG
M, P
erso
nal B
anki
ng)
12. J
erry
McC
abe
(C
hief
Str
ateg
y O
ffic
er)
13. S
aud
Al H
osha
n
(GM
, Hum
an R
esou
rces
)
14. S
hank
ar C
hatt
anat
han
(G
M, O
pera
tion
s)
15. M
aged
Al D
akhe
el
(D
eput
y Ch
ief
Fina
ncia
l Off
icer
)
16. H
assa
n Al
Fou
ri
(Hea
d of
Com
plia
nce)
17. D
avid
K. J
ohns
on
(Chi
ef F
inan
cial
Off
icer
)
18. A
mja
d Si
ddiq
ui
(Chi
ef In
tern
al A
udit
or)

Exec
utiv
e M
anag
emen
t Te
am


growth...focuson
A N N U A L R E P O R T 2 0 1 2
كلمة رئيس مجلس ا�دارة Chairman’s Statement
نهتم بالنمو
ونركز على التنمية...الــتــقــــــــــــــــــــــــــــــــــــــريــــــــــر الـســــنــــــــــــــــــــــــــــــــــــــــــوي 2012 م
It is with great pleasure that I present the 2012 results for The Saudi Investment Bank.
The past several years have been among the most challenging in the history for the financial services industry. In spite of these conditions, the Bank has remained profitable and maintained capital ratios that are among the highest in the industry.
For 2012 the Bank reported Net Income of SR 912 million, an increase of 29% over 2011. Total assets increased to SR 59 billion at year-end, up 13% from SR 52 billion at year-end 2011. Return on Equity for the year was 10.2% and Equity to Total Assets remained at 15.9% in spite of the growth in the loan and investment portfolios.
These strong results are a reflection of our efforts over the past three years to upgrade systems, enhance staffing levels, and to introduce industry best practice standards throughout the organization. The Saudi Investment Bank continues its drive to deliver the best products and services to clients, and to be the financial services provider of choice in the Saudi Arabian market.
Significant achievements for the year included:
• Increased customer loyalty and involvement through the Aseel Rewards Program• Re-launch of the public website which is now fully integrated with social media• Significant expansion of the ATM and POS networks• Introduced a new Corporate Cash Management System with a soft launch in
2012 and a full roll-out expected early in 2013.• New focus in the Saudi project finance sector to support large government
sponsored infrastructure projects
At the same time the Bank remains fully committed to attracting and retaining Saudi nationals as the core of the Bank’s workforce. Our goal is to attract, retain,
and develop the best talent available, with a heavy emphasis on local talent.
Global economic activity continues to show a slow but uneven improvement. Economic activity in Saudi Arabia is one of the global bright spots with strong government finances and a major infrastructure build-up taking place across the country. We are encouraged by the local economic outlook and look forward to our continued role in supporting the initiatives of the Saudi government.
Having served as Chairman for the past twenty-six years, my term ends in February 2013 and I have decided not to seek re-election to the Board. During my time as Chairman the Bank grew from an institution with Paid-up Capital of SR 90 million and five branches to the significant market participant that it is today. This growth and the Bank’s investment grade ratings by two major international rating agencies
were achieved by following a conservative strategy designed to maintain strong asset quality and high levels of capitalization.
I am pleased to say that today the Bank is a recognized leader in the Saudi market, with a promising future and ability to assist in the advancement of the economic goals of the Kingdom of Saudi Arabia.
At this time I would like to express my gratitude and appreciation to my fellow Board members throughout my years of service, the staff of The Saudi Investment Bank, as well as to the Ministry of Finance, the Saudi Arabian Monetary Agency, and the Capital Market Authority. Their continued support and loyalty have been the foundations of the Bank’s success.
Dr. Abdulaziz O’Hali Chairman
11

Board of Directors’ Report
The Board of Directors of the Saudi Investment Bank (the Bank) is pleased to present its annual report of the Bank’s activities as of and for the year ended December 31, 2012.
OVERVIEWThe Bank is a Saudi Arabian joint stock company formed pursuant to a Royal Decree issued in 1976. The Bank operates forty-eight branches located throughout the Kingdom of Saudi Arabia. The Bank’s website address is www.saib.com.sa.
The Bank’s major shareholders include:
• General Organization for Social Insurance 21.5%
• Public Pension Agency 17.3%
• Saudi Oger Ltd. 8.5%
• JP Morgan Finance Ltd., 7.5%
• National Commercial Bank 7.3%
The Bank offers a wide range of conventional and Islamic retail products
and services for individuals and commercial businesses comprising small and medium size enterprises through the Bank’s head office and a network of retail branches throughout the Kingdom. The Bank also provides tailor-made financial products and services to corporate, government, and public sector entities through its three regional offices located in Riyadh, Jeddah, and Al-Khobar. The Bank, through a wholly–owned subsidiary, is a leading participant in providing brokerage services in the Saudi and international markets, as well as in offering a wide range of asset management products and services.
The Bank’s activities are organized into three major business segments: Retail Banking, Corporate Banking, and Treasury. The Bank has one wholly owned subsidiary in Saudi Arabia: Alistithmar for Financial Services and Brokerage Company, and one majority owned subsidiary: Saudi Investment Real Estate Company. In addition, the Bank has investments in four associate companies in Saudi Arabia; Amex Saudi Arabia Ltd. , Saudi Orix Leasing Company, Amlak International for Finance and Real Estate Development Co., and Mediterranean Gulf Insurance and Reinsurance Co. – KSA.
The Bank has no other subsidiaries nor operates any other businesses and activities outside of Saudi Arabia.
The Bank is subject to all laws and regulations of the Kingdom of Saudi Arabia and is regulated by the Saudi Arabian
Monetary Agency (“SAMA”). The Bank also follows regulations issued by the Ministry of Commerce and the Capital Market Authority (“CMA”).
Significant highlights for the year included continued strong core business and financial ratios, as well as improved service quality, expansion of our personal financing programs and ATM network, and further automation and expansion of the retail banking business. The Bank currently operates forty-eight branches. Included in this figure are eleven Ladies Branches. As part of our ongoing retail development plans, the Bank continued its expansion of the ALASALAH Islamic Banking brand. Under this program, the Bank operates forty-four Shariah compliant branches within the Kingdom. Finally, the Bank continued its extensive credit rating review process with Standard & Poor’s and Fitch Ratings, both of which have reaffirmed the Bank’s investment grade ratings of ‘A-‘ / ‘A-2’ and ‘A-‘ / ‘F2’, respectively.
During 2012, the Bank also received various international awards including the Elite Award from JP Morgan, the Best Bank in the Middle East for 2012 having the best new personal finance product, the Excellence in Social Responsibility, and the Best Commercial Bank in Saudi Arabia. The Bank also received an ISO certificate for both service excellence and the Bank’s Business Continuity Plan.
OPERATING RESULTS The Bank’s net income for the year ended December 31, 2012 was SAR 912 million, an increase of 29% over the 2011 net income of SAR 708 million. The increase was primarily due to an increase in operating income, a decrease in operating expenses, and an increase in the Bank’s share in earnings of associates.
12

Board of Directors’ Report
Net special commission income, which includes special commission income from placements, investments, and loans, less special commission expense from deposits and other borrowings, increased to SAR 1,242 million in 2012 compared to SAR 1,226 million in 2011, an increase of SAR 16 million or 1.3%.
Fees from banking services totaled SAR 315 million in 2012, compared with SAR 311 million in 2011, an increase of SAR 4 million or 1.29%. This increase was primarily due to the Bank’s continuing focus on developing new business.
Operating expenses before impairment charges for credit losses and non-trading investments, were SAR 632 million in 2012 compared to SAR 624 million in 2011, primarily due to expanded retail operation costs. The level of operating expenses in 2012 resulted in an efficiency ratio of 36% compared to 37% in 2011. The efficiency ratio, defined as operating expenses before impairment charges, divided by total income excluding gains and other income, is a key indicator of how resources are controlled and managed.
Operating profit before impairment charges for non-trading investments and credit losses was SR 1,090 million in 2012, compared to SR 992 million in 2011, an increase of SR 98 million, or 10%.
Impairment charges on non-trading investments were SR 69 million in 2012 compared to SAR 85 million in 2011, while the provision for credit losses was SAR 255 million in 2012 compared to SAR 288 million in 2011. The 2012 charges reflect the Bank’s continued conservative policy of maintaining loss reserves at levels consistent with the size of the portfolio and able to absorb likely loss scenarios.
The Bank’s return on average assets increased to 1.64% in 2012 compared to 1.37% in 2011. The Bank’s return on average equity also increased to 10.17% in 2012 compared to 8.48% in 2011.
The net income of the Bank’s primary business segments for the years ended December 31, 2012 and 2011 is summarized as follows:
The net income for 2011 above is presented before the income attributable to non-controlling interests in SAIB BNP Paribas Asset Management Company.
CONSOLIDATED STATEMENT OF FINANCIAL POSITION Total assets as of December 31, 2012 were SAR 59 billion compared to SAR 52 billion as of December 31, 2011, an increase of SAR 7 billion or 13%.
Investments increased by SAR 2.0 billion, or 23%, to SAR 10.9 billion as of December 31, 2012. Investments classified as investment grade represent 85% of the Bank’s investment portfolio as of December 31, 2012, compared to 84% in 2011.
Net loans and advances increased by SAR 7.0 billion, or 26%, to SAR 34.1 billion as of December 31,
2012 2011
SAR ‘000 SAR ‘000
Summary of Income
Retail Banking 252,470 222,569
Corporate Banking 310,324 252,688
Treasury 338,708 218,664
Asset Management and Brokerage 10,535 17,856
Net Income 912,037 711,777
13

Board of Directors’ Report
2012. In addition, total performing loans and advances increased by SAR 6.8 billion to reach SAR 34.4 billion, an increase of 25%. The Bank’s non-performing loans and advances decreased to SAR 450 million as of December 31, 2012 compared to SAR 1.8 billion as of December 31, 2011. The percentage of non-performing loans and advances to total loans and advances decreased to 1.29% as of December 31, 2012 compared to 6.14% in 2011. The allowance for credit losses as of December 31, 2012 totaling SAR 816.5 million represents 181% of non-performing loans.
Customer deposits increased by SAR 3.6 billion, or 10%, to SAR 40.4 billion as of December 31, 2012. Demand deposits increased by SAR 2.1 billion, or 28%, while special commission bearing deposits increased by SAR 1.5 billion, or 5%.
On April 7, 2009, the Bank entered into a three-year term loan facility agreement for an amount of SAR 500 million for general corporate purposes. The facility was repaid in April 2012.
On May 30, 2011, the Bank entered into a five-year medium term loan facility agreement for an amount of SAR 1.0 billion for general corporate purposes. The facility has been fully utilized and is repayable in May 2016. On June 24, 2012, the Bank entered into a second five-year medium term loan facility agreement for an amount of SAR 1.0 billion for general corporate purposes. The facility has been fully utilized and is repayable in September 2017.
The term loans bear commission at variable rates. The Bank has an option to effect early repayment of the term loans subject to the terms and conditions of the related agreements. The agreements above include covenants which require maintenance of certain financial ratios and other requirements, with which the Bank is in compliance as of December 31, 2012.
TOTAL EQUITY AND CAPITAL ADEQUACYAs of December 31, 2012, the total equity of the Bank increased to SAR 9.4 billion compared to SR 8.6 billion as of December 31, 2011. The total number of shares outstanding is 550 million. The ratio of total equity to total assets as of December 31, 2012 was 15.9%, compared to 16.5% as of December 31, 2011.
During 2012, the Bank distributed dividends equal to SAR 0.50 per share, or SAR 275.0 million, plus zakat amounting to SAR 0.10 per share, or SAR 49.5 million. In addition, the Bank’s Board of Directors has proposed a dividend equal to SAR 0.70 per share, or SAR 385 million in 2012, net of zakat to be withheld from Saudi Shareholders totaling SAR 31.6 million.
Capital adequacy and the use of regulatory capital are closely monitored by the Bank’s management. SAMA also requires the Bank to hold a minimum level of regulatory capital and maintain a ratio of total regulatory capital to risk-weighted assets at or above the minimum requirement of 8%.
The Bank monitors the adequacy of its capital using ratios established by SAMA. These ratios measure capital adequacy by comparing the Bank’s eligible capital with its consolidated statement of financial position assets, commitments, and notional amounts of derivatives, at a weighted amount to reflect their relative risk.
As of December 31, 2012, the Bank’s Tier I plus Tier II capital adequacy ratio was 17.62% compared to 19.12% as of December 31, 2011.
14

Board of Directors’ Report
(SR in millions)
2012 2011 2010 2009 2008
FIVE-YEAR FINANCIAL HIGHLIGHTS
Total income (1) 1,868 1,709 1,844 1,633 1,938
Total expense (2) 632 628 570 556 428
Operating profit 1,236 1,081 1,274 1,077 1,510
Impairment charges 324 373 845 555 997
Net income 912 708 429 522 513
Loans and advances, net 34,051 27,114 31,002 29,785 29,556
Investments, net 10,912 8,893 8,060 10,737 12,731
Investments in associates 966 895 865 817 719
Total assets 59,067 51,946 51,491 50,148 53,596
Customer deposits 40,414 36,770 37,215 38,247 40,702
Total equity 9,379 8,557 8,141 7,428 6,609
Return on average equity % 10.17 8.48 5.51 7.43 7.67
Return on average assets % 1.64 1.37 0.84 1.01 1.03
Capital adequacy % 17.62 19.12 17.29 14.48 13.71
Equity to total assets % 15.88 16.48 15.81 14.81 12.33
(1) Total income includes total operating income plus share in earnings of associates. (2) Total expense includes total operating expenses less impairment charges, and amounts
attributable to non controlling interests.
GEOGRAPHICAL DISTRIBUTION OF REVENUESThe Bank’s total operating income is entirely generated from its operations in the Kingdom of Saudi Arabia and is summarized below in SAR ‘000.
SR’ 000
Central Region Western Region Eastern Region Total
2012 1,415,480 224,589 81,533 1,721,602
2011 1,297,106 229,113 89,661 1,615,880
RISK MANAGEMENTThe complexity of today’s financial sector, including business operations and diversity of geographical locations, requires identification, measurement, aggregation, effective management of risks, and the efficient allocation of capital to derive an optimal risk and return ratio. The Bank manages its risks in a structured, systematic, and transparent manner through a broad risk policy that incorporates comprehensive risk management into the organizational structure, and the risk measurement and monitoring processes.
15

Board of Directors’ Report
The key features of the Bank’s comprehensive risk management policy include:
• The Board of Directors provides overall risk management direction and oversight;
• Risk management is an intrinsic process and is a core competency of all employees;
• The Bank manages its credit, market, liquidity, and operational risks in a coordinated manner within the organization; and
• The Bank’s risk management function is independent of the Bank’s business units.
In addition to the above, the Bank’s internal audit function reports to the Audit Committee of the Board of Directors and provides an independent validation of business and support units’ compliance with risk policies and procedures and the adequacy and effectiveness of the risk management framework on a bank-wide basis.
The following provides a description of the significant risks including the methods on how the Bank manages these risks.
Credit RiskThe Bank manages its exposure to credit risk, which is the risk that one party to a financial instrument will not be able to discharge its obligation, which in turn can lead to a financial loss to the Bank. The exposure to credit risk arises primarily from the risks associated with loans and advances, and the investment portfolio. Credit risk is also present in off-balance sheet financial instruments, such as commitments to extend credit.
The Bank assesses the probability of default of counterparties using internal rating tools. The Bank also uses the external ratings of major rating agencies, where available.
Market RiskMarket risk is the risk that the fair value or future cash flows of financial instruments will fluctuate due to changes in market variables such as commission rates, foreign exchange rates, and equity prices.
a) Commission rate risk Commission rate risk arises from the possibility that changes in commission rates will affect either the
fair values or the future cash flows of financial instruments. The Board of Directors has established commission rate gap limits for stipulated periods. The Bank also routinely monitors its positions and uses hedging strategies to ensure maintenance of positions within established gap limits.
b) Currency risk Currency risk is the risk of fluctuations in prevailing foreign currency exchange rates on its financial
position and cash flows. The Board of Directors sets limits on the level of exposure by currency and in total for both overnight and intra-day positions, which are routinely monitored.
c) Equity price risk Equity price risk is the risk of a decrease in fair values of equities in the Bank’s investment portfolio
as a result of possible changes in levels of equity indices and the value of individual shares. The Board of Directors sets limits on the level of exposure to each industry which are routinely monitored.
Liquidity RiskLiquidity risk is the risk that the Bank will be unable to meet its net funding requirements. Liquidity risk can be caused by market disruptions or credit downgrades, which may cause certain sources of funding to dry up unexpectedly.
The Bank’s management routinely monitors the maturity profile of its assets and liabilities to ensure that adequate liquidity is maintained. The Bank’s liquidity positions are also monitored on a daily basis and regular liquidity stress testing is conducted under a variety of scenarios covering both normal and more severe market conditions. All liquidity policies and procedures are subject to review and approval by the Bank’s Asset Liability Management Committee. Daily reports also monitor the liquidity position of the Bank in accordance with the requirements of SAMA.
16

Board of Directors’ Report
Operational RiskOperational Risk is defined as the risk of loss resulting from inadequate or failed internal processes, people and systems, or from external events.
The Bank’s Operational Risk Management Framework provides a bank-wide definition of operational risk and lays down the principles as to how the operational risks are to be identified, assessed, monitored, and controlled. The continuous assessment of operational risks and their controls in all business and support units of the Bank are monitored through Risk and Control Self-Assessment (RCSA) exercises, close monitoring of agreed action plans as a result of the RCSA exercises, and establishing an Operational Risk Appetite Matrix for the Bank as a whole. This includes monitoring the operational risk losses actually incurred on an ongoing basis and taking corrective actions to eliminate or minimize such losses in the future. The key components of this framework are comprehensively documented in the Bank’s policies, procedures, and controls.
BUSINESS CONTINUITY PLANThe Bank recognizes the importance of planning for Business Continuity and has made significant progress in this area in 2012. An effective Business Continuity Plan (“BCP”) will facilitate the Bank in mitigating a serious disruptive crisis in a controlled, timely, and structured manner. It also helps the Bank to effectively manage any disruption in its operations and to recover as quickly and effectively as possible from an unforeseen disaster or emergency that may interrupt normal business operations in full or in part.
During 2012, the Bank tested its Business Continuity Plan and procedures on two separate occasions. The tests were successful and provides confidence that the Bank will be able to handle a crisis, should it occur. The Bank will continue testing its process for business continuity at least twice a year.
In recognition of its BCP efforts, the Bank received the ISO 22301 certification in 2012 for its Business Continuity Management Process including its Retail Banking, Corporate and Treasury processes. It is worth noting that the Bank was one of the first organizations in the world to receive this certification. The ISO certification is a recognition of the fact that, should a contingency happen, the Bank has structured processes to deal with the contingency in a timely and effective manner.
INFORMATION TECHNOLOGY TRANSFORMATION STRATEGYIn order to meet the strong demands of business growth, the Bank has put in place an ambitious five year IT transformation strategy. The strategy, which has been approved by the Bank’s Board of Directors, focuses on supporting the Bank’s retail and corporate growth, in addition to building strong linkages between the Bank’s business units.
The strategy is supported by comprehensive project charters, standardized project execution, and project governance. Status tracking and monitoring is also controlled by a central project management function. In addition, an IT Governance structure has been implemented and oversight is controlled by an IT steering committee comprised of senior management.
Multiple projects were launched during 2012 to support the Bank’s business growth and enhance customer service including a new loan origination system, which offers high quality of services to our customers and helps reduce our loan turn around time; a new customer relationship management (“CRM”) system which supports customers’ complaints, services requests, claims, etc; a new internet banking system which introduced a new customer experience, including E-services to reduce customers’ in-branch visits; Visa and Master Card acquiring via our ATM network; a new Credit Card System to offer Visa and Master Card services to our customers; and a new corporate internet banking service to serve our corporate clients. Finally, all channel services have been extended to serve our customers 24/7.
BUSINESS SEGMENTS The Bank is managed on a line-of-business basis. Transactions between business segments are conducted on normal commercial terms and conditions through the use of funds transfer pricing and allocation
17

Board of Directors’ Report
methodologies. A detailed summary of the business segment results for 2012 and 2011 is presented in Note 27 to the consolidated financial statements.
The Bank has three major business segments, each of which is described below.
Retail BankingRetail Banking offers a wide range of conventional and Islamic retail services for individuals and commercial businesses comprising small and medium size enterprises through the Head Office and a network of branches throughout Saudi Arabia. Services include current accounts, savings and time deposit accounts, and local and international share brokerage activities. The Bank also offers a full range of Islamic products through its Shariah compliant branches, including Islamic Murabaha. The Bank also has a large network of ATM’s that covers all regions of Saudi Arabia.
Corporate BankingCorporate Banking focuses on providing tailor-made financial products and efficient customer services to corporate, government and public sector entities. It operates from three regional headquarters based in Riyadh, Jeddah and Al-Khobar to offer innovative financial solutions. The services and products offered include project finance, working capital finance, trade finance and services, import and export documentary credit, standby letters of credit, letters of guarantee, bill discounting, documentary and clean collections, and other trade related products, including conventional and Shariah compliant products.
Treasury Treasury is responsible for foreign exchange trading, funding and liquidity management, as well as the Bank’s investment securities portfolio and derivative products. It also manages the Bank’s asset-liability structure and interest rate risk, and provides guidance for balance sheet volume and pricing parameters.
BRANCH NETWORKAs of December 31, 2012, the Bank’s total network included forty-eight branches. Included in this figure are eleven Ladies Branches. The Bank added 18 ATM locations during 2012 and currently operates a network of 356 ATMs throughout Saudi Arabia. The Bank also added 351 point of sale terminals, bringing the total number of terminals to 553.
ALASALAH ISLAMIC BANKINGThe Bank provides Shariah-compliant products and services under the ALASALAH Islamic Banking brand. These products have been given special attention to ensure their compliance with Shariah Law and their suitability to the local market in recognition of the increasing demand for Islamic products and services, and the significance of Islamic Banking as a strategic direction for banks operating in the Kingdom and the region. The Bank now operates forty-four Shariah compliant branches.
STRATEGIC PARTNERSHIPSThe Bank has three subsidiaries registered in Saudi Arabia as follows:
• The Bank owns 100% of Alistithmar for Financial Securities and Brokerage Company, which offers brokerage and other services in the Kingdom of Saudi Arabia.
• The Bank owns 99% of The Saudi Investment Real Estate Company.
• SAIB BNP Paribas Asset Management Company, 55% owned by the Bank with the remaining 45% by Saudi and Foreign shareholders (in liquidation – see paragraph below for further details);
On September 25, 2011, The Capital Market Authority (“CMA”) approved a request submitted by Alistithmar for Financial Services and Brokerage Company (“Alistithmar”) to acquire the net assets of SAIB BNP Paribas Asset Management Company (“AMCO”). The CMA also approved Alistithmar’s request to amend Alistithmar’s business profile to include all licensed activities, including Dealing, Managing, Arranging, Advising, and Custody. The Business Transfer Agreement between Alistithmar and the AMCO shareholders was completed in December 2011. AMCO is currently in the process of legal liquidation.
18

Board of Directors’ Report
In addition to the above, the Bank has investments in four associate companies in Saudi Arabia as follows:
• Amex Saudi Arabia Ltd. - (“ASAL”), a limited liability company with Amex (Middle East), Bahrain. ASAL is incorporated in Saudi Arabia and the Bank holds a 50% interest. The principal activities of ASAL are to issue credit cards and offer other American Express products in Saudi Arabia.
• Saudi Orix Leasing Company (“Orix”). Orix is a Saudi Arabian closed joint stock company in Saudi Arabia. Orix has 34 million outstanding shares and the bank holds 12.92 million shares representing 38% of the outstanding shares. The primary business activities of Orix include lease financing services in Saudi Arabia.
• Amlak International for Finance and Real Estate Development Co. (“Amlak”). Amlak is a Saudi Arabian closed joint stock company in Saudi Arabia. Amlak has 90 million outstanding shares and the Bank holds 29 million shares representing 32% of the outstanding shares. Amlak offers real estate finance products and services.
• Mediterranean & Gulf Insurance and Reinsurance Co. KSA (“MedGulf”). Medgulf is a Saudi Arabian joint stock company. MedGulf has 80 million outstanding shares and the bank holds 15.20 million shares representing 19% of the outstanding shares. Medgulf offers a full range of insurance products and services to the Saudi market.
All the above companies are incorporated and doing business in Saudi Arabia.
CREDIT RATINGCredit ratings are an integral component for participation in the international financial markets. As the global economy becomes more integrated, credit ratings are necessary not only to ensure funding and obtain access to capital markets, but also to demonstrate a commitment to meeting a high level of internationally recognized credit and risk management standards.
During the year, the Bank continued its program of rating reviews with Standard & Poor’s Ratings Services (S&P) and Fitch Ratings.
S&P reaffirmed its ‘A-’ / ‘A-2’ long-term and short-term counterparty credit ratings for the Bank. S&P defines these ratings as follows:
• Long-Term Issuer Credit Ratings – An obligor rated ‘A-’ has strong capacity to meet its financial commitments but is somewhat more susceptible to the adverse effects of changes in circumstances and economic conditions than obligors in higher-rated categories.
• Short-Term Issuer Credit Ratings (less than 12 months) – An obligor rated ‘A-2’ has satisfactory capacity to meet its financial commitments. However, it is somewhat more susceptible to the adverse effects of changes in circumstances and economic conditions than obligors in the highest rating category.
Fitch also reaffirmed the Bank’s ‘A-’ / ‘F2’ long-term and short-term ratings. Fitch defines these ratings as follows:
• Long-Term Issuer Credit Ratings – ‘A-’ rating denotes a low expectation of credit risk. The capacity for timely payment of financial commitments is considered strong. This capacity may, nevertheless, be more vulnerable to changes in circumstances or in economic conditions than is the case for higher ratings.
• Short-Term Issuer Credit Ratings (less than 12 months) – ‘F2’ ratings indicate good credit quality with a satisfactory capacity for timely payment of financial commitments, but the margin of safety is not as great as in the case of the higher ratings.
The Bank’s ratings are the result of our financial performance, our asset quality and capitalization levels, supported by a conservative strategy and satisfactory liquidity profile. Our ratings take into consideration the fact that the Bank operates in one of the strongest banking sectors and best regulated
19

Board of Directors’ Report
markets both in the Middle East and among all emerging markets. The ratings also reflect the strong sovereign credit ratings from S&P and Fitch, in addition to the strong country economic fundamentals.
These credit ratings from S&P and Fitch are considered “Investment Grade Ratings” in the international markets.
PROFIT DISTRIBUTION The annual net income of the Bank will be distributed as directed by the Board of Directors in accordance with the provisions of the Banking Control Law, as follows:
a) Withholding the necessary amounts for payment of the Zakat owed by the Saudi shareholders and any income tax owed by the non-Saudi shareholders according to the applicable laws of the Kingdom. The Bank will pay the required amounts to the authorities and deduct the Zakat owed by the Saudi shareholders and any unreimbursed income tax of the non-Saudi shareholders from the net profit due to these shareholders, respectively.
b) Allocating not less than 25 percent of the remaining net profit, after the deduction of the Zakat and income tax as mentioned in paragraph (a) above, to the Statutory Reserve until this Reserve is equal to at least the Paid-Up Capital.
c) The remainder, after all allocations mentioned in paragraphs (a) and (b) above are made, shall be used in any manner recommended by the Board of Directors and approved by the General Assembly.
During 2012, the Bank distributed dividends equal to SAR 0.50 per share, or SAR 275.0 million, plus zakat amounting to SAR 0.10 per share, or SAR 49.5 million.
In 2012, The Board of Directors also proposed a dividend of SAR 385 million equal to SAR 0.70 per share, net of Zakat to be withheld from the Saudi Shareholders totalling SAR 31.6 million. The proposed dividend will be presented for approval in the ordinary general assembly meeting to be convened in 2013.
CHANGES IN THE BANK’S OWNERSHIP (BOARD OF DIRECTORS AND SENIOR EXECUTIVES) The Board of Directors is composed of natural persons represented on the Board in their personal capacities. Below is the list of the overall ownership of Bank’s shares and debt instruments by the Board of Directors and senior executives and their immediate relatives who have an interest in such ownership.
Directors
No. Name Beginning of the Year End of the Year
Net ChangePercentage of Change
%Shares Debtinstruments Shares Debt
instruments
1 Dr. Abdulaziz O’Hali 1,945,761 - 1,946,824 - 1,063 0.06
2Abdulrahman Al-Rawwaf
1,222 - 1,222 - - 0
3 Dr. Albulraoof Mana’a 1,222 - 201,000 - 199,778 16,348
4 Faysal Al-Bassam 383,192 - 400,072 - 16,880 4.4
5 Mishari Al-Mishari 2,444 - 2,444 - - 0
6 Abdullah Juma’ah 3,666 - 3,666 - - 0
7 Abdulaziz Al-Khamis 1,222 - 1,222 - - 0
20

Board of Directors’ Report
Senior Executives
No. NameBeginning of the Year End of the Year Net
Change
Percentage of Change
%Shares Debtinstruments Shares Debt
instruments
1 Musaed Al-Mineefi 1,056,564 - 1,178,730 - 122,166 11.56
2 Ramzi Al-Nassar 101,151 - 155,392 - 54,241 53.62
3 David Johnson 8,000 - 30,500 - 22,500 281.25
REGULATORY PAYMENTS Zakat attributable to the Saudi shareholders paid by the Bank is deducted from their share of cash dividends. Any unreimbursed income tax payable by the non-Saudi shareholders on their share of profits is also deducted from cash dividends.
The Bank paid SAR 13.7 million in Zakat on behalf of Saudi shareholders, and SAR 19.0 million of income tax on behalf of its non-Saudi shareholders during the year ended December 31, 2012. The Bank also paid SR 3.5 million in withholding tax on payments to non-residents made during the year ended December 31, 2012.
The Bank has received assessments for additional Zakat, income tax, and withholding tax totaling approximately SAR 16.7 million relating to the Bank’s 2003 through 2008 Zakat, Income tax, and withholding tax filings. The bank has filed an appeal for these assessments.
The Bank has received assessments for additional Zakat totalling approximately SAR 185 million relating to the Bank’s 2010 and 2011 Zakat filings. The assessments are primarily due to the disallowance of certain long-term investments from the Zakat base of the Bank. The Bank, in consultation with its Zakat advisors, has filed an appeal with the Department of Zakat and Income Tax, and is awaiting a response. At the current time, a reasonable estimation of the ultimate additional Zakat liability, if any, cannot be reliably determined.
The Bank paid SAR 20.6 million to the General Organization for Social Insurance for its employees including the employee share of SAR 8.7 million during the year ended December 31, 2012. The Bank also paid approximately SAR 0.2 million for visa and other related governmental fees, and SAR 4.2 million in municipality and related fees during the year ended December 31, 2012.
REGULATORY PENALTIES AND FINESDuring 2012, the CMA and SAMA imposed fines on the bank amounting to SAR 50,000 and SAR 652,000, respectively.
SAUDIZATION AND TRAININGAs a result of the Bank’s continuing Saudization efforts, the percentage of Saudi nationals to total staff as of December 31, 2012 remained strong at 78%, reflecting of the Bank’s ongoing commitment to Saudization.
During the year ended December 31, 2012, the Bank provided a total of 1,379 separate training courses that were attended by 646 Saudi employees.
The Bank also conducted training courses through E-learning for all the Bank’s staff in the areas of anti-money laundering and compliance where 97.3% and 96.3%, respectively, of all staff have successfully participated.
EMPLOYEE BENEFITSBenefits payable to employees either at the end of their services or during the term of their employment are accrued in accordance with guidelines set by the Saudi Arabian Labor Regulations and as per the
21

Board of Directors’ Report
Bank’s policies. The amount of provision made during the year ended December 31, 2012 in respect of employees end of service benefits was SAR 20.3 million. The balance of the accrued benefits outstanding is approximately SAR 99.1 million as of December 31, 2012.
The Bank offers to its eligible employees (“Employees”) equity shares in the Bank under an Employee Stock Grant Plan (“the Plan”). Under the terms of the Plan, employees are granted shares which vest over a four-year period. The cost of the plan is measured by the value of the shares on the date purchased by the Bank and recognized over the period in which the service condition is fulfilled using an appropriate valuation model, and ending on the vesting date. Employee stock option shares are recorded by the Bank at cost and presented as a deduction from the Bank’s equity as adjusted for any transaction costs, dividends and gains or losses on sales of such shares. During 2012, the Bank vested 590,997 shares for a total cost of approximately SAR 8.4 million. The balance of the Plan as of December 31, 2012 is approximately SAR 27.8 million. For further information on this Plan, refer to Note 36 to the consolidated financial statements.
In addition, the Bank grants to its eligible employees other types of security and savings plans that are based on mutual contributions by the Bank and the employees. These contributions are paid to the participating employees at the respective maturity date of each plan. The balance of the accrued benefits outstanding for the Bank’s security plan is approximately SAR 2.2 million as of December 31, 2012. The balance of the accrued benefits outstanding for the Bank’s savings plan is approximately SAR 24.1 million as of December 31, 2012, and the amount of provision made during the year ended December 31, 2012 was approximately SAR 6.7 million.
RELATED PARTY CONTRACTSExcept for the information presented in Note 33 to the consolidated financial statements, there were no other contracts with parties related to members of the Board of Directors, the General Manager, the Chief Financial Officer, or any of their relatives.
COMPOSITION OF THE BOARD OF DIRECTORS The Board was comprised of the following members during 2012:
Name Position ClassificationMembership in other listed
Companies
Dr. Abdulaziz O’Hali ChairmanIndependent and Non-Executive
-
Mr. Abdulrahman Al-Rawwaf Board MemberIndependent and Non-Executive
-
Dr. Abdulraoof Mana’a Board MemberIndependent and Non-Executive
SAVOLA Group – Al-Marai – Herfi Food Ser. Co. - Knowledge Economic City
Dr. Majid Al-Kassabi * Board MemberIndependent and Non-Executive
-
Mr. Faysal M. Al-Bassam Board MemberIndependent and Non-Executive
-
Mr. Mishari Al-Mishari Board MemberIndependent and Non-Executive
Saudi Re for Cooperative Reinsurance
Mr. Abdullah Juma’ah Board MemberIndependent and Non-Executive
Zamil Industrial Investment – Halliburton
Mr. Mr. Abdulaziz Al-Khamis Board MemberIndependent and Non-Executive
National Petrochemical – Saudi International Petrochemical
* Resigned effective June 10, 2012.
22

Board of Directors’ Report
1. The Board of Directors has the following committees:
- The Executive Committee is comprised of five Board members. This committee supervises the credit and financial policies of the Bank.
- The Audit Committee is comprised of five members: two Board members and three non-Board members. The Audit Committee’s activities include supervising the Bank’s Internal Audit function, recommending the appointment of the external auditors, overseeing the compliance committee, and related activities.
- The Nomination and Remuneration Committee is comprised of four Board members. This committee is responsible for recommending to the Board of Directors appointments to membership of the Board in accordance with the approved policies and standards, reviewing on an annual basis the requirements for the suitable skills for membership of the Board of Directors, and reviewing the structure of the Board of Directors and recommending changes thereto. It is also responsible to recommend to the Board the approval of the Bank’s compensation policy and amendments thereto, and other activities related to the Bank’s compensation policies and guidelines.
The composition of the three Board Committees is presented below:
Executive Committee Audit CommitteeNomination and Remuneration
Committee
Dr. Abdulaziz O’Hali, ChairmanMr. Abdullah Juma’ah, Chairman
Mr. Faysal M. Al-Bassam, Chairman
Mr. Abdulrahman Al-Rawwaf Dr. Abdulraoof Mana’a Mr. Abdulrahman Al-Rawwaf
Mr. Faysal M. Al-BassamDr. Khalil Kurdi(non-board)
Mr. Mishari Al-Mishari
Mr. Mishari Al-MishariMr. Hussien Al-Hakim(non-board)
Mr. Abdulaziz Al-Khamis
Mr. Abdulaziz Al-KhamisMr. Saleh Al-Khulaifi(non-board)
DIRECTORS’ ATTENDANCEFour Board of Directors meetings were held during 2012 as follows:
Date of Meeting Members Attended
March 18, 2012Dr. Abdulaziz O’Hali, Abdulrahman Al-Rawwaf, Mishari Al-Mishari, Abdullah bin Juma’ah, Dr. Abdulraoof Mana’a and Abdulaziz Al-Khamis.
June 10, 2012Dr. Abdulaziz O’Hali, Abdulrahman Al-Rawwaf, Mishari Al-Mishari, Abdullah bin Juma’ah, Dr. Abdulraoof Mana’a and Abdulaziz Al-Khamis.
September 30, 2012
Dr. Abdulaziz O’Hali, Abdulrahman Al-Rawwaf, Mishari Al-Mishari, Faysal Al-Bassam, Abdullah bin Juma’ah, Dr. Majid A. Al-Kassabi, Dr. Abdulraoof Mana’a and Abdulaziz Al-Khamis.
December 1, 2012Dr. Abdulaziz O’Hali, Abdulrahman Al-Rawwaf, Mishari Al-Mishari, Faysal Al-Bassam, Abdullah bin Juma’ah, Dr. Abdulraoof Mana’a and Abdulaziz Al-Khamis.
23

Board of Directors’ Report
Four Executive Committee meetings were held during 2012 as follows:
Date of Meeting Members Attended
January 29, 2012Dr. Abdulaziz O’Hali, Abdulrahman Al-Rawwaf, Mishari Al-Mishari , Abdulaziz Al-Khamis and Faysal Al-Bassam
March 11, 2012Dr. Abdulaziz O’Hali, Abdulrahman Al-Rawwaf, Mishari Al-Mishari, Abdulaziz Al-Khamis and Faysal Al-Bassam
May 13, 2012Dr. Abdulaziz O’Hali, Abdulrahman Al-Rawwaf, Mishari Al-Mishari,and Abdulaziz Al-Khamis.
September 30, 2012
Dr. Abdulaziz O’Hali, Abdulrahman Al-Rawwaf, Abdulaziz Al-Khamis and Faysal Al-Bassam.
Three Nomination and Remuneration Committee meetings were held during 2012 as follows:
Date of Meeting Members Attended
January 29, 2012Faysal Al-Bassam, Abdulrahman Al-Rawwaf, Mishari Al-Mishari and Abdulaziz Al-Khamis
November 11, 2012 Faysal Al-Bassam, Abdulrahman Al-Rawwaf, and Abdulaziz Al-Khamis
December 05, 2012Faysal Al-Bassam, Abdulrahman Al-Rawwaf, Mishari Al-Mishari and Abdulaziz Al-Khamis
Four Audit Committee meetings were held during 2012 as follows:
Date of Meeting Members Attended
March 18, 2012Abdullah Juma’ah, Dr. Abdulraoof Mana’a, Saleh Al-Khulaifi and Hussien Al-Hakim
June 09, 2012Abdullah Juma’ah, Dr. Khalil Kurdi, Hussien Al-Hakim, Dr. Abdulraoof Mana’a and Saleh Al-Khulaifi
September 30, 2012
Abdullah Juma’ah, Dr. Abdulraoof Mana’a, Dr. Khalil Kordi, and Saleh Al-Khulaifi.
December 1, 2012Abdullah Juma’ah, Dr. Abdulraoof Mana’a, Dr. Khalil Kordi, Saleh Al-Khulaifi and Hussien Al-Hakim
DIRECTORS’ AND SENIOR EXECUTIVES’ REMUNERATION (in SAR’000)
Six Senior Executives who Received the Highest
Remuneration including the CEO and CFO
Independent and Non-Executive Board
Members
Executive Board
Member
Remuneration 13,418 1,900 -
Allowances 5,267 418 -
Any Other Remuneration payable monthly or yearly
8,306 - -
24

Board of Directors’ Report
BOARD OF DIRECTORS’ DECLARATIONThe Board of Directors hereby declares that to the best of its knowledge and belief and in all material respects:
− The accounting records have been properly prepared.
− Effective internal controls have been established and applied.
− There is no doubt on the going concern ability of the Bank.
AUDITORSThe ordinary General Assembly held on March 18, 2012 appointed PricewaterhouseCoopers and Deloitte & Touche as the Bank’s auditors for the financial year 2012.
CORPORATE GOVERNANCE IN THE KINGDOM OF SAUDI ARABIAThe Bank substantially complies with the corporate governance guidelines issued by SAMA on June 30, 2012 which will be effective on June 30, 2014. A detailed plan has been established by management, and approved by the Board, to be fully compliant in 2013.
The Bank also complies with the guidelines included in the Rules Governing the Companies in the Kingdom of Saudi Arabia issued by the Capital Market Authority on 21/10/1427H corresponding to 12/11/2006G, except for the following:
Rule No. Rule Requirements Reason for non-application
Article 6 (b)
In voting in the General Assembly for the nomination to the board members, the Accumulative voting method shall be applied.
The Saudi Investment Bank follows the normal method of voting that is compatible with the Saudi Arabian Companies regulations and the Bank’s Articles of Association.
Article 6 (d)
Investors who are judicial persons and who act on behalf of others - e.g. investment funds- shall disclose in their annual reports their voting policies, actual voting, and ways of dealing with any material conflict of interests that may affect the practice of the fundamental rights in relation to their investments.
The Bank has no authority over those shareholders with corporate capacity obliging them to disclose their voting and investment policies. Also those investments are immaterial relative to the Bank›s total equity.
Article 10 (d)
Laying down specific and explicit policies, standards and procedures, for the membership of the Board of Directors and implementing them after they have been approved by the General Assembly.
The Bank will comply with this during 2013
ACCOUNTING STANDARDSThe Bank follows the Accounting Standards for Financial Institutions promulgated by the Saudi Arabian Monetary Agency (SAMA) and International Financial Reporting Standards (IFRS). The Bank also prepares its consolidated financial statements in compliance with the Banking Control Law, the Regulations for Companies in the Kingdom of Saudi Arabia, and the Bank’s Articles of Association.
THE ANNUAL REVIEW OF THE EFFECTIVENESS OF INTERNAL CONTROLThe Bank’s Internal control system includes the Bank’s Internal Audit, Compliance, and Risk Management Departments. These departments cover all aspects of the internal controls followed by the Bank. This is accomplished through proper mechanisms available to assist in achieving the desired goals of the Bank,
25

Board of Directors’ Report
while not affecting the objectivity and independence of these departments. These departments operate in accordance with the requirements and supervisory controls provided through the regular annual work plan approved by the relevant committees which are all under the framework of compliance requirements issued by SAMA.
The Bank’s management supports these departments and ensures the effectiveness and integrity of internal control procedures, taking into consideration all internal and external regulations without conflict.
As a result of this control framework, no material issues were reported.
COMMUNITY SERVICE AND SUSTAINABILITYThe Bank continues its efforts to consistently fulfill its social responsibility through participation in selected events, activities and programs that are specifically designed for serving its stated social objectives. For this reason, SAIB is pleased to attend and to provide aid and assistance to all segments of society. This social responsibility is clearly manifested through the sponsorship of a large number of important events and activities throughout the Kingdom as summarized below.
SAIB sponsored a ceremony honoring the retirees in cooperation with the Directorate General of Education in Taif, and co-sponsored a project development forum “Reality and Aspirations” duly organized by the Secretariat of the Council of the Governorate of the Eastern Province.
SAIB also participated in the Global Family Day celebrations by receiving a number of children of its staff for the second year. This program enhances the relationship between the Bank’s management and staff in line with SAIB’s firm conviction of the importance of effective communication. The program also reinforces the spirit of commitment of SAIB towards the families of its staff. It also delivers as much information as possible in a simplified manner regarding the concept of work and discipline.
In the field of sports, SAIB encourages and is pleased to support various sporting and entertainment events for youth. In this regard, SAIB sponsored a soccer match in 2012 between the Saudi National team and the National Team of Argentina.
In taking up their role as social development partners towards society and the nation at large, and on the occasion of Ramadan, SAIB staff distributed food baskets to a large number of poor families. SAIB staff also organized an initiative for greeting needy families by providing them with prepaid purchasing vouchers that were distributed to a large number of families to buy new clothes as part of a campaign, with the slogan of “Offer them a feast gift and rejoice your own feast”.
On the occasion of the International Day for the Elderly, which falls on the first of October, a large number of SAIB female volunteers visited a nursing home for the elderly out of a religious duty and also to draw a smile on the lips of our elderly mothers thus bringing joy to their hearts and giving them moral and psychological support. In line with its desire of inspiring a volunteer culture of its staff, SAIB also encourages all employees to participate in community services as a religious and national duty.
A team of volunteers has been formed under the annual plan of social responsibility, as part SAIB’s effort to consolidate the concept of volunteer work.
The Bank is aware that its banking activities should help sustainable development through its constant endeavor that its activities will have an influential and direct effect that would be mutually beneficial to the community and the environment. Even in marketing its products, SAIB establishes a link between its social duty and all of the Bank’s products and services.
This philosophy is clearly manifested in the Bank’s campaign launched on its Facebook during the holy month of Ramadan, which aims to raise funds for charities registered in the Kingdom. This campaign has resulted in the delivery by SAIB of a check for Orphan Care Charity “Insan” in Riyadh.
In 2012, The Bank was pleased to announce the release of its first annual Sustainability Report which
26

Board of Directors’ Report
was compiled in accordance with the Global Reporting Initiative (GRI) resulting in an Application Level B grade. The report outlines SAIB’s many sustainability efforts and achievements surrounding social, economic and environmental events carried out in 2011. SAIB aims to demonstrate its long term commitment to corporate sustainability, transparency and accountability through this major milestone in sustainable development, and further utilize this report as a benchmark for future reports to track and improve performance. Details of this report may be found on the SAIB website under the section entitled “Corporate Social Responsibility”.
CONCLUSIONIt is a pleasure, once again, for the Board of Directors to express its gratitude to the Government of the Custodian of the Two Holy Mosques, King Abdullah Bin Abdulaziz Al-Saud, and in particular to the Ministry of Finance and National Economy, as well as to the Saudi Arabian Monetary Agency and the Capital Market Authority, for their continued and constructive support. The Board of Directors would also like to thank its shareholders for their cooperation. The Board of Directors acknowledges with appreciation the confidence of the Bank’s clients and shareholders, and finally the dedication and loyalty of the Bank’s officers and staff.
27
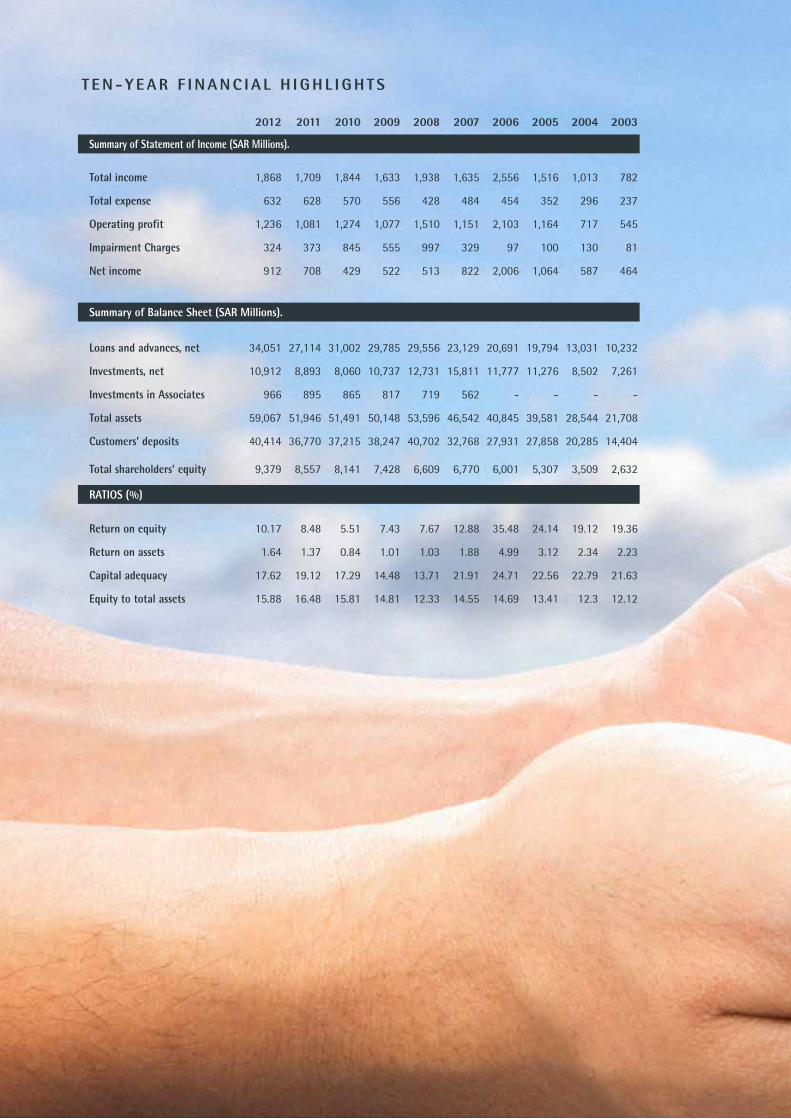
T E N - Y E A R F I N A N C I A L H I G H L I G H T S
2012 2011 2010 2009 2008 2007 2006 2005 2004 2003
Summary of Statement of Income (SAR Millions).
Total income 1,868 1,709 1,844 1,633 1,938 1,635 2,556 1,516 1,013 782
Total expense 632 628 570 556 428 484 454 352 296 237
Operating profit 1,236 1,081 1,274 1,077 1,510 1,151 2,103 1,164 717 545
Impairment Charges 324 373 845 555 997 329 97 100 130 81
Net income 912 708 429 522 513 822 2,006 1,064 587 464
Summary of Balance Sheet (SAR Millions).
Loans and advances, net 34,051 27,114 31,002 29,785 29,556 23,129 20,691 19,794 13,031 10,232
Investments, net 10,912 8,893 8,060 10,737 12,731 15,811 11,777 11,276 8,502 7,261
Investments in Associates 966 895 865 817 719 562 - - - -
Total assets 59,067 51,946 51,491 50,148 53,596 46,542 40,845 39,581 28,544 21,708
Customers’ deposits 40,414 36,770 37,215 38,247 40,702 32,768 27,931 27,858 20,285 14,404
Total shareholders’ equity 9,379 8,557 8,141 7,428 6,609 6,770 6,001 5,307 3,509 2,632
RATIOS (%)
Return on equity 10.17 8.48 5.51 7.43 7.67 12.88 35.48 24.14 19.12 19.36
Return on assets 1.64 1.37 0.84 1.01 1.03 1.88 4.99 3.12 2.34 2.23
Capital adequacy 17.62 19.12 17.29 14.48 13.71 21.91 24.71 22.56 22.79 21.63
Equity to total assets 15.88 16.48 15.81 14.81 12.33 14.55 14.69 13.41 12.3 12.12

FINANCIAL STATEMENTS& AUDITORS’ REPORT
December 31, 2012 and 2011
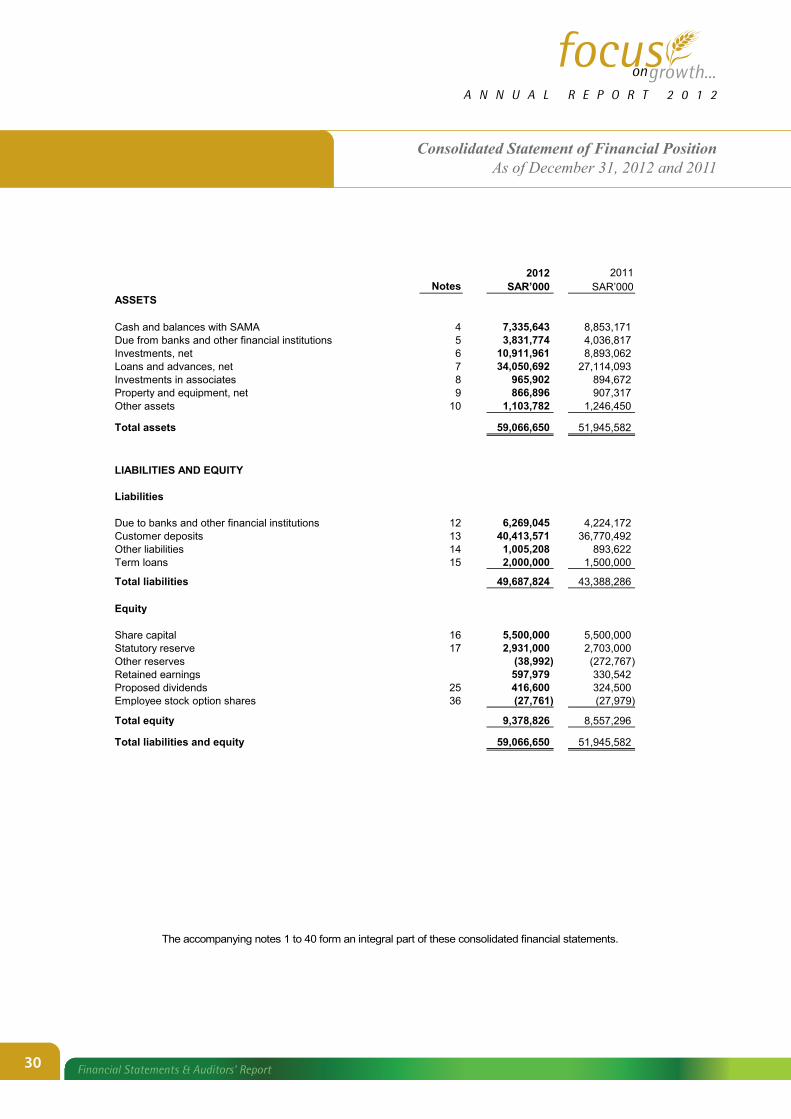
Consolidated Statement of Financial PositionAs of December 31, 2012 and 2011
THE SAUDI INVESTMENT BANK
CONSOLIDATED STATEMENT OF FINANCIAL POSITION
As of December 31, 2012 and 2011
2012 2011 Notes SAR’000 SAR’000 ASSETS Cash and balances with SAMA 4 7,335,643 8,853,171 Due from banks and other financial institutions 5 3,831,774 4,036,817 Investments, net 6 10,911,961 8,893,062 Loans and advances, net 7 34,050,692 27,114,093 Investments in associates 8 965,902 894,672 Property and equipment, net 9 866,896 907,317 Other assets 10 1,103,782 1,246,450
Total assets 59,066,650 51,945,582 LIABILITIES AND EQUITY Liabilities Due to banks and other financial institutions 12 6,269,045 4,224,172 Customer deposits 13 40,413,571 36,770,492 Other liabilities 14 1,005,208 893,622 Term loans 15 2,000,000 1,500,000
Total liabilities 49,687,824 43,388,286 Equity Share capital 16 5,500,000 5,500,000 Statutory reserve 17 2,931,000 2,703,000 Other reserves (38,992) (272,767) Retained earnings 597,979 330,542 Proposed dividends 25 416,600 324,500 Employee stock option shares 36 (27,761) (27,979)
Total equity 9,378,826 8,557,296
Total liabilities and equity 59,066,650 51,945,582
1
The accompanying notes 1 to 40 form an integral part of these consolidated financial statements.
30 Financial Statements & Auditors’ Report

Consolidated Income Statementfor the years ended December 31, 2012 and 2011
2
THE SAUDI INVESTMENT BANK
CONSOLIDATED INCOME STATEMENT
For the years ended December 31, 2012 and 2011
2012 2011 Notes SAR’000 SAR’000 Special commission income 19 1,590,816 1,549,073 Special commission expense 19 348,883 322,617 Net special commission income 1,241,933 1,226,456 Fee income from banking services, net 20 315,107 310,823 Exchange income, net 37,391 31,147 Dividend income 21 16,281 15,295 Gains on non-trading investments, net 22 20,872 12,243 Gain on sale of property and other income 90,018 19,916
Total operating income 1,721,602 1,615,880 Salaries and employee-related expenses 23 361,831 372,151 Rent and premises-related expenses 82,289 73,051 Depreciation and amortization 9 70,041 64,860 Other general and administrative expenses 117,921 114,114 Impairment charge for credit losses, net 7(b) 255,000 288,000 Impairment charge for non-trading investments, net 6(f) 69,000 85,000
Total operating expenses 956,082 997,176
Income from operating activities 765,520 618,704
Share in earnings of associates 8 146,517 93,073
Net income for the year 912,037 711,777
Income attributable to non controlling interests 1 - 4,171
Net income for the year attributable to equity holders of the Bank 912,037 707,606 Basic and diluted earnings per share, attributable to equity holders
of the Bank (expressed in SAR per share) 24 1.66 1.29
The accompanying notes 1 to 40 form an integral part of these consolidated financial statements.
31Financial Statements & Auditors’ Report

Consolidated Statement of Comprehensive Incomefor the years ended December 31, 2012 and 2011
3
THE SAUDI INVESTMENT BANK
CONSOLIDATED STATEMENT OF COMPREHENSIVE INCOME
For the years ended December 31, 2012 and 2011
Note 2012 2011 SAR’000 SAR’000
Net income for the year 912,037 711,777
Other comprehensive income / (loss) Available for sale investments:
- Net change in fair value 255,363 (239,198)
- Fair value gain transferred to consolidated income statement on disposal (20,872) (12,243)
Share of other comprehensive loss of associates (716) (1,906)
Total other comprehensive income / (loss) for the year 233,775 (253,347)
Total comprehensive income for the year 1,145,812 458,430
Attributable to:
Equity holders of the Bank 1,145,812 454,259
Non controlling interests 1 - 4,171
Total comprehensive income for the year 1,145,812 458,430
The accompanying notes 1 to 40 form an integral part of these consolidated financial statements.
32 Financial Statements & Auditors’ Report

Consolidated Statement of Changes in Equityfor the years ended December 31, 2012 and 2011
4
THE SAUDI INVESTMENT BANK
CONSOLIDATED STATEMENT OF CHANGES IN EQUITY
For the years ended December 31, 2012 and 2011
2012 (SAR’000) Employee stock Share Statutory Other Retained Proposed option Total
Notes capital reserve reserves earnings dividends shares equity
Balance at the beginning
of the year 5,500,000 2,703,000 (272,767) 330,542 324,500 (27,979) 8,557,296
Total comprehensive income for the year - - 233,775 912,037 -
- 1,145,812
Dividends paid 25 - - - - (324,500) - (324,500)
Proposed dividends 25 - - - (416,600) 416,600 - -
Employee stock option shares allocated - - - - - (21,294) (21,294)
Employee stock option shares vested - - - - -
21,512 21,512
Transfer to statutory reserve 17 - 228,000 - (228,000) -
- - Balance at the end of the
year 5,500,000 2,931,000 (38,992) 597,979 416,600
(27,761) 9,378,826
2011 (SAR’000)
Equity attributable to equity holders of the Bank
Employee stock Non con- Share Statutory Other Retained Proposed option trolling Total
Notes capital reserve reserves earnings dividends shares Total interests equity
Balance at the beginning
of the year 4,500,000 2,526,000 (19,420) 1,124,436 - (27,751) 8,103,265 38,109 8,141,374
Total comprehensive income for the year - - (253,347) 707,606 -
- 454,259 4,171 458,430
Bonus shares issued 24 1,000,000 - - (1,000,000) - - - - -
Proposed dividends 25 - - - (324,500) 324,500 - - - -
Employee stock option shares allocated - - - - - (16,661) (16,661) - (16,661)
Employee stock option shares vested - - - - -
16,433 16,433 - 16,433
Payment to non controlling interests 1 - - - - -
- - (42,280) (42,280)
Transfer to statutory reserve 17 - 177,000 - (177,000) -
- - - -
Balance at the end of the year 5,500,000 2,703,000 (272,767) 330,542 324,500
(27,979) 8,557,296 - 8,557,296
The accompanying notes 1 to 40 form an integral part of these consolidated financial statements.
33Financial Statements & Auditors’ Report

Consolidated Statement of Cash Flowsfor the years ended December 31, 2012 and 2011
5
THE SAUDI INVESTMENT BANK
CONSOLIDATED STATEMENT OF CASH FLOWS
For the years ended December 31, 2012 and 2011
2012 2011 Notes SAR’000 SAR’000 OPERATING ACTIVITIES Net income for the year 912,037 711,777 Adjustments to reconcile net income to net cash used in
operating activities: Accretion of discount on non-trading investments, net (15,564) (8,922) Gain on non-trading investments, net 22 (20,872) (12,243) Gain on sale of property (86,600) (18,248) Depreciation and amortization 9 70,041 64,860 Impairment charge for credit losses, net 7(b) 255,000 288,000 Impairment charge for non-trading investments, net 6(f) 69,000 85,000 Share in earnings of associates 8 (146,517) (93,073) 1,036,525 1,017,151 Net (increase) / decrease in operating assets: Statutory deposit with SAMA (305,623) (420,728) Due from banks and other financial institutions maturing after ninety days from acquisition date (374,638) (525,362) Loans and advances (7,191,599) 3,518,956 Other assets 104,903 (939) Net increase / (decrease) in operating liabilities: Due to banks and other financial institutions 2,044,873 (671,841) Customer deposits 3,643,079 (444,650) Other liabilities 111,804 154,690 Net cash (used in) / from operating activities (930,676) 2,627,277 INVESTING ACTIVITIES Proceeds from sale of and matured non-trading investments 3,751,517 3,518,360 Purchase of non-trading investments (5,568,489) (4,666,692) Dividends received from associates 8 74,571 61,244 Purchase of property and equipment 9 (29,731) (61,808) Proceeds from sale of property 124,476 22,594 Net cash used in investing activities (1,647,656) (1,126,302) FINANCING ACTIVITIES Term loan proceeds 1,000,000 1,000,000 Repayment of term loan (500,000) - Dividends paid (324,500) - Payment to non controlling interests 1 - (42,280) Net cash from financing activities 175,500 957,720 (Decrease) / Increase in cash and cash equivalents (2,402,832) 2,458,695
Continued..
The accompanying notes 1 to 40 form an integral part of these consolidated financial statements.
34 Financial Statements & Auditors’ Report

Consolidated Statement of Cash Flows - continuedfor the years ended December 31, 2012 and 2011
6
THE SAUDI INVESTMENT BANK
CONSOLIDATED STATEMENT OF CASH FLOWS - continued
For the years ended December 31, 2012 and 2011
Notes 2012 2011 Cash and cash equivalents SAR’000 SAR’000 (Decrease) / Increase in cash and cash equivalents (2,402,832) 2,458,695 Cash and cash equivalents at the beginning of the year 10,903,211 8,444,516
Cash and cash equivalents at the end of the year 26 8,500,379 10,903,211 Supplemental special commission information Special commission received during the year 1,590,959 1,626,667
Special commission paid during the year 314,870 302,224
Supplemental non-cash information Property and equipment transfer - 162,517
Other assets acquired in settlement of loans 7(d) - 80,850
Total other comprehensive income / (loss) for the year 233,775 (253,347)
Employee stock option shares, net of allocation and vesting 218 (228)
Bonus shares issued 24 - 1,000,000
Proposed dividends 25 416,600 324,500
The accompanying notes 1 to 40 form an integral part of these consolidated financial statements.
35Financial Statements & Auditors’ Report

Notes to the Consolidated Financial Statementsfor the years ended December 31, 2012 and 2011
7
THE SAUDI INVESTMENT BANK
NOTES TO THE CONSOLIDATED FINANCIAL STATEMENTS
For the years ended December 31, 2012 and 2011
1. General
The Saudi Investment Bank (the Bank), a Saudi Joint Stock Company, was formed pursuant to Royal Decree No. M/31 dated 25 Jumada II 1396H, corresponding to June 23, 1976 in the Kingdom of Saudi Arabia. The Bank operates under Commercial Registration No. 1010011570 dated 25 Rabie Awwal 1397H, corresponding to March 16, 1977 through its 48 branches (2011: 48 branches) in the Kingdom of Saudi Arabia. The address of the Bank’s Head Office is as follows:
The Saudi Investment Bank Head Office P. O. Box 3533 Riyadh 11481, Kingdom of Saudi Arabia
The objective of the Bank is to provide a full range of banking services. The Bank also provides to its customers Islamic (non-interest based) banking products, which are approved and supervised by an independent Shariah Board established by the Bank. The consolidated financial statements include the financial statements of the Bank and the following subsidiaries: (collectively referred to as the “Group”). a) “Alistithmar for Financial Securities and Brokerage Company”, a limited liability company, registered
in the Kingdom of Saudi Arabia under Commercial Registration No. 1010235995 issued on 8 Rajab 1428H (corresponding to July 22, 2007), and is 100% owned by the Bank after the Bank acquired the prior 1% ownership of the representative Saudi Shareholder in 2012;
b) “SAIB BNP Paribas Asset Management Company”, a limited liability company, registered in the
Kingdom of Saudi Arabia under Commercial Registration No. 1010240312 issued on 4 Thu Al Qada 1428H (corresponding to November 14, 2007), and is 55% owned by the Bank with the remaining 45% by Saudi and Foreign shareholders (in liquidation – see paragraph below for further details); and
c) “Saudi Investment Real Estate Company”, a limited liability company, registered in the Kingdom of
Saudi Arabia under commercial registration No.1010268297 issued on 29 Jumada Awal 1430H (corresponding to May 25, 2009) and is owned 99% by the Bank with the remaining 1% owned by a representative Saudi Shareholder. The company has not commenced any significant operations.
On September 25, 2011, The Capital Market Authority (“CMA”) approved a request submitted by Alistithmar for Financial Services and Brokerage Company (Alistithmar) to acquire the net assets of SAIB BNP Paribas Asset Management Company (AMCO). The CMA also approved Alistithmar’s request to amend Alistithmar’s business profile to include all licensed activities (Dealing, Managing, Arranging, Advising, and Custody). The Business Transfer Agreement between Alistithmar and the AMCO shareholders was completed in December 2011 and the net assets were acquired by Alistithmar on December 31, 2011 for approximately SAR 104.7 million. The estimated fair value of the net assets acquired was approximately SAR 92.8 million.
2. Basis of preparation
a) Statement of compliance
These consolidated financial statements are prepared in accordance with the Accounting Standards for Financial Institutions promulgated by the Saudi Arabian Monetary Agency (SAMA), and International Financial Reporting Standards (IFRS) issued by the International Accounting Standards Board (IASB). The Bank also prepares its consolidated financial statements to comply with the requirements of the Banking Control Law, the provisions of the Regulations for Companies in the Kingdom of Saudi Arabia, and the Bank’s Articles of Association.
b) Basis of measurement The consolidated financial statements are prepared under the historical cost basis except for the following items in the consolidated statement of financial position. a) Assets and liabilities held for trading are measured at fair value;
36 Financial Statements & Auditors’ Report

Notes to the Consolidated Financial Statementsfor the years ended December 31, 2012 and 2011
8
THE SAUDI INVESTMENT BANK
NOTES TO THE CONSOLIDATED FINANCIAL STATEMENTS
For the years ended December 31, 2012 and 2011
2. Basis of preparation – continued
b) Financial instruments designated as fair value through the consolidated income statement are
measured at fair value; c) Available for sale investments are measured at fair value; d) Recognized financial assets and financial liabilities designated as hedged items in qualifying fair
value hedge relationships are adjusted for changes in fair value attributable to the risk being hedged; and
e) Liabilities for cash-settled share-based payment arrangements are measured at fair value. During the years ended December 31, 2012 and 2011, the Group had no assets or liabilities which were held as trading, except for certain derivative financial instruments, and had no financial instruments that were designated as fair value through the consolidated income statement.
c) Functional and presentation currency
The consolidated financial statements are presented in Saudi Arabian Riyals (SAR) which is the Group’s functional currency. Except as indicated, financial information presented in SAR has been rounded off to the nearest thousand.
d) Critical accounting judgements, estimates and assumptions
The preparation of the consolidated financial statements in conformity with IFRS requires the use of certain critical accounting judgements, estimates and assumptions that affect the reported amounts of assets and liabilities. It also requires management to exercise its judgement in the process of applying the Bank’s accounting policies. Such judgements, estimates and assumptions are continually evaluated and are based on historical experience and other factors, including obtaining professional advice and expectations of future events that are believed to be reasonable under the circumstances. Significant areas where management has used estimates, assumptions or exercised judgements are as follows:
(i) Impairment for credit losses on loans and advances
The Bank reviews its loan portfolios to assess specific and collective impairment at each reporting date. In determining whether an impairment loss should be recorded, the Bank makes judgements as to whether there is any observable data indicating an impairment trigger and followed by a measurable decrease in the estimated future cash flows. This evidence may include observable data indicating that there has been an adverse change in the payment status of borrowers in a group. Management uses estimates based on historical loss experience for loans with credit risk characteristics and objective evidence of impairment similar to those in the portfolio when estimating its future cash flows. The methodology and assumptions used for estimating both the amount and the timing of future cash flows are reviewed regularly to reduce any differences between loss estimates and actual loss experience.
(ii) Fair value of unquoted financial instruments
The fair values of financial instruments that are not quoted in active markets are determined by using valuation techniques. Where valuation techniques (for example, models) are used to determine fair values, they are validated and periodically reviewed by qualified personnel independent of the area that created them. Models are calibrated to ensure that outputs reflect actual data and comparative market prices. To the extent practical, models use only observable market data. However, areas such as credit risk (both own and counter party), and volatilities and correlations require management to make estimates. The judgements include considerations of liquidity and model inputs such as volatility for longer dated derivatives and discount rates, prepayment rates, and default rate assumptions for asset backed securities. Changes in assumptions about these factors could affect reported fair values of financial instruments.
37Financial Statements & Auditors’ Report

Notes to the Consolidated Financial Statementsfor the years ended December 31, 2012 and 2011
9
THE SAUDI INVESTMENT BANK
NOTES TO THE CONSOLIDATED FINANCIAL STATEMENTS
For the years ended December 31, 2012 and 2011
2. Basis of preparation – continued
(iii) Impairment of available-for-sale equity investments
The Bank exercises judgement in considering impairment on the available-for-sale equity investments. This includes determination of a significant or prolonged decline in the fair value below its cost. In making this judgement, the Bank evaluates among other factors, the normal volatility in share price. In addition, the Bank considers impairment to be appropriate when there is evidence of deterioration in the financial health of the investee, industry and sector performance, changes in technology, and operational and financing cash flows.
(iv) Classification of held to maturity investments
In accordance with the guidance of IAS 39, the Bank classifies non-derivative financial assets with fixed or determinable payments and fixed maturity as held to maturity. In making this judgement, the Bank evaluates its intention and ability to hold such investments to maturity.
e) Going concern
The Bank’s management has made an assessment of the Bank’s ability to continue as a going concern and is satisfied that the Bank has the resources to continue in business for the foreseeable future. Furthermore, management is not aware of any material uncertainties that may cast significant doubt upon the Bank’s ability to continue as a going concern. Therefore, the consolidated financial statements continue to be prepared on the going concern basis.
3. Summary of significant accounting policies
The significant accounting policies adopted in the preparation of these consolidated financial statements are set out below. Except for the change in accounting policies as detailed in note 3 (a) below, the accounting policies adopted in the preparation of these consolidated financial statements are consistent with those used in the previous year. a) Change in accounting policies
The accounting policies adopted are consistent with those of the annual financial statements for the year ended December 31, 2011, as described in the annual financial statements for the year ended December 31, 2011, except for the adoption of the amendment to “IFRS 7 – Financial instruments disclosures - transfers of financial assets” as detailed below which has had no significant impact on the consolidated financial statements of the Group. The amendment to IFRS 7 is effective from July 1, 2011 and requires additional disclosures with respect to risk exposures arising from transferred financial assets. The amendment includes a requirement to disclose by class of asset the nature, carrying amount, and a description of the risks and rewards of financial assets that have been transferred to another party yet remain on the entity’s consolidated statement of financial position. Disclosures are also required to enable a user to understand the amount of any associated liabilities and the relationship between financial assets and associated liabilities.
38 Financial Statements & Auditors’ Report

Notes to the Consolidated Financial Statementsfor the years ended December 31, 2012 and 2011
10
THE SAUDI INVESTMENT BANK
NOTES TO THE CONSOLIDATED FINANCIAL STATEMENTS
For the years ended December 31, 2012 and 2011
3. Summary of significant accounting policies – continued
b) Basis of consolidation
These consolidated financial statements comprise the financial statements of The Saudi Investment Bank and its subsidiaries, Alistithmar for Financial Securities and Brokerage Company, SAIB BNP Paribas Asset Management Company, and Saudi Investment Real Estate Company. The financial statements of the subsidiaries are prepared for the same reporting year as that of the Bank, using consistent accounting policies. Changes are made to the accounting policies of the subsidiaries when necessary to align with the accounting policies of the Group.
Subsidiaries are all entities over which the Bank has the power to govern the financial and operating policies, so as to obtain benefits from its activities, generally accompanying a shareholding of more than one half of the voting rights. Subsidiaries are consolidated from the date on which control is transferred to the Bank and cease to be consolidated from the date on which the control is transferred from the Bank. The results of subsidiaries acquired or disposed of during the year are included in the consolidated income statement from the date of the acquisition or up to the date of disposal, as appropriate. The consolidated financial statements have been prepared using uniform accounting policies and valuation methods for like transactions and other events in similar circumstances.
Non-controlling interests represent the portion of net income / (loss) and net assets not owned, directly or indirectly, by the Bank in SAIB BNP Paribas Asset Management Company and are presented separately in the consolidated income statement and within equity in the consolidated statement of financial position, separately from the Bank’s shareholders’ equity. Any losses applicable to the non-controlling interests in a subsidiary are allocated to the non-controlling interests even if doing so causes the non-controlling interests to have a deficit balance.
Acquisitions of non-controlling interests are accounted for using the Bank extension method, whereby, the difference between the consideration and the fair value of the share of the net assets acquired is recognised as goodwill. The Group elects on a transaction-by-transaction basis whether to measure non-controlling interest at its fair value, or at its proportionate share of the recognised amount of the identifiable net assets, at the acquisition date.
The Group manages assets held in investment entities on behalf of investors. The financial statements of these entities are not included in these consolidated financial statements except when the Group controls the entity. Material inter-group balances and any material income and expenses arising from inter-group transactions, are eliminated in preparing these consolidated financial statements.
c) Investments in associates
Investments in associates are initially recognised at cost and subsequently accounted for under the equity method of accounting. Associates are enterprises in which the Bank generally holds approximately 20% to 50% of the voting power or over which it has significant influence and which is neither a subsidiary nor a joint venture. Investments in associates are carried in the consolidated statement of financial position at cost, plus post-acquisition changes in the Bank’s share of the net assets of the associates, less any impairment. Share in earnings of associates include the changes in the Bank’s share of the net assets of the associates.
39Financial Statements & Auditors’ Report

Notes to the Consolidated Financial Statementsfor the years ended December 31, 2012 and 2011
11
THE SAUDI INVESTMENT BANK
NOTES TO THE CONSOLIDATED FINANCIAL STATEMENTS
For the years ended December 31, 2012 and 2011
3. Summary of significant accounting policies – continued
d) Settlement date accounting
All regular-way purchases and sales of financial assets are recognized and derecognized on the settlement date, i.e. the date the asset is delivered to the counterparty. When settlement date accounting is applied, the Bank accounts for any change in fair value between the trade date and the settlement date in the same way as it accounts for the acquired asset. Regular-way purchases or sales, are purchases or sales of financial assets that require delivery of assets within the time frame generally established by regulation or convention in the market place.
e) Derivative financial instruments and hedge accounting
Derivative financial instruments, including foreign exchange contracts, commission rate futures, forward rate agreements, currency and commission rate swaps, currency and commission rate options (both written and purchased) are measured at fair value. All derivatives are carried at their fair value as assets where the fair value is positive and as liabilities where the fair value is negative. Fair values are obtained by reference to quoted market prices, discounted cash flow models, and pricing models as appropriate.
The treatment of changes in their fair value depends on their classification into the following categories:
(i) Derivatives held for trading
Any changes in the fair value of derivatives that are held for trading purposes are taken directly to the consolidated income statement and disclosed in trading income. Derivatives held for trading also include those derivatives which do not qualify for hedge accounting including embedded derivatives.
(ii) Embedded derivatives
Derivatives embedded in other financial instruments are treated as separate derivatives and are recorded at fair value if their economic characteristics and risks are not closely related to those of the host contract, and the host contract is not itself held for trading or designated at fair value through profit or loss. The embedded derivatives separated from the host are carried at estimated net fair value with changes in fair value recognised in the consolidated income statement.
(iii) Hedge accounting
The Group designates certain derivatives as hedging instruments in qualifying hedging relationships as described below.
For the purpose of hedge accounting, hedges are classified into two categories: (a) fair value hedges which hedge the exposure to changes in the fair value of a recognised asset or liability, (or assets or liabilities in the case of portfolio hedging), or an unrecognised firm commitment or an identified portion of such an asset, liability or firm commitment, that is attributable to a particular risk and could affect the reported net gain or loss; and (b) cash flow hedges which hedge exposure to variability in cash flows that are either attributable to a particular risk associated with a recognised asset or liability or to a highly probable forecasted transaction that will affect the reported net gain or loss.
In order to qualify for hedge accounting, the hedge should be expected to be highly effective, i.e. the changes in fair value or cash flows of the hedging instrument should effectively offset corresponding changes in the hedged item, and should be reliably measurable. At inception of the hedge, the risk management objective and strategy are documented including the identification of the hedging instrument, the related hedged item, the nature of the risk being hedged, and how the Bank will assess the effectiveness of the hedging relationship. Subsequently, the hedge is required to be assessed and determined to be an effective hedge on an ongoing basis.
40 Financial Statements & Auditors’ Report
Notes to the Consolidated Financial Statementsfor the years ended December 31, 2012 and 2011
12
THE SAUDI INVESTMENT BANK
NOTES TO THE CONSOLIDATED FINANCIAL STATEMENTS
For the years ended December 31, 2012 and 2011
3. Summary of significant accounting policies – continued
iii (a) Fair Value Hedges
When a derivative is designated as the hedging instrument in a hedge of the change in fair value of a recognized asset or liability or a firm commitment that could affect the consolidated income statement, any gain or loss from re-measuring the hedging instruments to fair value is recognised immediately in the consolidated income statement together with the change in the fair value of the hedged item attributable to the hedged risk.
For hedged items measured at amortised cost, where the fair value hedge of a commission bearing financial instrument ceases to meet the criteria for hedge accounting or is sold, exercised or terminated, the difference between the carrying value of the hedged item on termination and the face value is amortised over the remaining term of the original hedge using the effective interest rate method. If the hedged item is derecognised, the unamortised fair value adjustment is recognised immediately in the consolidated income statement.
iii (b) Cash flow hedges
When a derivative is designated as the hedging instrument in a hedge of a variability of cash flows attributable to a particular risk associated with a recognised asset or a liability or a highly probable forecasted transaction that could affect the consolidated income statement, the portion of the gain or loss on the hedging instrument that is determined to be an effective portion is recognised directly in other comprehensive income and the ineffective portion, if any, is recognised in the consolidated income statement. For cash flow hedges affecting future transactions, the gains or losses recognised in other reserves, are transferred to the consolidated income statement in the same period in which the hedged transaction affects the consolidated income statement.
Where the hedged transaction results in the recognition of a non- financial asset or a non-financial liability, then at the time such asset or liability is recognised, the associated gains or losses that had previously been recognised directly in other comprehensive income are included in the initial measurement of the acquisition cost or other carrying amount of such asset or liability.
When the hedging instrument is expired or sold, terminated or exercised, or no longer qualifies for hedge accounting, or the transaction is no longer expected to occur or the Bank revokes the designation, any cumulative gain or loss on the cash flow hedging instrument that was recognised in other comprehensive income is retained until the forecasted transaction occurs. Where the hedged transaction is no longer expected to occur, the net cumulative gain or loss recognised in other comprehensive income is transferred to the consolidated statement of income.
f) Foreign currencies
Transactions in foreign currencies are translated into Saudi Arabian Riyals at the exchange rates prevailing at transaction dates. Monetary assets and liabilities at year-end, denominated in foreign currencies, are translated into Saudi Arabian Riyals at the exchange rates prevailing at the consolidated statement of financial position date. The foreign currency gain or loss on monetary items is the difference between amortised cost in the functional currency at the beginning of the year adjusted for effective interest and payments during the year, and the amortised cost in foreign currency translated at the exchange rate at the end of the year. All differences arising on non-trading activities are taken to other non operating income in the consolidated income statement, with the exception of differences of foreign currency borrowings that provide an effective hedge against a net investment in foreign entity. Foreign exchange gains or losses on translation of monetary assets and liabilities denominated in foreign currencies are recognised in the consolidated income statement except for differences arising on the retranslation of available for sale equity instruments. Translation gains or losses on non-monetary items carried at fair value are included as part of the fair value adjustment either in the consolidated income statement or in other comprehensive income depending on the underlying financial asset.
41Financial Statements & Auditors’ Report

Notes to the Consolidated Financial Statementsfor the years ended December 31, 2012 and 2011
13
THE SAUDI INVESTMENT BANK
NOTES TO THE CONSOLIDATED FINANCIAL STATEMENTS
For the years ended December 31, 2012 and 2011
3. Summary of significant accounting policies – continued
Non-monetary items that are measured in terms of historical cost in a foreign currency are translated using the exchange rates as of the dates of the initial transactions. Non-monetary items measured at fair value in a foreign currency are translated using the exchange rates at the date when the fair value is determined.
g) Offsetting financial instruments
Financial assets and liabilities are offset and are reported net in the consolidated statement of financial position when there is a legally enforceable right to set off the recognized amounts and when the Bank intends to settle on a net basis, or to realize the asset and settle the liability simultaneously.
h) Revenue / expense recognition
Special commission income and expense - Special commission income and expense for all special commission-bearing financial instruments, are recognised in the consolidated income statement on the effective yield basis. The effective yield is the rate that discounts the estimated future cash payments and receipts through the expected life of the financial asset or liability (or, where appropriate, a shorter period) to the carrying amount of the financial asset or liability. When calculating the effective interest rate, the Group estimates future cash flows considering all contractual terms of the financial instrument but not future credit losses. The carrying amount of a financial asset or financial liability is adjusted if the Group revises its estimates of payments or receipts. The adjusted carrying amount is calculated based on the original effective special commission rate and the change in carrying amount is recorded as special commission income or expense. If the recorded value of a financial asset or a group of similar financial assets has been reduced due to an impairment loss, special commission income continues to be recognised using the original effective yield rate applied to the new carrying amount.
The calculation of the effective yield takes into account all contractual terms of the financial instruments (prepayment, options etc.) and includes all fees and points paid or transaction costs, and discounts or premiums that are an integral part of the effective special commission rate. Transaction costs are incremental costs that are directly attributable to the acquisition, issue or disposal of a financial asset or liability. Exchange income / Loss - Exchange income/loss is recognised when earned/incurred. Fee income from Banking services that are not an integral component of the effective yield calculation on a financial asset or liability are generally recognised on an accrual basis when the related service is provided. Portfolio and other management advisory and service fees are recognized based on the applicable service contracts, usually on a time-proportionate basis. Fees received on asset management, custody services and other similar services that are provided over an extended period of time, are recognized over the period when the service is being provided. When a loan commitment is not expected to result in the draw-down of a loan, loan commitment fees are recognised on a straight-line basis over the commitment period. Other fees and commission expense relate mainly to transaction and service fees, and are recognised as expenses as the services are received. Dividend income - Dividend income is recognised when the right to receive payment is established. Net trading income - Results arising from trading activities include all gains and losses from changes in fair value and related special commission income or expense and dividends for financial assets and financial liabilities held for trading and foreign exchange differences. This includes any ineffectiveness recorded in hedging transactions.
42 Financial Statements & Auditors’ Report

Notes to the Consolidated Financial Statementsfor the years ended December 31, 2012 and 2011
14
THE SAUDI INVESTMENT BANK
NOTES TO THE CONSOLIDATED FINANCIAL STATEMENTS
For the years ended December 31, 2012 and 2011
3. Summary of significant accounting policies – continued i) Repurchase agreements and reverse repurchase agreements
Underlying assets sold with a simultaneous commitment to repurchase at a specified future date (repurchase agreements) continue to be recognized in the consolidated statement of financial position and are measured in accordance with related accounting policies for investments held as available for sale. The counter-party liability for amounts received under these agreements is included in “Due to banks and other financial institutions” or “Customer deposits”, as appropriate. The difference between the sale and repurchase price is treated as special commission expense and accrued over the life of the repurchase agreement on an effective yield basis.
Underlying assets purchased with a corresponding commitment to resell at a specified future date (reverse repurchase agreements) are not recognised in the consolidated statement of financial position, as the Bank does not obtain control over the underlying assets. Amounts paid under these agreements are included in “Cash and balances with SAMA”. The difference between the purchase and resale price is treated as special commission income and accrued over the life of the reverse repo agreement on an effective yield basis.
j) Investments
All investment securities are initially recorded at fair value, including any incremental direct transaction cost. Premiums are amortized and discounts are accreted using the effective yield basis and are taken to special commission income.
For securities traded in organized financial markets, fair value is determined by reference to exchange quoted market bid prices at the close of business on the consolidated statement of financial position date. Fair value of managed assets and investments in mutual funds are determined by reference to declared net asset values.
For securities where there is no quoted market price, a reasonable estimate of the fair value is determined by reference to the current market value of another instrument which is substantially the same, or is based on the expected cash flows of the security. Where the fair values cannot be derived from active markets, they are determined using a variety of valuation techniques that include the use of mathematical models. The input to these models is taken from observable markets where possible, but where this is not feasible, a degree of judgement is required in establishing fair values.
Following initial recognition, subsequent transfers between the various classes of investments are permissible only if certain conditions are met. The subsequent period-end reporting values for each class of investment are determined on the basis as set out in the following paragraphs. (i) Available for sale
Available for sale investments are those equity and debt securities intended to be held for an unspecified period of time, which may be sold in response to needs for liquidity or changes in special commission rates, exchange rates, or equity prices.
Investments which are classified as “available for sale” are subsequently measured at fair value. For an available for sale investment where the fair value has not been hedged, any gain or loss arising from a change in its fair value is recognised in other comprehensive income. On de-recognition, any cumulative gain or loss previously recognized in other comprehensive income is included in the consolidated income statement.
43Financial Statements & Auditors’ Report

Notes to the Consolidated Financial Statementsfor the years ended December 31, 2012 and 2011
15
THE SAUDI INVESTMENT BANK
NOTES TO THE CONSOLIDATED FINANCIAL STATEMENTS
For the years ended December 31, 2012 and 2011
3. Summary of significant accounting policies – continued
Special commission income is recognised in the consolidated income statement on an effective yield basis. Dividend income is recognised in the consolidated income statement when the right to receive payment is established. Foreign exchange gains or losses on available for sale debt security investments are recognised in the consolidated income statement.
A security held as available for sale may be reclassified to “other investments held at amortized cost” if it other wise would have met the definition of “other investments held at amortized cost” and if the Group has the intention and ability to hold that financial asset for the foreseeable future or until maturity. (ii) Held to maturity
Investments having fixed or determinable payments and a fixed maturity and for which the Bank has a positive intention and ability to hold to maturity are classified as held to maturity. Held to maturity investments are subsequently measured at amortised cost, less provision for impairment in value. Amortised cost is calculated by taking into account any discount or premium on acquisition using an effective yield basis. Any gain or loss on such investments is recognised in the consolidated income statement when the investment is derecognised or impaired. Investments classified as held to maturity cannot ordinarily be sold or reclassified without impacting the Bank’s ability to use this classification and cannot be designated as a hedged item with respect to commission rate or prepayment risk, reflecting the longer-term nature of these investments. However, sales or reclassifications in any of the following circumstances would not impact the Group’s ability to use this classification:
Sales or reclassifications that are so close to maturity that the changes in market rate of commission would not have a significant effect on the fair value;
Sales or reclassifications after the Group has collected substantially all of the assets original principal; and
Sales or reclassifications attributable to non-recurring isolated events beyond the Group’s control that could not have been reasonably anticipated.
k) Loans and advances
Loans and advances are non-derivative financial assets originated or acquired by the Bank with fixed or determinable payments. Loans and advances are recognized when cash is advanced to borrowers. They are derecognized when either borrowers repay their obligations, or the loans are sold or written off, or substantially all the risks and rewards of ownership are transferred.
All loans and advances are initially measured at fair value, including acquisition charges associated with the loans and advances.
Loans and advances originated or acquired by the Bank that are not quoted in an active market and for which fair value has not been hedged, are stated at amortized cost less any amount written off and allowance for credit losses.
l) Impairment of financial assets
An assessment is made at each reporting date to determine whether there is objective evidence that a financial asset or group of financial assets may be impaired at the reporting date. If such evidence exists, the estimated recoverable amount of that asset is determined and any impairment loss, based on the net present value of future anticipated cash flows, is recognised for changes in its carrying amount.
44 Financial Statements & Auditors’ Report

Notes to the Consolidated Financial Statementsfor the years ended December 31, 2012 and 2011
16
THE SAUDI INVESTMENT BANK
NOTES TO THE CONSOLIDATED FINANCIAL STATEMENTS
For the years ended December 31, 2012 and 2011
3. Summary of significant accounting policies – continued
When a financial asset is uncollectible, it is written off against the related provision for impairment either directly by a charge to the consolidated income statement or through a provision for impairment account. Financial assets are written off only in circumstances where effectively all possible means of recovery have been exhausted, and the amount of the loss has been determined.
Once a financial asset has been written down to its estimated recoverable amount, special commission income is thereafter recognised based on the rate of special commission that was used to discount the future cash flows for the purpose of measuring the recoverable amount.
If, in a subsequent period, the amount of the impairment loss decreases and the decrease can be related objectively to an event occurring after the impairment was recognized (such as an improvement in the debtor’s credit rating), the previously recognized impairment loss is reversed by adjusting the allowance account. The amount of the reversal is recognized in the consolidated income statement and included in the relevant impairment charges.
Loans and advances whose terms have been renegotiated are no longer considered to be past due and are treated as new loans. Restructuring policies and practices are based on indicators or criteria which indicate that payment will most likely continue. The loans and advances continue to be subject to an individual or collective impairment assessment, calculated using the loan’s original effective yield rate.
(i) Impairment of financial assets held at amortized cost
A financial asset or group of financial assets are classified as impaired when there is objective evidence of impairment as a result of one or more events that occurred after the initial recognition of the financial asset or group of financial assets and where a loss event has an impact on the estimated future cash flows of the financial asset or group of financial assets that can be reliably estimated.
A specific provision for credit losses due to impairment of a loan or any other financial asset held at amortized cost is established if there is objective evidence that the Bank will not be able to collect all amounts due. The amount of the specific provision is the difference between the carrying amount and the estimated recoverable amount. The estimated recoverable amount is the present value of expected cash flows, including amounts estimated to be recoverable from guarantees and collateral, discounted based on the original effective yield rate.
In addition to specific provisions for credit losses, provisions for collective impairment are made on a portfolio basis. The collective impairment provisions are estimated based on various factors including credit ratings allocated to a borrower or group of borrowers, the experience the Bank has had in dealing with a borrower or group of borrowers and available historical default information. Historical loss experience is adjusted on the basis of current observable data to reflect the effects of current conditions.
For financial assets at amortised cost, the carrying amount of the asset is adjusted either directly or through the use of an allowance account and the amount of the adjustment is included in the consolidated income statement.
(ii) Impairment of available for sale financial assets For debt instruments classified as available for sale, the Bank assesses individually whether there is objective evidence of impairment based on the same criteria as financial assets carried at amortized cost. However, the amount recorded for impairment is the cumulative loss measured as the difference between the amortized cost and the current fair value, less any impairment loss on that investment previously recognized in the consolidated income statement. If, in a subsequent period, the fair value of a debt instrument increases and the increase can be objectively related to a credit event occurring after the impairment loss was recognized in the consolidated income statement, the impairment loss is reversed and recognised in the consolidated income statement.
45Financial Statements & Auditors’ Report

Notes to the Consolidated Financial Statementsfor the years ended December 31, 2012 and 2011
17
THE SAUDI INVESTMENT BANK
NOTES TO THE CONSOLIDATED FINANCIAL STATEMENTS
For the years ended December 31, 2012 and 2011
3. Summary of significant accounting policies – continued
For equity investments held as available for sale, a significant or prolonged decline in fair value below its cost represents objective evidence of impairment. The impairment loss cannot be reversed through the consolidated income statement as long as the asset continues to be recognized i.e. any increase in fair value after impairment has been recorded can only be recognized in other comprehensive income. On derecognition, any cumulative gain or loss previously recognized in other comprehensive income is included in the consolidated income statement.
m) Impairment of non-financial assets
The Bank assesses at each reporting date whether there is an indication that an asset may be impaired. If any indication exists, or when annual impairment testing for an asset is required, the Bank estimates the asset’s recoverable amount. An asset’s recoverable amount is the higher of an asset’s or cash-generating units (CGU) fair value less costs to sell and its value in use. Where the carrying amount of an asset or CGU exceeds its recoverable amount, the asset is considered impaired and is written down to its recoverable amount. In assessing value in use, the estimated future cash flows are discounted to their present value using a discount rate that reflects current market assessments of the time value of money and the risks specific to the asset. In determining an asset’s fair value less costs to sell, an appropriate valuation model is used. These model calculations are corroborated by valuation multiples, or other available fair value indicators.
For assets excluding goodwill, an assessment is made at each reporting date as to whether there is any indication that previously recognised impairment losses may no longer exist or may have decreased. If such indications exist, the Bank estimates the asset’s or CGU’s recoverable amount. A previously recognised impairment loss is reversed only if there has been a change in the assumptions used to determine the asset’s recoverable amount since the last impairment loss was recognised. The reversal is limited so that the carrying amount of the asset does not exceed its recoverable amount, nor exceeds the carrying amount that would have been determined, net of depreciation, had no impairment loss been recognised for the asset in prior years. Such reversals are recognised in the consolidated income statement.
Impairment losses relating to goodwill are not reversed in future periods.
n) Other real estate
The Bank, in the ordinary course of business, acquires certain real estate against settlement of loans and advances. Such real estate is considered as held for sale and is initially stated at the lower of net realizable value of the loans and advances and the current fair value of the related properties, less any costs to sell, if material. No depreciation is charged on such real estate. Rental income from other real estate is recognized in the consolidated income statement.
Subsequent to initial recognition, any subsequent write down to fair value, less costs to sell, are charged to the consolidated income statement. Any subsequent gain in the fair value less costs to sell of these assets to the extent this does not exceed the cumulative write down is recognized together with any gain/ loss on disposal in the consolidated income statement.
o) Property and equipment
Property and equipment is stated at cost and presented net of accumulated depreciation. Freehold land is not depreciated. The cost of other property and equipment is depreciated using the straight-line method over the estimated useful lives of the assets as follows:
Buildings 20 years Leasehold improvements Over the lease period or 5 years, whichever is shorter Furniture, equipment and vehicles 4 to 5 years
The assets’ residual values and useful lives are reviewed, and adjusted if appropriate, at each reporting date. Gains and losses on disposals are determined by comparing proceeds with carrying amounts. These are included in the consolidated income statement.
46 Financial Statements & Auditors’ Report

Notes to the Consolidated Financial Statementsfor the years ended December 31, 2012 and 2011
18
THE SAUDI INVESTMENT BANK
NOTES TO THE CONSOLIDATED FINANCIAL STATEMENTS
For the years ended December 31, 2012 and 2011
3. Summary of significant accounting policies – continued
p) Financial liabilities
All money market deposits, customer deposits, term loans, and other debt securities in issue are initially recognized at fair value less transaction costs.
Subsequently all commission-bearing financial liabilities other than those where fair values have been hedged are measured at amortised cost. Amortized cost is calculated by taking into account any discount or premium. Premiums are amortized and discounts accreted on an effective yield basis to maturity and taken to special commission expense.
Financial liabilities in an effective fair value hedge relationship are adjusted for fair value changes to the extent of the risk being hedged. The resulting gain or loss is recognized in the consolidated income statement. For financial liabilities carried at amortized cost, any gain or loss is recognized in the consolidated income statement when derecognized.
q) Financial guarantees
In the ordinary course of business, the Bank gives financial guarantees, consisting of letters of credit, guarantees and acceptances. Financial guarantees are initially recognised in the consolidated financial statements at fair value in other liabilities, being the value of the premium received. Subsequent to initial recognition, the Bank's liability under each guarantee is measured at the higher of the amortized premium and the best estimate of the expenditure required to settle any financial obligations arising as a result of such guarantees. Any increase in the liability relating to a financial guarantee is recognized in the consolidated income statement in impairment charges for credit losses, net. The premium received is recognized in the consolidated income statement in "Fee income from banking services, net” on a straight line basis over the life of the guarantee.
r) Provisions
Provisions are recognized when a reliable estimate can be made by the Bank for a present legal or constructive obligation as a result of past events and it is more likely than not that an outflow of resources will be required to settle the obligation.
s) Accounting for leases
Leases entered into by the Bank as a lessee, are all operating leases. Payments made under operating leases are charged to the consolidated income statement on a straight-line basis over the period of the lease.
When an operating lease is terminated before the lease period has expired, any payment required to be made to the lessor by way of penalty is recognized as an expense in the period in which termination takes place.
t) Cash and cash equivalents
For the purpose of the statement of cash flows, “cash and cash equivalents” are defined as those amounts included in cash and balances with SAMA excluding statutory deposits, and due from banks and other financial institutions with a maturity of ninety days or less from the date of acquisition.
u) Derecognition of financial instruments
A financial asset (or a part of a financial asset, or a part of a group of similar financial assets) is
derecognized, when the contractual rights to receive the cash flows from the financial asset expires.
47Financial Statements & Auditors’ Report

Notes to the Consolidated Financial Statementsfor the years ended December 31, 2012 and 2011
19
THE SAUDI INVESTMENT BANK
NOTES TO THE CONSOLIDATED FINANCIAL STATEMENTS
For the years ended December 31, 2012 and 2011
3. Summary of significant accounting policies – continued
In instances where the Bank is assessed to have transferred a financial asset, the asset is derecognized if the Bank has transferred substantially all the risks and rewards of ownership. Where the Bank has neither transferred nor retained substantially all the risks and rewards of ownership, the financial asset is derecognized only if the Bank has not retained control of the financial asset. The Bank recognizes separately as assets or liabilities any rights and obligations created or retained in the process.
A financial liability (or part of a financial liability) can only be derecognized when it is extinguished, that is when the obligation specified in the contract is either discharged, cancelled or expired.
v) Zakat and income taxes
Zakat and income taxes are considered as liabilities of the Saudi and foreign shareholders,
respectively. Zakat is computed on the Saudi shareholders’ share of equity or net income using the basis defined under the Zakat regulations. Income taxes are computed on the foreign shareholders share of adjusted net income for the year under the income tax regulations.
Zakat and income tax are not charged to the Bank’s consolidated income statement and are
deducted from dividends paid to the shareholders, or reimbursed by the shareholders.
w) Employees’ incentive plans
The Bank offers to its eligible employees (“Employees”) equity shares in the Bank under an Employee Stock Grant Plan (“the Plan”). This Plan has been approved by SAMA. Under the terms of the plan, employees are granted shares which vest over a four-year period. The cost of the Plan is measured by the value of the shares on the date purchased and recognised over the period in which the service condition is fulfilled using an appropriate valuation model, and ending on the vesting date. Employee share option shares are recorded by the Bank at cost and are presented as a deduction from the equity as adjusted for any transaction costs, dividends and gains or losses on sales of such shares. The Bank has entered into a custody agreement with an independent third party to administer the Plan on behalf of its employees. Under the provisions of the agreement, the Bank, at no point, becomes the legal owner of the underlying shares.
In addition, the Bank grants to its eligible employees other types of security and savings plans that are based on mutual contributions by the Bank and the employees. These contributions are paid to the participating employees at the respective maturity date of each plan.
x) Asset management services
The Bank offers asset management services to its customers, through a subsidiary, which include management of certain investment funds in consultation with professional investment advisors. The Bank’s share of these funds is included in available for sale investments and fees earned are included in fees from banking services, net.
Assets held in trust or in a fiduciary capacity are not treated as assets of the Group and accordingly are not included in the consolidated financial statements.
48 Financial Statements & Auditors’ Report

Notes to the Consolidated Financial Statementsfor the years ended December 31, 2012 and 2011
20
THE SAUDI INVESTMENT BANK
NOTES TO THE CONSOLIDATED FINANCIAL STATEMENTS
For the years ended December 31, 2012 and 2011
3. Summary of significant accounting policies – continued
y) Non-interest based banking products
In addition to conventional banking, the Bank offers to its customers certain non-interest based banking products, which are approved by its Shariah Board. High level definitions of non-interest based products include:
(i) Murabaha - an agreement whereby the Bank sells to a customer a commodity or an asset, which the Bank has purchased and acquired based on a promise received from the customer to buy. The selling price comprises the cost plus an agreed profit margin. (ii) Istisna’a - an agreement between the Bank and a customer whereby the Bank sells to the customer a developed asset according to agreed upon specifications, for an agreed upon price.
(iii) Ijarah - an agreement whereby the Bank, acting as a lessor, purchases or constructs an asset for lease according to the customer request (lessee), based on his promise to lease the asset for an agreed rent and specific period that could end by transferring the ownership of the leased asset to the lessee. All non-special interest based banking products are accounted for in conformity with the accounting policies described in these consolidated financial statements.
4. Cash and balances with SAMA
Cash and balances with SAMA are summarized as follows:
2012 2011 SAR’000 SAR’000
Cash in hand 615,605 472,756 Statutory deposit 1,767,038 1,461,415 Reverse repurchase agreements 4,953,000 6,919,000
Total 7,335,643 8,853,171
In accordance with the Banking Control Law and regulations issued by SAMA, the Bank is required to maintain a statutory deposit with SAMA at stipulated percentages of its demand, savings, time and other deposits, calculated at the end of each month. The statutory deposits with SAMA are not available to finance the Bank’s day to day operations and therefore are not part of cash and cash equivalents.
5. Due from banks and other financial institutions
Due from banks and other financial institutions are summarized as follows:
2012 2011 SAR’000 SAR’000
Current accounts 133,379 89,114 Money market placements 3,698,395 3,947,703
Total 3,831,774 4,036,817
49Financial Statements & Auditors’ Report
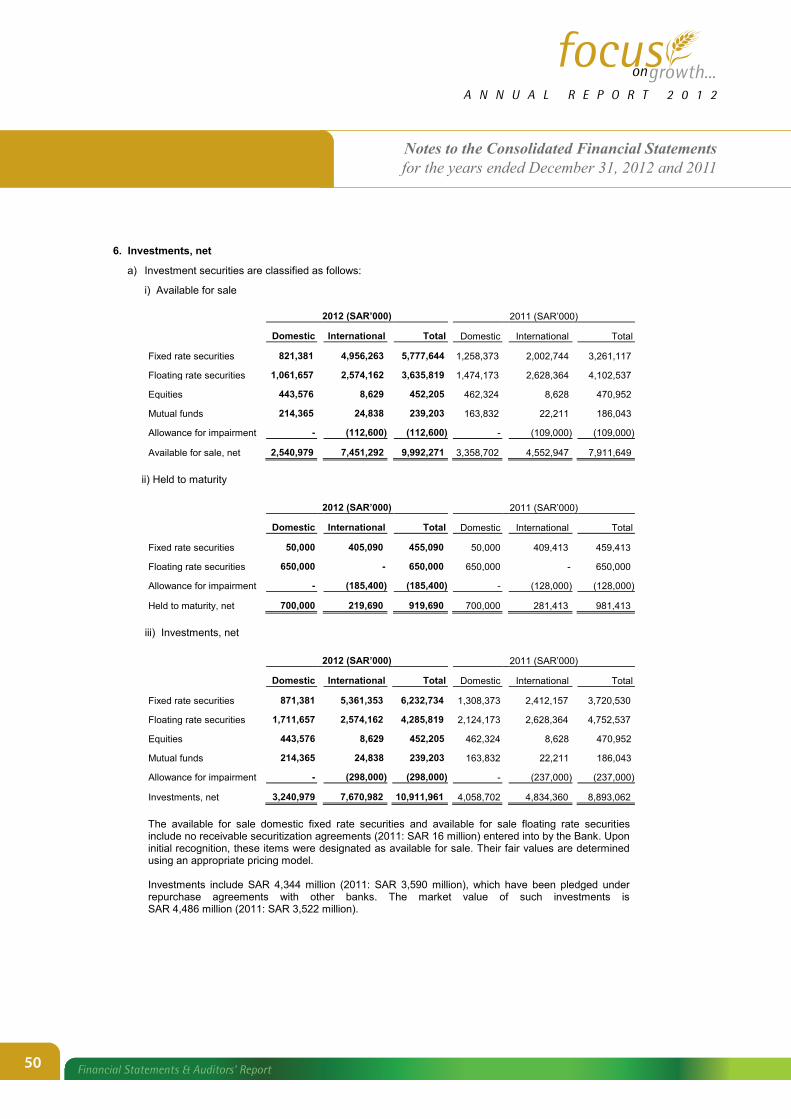
Notes to the Consolidated Financial Statementsfor the years ended December 31, 2012 and 2011
21
THE SAUDI INVESTMENT BANK
NOTES TO THE CONSOLIDATED FINANCIAL STATEMENTS
For the years ended December 31, 2012 and 2011
6. Investments, net
a) Investment securities are classified as follows:
i) Available for sale
2012 (SAR’000) 2011 (SAR‟000)
Domestic International Total Domestic International Total
Fixed rate securities 821,381 4,956,263 5,777,644 1,258,373 2,002,744 3,261,117
Floating rate securities 1,061,657 2,574,162 3,635,819 1,474,173 2,628,364 4,102,537
Equities 443,576 8,629 452,205 462,324 8,628 470,952
Mutual funds 214,365 24,838 239,203 163,832 22,211 186,043
Allowance for impairment - (112,600) (112,600) - (109,000) (109,000)
Available for sale, net 2,540,979 7,451,292 9,992,271 3,358,702 4,552,947 7,911,649
ii) Held to maturity
2012 (SAR’000) 2011 (SAR‟000)
Domestic International Total Domestic International Total
Fixed rate securities 50,000 405,090 455,090 50,000 409,413 459,413
Floating rate securities 650,000 - 650,000 650,000 - 650,000
Allowance for impairment - (185,400) (185,400) - (128,000) (128,000)
Held to maturity, net 700,000 219,690 919,690 700,000 281,413 981,413
iii) Investments, net
2012 (SAR’000) 2011 (SAR‟000)
Domestic International Total Domestic International Total
Fixed rate securities 871,381 5,361,353 6,232,734 1,308,373 2,412,157 3,720,530
Floating rate securities 1,711,657 2,574,162 4,285,819 2,124,173 2,628,364 4,752,537
Equities 443,576 8,629 452,205 462,324 8,628 470,952
Mutual funds 214,365 24,838 239,203 163,832 22,211 186,043
Allowance for impairment - (298,000) (298,000) - (237,000) (237,000)
Investments, net 3,240,979 7,670,982 10,911,961 4,058,702 4,834,360 8,893,062
The available for sale domestic fixed rate securities and available for sale floating rate securities include no receivable securitization agreements (2011: SAR 16 million) entered into by the Bank. Upon initial recognition, these items were designated as available for sale. Their fair values are determined using an appropriate pricing model. Investments include SAR 4,344 million (2011: SAR 3,590 million), which have been pledged under repurchase agreements with other banks. The market value of such investments is SAR 4,486 million (2011: SAR 3,522 million).
50 Financial Statements & Auditors’ Report
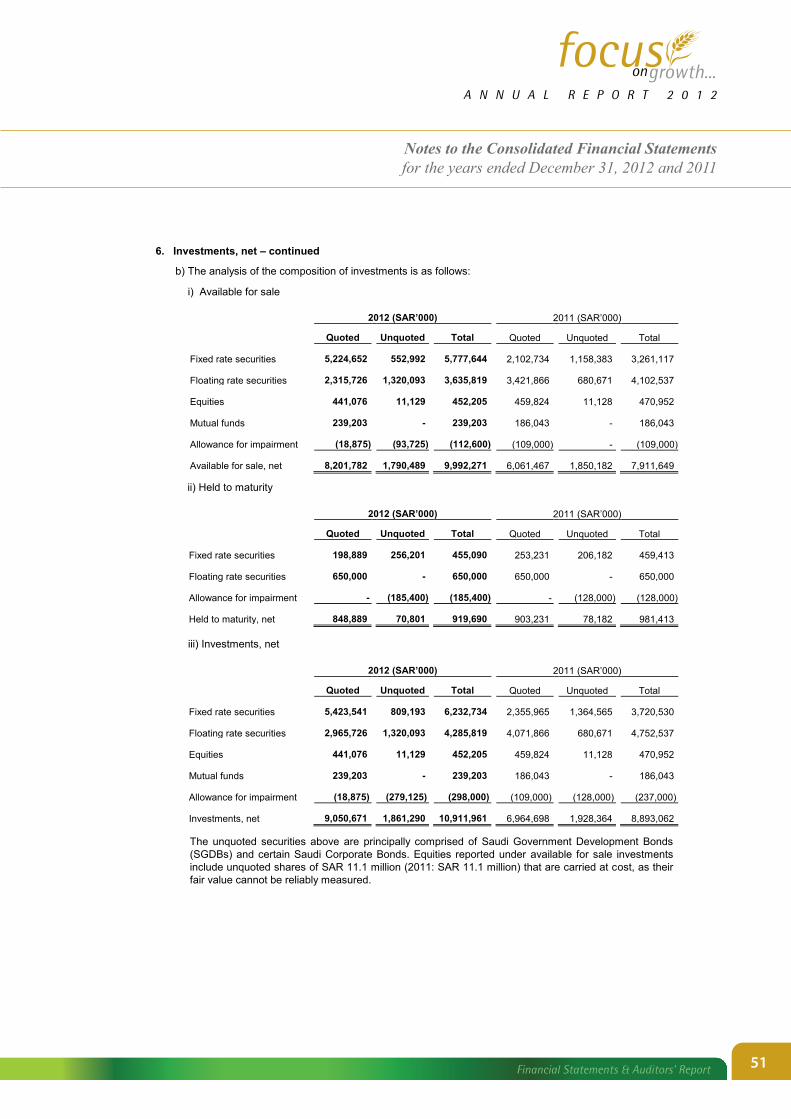
Notes to the Consolidated Financial Statementsfor the years ended December 31, 2012 and 2011
22
THE SAUDI INVESTMENT BANK
NOTES TO THE CONSOLIDATED FINANCIAL STATEMENTS
For the years ended December 31, 2012 and 2011
6. Investments, net – continued
b) The analysis of the composition of investments is as follows:
i) Available for sale
2012 (SAR’000) 2011 (SAR’000)
Quoted Unquoted Total Quoted Unquoted Total
Fixed rate securities 5,224,652 552,992 5,777,644 2,102,734 1,158,383 3,261,117
Floating rate securities 2,315,726 1,320,093 3,635,819 3,421,866 680,671 4,102,537
Equities 441,076 11,129 452,205 459,824 11,128 470,952
Mutual funds 239,203 - 239,203 186,043 - 186,043
Allowance for impairment (18,875) (93,725) (112,600) (109,000) - (109,000)
Available for sale, net 8,201,782 1,790,489 9,992,271 6,061,467 1,850,182 7,911,649
ii) Held to maturity
2012 (SAR’000) 2011 (SAR’000)
Quoted Unquoted Total Quoted Unquoted Total
Fixed rate securities 198,889 256,201 455,090 253,231 206,182 459,413
Floating rate securities 650,000 - 650,000 650,000 - 650,000
Allowance for impairment - (185,400) (185,400) - (128,000) (128,000)
Held to maturity, net 848,889 70,801 919,690 903,231 78,182 981,413 iii) Investments, net
2012 (SAR’000) 2011 (SAR’000)
Quoted Unquoted Total Quoted Unquoted Total
Fixed rate securities 5,423,541 809,193 6,232,734 2,355,965 1,364,565 3,720,530
Floating rate securities 2,965,726 1,320,093 4,285,819 4,071,866 680,671 4,752,537
Equities 441,076 11,129 452,205 459,824 11,128 470,952
Mutual funds 239,203 - 239,203 186,043 - 186,043
Allowance for impairment (18,875) (279,125) (298,000) (109,000) (128,000) (237,000)
Investments, net 9,050,671 1,861,290 10,911,961 6,964,698 1,928,364 8,893,062
The unquoted securities above are principally comprised of Saudi Government Development Bonds (SGDBs) and certain Saudi Corporate Bonds. Equities reported under available for sale investments include unquoted shares of SAR 11.1 million (2011: SAR 11.1 million) that are carried at cost, as their fair value cannot be reliably measured.
51Financial Statements & Auditors’ Report

Notes to the Consolidated Financial Statementsfor the years ended December 31, 2012 and 2011
23
THE SAUDI INVESTMENT BANK
NOTES TO THE CONSOLIDATED FINANCIAL STATEMENTS
For the years ended December 31, 2012 and 2011
6. Investments, net – continued
c) The analysis of unrealized gains and losses and fair values of held to maturity investments is as follows:
2012 (SAR’000) 2011 (SAR’000) Gross Gross Gross Gross Carrying Unrealized Unrealized Fair Carrying Unrealized Unrealized Fair Value gains losses Value Value gains losses Value
Fixed rate securities 269,690 18,556 18,642 269,604 331,413 21,790 76,949 276,254
Floating rate securities 650,000 325 - 650,325 650,000 14,625 - 664,625
Total 919,690 18,881 18,642 919,929 981,413 36,415 76,949 940,879
d) The analysis of investments, net by counterparty is as follows:
2012 2011 SAR’000 SAR’000
Government and quasi-Government 1,376,045 1,998,377 Corporate 6,063,568 2,942,222 Banks and other financial institutions 3,472,348 3,952,463 Total 10,911,961 8,893,062
e) The credit risk exposure of investments is as follows:
2012 2011 SAR’000 SAR’000
Investment grade 9,239,270 7,485,491 Non investment grade 276,476 144,077 Unrated 1,396,215 1,263,494
Total 10,911,961 8,893,062
f) The movement of allowance for impairment on investments is as follows:
2012 2011 SAR’000 SAR’000
Balance at the beginning of the year 237,000 160,000 Provided during the year 69,000 85,000 Amounts written - off during the year (8,000) (8,000) Balance at the end of the year 298,000 237,000
52 Financial Statements & Auditors’ Report
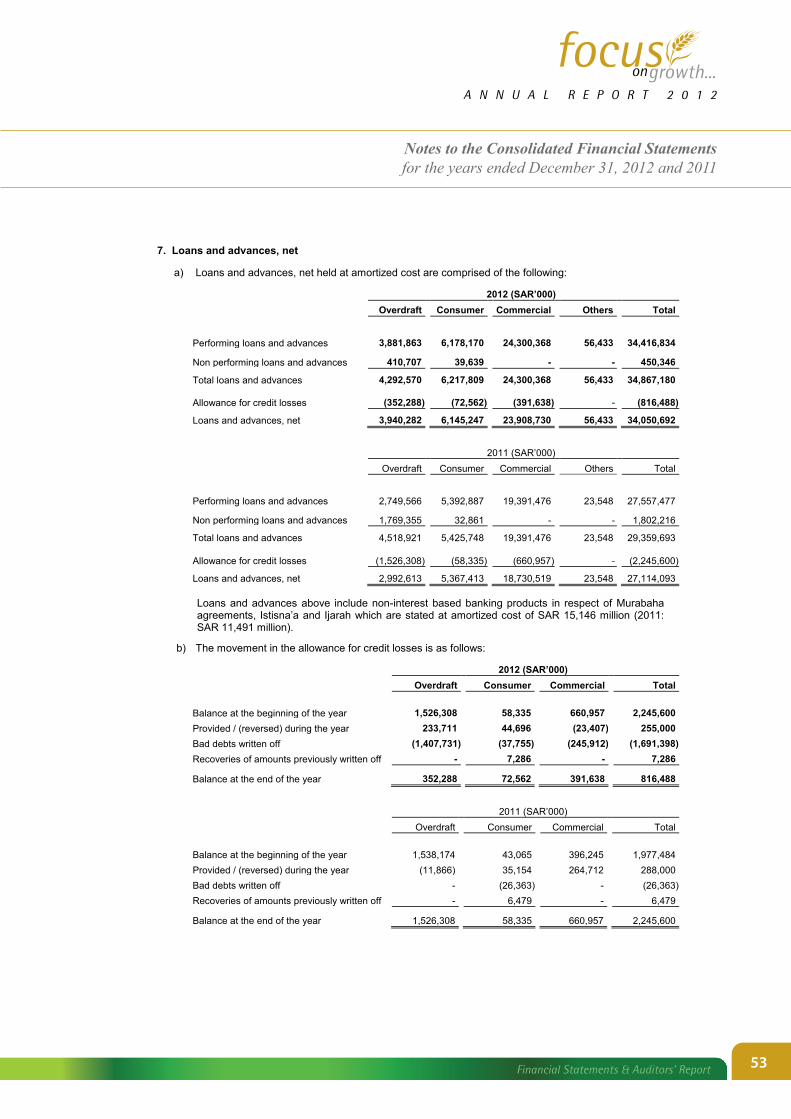
Notes to the Consolidated Financial Statementsfor the years ended December 31, 2012 and 2011
24
THE SAUDI INVESTMENT BANK
NOTES TO THE CONSOLIDATED FINANCIAL STATEMENTS
For the years ended December 31, 2012 and 2011
7. Loans and advances, net
a) Loans and advances, net held at amortized cost are comprised of the following:
2012 (SAR’000) Overdraft Consumer Commercial Others Total
Performing loans and advances 3,881,863 6,178,170 24,300,368 56,433 34,416,834
Non performing loans and advances 410,707 39,639 - - 450,346
Total loans and advances 4,292,570 6,217,809 24,300,368 56,433 34,867,180
Allowance for credit losses (352,288) (72,562) (391,638) - (816,488)
Loans and advances, net 3,940,282 6,145,247 23,908,730 56,433 34,050,692
2011 (SAR’000) Overdraft Consumer Commercial Others Total
Performing loans and advances 2,749,566 5,392,887 19,391,476 23,548 27,557,477
Non performing loans and advances 1,769,355 32,861 - - 1,802,216
Total loans and advances 4,518,921 5,425,748 19,391,476 23,548 29,359,693
Allowance for credit losses (1,526,308) (58,335) (660,957) - (2,245,600)
Loans and advances, net 2,992,613 5,367,413 18,730,519 23,548 27,114,093 Loans and advances above include non-interest based banking products in respect of Murabaha agreements, Istisna’a and Ijarah which are stated at amortized cost of SAR 15,146 million (2011: SAR 11,491 million).
b) The movement in the allowance for credit losses is as follows:
2012 (SAR’000) Overdraft Consumer Commercial Total Balance at the beginning of the year 1,526,308 58,335 660,957 2,245,600 Provided / (reversed) during the year 233,711 44,696 (23,407) 255,000 Bad debts written off (1,407,731) (37,755) (245,912) (1,691,398) Recoveries of amounts previously written off - 7,286 - 7,286
Balance at the end of the year 352,288 72,562 391,638
816,488
2011 (SAR’000) Overdraft Consumer Commercial Total Balance at the beginning of the year 1,538,174 43,065 396,245 1,977,484 Provided / (reversed) during the year (11,866) 35,154 264,712 288,000 Bad debts written off - (26,363) - (26,363) Recoveries of amounts previously written off - 6,479 - 6,479
Balance at the end of the year 1,526,308 58,335 660,957
2,245,600
53Financial Statements & Auditors’ Report

Notes to the Consolidated Financial Statementsfor the years ended December 31, 2012 and 2011
25
THE SAUDI INVESTMENT BANK
NOTES TO THE CONSOLIDATED FINANCIAL STATEMENTS
For the years ended December 31, 2012 and 2011
7. Loans and advances, net – continued
c) The credit quality of loans and advances is summarized as follows: (i) Neither past due nor impaired loans and advances:
2012
SAR’000 2011
SAR’000 Excellent 649,054 453,209
Strong 12,112,855 9,436,502
Average 8,996,429 5,167,973
Acceptable 5,363,146 5,478,069
Marginal 693,624 1,016,835
Watch 44,015 56,419
Unrated 6,113,006 5,340,444
Total 33,972,129 26,949,451
The loans and advances that are neither past due nor impaired are described as follows: Excellent - leader in a stable industry. Better than peers’ financials and cash flow. Access to financial markets under normal market conditions. Strong - strong market and financial position with a history of successful performance but certain exceptions exist. Financial fundamentals are still better than industry benchmarks. The entity would have access to financial markets under normal conditions. Average - moderate degree of stability with industry or company specific risk factors. Financial fundamentals are sound within industry benchmarks. Access to financial markets is limited and the entity is susceptible to cyclical changes. Acceptable - minor weaknesses in industry or company specific risk factors. Some financial fundamentals are inferior to industry benchmarks. Alternative financing could be available but this might be limited to private and institutional sources only. Marginal - unfavorable industry or company specific risk factors exist. Operating performance and financials are marginal. Alternative sources of finance are unlikely. No new business can be contemplated with this category. Watch - unfavorable industry or company specific risk factors exist. Risk of non-payment is high. Financial fundamentals are well below industry benchmarks and alternative sources of finance are extremely limited.
Unrated – unrated loans and advances consists of consumer loans with no past due balances. (ii) Past due but not impaired loans and advances:
2012 (SAR’000)
Overdraft and
commercial Consumer Total From 1 day to 30 days 173,184 12,216 185,400 From 31 days to 90 days 9,807 11,232 21,039 From 91 days to 180 days 29,215 36,827 66,042 More than 180 days 169,413 2,811 172,224
Total 381,619 63,086 444,705
54 Financial Statements & Auditors’ Report

Notes to the Consolidated Financial Statementsfor the years ended December 31, 2012 and 2011
26
THE SAUDI INVESTMENT BANK
NOTES TO THE CONSOLIDATED FINANCIAL STATEMENTS
For the years ended December 31, 2012 and 2011
7. Loans and advances, net – continued
2011 (SAR’000)
Overdraft and
commercial Consumer Total From 1 day to 30 days 694 13,474 14,168 From 31 days to 90 days 3,481 5,983 9,464 From 91 days to 180 days 2,756 13,562 16,318 More than 180 days 548,778 19,298 568,076
Total 555,709 52,317 608,026
(iii) The economic sector risk concentrations for loans and advances and allowance for credit losses are
as follows:
2012 (SAR’000) Allowance Loans and Non for advances,
Performing performing credit losses net
Government and quasi-Government 374,484 - (3,745) 370,739 Banks and other financial services 1,314,467 - (13,145) 1,301,322 Agriculture and fishing 20,417 - (204) 20,213 Manufacturing 4,332,764 31,216 (98,028) 4,265,952 Mining and quarrying 496,890 - (4,969) 491,921 Building and construction 2,859,837 250 (29,025) 2,831,062 Commerce 10,772,057 2,918 (113,266) 10,661,709 Transportation and communication 51,481 - (515) 50,966 Services 1,503,846 11,871 (42,400) 1,473,317 Consumer loans 6,178,170 39,639 (72,562) 6,145,247 Other 6,512,421 364,452 (438,629) 6,438,244 Total 34,416,834 450,346 (816,488) 34,050,692
2011 (SAR’000) Allowance Loans and Non for advances,
Performing performing credit losses net
Government and quasi-Government 86,922 - (869) 86,053
Banks and other financial services 1,361,174 - (13,612) 1,347,562
Manufacturing 2,348,882 31,216 (58,266) 2,321,832
Mining and quarrying 260,573 - (2,606) 257,967
Building and construction 1,721,833 250 (17,485) 1,704,598
Commerce 7,502,298 1,642,230 (1,912,002) 7,232,526
Electricity, water, gas and health services 200,424 - (2,004) 198,420
Transportation and communication 59,473 - (595) 58,878
Services 3,309,976 18,894 (62,670) 3,266,200
Consumer loans 5,392,887 32,861 (58,335) 5,367,413
Other 5,313,035 76,765 (117,156) 5,272,644 Total 27,557,477 1,802,216 (2,245,600) 27,114,093
55Financial Statements & Auditors’ Report
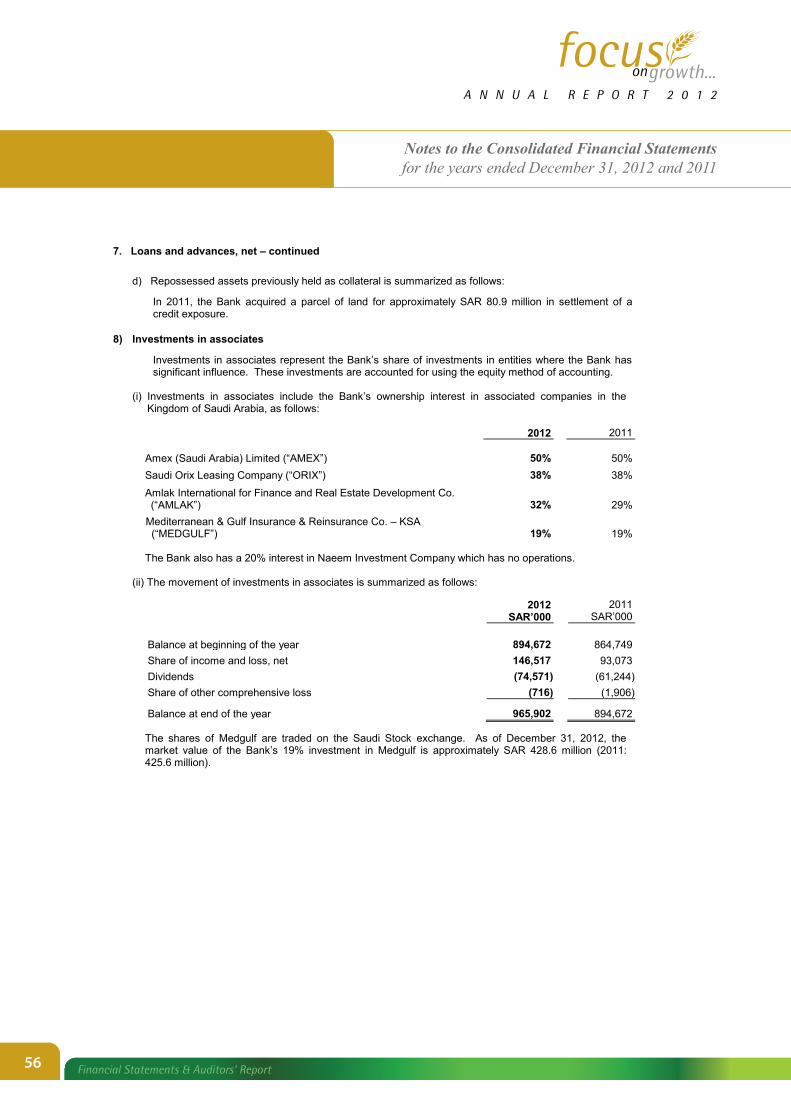
Notes to the Consolidated Financial Statementsfor the years ended December 31, 2012 and 2011
27
THE SAUDI INVESTMENT BANK
NOTES TO THE CONSOLIDATED FINANCIAL STATEMENTS
For the years ended December 31, 2012 and 2011
7. Loans and advances, net – continued
d) Repossessed assets previously held as collateral is summarized as follows:
In 2011, the Bank acquired a parcel of land for approximately SAR 80.9 million in settlement of a credit exposure.
8) Investments in associates
Investments in associates represent the Bank’s share of investments in entities where the Bank has significant influence. These investments are accounted for using the equity method of accounting.
(i) Investments in associates include the Bank’s ownership interest in associated companies in the Kingdom of Saudi Arabia, as follows:
2012 2011
Amex (Saudi Arabia) Limited (“AMEX”) 50% 50% Saudi Orix Leasing Company (“ORIX”) 38% 38% Amlak International for Finance and Real Estate Development Co. (“AMLAK”) 32% 29%
Mediterranean & Gulf Insurance & Reinsurance Co. – KSA (“MEDGULF”) 19% 19%
The Bank also has a 20% interest in Naeem Investment Company which has no operations.
(ii) The movement of investments in associates is summarized as follows:
2012 2011 SAR’000 SAR’000
Balance at beginning of the year 894,672 864,749 Share of income and loss, net 146,517 93,073 Dividends (74,571) (61,244) Share of other comprehensive loss (716) (1,906)
Balance at end of the year 965,902
894,672 The shares of Medgulf are traded on the Saudi Stock exchange. As of December 31, 2012, the market value of the Bank’s 19% investment in Medgulf is approximately SAR 428.6 million (2011: 425.6 million).
56 Financial Statements & Auditors’ Report

Notes to the Consolidated Financial Statementsfor the years ended December 31, 2012 and 2011
28
THE SAUDI INVESTMENT BANK
NOTES TO THE CONSOLIDATED FINANCIAL STATEMENTS
For the years ended December 31, 2012 and 2011
8. Investment in associates - continued
(iii) The Bank’s share of the associates’ financial statements is summarized below:
2012 (SAR’000)
MEDGULF AMEX ORIX
AMLAK
Total assets 218,661 151,827 622,650 435,942
Total liabilities 15,296 77,406 440,628 132,707
Total equity 203,365 74,421 182,022 303,235
Total income 18,175 139,233 69,093 30,973
Total expenses 596 87,083 33,549 14,944 2011 (SAR’000) MEDGULF AMEX ORIX
AMLAK
Total assets 211,888 117,594 471,580 293,409
Total liabilities 9,764 59,700 314,929 44,978
Total equity 202,124 57,894 156,651 248,431
Total income 30,818 117,459 57,732 20,189
Total expenses 542 77,876 27,593 18,307
9. Property and equipment, net
Property and equipment, net is summarized as follows:
2012 and 2011 (SAR’000)
Land and buildings
Leasehold improvements
Furniture,
equipment and vehicles
Total 2012
Total 2011
Cost Balance at beginning of the year 918,028 49,415 351,130 1,318,573 1,094,794 Additions 171 4,595 24,965 29,731 228,850 Disposals - - (3,001) (3,001) (5,071) Balance at end of the year 918,199 54,010 373,094 1,345,303 1,318,573
Accumulated depreciation
Balance at beginning of the year 108,013 36,594 266,649 411,256 346,942 Charge for the year 33,717 4,608 31,716 70,041 64,860 Disposals - - (2,890) (2,890) (546) Balance at end of the year 141,730 41,202 295,475 478,407 411,256 Net book value
As of December 31, 2012 776,469 12,808 77,619 866,896
As of December 31, 2011 810,015 12,821 84,481 907,317
57Financial Statements & Auditors’ Report

Notes to the Consolidated Financial Statementsfor the years ended December 31, 2012 and 2011
29
THE SAUDI INVESTMENT BANK
NOTES TO THE CONSOLIDATED FINANCIAL STATEMENTS
For the years ended December 31, 2012 and 2011
10. Other assets
Other assets are summarized as follows: 2012 2011 SAR’000 SAR’000 Accrued special commission receivable: - Loans and advances 326,925 359,634 - Investments 78,301 39,913 - Banks and other financial institutions 3,327 3,213
Total accrued special commission receivable 408,553 402,760
Positive fair value of derivatives (note 11) 79,695 137,301 Zakat and income tax due from shareholders (note 25) 110,188 110,910 Other real estate 152,836 178,121 Customer receivables 129,124 232,696 Property and equipment pending completion 78,243 56,843 All other assets 145,143 127,819
Total 1,103,782 1,246,450
11. Derivatives In the ordinary course of business, the Bank utilizes the following derivative financial instruments for trading and hedging purposes:
a) Swaps
Swaps are commitments to exchange one set of cash flows for another. For commission rate swaps, counterparties generally exchange fixed and floating rate commission payments in a single currency without exchanging principal. For cross-currency commission rate swaps, principal, fixed and floating commission payments are exchanged in different currencies.
b) Forwards and futures
Forwards and futures are contractual agreements to either buy or sell a specified currency, commodity or financial instrument at a specified price and date in the future. Forwards are customized contracts transacted in the over-the-counter market. Foreign currency and commission rate futures are transacted in standardized amounts on regulated exchanges and changes in futures contract values are settled daily.
c) Forward rate agreements Forward rate agreements are individually negotiated commission rate contracts that call for a cash settlement for the difference between a contracted commission rate and the market rate on a specified future date, on a notional principal for an agreed period of time.
d) Options Options are contractual agreements under which the seller (writer) grants the purchaser (holder) the right, but not the obligation, to either buy or sell at a fixed future date or at any time during a specified period, a specified amount of a currency, commodity or financial instrument at a pre-determined price.
The derivative financial instruments utilized are either held for trading or held for hedging purposes as described below:
58 Financial Statements & Auditors’ Report

Notes to the Consolidated Financial Statementsfor the years ended December 31, 2012 and 2011
30
THE SAUDI INVESTMENT BANK
NOTES TO THE CONSOLIDATED FINANCIAL STATEMENTS
For the years ended December 31, 2012 and 2011
11. Derivatives – continued
a) Held for trading purposes
Most of the Bank’s derivative trading activities relate to sales, positioning and arbitrage. Sales activities involve offering products to customers and banks in order, inter alia, to enable them to transfer, modify or reduce current and future risks. Positioning involves managing market risk positions with the expectation of profiting from favorable movements in prices, rates or indices. Arbitrage involves identifying, with the expectation of profiting from price differentials, between markets or products.
b) Held for hedging purposes
The Bank has adopted a comprehensive system for the measurement and management of risk. The risk management process involves managing the Bank’s exposure to fluctuations in currency and commission rate risks to acceptable levels as determined by the Board of Directors and within the guidelines issued by SAMA.
The Board of Directors has established levels of currency risk by setting limits on counterparty and currency position exposures. Positions are routinely monitored and hedging strategies are used to ensure positions are maintained within the established limits. The Board of Directors has established the level of commission rate risk by setting limits on commission rate gaps for stipulated periods. Asset and liability commission rate gaps are reviewed on a periodic basis and hedging strategies are periodically used to reduce commission rate gap within the established limits. As part of its asset and liability management, the Bank uses derivatives for hedging purposes in order to adjust its own exposure to currency and commission rate risks. This is generally achieved by hedging specific transactions.
The Bank uses forward foreign exchange contracts to hedge against specifically identified currency risks. In addition, the Bank uses commission rate swaps to hedge against the commission rate risk arising from specifically identified fixed commission-rate exposures.
The tables below summarize the positive and negative fair values of derivative financial instruments, together with the notional amounts, analyzed by the term to maturity and monthly average. The notional amounts, which provide an indication of the volumes of the transactions outstanding at the year-end, do not necessarily reflect the amounts of future cash flows involved. These notional amounts, therefore, are neither indicative of the Bank’s exposure to credit risk, which is generally limited to the positive fair value of the derivatives, nor market risk.
The Bank has a put option arising from an existing master agreement entered into by the Bank relating to an associated company. The terms of the agreement give the Bank a put option that is exercisable from 2013 onwards for the remaining term of the agreement. The put option grants the Bank the right to receive a payment in exchange for its shares one year after the option, based on pre-determined formulas included in the agreement. As of December 31, 2012, the estimated fair value of this option is approximately SAR 14 million and has not been included in the table below.
59Financial Statements & Auditors’ Report

Notes to the Consolidated Financial Statementsfor the years ended December 31, 2012 and 2011
31
THE SAUDI INVESTMENT BANK
NOTES TO THE CONSOLIDATED FINANCIAL STATEMENTS
For the years ended December 31, 2012 and 2011
11. Derivatives – continued
c) Derivative financial instruments are summarized as follows: Notional amounts by term to maturity
2012 (SAR’000) Positive
fair value
Negative fair value
Notional amount
Within 3 months
3-12 months
1-5 years
Over 5 years
Monthly average
Held for trading:
Forward foreign exchange contracts 7,617 1,250 1,979,794 1,761,672 218,122 - - 1,290,452
Foreign exchange options 2,542 2,274 513,002 417,920 75,029 20,003 50 216,737
Commission rates swaps 28,138 42,668 730,000 - - 730,000 - 648,796
Held as fair value hedges:
Commission rate swaps 41,398 96,156 2,546,093 - - 2,452,328 93,765 2,262,869 Total
79,695 142,348 5,768,889 2,179,592 293,151 3,202,331 93,815 4,418,854 Notional amounts by term to maturity
2011 (SAR’000)
Positive fair value
Negative fair value
Notional amount
Within 3 months
3-12
months
1-5
years Over 5 years
Monthly average
Held for trading:
Forward foreign exchange contracts 13,822 1,612 1,229,741 865,479 364,195 17 50 1,103,672
Foreign exchange options 7,784 5,205 291,552 194,368 97,184 - - 116,946
Commission rates swaps 19,241 24,637 160,000 - - 160,000 - 93,808
Held as fair value hedges:
Commission rate swaps 96,454 127,946 2,489,640 - - 2,009,608 480,032 1,253,188 Total
137,301 159,400 4,170,933 1,059,847 461,379 2,169,625 480,082 2,567,614
The losses on hedging instruments for fair value hedges were SAR 21.8 million (2011: losses of SAR 38.3 million). The gains on hedged items attributable to hedged risk were SAR 51.6 million (2011: gains of SAR 30.0 million). The net negative fair value of all derivatives is approximately SAR 62.7 million (2011: SAR negative 22.1 million). Approximately 95% (2011: 85%) of the positive fair value of the Bank’s derivatives are entered into with financial institutions, and less than 76% (2011: 76%) of the positive fair value contracts are with any single counterparty at the consolidated statement of financial position date. Derivative activities are mainly carried out under the Bank’s treasury segment.
12. Due to banks and other financial institutions
Due to banks and other financial institutions is summarized as follows: 2012 2011 SAR’000 SAR’000
Current accounts 49,607 34,244 Repurchase agreements 4,066,459 3,037,420 Money market deposits 2,152,979 1,152,508 Total 6,269,045 4,224,172
60 Financial Statements & Auditors’ Report

Notes to the Consolidated Financial Statementsfor the years ended December 31, 2012 and 2011
32
THE SAUDI INVESTMENT BANK
NOTES TO THE CONSOLIDATED FINANCIAL STATEMENTS
For the years ended December 31, 2012 and 2011
13. Customer deposits
Customer deposits are summarized as follows: 2012 2011 SAR’000 SAR’000 Demand 9,517,589 7,394,013 Savings 558,128 929,547 Time 29,868,401 24,221,198 Other 469,453 4,225,734 Total 40,413,571 36,770,492
Time deposits include deposits against sale of securities of SAR Nil million (2011: SAR 400 million) with agreements to repurchase the same at fixed future dates. Other customer deposits include SAR 273 million (2011: SAR 247 million) of margins held for irrevocable commitments. The above amounts include foreign currency deposits (equivalent to Saudi Riyals) as follows:
2012 2011 SAR’000 SAR’000 Demand 379,528 263,871 Savings 104,382 64,498 Time 6,835,356 3,241,058 Other 86,996 2,125,115 Total 7,406,262 5,694,542
14. Other liabilities
Other liabilities are summarized as follows:
2012 2011 SAR’000 SAR’000 Accrued special commission payable
– Banks and other financial institutions 5,822 9,347 – Customer deposits 125,077 90,224 Total accrued special commission payable 130,899 99,571
Negative fair value of derivatives (note 11) 142,348 159,400 End of service and other employee - related benefits 340,497 299,556 Accrued expenses and other reserves 184,678 221,272 Deferred special commission and fee income 148,556 48,192 All other liabilities 58,230 65,631 Total 1,005,208 893,622
15. Term loans
On April 7, 2009, the Bank entered into a three-year term loan facility agreement for an amount of SAR 500 million for general corporate purposes. The facility was repaid in April 2012. On May 30, 2011, the Bank entered into a five-year medium term loan facility agreement for an amount of SAR 1 billion for general corporate purposes. The facility has been fully utilized and is repayable in May 2016. On June 24, 2012, the Bank entered into a five-year medium term loan facility agreement for an amount of SAR 1 billion for general corporate purposes. The facility has been fully utilized and is repayable in September 2017. The term loans bear commission at variable rates. The Bank has an option to effect early repayment of the term loans subject to the terms and conditions of the related agreements. The agreements above include covenants which require maintenance of certain financial ratios and other requirements, with which the Bank is in compliance as of December 31, 2012.
61Financial Statements & Auditors’ Report

Notes to the Consolidated Financial Statementsfor the years ended December 31, 2012 and 2011
33
THE SAUDI INVESTMENT BANK
NOTES TO THE CONSOLIDATED FINANCIAL STATEMENTS
For the years ended December 31, 2012 and 2011
16. Share capital
The authorized, issued and fully paid share capital of the Bank consists of 550 million shares of SAR 10
each. The ownership of the Bank’s share capital is as follows:
2012 2011 SAR’000 % SAR’000 %
Saudi shareholders 4,950,000 90.0 4,950,000 90.0 Foreign shareholders: J.P. Morgan International Finance Limited 412,500 7.5 412,500 7.5 Mizuho Corporate Bank Limited 137,500 2.5 137,500 2.5 5,500,000 100.0 5,500,000 100.0
17. Statutory reserve
In accordance with Saudi Arabian Banking Control Law and the Articles of Association of the Bank, a
minimum of 25% of the annual net income is required to be transferred to a statutory reserve until this reserve equals the paid up capital of the Bank. Accordingly, SAR 228 million has been transferred from 2012 net income (2011: SAR 177 million). The statutory reserve is not available for distribution.
18. Commitments and contingencies
a) Legal proceedings
As of December 31, 2012 there were routine legal proceedings outstanding against the Bank. No provision has been made in most cases as professional legal advice indicates that it is not probable that any significant loss will arise. However, a provision has been made for certain specific cases where management foresees the possibility of an adverse outcome.
b) Capital commitments
As of December 31, 2012, the Bank had capital commitments of SAR 1.6 million (2011: SAR 11.3 million) in respect of construction for new branches and expansion of its head office.
c) Credit related commitments and contingencies
The primary purpose of these instruments is to ensure that funds are available to a customer as required.
Guarantee and standby letters of credit, which represent irrevocable assurances that the Bank will
make payments in the event that a customer cannot meet its obligations to third parties, carry the same credit risk as loans and advances. Cash requirements under guarantees and standby letters of credit are considerably less than the amount of the commitment because the Bank does not generally expect the third party to draw funds under the agreement.
Documentary letters of credit which are written undertakings by the Bank on behalf of a customer
authorizing a third party to draw drafts on the Bank up to a stipulated amount under specific terms and conditions, are generally collateralized by the underlying shipments of goods to which they relate and therefore have significantly less risk.
Acceptances comprise undertakings by the Bank to pay bills of exchange drawn on customers. The Bank expects most acceptances to be presented before being reimbursed by the customers.
62 Financial Statements & Auditors’ Report

Notes to the Consolidated Financial Statementsfor the years ended December 31, 2012 and 2011
34
THE SAUDI INVESTMENT BANK
NOTES TO THE CONSOLIDATED FINANCIAL STATEMENTS
For the years ended December 31, 2012 and 2011
18. Commitments and contingencies - continued
Commitments to extend credit represent the unused portion of authorizations to extend credit,
principally in the form of loans and advances, guarantees and letters of credit. With respect to credit risk on commitments to extend credit, the Bank is potentially exposed to a loss in an amount equal to the total unused commitments. However, the likely amount of loss, which cannot readily be quantified, is expected to be considerably less than the total unused commitment as most commitments to extend credit are contingent upon customers maintaining specific credit standards. The total outstanding commitments to extend credit do not necessarily represent future cash requirements, as many of these commitments could expire or terminate without being funded. i) The contractual maturity structure for the Bank’s commitments and contingencies are as follows:
2012 (SAR’000) Within 3 3-12 1-5 Over 5 months months years years Total Letters of credit 1,043,538 236,670 304,856 - 1,585,064 Letters of guarantee 1,523,001 2,381,142 1,623,587 1,831 5,529,561 Acceptances 325,714 68,589 3,452 - 397,755 Irrevocable commitments to extend credit - - - 282,682 282,682
Total 2,892,253 2,686,401 1,931,895 284,513 7,795,062
2011 (SAR’000) Within 3 3-12 1-5 Over 5 months months years years Total Letters of credit 1,055,960 420,931 8,965 - 1,485,856 Letters of guarantee 741,683 2,126,123 1,487,124 2,939 4,357,869 Acceptances 312,733 181,300 1,478 - 495,511 Irrevocable commitments to extend credit - 360 63,277 46,802 110,439
Total 2,110,376 2,728,714 1,560,844 49,741 6,449,675 The outstanding unused portion of commitments as of December 31, 2012 which can be revoked unilaterally at any time by the Bank, amounts to SAR 17,158 million (2011: SAR 13,549 million).
ii) The analysis of commitments and contingencies by counterparty is as follows:
2012 2011 SAR’000 SAR’000
Government and quasi-Government 4,601,680 3,589,240 Corporate 2,913,305 2,674,755 Banks and other financial institutions 193,437 107,350 Other 86,640 78,330 Total 7,795,062 6,449,675
63Financial Statements & Auditors’ Report

Notes to the Consolidated Financial Statementsfor the years ended December 31, 2012 and 2011
35
THE SAUDI INVESTMENT BANK
NOTES TO THE CONSOLIDATED FINANCIAL STATEMENTS
For the years ended December 31, 2012 and 2011
18. Commitments and contingencies – continued
d) Assets pledged
Securities pledged under repurchase agreements with other banks include corporate, Bank and non-government bonds. Assets pledged as collateral with other financial institutions for security are as follows:
2012 (SAR’000) 2011 (SAR’000) Related
Related
Assets Liabilities Assets Liabilities Available for sale investments 4,137,377 3,861,443 3,383,620 2,837,039 Held to maturity investments 206,124 205,016 206,000 200,381 Total 4,343,501 4,066,459 3,589,620 3,037,420
The pledged assets presented in the above table are those financial assets that may be repledged or resold by counter parties to whom they have been transferred. These transactions are conducted under terms that are usual and customary to standard securities borrowing and lending activities, as well as requirements determined by exchanges on which the Bank acts as an intermediary.
e) Operating lease commitments The future minimum lease payments under non-cancelable operating leases where the Bank is the
lessee are as follows: 2012 2011 SAR’000 SAR’000 Less than 1 year 27,349 25,293 1 to 5 years 74,386 64,943 Over 5 years 18,906 18,927 Total 120,641 109,163
19. Special commission income and expense
Special commission income and expense is summarized as follows:
2012 2011 SAR’000 SAR’000 Special commission income: Available for sale investments 215,701 150,075 Held to maturity investments 31,057 38,000 Total investments 246,758 188,075 Loans and advances 1,282,257 1,326,686 Due from banks and other financial institutions 61,801 34,312 Total 1,590,816 1,549,073
Special commission expense: Customer deposits 276,538 252,145 Due to banks and other financial institutions 46,266 53,452 Term loans 26,079 17,020 Total 348,883 322,617
64 Financial Statements & Auditors’ Report

Notes to the Consolidated Financial Statementsfor the years ended December 31, 2012 and 2011
36
THE SAUDI INVESTMENT BANK
NOTES TO THE CONSOLIDATED FINANCIAL STATEMENTS
For the years ended December 31, 2012 and 2011
20. Fee income from banking services, net
Fee income from banking services, net is summarized as follows:
2012 2011 SAR’000 SAR’000 Fee income: - Share trading and fund management 94,499 78,291 - Trade finance 73,586 64,617 - Corporate and retail finance 128,356 134,975 - Other banking services 40,358 47,732 Total fee income 336,799 325,615 Fee expense: - Custodial services 21,247 14,336 - Other banking services 445 456 Total fee expense 21,692 14,792
Fee income from banking services, net 315,107 310,823
21. Dividend income
Dividend income is summarized as follows:
2012 2011 SAR’000 SAR’000 Dividends received from available for sale investments 16,281 15,295
22. Gains on non-trading investments, net
Gains on non-trading investments, net are summarized as follows:
2012 2011 SAR’000 SAR’000 Gains 20,624 16,992 Impairment recoveries 8,000 8,000 Losses (7,752) (12,749) 20,872 12,243
65Financial Statements & Auditors’ Report

Notes to the Consolidated Financial Statementsfor the years ended December 31, 2012 and 2011
37
THE SAUDI INVESTMENT BANK
NOTES TO THE CONSOLIDATED FINANCIAL STATEMENTS
For the years ended December 31, 2012 and 2011
23. Compensation and related governance and practices
As required by SAMA, the following table summarizes the Bank’s employee categories defined in accordance with SAMA’s rules on compensation practices. It includes the total amounts of fixed and variable compensation paid to employees, and the forms of such payments, and also includes the variable and other compensation accrued, and other employee benefits and related expenses incurred during the years ended December 31, 2012 and 2011.
2012 (SAR’000)
Category Number of Fixed Variable Compensation Employees Compensation Cash Shares Total Senior executives requiring
SAMA no objection 15 31,080 9,545 2,470 12,015 Employees engaged in risk
taking activities 92 38,999 6,663 1,566 8,229 Employees engaged in
control functions 151 32,218 6,289 1,062 7,351
Other employees 906 142,477 20,840 3,189 24,029
Outsourced employees 89 10,398 1,729 129 1,858
Totals 1,253 255,172 45,066 8,416 53,482 Variable and other compensation accrued 63,588
Other employee benefits and related expenses 43,071 Total salaries and employee related expenses 361,831
2011 (SAR’000)
Category Number of Fixed Variable Compensation Employees Compensation Cash Shares Total Senior executives requiring
SAMA no objection 16 29,903 9,653 1,955 11,608 Employees engaged in risk
taking activities 77 32,320 7,265 957 8,222 Employees engaged in
control functions 130 28,349 7,851 697 8,548
Other employees 775 123,113 28,758 1,885 30,643
Outsourced employees 73 7,937 2,232 67 2,299
Totals 1,071 221,622 55,759 5,561 61,320 Variable and other compensation accrued 61,687
Other employee benefits and related expenses 88,842 Total salaries and employee related expenses 372,151
66 Financial Statements & Auditors’ Report
Notes to the Consolidated Financial Statementsfor the years ended December 31, 2012 and 2011
38
THE SAUDI INVESTMENT BANK
NOTES TO THE CONSOLIDATED FINANCIAL STATEMENTS
For the years ended December 31, 2012 and 2011
23. Compensation and related governance and practices - continued
The Board of Directors of the Bank has established a Nomination and Remuneration Committee (the Committee) which is comprised of four board members. The Committee is primarily responsible for recommending appointments to membership of the Board of Directors and key executives of the Bank in compliance with the Bank’s Corporate Governance Guidelines, completing annual reviews for the requirements of suitable skills and independence for membership of the Bank’s Board of Directors, reviewing the structure of the Board of Directors, establishing policies for the compensation and remuneration of members of the Board of Director’s, and overseeing the Bank’s employee compensation system’s design. The Committee is also responsible to recommend to the Board of Directors the approval of the Bank’s Compensation Policy and any amendments thereto, to ensure the Bank’s remuneration policies are in compliance with SAMA guidelines on compensation, to periodically review the Bank’s remuneration and compensation policy, to evaluate practices by which compensation is paid, and to determine the performance bonuses for the Bank’s employees based on the risk adjusted profit of the Bank. The Bank’s Remuneration and Compensation Policy is designed to attract, retain and motivate high potential employees. Employees participate in various variable pay arrangements. Discretionary variable pay as well as fixed pay reviews are dependent on the achievement of objectives. The Balanced Scorecard concept is used and objectives have typically been categorized into four segments including financial, customer, process, and people. Financial and non-financial metrics are then used to measure performance against the objectives, which include profitability, expense control, customer satisfaction, employee development, lending guidelines, internal controls, and procedures. Effective risk management is also emphasized to maintain a strong and secure operating platform. A Risk Appetite Policy has been established and compliance thereto is key to all remuneration decisions including variable pay arrangements. In addition to the above, the Bank’s employees are encouraged to participate in employee share savings and incentive schemes. Certain employees are also covered under a Key Employee Stock Option Grant Plan. The Bank’s subsidiaries have adopted a similar approach to remuneration and compensation practices as described above, including policies within a framework of prudent risk management. The total amount of compensation paid to key management for the year ended December 31, 2012 was SAR 43.1 million (2011: SAR 41.5 million). The post employment benefits accrued or paid to key management for the year ended December 31, 2012 was SAR 5.8 million (2011: SAR 2.6 million).
24. Basic and diluted earnings per share
Basic and diluted earnings per share for the years ended December 31, 2012 and 2011 is calculated by dividing the net income for the year attributable to the equity holders of the Bank by 550.0 million shares (see Note 16). During 2010, the Board of Directors proposed a bonus share issue of 100,000,000 shares of SAR 10 per share, or one bonus share for each four and one-half shares outstanding. The Bonus share issue was approved at the shareholders’ extraordinary general assembly meeting held on Rabi’ll 21, 1432H (corresponding to March 26, 2011). Accordingly, the total number of issued and outstanding shares increased in 2011 to 550,000,000.
67Financial Statements & Auditors’ Report
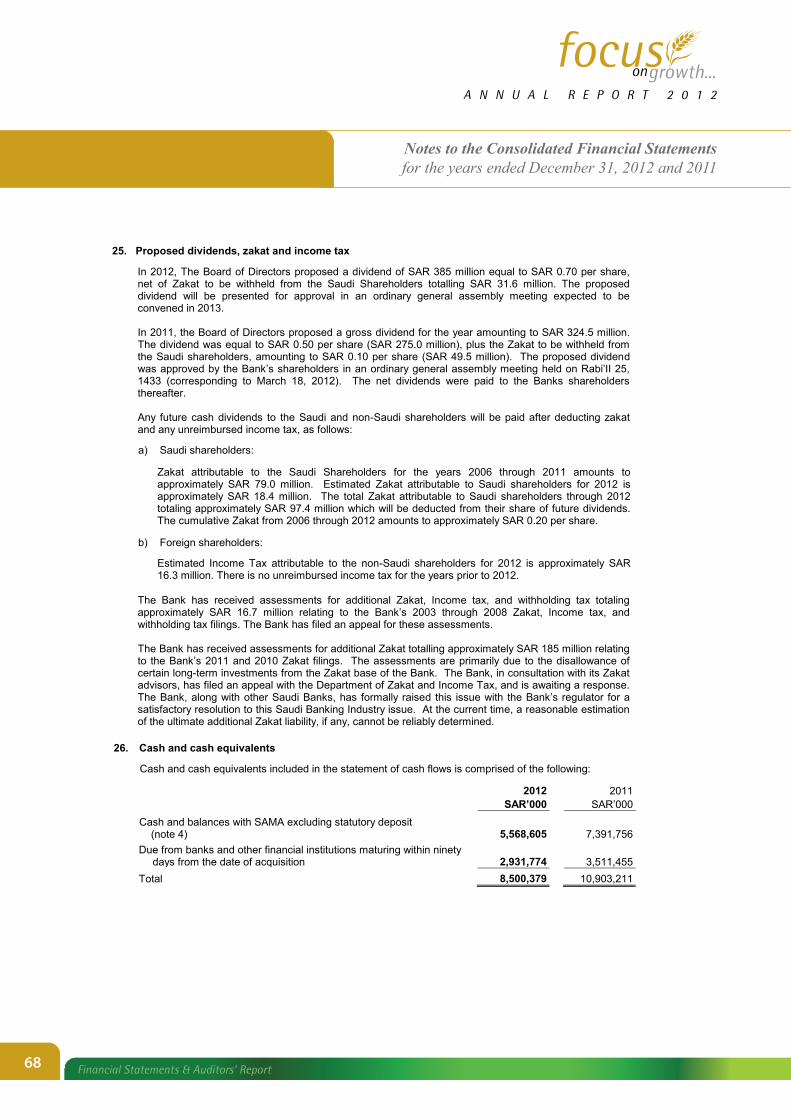
Notes to the Consolidated Financial Statementsfor the years ended December 31, 2012 and 2011
39
THE SAUDI INVESTMENT BANK
NOTES TO THE CONSOLIDATED FINANCIAL STATEMENTS
For the years ended December 31, 2012 and 2011
25. Proposed dividends, zakat and income tax
In 2012, The Board of Directors proposed a dividend of SAR 385 million equal to SAR 0.70 per share, net of Zakat to be withheld from the Saudi Shareholders totalling SAR 31.6 million. The proposed dividend will be presented for approval in an ordinary general assembly meeting expected to be convened in 2013. In 2011, the Board of Directors proposed a gross dividend for the year amounting to SAR 324.5 million. The dividend was equal to SAR 0.50 per share (SAR 275.0 million), plus the Zakat to be withheld from the Saudi shareholders, amounting to SAR 0.10 per share (SAR 49.5 million). The proposed dividend was approved by the Bank’s shareholders in an ordinary general assembly meeting held on Rabi’II 25, 1433 (corresponding to March 18, 2012). The net dividends were paid to the Banks shareholders thereafter. Any future cash dividends to the Saudi and non-Saudi shareholders will be paid after deducting zakat and any unreimbursed income tax, as follows:
a) Saudi shareholders:
Zakat attributable to the Saudi Shareholders for the years 2006 through 2011 amounts to approximately SAR 79.0 million. Estimated Zakat attributable to Saudi shareholders for 2012 is approximately SAR 18.4 million. The total Zakat attributable to Saudi shareholders through 2012 totaling approximately SAR 97.4 million which will be deducted from their share of future dividends. The cumulative Zakat from 2006 through 2012 amounts to approximately SAR 0.20 per share.
b) Foreign shareholders: Estimated Income Tax attributable to the non-Saudi shareholders for 2012 is approximately SAR 16.3 million. There is no unreimbursed income tax for the years prior to 2012.
The Bank has received assessments for additional Zakat, Income tax, and withholding tax totaling approximately SAR 16.7 million relating to the Bank’s 2003 through 2008 Zakat, Income tax, and withholding tax filings. The Bank has filed an appeal for these assessments. The Bank has received assessments for additional Zakat totalling approximately SAR 185 million relating to the Bank’s 2011 and 2010 Zakat filings. The assessments are primarily due to the disallowance of certain long-term investments from the Zakat base of the Bank. The Bank, in consultation with its Zakat advisors, has filed an appeal with the Department of Zakat and Income Tax, and is awaiting a response. The Bank, along with other Saudi Banks, has formally raised this issue with the Bank’s regulator for a satisfactory resolution to this Saudi Banking Industry issue. At the current time, a reasonable estimation of the ultimate additional Zakat liability, if any, cannot be reliably determined.
26. Cash and cash equivalents
Cash and cash equivalents included in the statement of cash flows is comprised of the following:
2012 2011 SAR’000 SAR’000
Cash and balances with SAMA excluding statutory deposit (note 4) 5,568,605 7,391,756 Due from banks and other financial institutions maturing within ninety
days from the date of acquisition 2,931,774 3,511,455 Total 8,500,379 10,903,211
68 Financial Statements & Auditors’ Report

Notes to the Consolidated Financial Statementsfor the years ended December 31, 2012 and 2011
40
THE SAUDI INVESTMENT BANK
NOTES TO THE CONSOLIDATED FINANCIAL STATEMENTS
For the years ended December 31, 2012 and 2011
27. Business segments
Operating segments are identified on the basis of internal reports about components of the Bank that are regularly reviewed by the Bank’s Board of Directors in its function as the Chief Decision Maker in order to allocate resources to the segments and to assess their performance. Transactions between the operating segments are on normal commercial terms and conditions. The revenue from external parties reported to the Board is measured in a manner consistent with that in the consolidated income statement. There are no material items of income or expense between the operating segments. Segment assets and liabilities are comprised of operating assets and liabilities.
The Bank’s primary business is conducted in the Kingdom of Saudi Arabia. The Bank’s reportable segments are as follows:
Retail banking
Loans, deposits, and other credit products for individuals and small to medium-sized businesses.
Corporate banking
Loans, deposits and other credit products for corporate and institutional customers. Treasury
Money market, investments, and other treasury services.
Asset management and brokerage
Dealing, managing, advising and custody of securities services.
Commission is charged to operating segments based on Funds Transfer Price rates. All of the segment revenue is from external customers. a) The segment information provided to the Bank’s Board of Directors which includes the reportable
segments for the Bank’s total assets and liabilities of December 31, 2012 and 2011, its total operating income, total operating expenses, and net income for the years then ended, are as follows:
69Financial Statements & Auditors’ Report
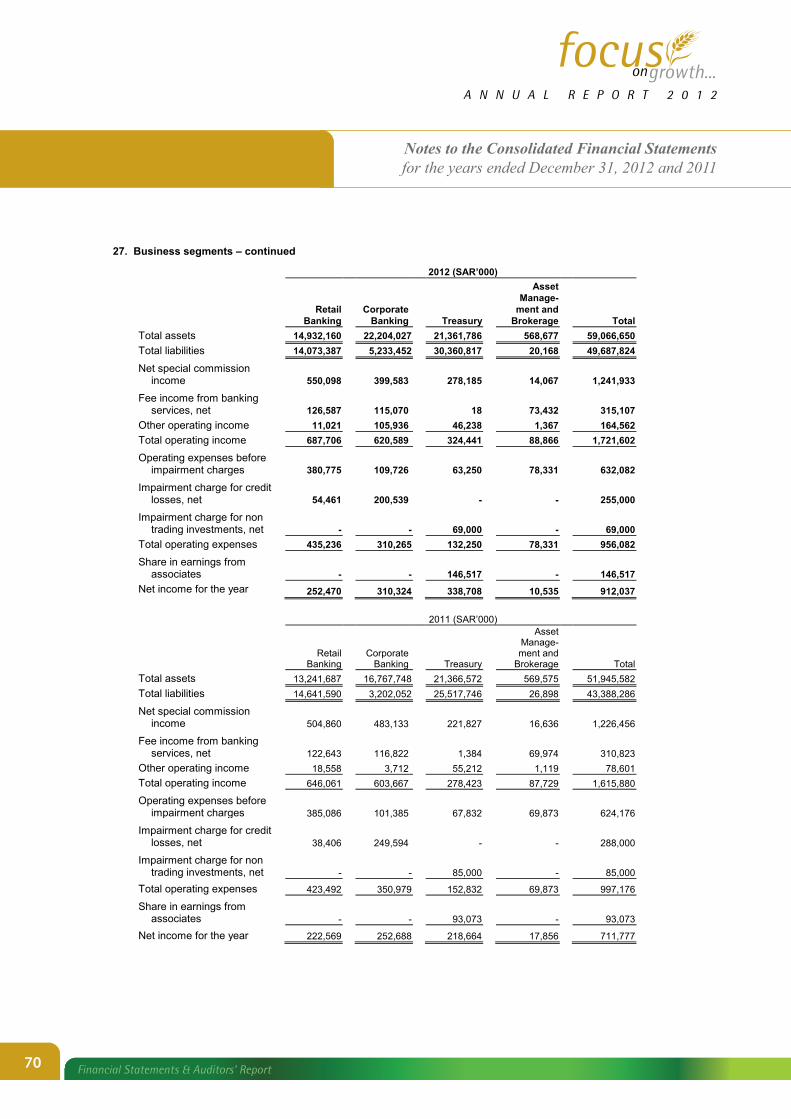
Notes to the Consolidated Financial Statementsfor the years ended December 31, 2012 and 2011
41
THE SAUDI INVESTMENT BANK
NOTES TO THE CONSOLIDATED FINANCIAL STATEMENTS
For the years ended December 31, 2012 and 2011
27. Business segments – continued
2012 (SAR’000)
Retail
Banking Corporate
Banking Treasury
Asset Manage-
ment and Brokerage Total
Total assets 14,932,160 22,204,027 21,361,786 568,677 59,066,650 Total liabilities 14,073,387 5,233,452 30,360,817 20,168 49,687,824
Net special commission income 550,098 399,583 278,185 14,067 1,241,933
Fee income from banking services, net 126,587 115,070 18 73,432 315,107
Other operating income 11,021 105,936 46,238 1,367 164,562 Total operating income 687,706 620,589 324,441 88,866 1,721,602
Operating expenses before impairment charges 380,775 109,726 63,250 78,331 632,082
Impairment charge for credit losses, net 54,461 200,539 - - 255,000
Impairment charge for non trading investments, net - - 69,000 - 69,000
Total operating expenses 435,236 310,265 132,250 78,331 956,082
Share in earnings from associates - - 146,517 - 146,517
Net income for the year 252,470 310,324 338,708 10,535 912,037
2011 (SAR’000)
Retail
Banking Corporate
Banking Treasury
Asset Manage-ment and
Brokerage Total Total assets 13,241,687 16,767,748 21,366,572 569,575 51,945,582 Total liabilities 14,641,590 3,202,052 25,517,746 26,898 43,388,286
Net special commission income 504,860 483,133 221,827 16,636 1,226,456
Fee income from banking services, net 122,643 116,822 1,384 69,974 310,823
Other operating income 18,558 3,712 55,212 1,119 78,601 Total operating income 646,061 603,667 278,423 87,729 1,615,880
Operating expenses before impairment charges 385,086 101,385 67,832 69,873 624,176
Impairment charge for credit losses, net 38,406 249,594 - - 288,000
Impairment charge for non trading investments, net - - 85,000 - 85,000
Total operating expenses 423,492 350,979 152,832 69,873 997,176
Share in earnings from associates - - 93,073 - 93,073
Net income for the year 222,569 252,688 218,664 17,856 711,777
70 Financial Statements & Auditors’ Report

Notes to the Consolidated Financial Statementsfor the years ended December 31, 2012 and 2011
42
THE SAUDI INVESTMENT BANK
NOTES TO THE CONSOLIDATED FINANCIAL STATEMENTS
For the years ended December 31, 2012 and 2011
27. Business segments – continued
b) The Bank’s credit exposure by business segment is as follows:
2012 (SAR’000) Asset Retail Corporate Management Banking Banking Treasury and Brokerage Total
Statement of consolidated financial position assets 11,922,454 21,672,334 15,633,970 531,571 49,760,329
Commitments and contingencies 2,092,765 1,300,437 86,346 - 3,479,548
Derivatives - - 126,360 - 126,360
2011 (SAR’000) Asset Retail Corporate Management Banking Banking Treasury and Brokerage Total
Statement of consolidated financial position assets 10,196,683 15,867,980 14,291,369 582,612 40,938,644
Commitments and contingencies 1,689,792 1,232,364 49,460 - 2,971,616
Derivatives - - 112,833 - 112,833
Credit exposure comprises the carrying value of consolidated statement of financial position assets excluding cash and balances with SAMA, property and equipment, and other assets. The credit equivalent value of commitments, contingencies and derivatives are included in credit exposure.
28. Credit risk
The Bank manages exposure to credit risk, which is the risk that one party to a financial instrument will fail to discharge an obligation and cause the other party to incur a financial loss. Credit exposures arise principally in lending activities that lead to loans and advances, and investment activities. There is also credit risk in off-statement of consolidated financial position financial instruments, such as loan commitments. The Bank assesses the probability of default of counterparties using internal rating tools. The Bank also uses the external ratings of major rating agencies, where available. The Bank attempts to control credit risk by monitoring credit exposures, limiting transactions with specific counterparties, and continually assessing the creditworthiness of counterparties. The Bank’s risk management policies are designed to identify and to set appropriate risk limits and to monitor the risks and adherence to limits. Actual exposures against limits are routinely monitored. In certain cases, the Bank may also close out transactions or assign them to other counterparties to mitigate credit risk. The Bank’s credit risk for derivatives represents the potential cost to replace the derivative contracts if counterparties fail to fulfill their obligation, and to control the level of credit risk taken. The Bank assesses counterparties using the same techniques as for its lending activities. Concentrations of credit risk arise when a number of counterparties are engaged in similar business activities, or activities in the same geographic region, or have similar economic features that would cause their ability to meet contractual obligations to be similarly affected by changes in economic, political or other conditions. Concentrations of credit risk indicate the relative sensitivity of the Bank’s performance to developments affecting a particular industry or geographical location.
71Financial Statements & Auditors’ Report

Notes to the Consolidated Financial Statementsfor the years ended December 31, 2012 and 2011
43
THE SAUDI INVESTMENT BANK
NOTES TO THE CONSOLIDATED FINANCIAL STATEMENTS
For the years ended December 31, 2012 and 2011
28. Credit risk – continued
The Bank seeks to manage its credit risk exposure through diversification of lending activities to ensure that there is no undue concentration of risks with individuals or groups of customers in specific locations or business. It also takes security when appropriate. The Bank also seeks additional collateral from the counterparty as soon as impairment indicators are noticed for the relevant individual loans and advances. Management monitors the market value of collateral, requests additional collateral in accordance with the underlying agreement and monitors the market value of collateral obtained during its review of the adequacy of the allowance for impairment losses.
The Bank regularly reviews its risk management policies and systems to reflect changes in markets, products, and emerging best practices. The debt securities included in the investment portfolio are mainly corporate and sovereign risk. Analysis of investments by counter-party is provided in Note 6. For details of the composition of loans and advances refer to Note 7. Information on credit risk relating to derivative instruments is provided in Note 11 and for commitments and contingencies in Note 18. The information on the Bank’s credit exposure by business segment is given in Note 27. The information on credit risk exposure and their relative risk weights is also provided in Note 34. The Bank uses a credit classification system as a tool to assist in managing the quality of credit risk within the lending portfolio. It maintains classification grades that differentiate between performing and impaired portfolios and allocates portfolio provisions and specific provisions respectively. The Bank determines each individual borrower’s grade based on specific objective and subjective financial and business assessments criteria covering debt service, profitability, liquidity, capital structure, industry, management quality, and company standing. The Bank conducts a quality classification exercise over all of its existing borrowers and the results of this exercise are validated by the independent Risk Management Unit established within the Bank for that purpose.
29. Geographical concentration
a) The distribution by geographical region for major assets, liabilities, commitments and contingencies and credit exposures is as follows:
2012 (SAR’000) Kingdom Other of GCC and South Saudi Middle North East Other Arabia East Europe America Asia Countries Total ASSETS
Cash and balances with SAMA 7,309,269 492 7,179 18,703 - - 7,335,643
Due from banks and other
financial institutions 2,762,638 266,266 692,872 109,091 837 70 3,831,774
Investments, net 3,877,438 3,877,180 1,305,646 1,503,522 - 348,175 10,911,961
Loans and advances, net 34,050,692 - - - - - 34,050,692
Investments in associates 965,902 - - - - - 965,902
Total 48,965,939 4,143,938 2,005,697 1,631,316 837 348,245 57,095,972
Commitments and contingencies 6,699,283 118,704 287,518 309,649 379,580 328 7,795,062
Maximum credit exposure (stated at credit equivalent amounts)
Commitments and contingencies 2,993,492 24,129 106,684 267,863 87,316 64 3,479,548
Derivatives 27,074 23,492 75,794 - - - 126,360
72 Financial Statements & Auditors’ Report

Notes to the Consolidated Financial Statementsfor the years ended December 31, 2012 and 2011
44
THE SAUDI INVESTMENT BANK
NOTES TO THE CONSOLIDATED FINANCIAL STATEMENTS
For the years ended December 31, 2012 and 2011
29. Geographical concentration - continued
2011 (SAR’000) Kingdom Other of GCC and South Saudi Middle North East Other Arabia East Europe America Asia Countries Total ASSETS
Cash and balances with SAMA 8,832,685 178 6,327 13,981 - - 8,853,171
Due from banks and other
financial institutions 1,735,070 1,243,091 1,017,261 36,469 4,557 369 4,036,817
Investments, net 4,215,768 2,194,570 1,154,037 1,200,843 - 127,844 8,893,062
Loans and advances, net 27,114,093 - - - - - 27,114,093
Investments in associates 894,672 - - - - - 894,672
Total 42,792,288 3,437,839 2,177,625 1,251,293 4,557 128,213 49,791,815
Commitments and contingencies 5,068,122 367,667 358,015 421,178 227,957 6,736 6,449,675
Maximum credit exposure (stated at credit equivalent amounts)
Commitments and contingencies 2,360,750 81,745 91,978 390,204 45,591 1,348 2,971,616
Derivatives 24,633 13,443 74,757 - - - 112,833
Credit equivalent amounts reflect the amounts that result from translating the Bank’s off-statement of consolidated financial position liabilities into the risk equivalent of loans, using credit conversion factors prescribed by SAMA. The credit conversion factor is intended to capture the potential credit risk related to the exercise of that commitment.
b) The distribution by geographical concentration of non-performing loans and advances and allowance for credit losses as of December 31, 2012 and 2011 are entirely in the Kingdom of Saudi Arabia.
30. Market risk
Market risk is the risk that the fair value or future cash flows of the financial instruments will fluctuate due to changes in market variables such as commission rates, foreign exchange rates, and equity prices. The Bank classifies exposures to market risk into either trading or banking-book.
a) Market risk-trading book
The Board has set limits for the acceptable level of risks in managing the trading book. The Bank currently has trading book exposures in foreign exchange contracts and commission rate swaps.
b) Market risk – banking book Market risk on the banking book mainly arises from commission rate risk, liquidity risk, currency risk and equity price risk.
(i) Commission rate risk
Commission rate risk arises from the possibility that the changes in commission rates will affect either the fair values or the future cash flows of the financial instruments and obligations. The Board has established commission rate gap limits for stipulated periods. The Bank monitors positions and can use hedging strategies to ensure maintenance of positions within the established gap limits.
The following table depicts the sensitivity to a reasonable possible change in commission rates, with other variables held constant, on the Bank’s consolidated income statement or equity.
73Financial Statements & Auditors’ Report

Notes to the Consolidated Financial Statementsfor the years ended December 31, 2012 and 2011
45
THE SAUDI INVESTMENT BANK
NOTES TO THE CONSOLIDATED FINANCIAL STATEMENTS
For the years ended December 31, 2012 and 2011
30. Market risk - continued
The sensitivity of net special commission income is the effect of the assumed changes in commission rates on the net commission income for one year, based on the floating rate non-trading financial assets and financial liabilities held as of December 31, 2012 and 2011, including the effect of hedging instruments. The sensitivity of equity is calculated by revaluing the fixed rate available for sale financial assets, including the effect of any associated hedges as of December 31, 2012 and 2011 for the effect of assumed changes in commission rates. The sensitivity of equity is analyzed by maturity of the asset or swap. All of the banking book exposures are monitored and analyzed by currency and relevant sensitivities and are disclosed in SAR thousands.
2012 SAR’000 2012 Sensitivity of Equity (SAR’000)
Benchmark
Increase (decrease)
in basis
Sensitivity of
net special commission
income 6 months
or less 6 to 12
months 1 to 5 years
Over 5 years
Total
SAR +28/-22
+45,104/-35,439 - +420/-330 - - +420/-330
USD +29/-21
+14,238/-10,311 - - +10,311/-7,467 +5,562/-4,028 +15,873/-11,495
EUR +92/-97
+682/-719 - +470/-496 - - +470/-496
2011 SAR’000 2011 Sensitivity of Equity (SAR’000)
Currency
Increase (decrease)
in basis
Sensitivity of net special commission
income 6 months
or less 6 to 12 months
1 to 5 years
Over 5 years
Total
SAR +5/-5
+7,285/-7,285 - - +129/-129 - +129/-129
USD +10/-10
+5,465/-5,465 +27/-27 +42/-42 +1,631/-1,631 +579/-579 +2,279/-2,279
EUR +15/-15
+575/-575 - - +75/-75 - +75/-75
Commission rate sensitivity of assets, liabilities and off - balance sheet items is summarized below. The Bank manages exposure to the effects of various risks associated with fluctuations in prevailing levels of market commission rates on its financial position and cash flows. The Board sets limits on the level of mismatch of commission rate re-pricing that may be undertaken, which is monitored by the treasury department. The Bank is exposed to commission rate risk as a result of mismatches or gaps in the amounts of assets and liabilities and off-balance sheet instruments that mature or re-price in a given period. The Bank manages this risk by matching the re-pricing of assets and liabilities through commission rate risk management strategies. The tables below summarize the Bank’s exposure to commission rate risks. Included in the tables are the Bank’s assets and liabilities at carrying amounts, categorized by the earlier of contractual re-pricing or maturity dates.
74 Financial Statements & Auditors’ Report

Notes to the Consolidated Financial Statementsfor the years ended December 31, 2012 and 2011
46
THE SAUDI INVESTMENT BANK
NOTES TO THE CONSOLIDATED FINANCIAL STATEMENTS
For the years ended December 31, 2012 and 2011
30. Market risk - continued
2012 (SAR’000) Non Within 3 3-12 1-5 Over 5 commission months months years years bearing Total
Assets
Cash and balances with SAMA 4,953,000 - - - 2,382,643 7,335,643
Due from banks and other financial institutions 2,931,774 900,000 - - - 3,831,774
Investments, net 3,804,419 609,105 3,555,664 2,217,903 724,870 10,911,961
Loans and advances, net 19,786,866 9,411,377 4,798,527 53,922 - 34,050,692
Investments in associates - - - - 965,902 965,902
Property and equipment, net - - - - 866,896 866,896
Other assets - - - - 1,103,782 1,103,782
Total 31,476,059 10,920,482 8,354,191 2,271,825 6,044,093 59,066,650 Liabilities and equity
Due to banks and other financial institutions 6,219,438 49,607 - - - 6,269,045
Customer deposits 24,210,355 5,995,896 493,770 9,713,550 40,413,571
Other liabilities - - - - 1,005,208 1,005,208
Term loans 2,000,000 - - - - 2,000,000
Equity - - - - 9,378,826 9,378,826
Total 32,429,793 6,045,503 493,770 - 20,097,584 59,066,650
Commission rate sensitivity-On balance sheet (953,734) 4,874,979 7,860,421 2,271,825 (14,053,491) -
Commission rate sensitivity-Off balance sheet 3,046,094 - (2,952,329) (93,765) - -
Total commission rate sensitivity gap 2,092,360 4,874,979 4,908,092 2,178,060 (14,053,491) -
Cumulative commission rate sensitivity gap 2,092,360 6,967,339 11,875,431 14,053,491 - -
75Financial Statements & Auditors’ Report

Notes to the Consolidated Financial Statementsfor the years ended December 31, 2012 and 2011
47
THE SAUDI INVESTMENT BANK
NOTES TO THE CONSOLIDATED FINANCIAL STATEMENTS
For the years ended December 31, 2012 and 2011
30. Market risk - continued
2011 (SAR’000) Non Within 3 3-12 1-5 Over 5 commission months months years years bearing Total
Assets
Cash and balances with SAMA 6,919,000 - - - 1,934,171 8,853,171
Due from banks and other financial institutions 3,511,455 525,362 - - - 4,036,817
Investments, net 5,364,586 245,988 1,989,342 579,348 713,798 8,893,062
Loans and advances, net 15,660,417 6,916,724 4,490,730 46,222 - 27,114,093
Investments in associates - - - - 894,672 894,672
Property and equipment, net - - - - 907,317 907,317
Other assets - - - - 1,246,450 1,246,450
Total assets 31,455,458 7,688,074 6,480,072 625,570 5,696,408 51,945,582 Liabilities and equity
Due to banks and other financial institutions 4,189,928 34,244 - - - 4,224,172
Customer deposits 22,919,180 4,276,245 1,513,902 - 8,061,165 36,770,492
Other liabilities - - - - 893,622 893,622
Term loans 1,500,000 - - - - 1,500,000
Equity - - - - 8,557,296 8,557,296
Total liabilities and equity 28,609,108 4,310,489 1,513,902 - 17,512,083 51,945,582
Commission rate sensitivity-On balance sheet 2,846,350 3,377,585 4,966,170 625,570 (11,815,675) -
Commission rate sensitivity-Off balance sheet 1,897,100 (1,677,100) (220,000) - - -
Total commission rate sensitivity gap 4,743,450 1,700,485 4,746,170 625,570 (11,815,675) -
Cumulative commission rate sensitivity gap 4,743,450 6,443,935 11,190,105 11,815,675 - -
The off-balance sheet gap position represents the net notional amounts of derivative financial instruments, which are used to manage commission rate risk. (ii) Currency risk
Currency risk represents the risk of change in the value of financial instruments due to changes in foreign exchange rates. The Board has set limits on positions by currencies, which are monitored daily, and hedging strategies are also used to ensure that positions are maintained within the limits. The table below shows the currencies to which the Bank has a significant exposure as of December 31, 2012 and 2011 on its banking book assets and liabilities and forecasted cash flows. The analysis calculates the effect of reasonable possible movement of the currency rate against SAR based on historical movements, with all other variables held constant, on the consolidated income statement (due to the fair value of the currency sensitive banking book assets and liabilities) and equity (due to change in fair value of currency swaps and forward foreign exchange contracts used as cash flow hedges). A positive effect shows a potential increase in the consolidated income or equity, whereas a negative effect shows a potential net reduction in consolidated income or equity.
76 Financial Statements & Auditors’ Report

Notes to the Consolidated Financial Statementsfor the years ended December 31, 2012 and 2011
48
THE SAUDI INVESTMENT BANK
NOTES TO THE CONSOLIDATED FINANCIAL STATEMENTS
For the years ended December 31, 2012 and 2011
30. Market risk - continued
Currency Exposures as of December 31,
2012 Change in Currency
rate in % Effect on Net Income
(SAR’000) Effect on Equity
(SAR’000)
USD +0.03/-0.03 +1,351/-1,351 +1,642/-1,642
EUR +12.22/-12.22 +10,267/-10,267 +6,243/-6,243
GBP +8.74/-8.74 - -
Currency Exposures as of December 31,
2011 Change in Currency
rate in % Effect on Net Income
(SAR’000) Effect on Equity
(SAR’000)
USD - - - EUR +0.17/-0.17 +709/-709 +86/-86
GBP - - -
(iii) Currency position
The Bank manages exposure to the effects of fluctuations in prevailing foreign currency exchange rates on its financial position and cash flows. The Board of Directors sets limits on the level of exposure by currency and in total for both overnight and intra-day positions, which are monitored daily. At the end of the year, the Bank had the following significant net exposures denominated in foreign currencies:
2012
SAR '000 Long/(short)
2011 SAR '000
Long/(short)
US Dollar (512,266) (1,023,014) Euro 92 32,002 Pound sterling 1,025 258 Japanese yen (336) 824 U.A.E Dirham 483 952 Others 4,827 5,904
(iv) Equity price risk Equity risk refers to the risk of a decrease in fair values of equities in the Bank’s investment portfolio as a result of reasonable possible changes in levels of equity indices and the value of individual investments. The effect on the Bank’s equity and mutual fund investments held as available for sale due to reasonable possible change in equity indices, with all other variables held constant, is as follows:
as of December 31, 2012 as of December 31, 2011
Change Change
Market Indices in equity price % Effect in SAR’000
in equity price % Effect in SAR’000
TADAWUL +24.61/-24.61 +108,548/-108,548 +3.07/-3.07 +14,042/-14,042
NASDAQ +10.55/-10.55 +2,620/-2,620 +1.8/-1.8 +338/-338
Unquoted +5.00/-5.00 +556/-556 +5/-5 +556/-556
77Financial Statements & Auditors’ Report

Notes to the Consolidated Financial Statementsfor the years ended December 31, 2012 and 2011
49
THE SAUDI INVESTMENT BANK
NOTES TO THE CONSOLIDATED FINANCIAL STATEMENTS
For the years ended December 31, 2012 and 2011
31. Liquidity risk
Liquidity risk is the risk that the Bank will encounter difficulty in meeting obligations associated with its financial liabilities that are settled by delivering cash or other financial assets. Liquidity risk can be caused by market disruptions or credit downgrades, which may cause certain sources of funding to dry up immediately. To mitigate this risk, management has diversified funding sources and assets are managed with liquidity in mind, maintaining a healthy balance of cash, cash equivalents, and readily marketable securities. Management monitors the maturity profile to ensure that adequate liquidity is maintained. The daily liquidity position is monitored and regular liquidity stress testing is conducted under a variety of scenarios covering both normal and more severe market conditions. All liquidity policies and procedures are subject to review and approval by The Asset Liability Management Committee. Daily reports cover the liquidity position of the Bank. A summary report, including any exceptions and remedial action taken, is submitted regularly to The Asset Liability Management Committee. In accordance with Banking Control Law and the regulations issued by SAMA, the Bank maintains a statutory deposit with SAMA equal to 7% (2011: 7%) of total demand deposits and 4% (2011: 4%) of saving and time deposits. In addition to the statutory deposit, the Bank also maintains liquid reserves of no less than 20% of its deposit liabilities, in the form of cash and balances with SAMA, Saudi Government Development Bonds or assets which can be converted into cash within a period not exceeding 30 days. The Bank has the ability to raise additional funds through repo facilities with SAMA against Saudi Government Development Bonds up to 75% of the nominal value of bonds held. a) Expected contractual maturity profile of assets and liabilities. The tables below summarize the contractual maturity profile of the Bank’s assets and liabilities as of December 31, 2012 and 2011. The contractual maturities of assets and liabilities have been determined on the basis of the remaining period at the consolidated statement of financial position date to the contractual maturity date, and do not take into account the effective maturities as indicated by the Bank’s deposit retention history. The amounts disclosed in the table are the contractual undiscounted cash flows, whereas the bank manages the inherent liquidity risk based on expected undiscounted cash inflows for both contractual and non-contractual positions.
2012 (SAR’000) Within 3 3-12 1-5 Over 5 No fixed months months years years maturity Total Assets Cash and balances with SAMA 4,953,000 - - - 2,382,643 7,335,643
Due from banks and other financial institutions 2,798,395 1,033,379 - - - 3,831,774
Investments, net 99,201 522,604 6,602,339 2,962,974 724,843 10,911,961 Loans and advances, net 13,018,903 9,604,586 8,676,256 2,750,947 - 34,050,692 Investments in associates - - - - 965,902 965,902 Property and equipment, net - - - - 866,896 866,896 Other assets 446,153 657,629 - - - 1,103,782
Total 21,315,652 11,818,198 15,278,595 5,713,921 4,940,284 59,066,650
Liabilities and equity Due to banks and other financial
institutions 6,219,438 49,607 - - - 6,269,045 Customer deposits 23,652,227 5,995,896 493,770 10,271,678 40,413,571 Other liabilities 209,486 795,722 - - - 1,005,208 Term loans - - 2,000,000 - - 2,000,000 Equity - - - - 9,378,826 9,378,826
Total liabilities and equity 30,081,151 6,841,225 2,493,770 - 19,650,504 59,066,650 Derivatives, commitments and
contingencies 5,071,844 2,979,552 5,134,227 378,328 - 13,563,951
78 Financial Statements & Auditors’ Report

Notes to the Consolidated Financial Statementsfor the years ended December 31, 2012 and 2011
50
THE SAUDI INVESTMENT BANK
NOTES TO THE CONSOLIDATED FINANCIAL STATEMENTS
For the years ended December 31, 2012 and 2011
31. Liquidity risk – continued
2011 (SAR’000) Within 3 3-12 1-5 Over 5 No fixed months months years years maturity Total
Assets
Cash and balances with SAMA 6,919,000 - - - 1,934,171 8,853,171
Due from banks and other financial institutions 3,422,341 614,476 - - - 4,036,817
Investments, net 1,013,902 1,203,926 4,834,955 1,126,481 713,798 8,893,062
Loans and advances, net 9,785,362 8,239,872 8,377,604 711,255 - 27,114,093
Investment in associates - - - - 894,672 894,672
Property and equipment, net - - - - 907,317 907,317
Other assets 450,353 796,097 - - - 1,246,450
Total assets 21,590,958 10,854,371 13,212,559 1,837,736 4,449,958 51,945,582
Liabilities and equity
Due to banks and other financial institutions 4,189,928 34,244 - - - 4,224,172
Customer deposits 21,989,633 4,276,245 1,513,902 - 8,990,712 36,770,492
Other liabilities 175,473 718,149 - - - 893,622
Term loans - 500,000 1,000,000 - - 1,500,000
Equity - - - - 8,557,296 8,557,296
Total liabilities and equity 26,355,034 5,528,638 2,513,902 - 17,548,008 51,945,582 Derivatives, commitments and
contingencies 3,170,222 3,190,094 3,730,469 529,823 - 10,620,608 Assets available to meet all of the liabilities and to cover outstanding loan commitments include cash, balances with SAMA, items in the course of collection, loans and advances to banks, and loans and advances to customers. The cumulative maturities of commitments and contingencies is disclosed in note 18c (i) of the consolidated financial statements.
b) Analysis of financial liabilities by remaining contractual maturities The tables below summarize the maturity profile of the Bank's financial liabilities as of December 31, 2012 and 2011 based on contractual undiscounted repayment obligations. As special commission payments up to contractual maturity are included in the table, the totals do not match with the consolidated statement of financial position. The contractual maturities of liabilities have been determined based on the remaining period at the consolidated statement of financial position date to the contractual maturity date and do not take into account the effective expected maturities. The Bank expects that many customers will not request repayment on the earliest date that the Bank could be required to pay and the table does not reflect the expected cash flows indicated by the Bank's deposit retention history.
79Financial Statements & Auditors’ Report
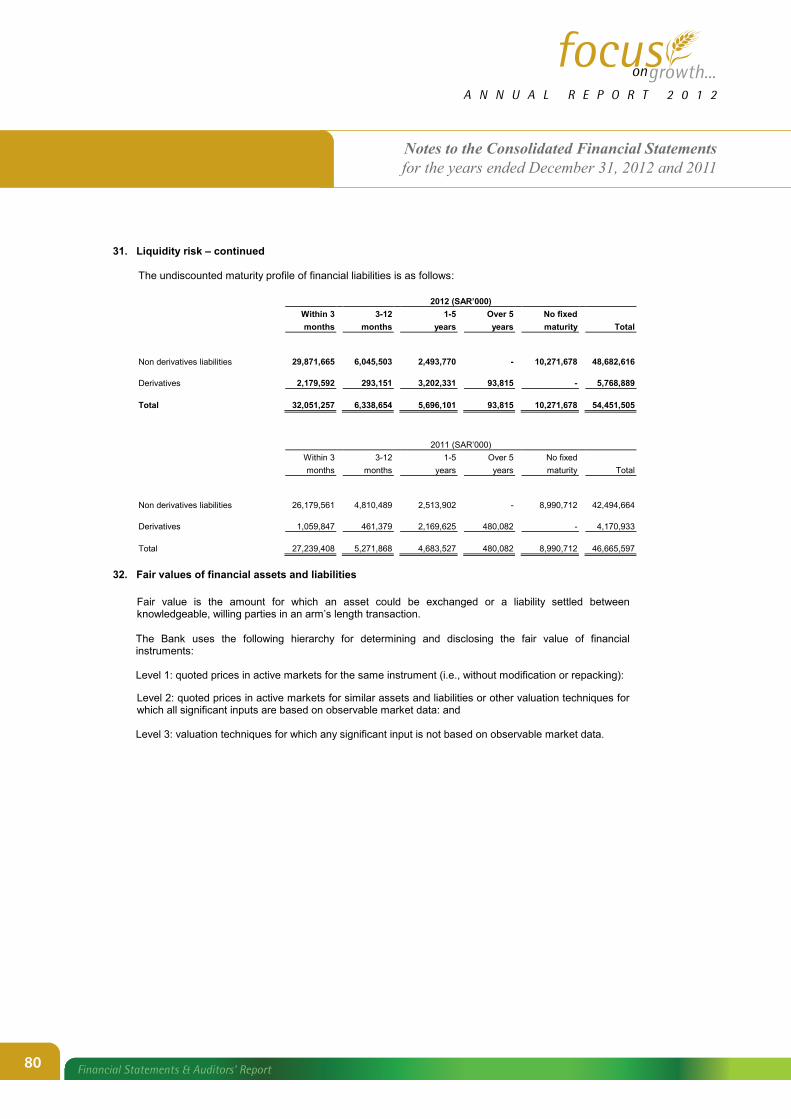
Notes to the Consolidated Financial Statementsfor the years ended December 31, 2012 and 2011
51
THE SAUDI INVESTMENT BANK
NOTES TO THE CONSOLIDATED FINANCIAL STATEMENTS
For the years ended December 31, 2012 and 2011
31. Liquidity risk – continued
The undiscounted maturity profile of financial liabilities is as follows:
2012 (SAR’000) Within 3 3-12 1-5 Over 5 No fixed months months years years maturity Total
Non derivatives liabilities 29,871,665 6,045,503 2,493,770 - 10,271,678 48,682,616
Derivatives 2,179,592 293,151 3,202,331 93,815 - 5,768,889
Total 32,051,257 6,338,654 5,696,101 93,815 10,271,678 54,451,505
2011 (SAR’000) Within 3 3-12 1-5 Over 5 No fixed months months years years maturity Total
Non derivatives liabilities 26,179,561 4,810,489 2,513,902 - 8,990,712 42,494,664
Derivatives 1,059,847 461,379 2,169,625 480,082 - 4,170,933
Total 27,239,408 5,271,868 4,683,527 480,082 8,990,712 46,665,597
32. Fair values of financial assets and liabilities
Fair value is the amount for which an asset could be exchanged or a liability settled between knowledgeable, willing parties in an arm’s length transaction.
The Bank uses the following hierarchy for determining and disclosing the fair value of financial instruments: Level 1: quoted prices in active markets for the same instrument (i.e., without modification or repacking): Level 2: quoted prices in active markets for similar assets and liabilities or other valuation techniques for which all significant inputs are based on observable market data: and Level 3: valuation techniques for which any significant input is not based on observable market data.
80 Financial Statements & Auditors’ Report

Notes to the Consolidated Financial Statementsfor the years ended December 31, 2012 and 2011
52
THE SAUDI INVESTMENT BANK
NOTES TO THE CONSOLIDATED FINANCIAL STATEMENTS
For the years ended December 31, 2012 and 2011
32. Fair values of financial assets and liabilities - continued
The following table shows an analysis of financial assets and liabilities recorded at fair value as at December 31, 2012 and 2011 by level of the fair value hierarchy. 2012 (SAR ‘000)
Level 1 Level 2 Level 3 Total
Financial assets:
Derivative financial instruments
- 79,695 - 79,695
Financial investments available for sale
8,108,057 1,420,083 464,131 9,992,271
Total
8,108,057 1,499,778 464,131 10,071,966
Financial liabilities:
Derivative financial instruments - 142,348 - 142,348
Total - 142,348 - 142,348 2011 (SAR ‘000)
Level 1 Level 2 Level 3 Total
Financial assets:
Derivative financial instruments
- 137,301 - 137,301
Financial investments available for sale
5,142,272 1,583,712 1,185,665 7,911,649
Total
5,142,272 1,721,013 1,185,665 8,048,950
Financial liabilities:
Derivative financial instruments - 159,400 - 159,400
Total - 159,400 - 159,400 The decline of SAR 721.5 million in Level 3 financial investments available for sale in 2012 is primarily due to maturities of investments net of investment purchases. The fair values of financial instruments that are not included in the consolidated statement of financial position are not significantly different from the carrying values included in the consolidated financial statements. The fair values of loans and advances, held to maturity investments, commission bearing customers’ deposits, term loans, and due from and due to banks which are carried at amortized cost, are not significantly different from the carrying values included in the consolidated financial statements, since the current market commission rates for similar financial instruments are not significantly different from the contracted rates, and for the short duration of due from and due to banks.
The estimated fair values of held-to-maturity investments are based on quoted market prices when available or pricing models in the case of certain fixed rate bonds. The fair values of these investments are disclosed in Note 6 (c). The fair values of derivatives and other off-balance sheet financial instruments are based on quoted market prices when available or by using appropriate valuation models. The total amount of the changes in fair value recognized in the consolidated income statement, which was estimated using valuation models, is SAR 29.9 million (2011: SAR 12.4 million). The value obtained from the relevant valuation model may differ with the transaction price of a financial instrument. The difference between the transaction price and the model value is commonly referred to as ‘day one profit and loss’. It is either amortized over the life of the transaction, deferred until the instrument’s fair value can be determined using market observable data, or realized through disposal. Subsequent changes in fair value are recognized immediately in the consolidated income statement without reversal of deferred day one profits and losses.
81Financial Statements & Auditors’ Report
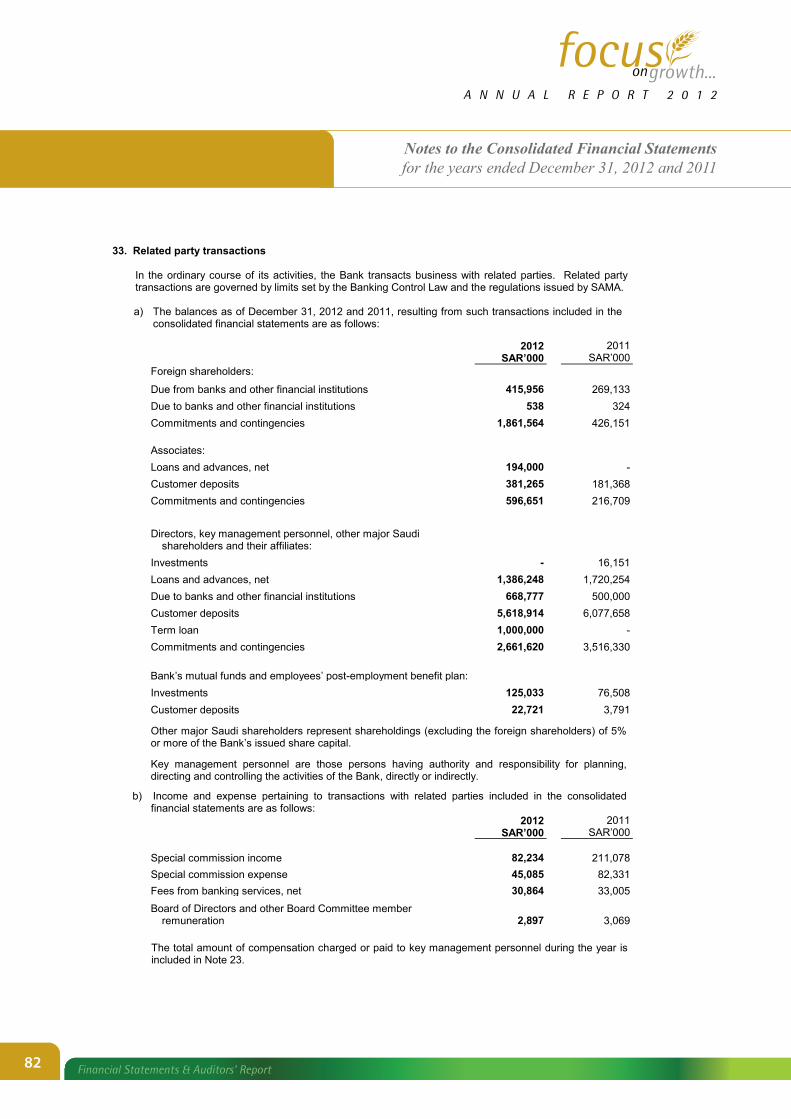
Notes to the Consolidated Financial Statementsfor the years ended December 31, 2012 and 2011
53
THE SAUDI INVESTMENT BANK
NOTES TO THE CONSOLIDATED FINANCIAL STATEMENTS
For the years ended December 31, 2012 and 2011
33. Related party transactions
In the ordinary course of its activities, the Bank transacts business with related parties. Related party transactions are governed by limits set by the Banking Control Law and the regulations issued by SAMA.
a) The balances as of December 31, 2012 and 2011, resulting from such transactions included in the
consolidated financial statements are as follows: 2012 2011 SAR’000 SAR’000
Foreign shareholders:
Due from banks and other financial institutions 415,956 269,133 Due to banks and other financial institutions 538 324 Commitments and contingencies 1,861,564 426,151
Associates: Loans and advances, net 194,000 - Customer deposits 381,265 181,368 Commitments and contingencies 596,651 216,709
Directors, key management personnel, other major Saudi shareholders and their affiliates:
Investments - 16,151 Loans and advances, net 1,386,248 1,720,254 Due to banks and other financial institutions 668,777 500,000 Customer deposits 5,618,914 6,077,658 Term loan 1,000,000 - Commitments and contingencies 2,661,620 3,516,330
Bank’s mutual funds and employees’ post-employment benefit plan: Investments 125,033 76,508 Customer deposits 22,721 3,791
Other major Saudi shareholders represent shareholdings (excluding the foreign shareholders) of 5% or more of the Bank’s issued share capital.
Key management personnel are those persons having authority and responsibility for planning, directing and controlling the activities of the Bank, directly or indirectly.
b) Income and expense pertaining to transactions with related parties included in the consolidated financial statements are as follows:
2012 2011 SAR’000 SAR’000
Special commission income 82,234 211,078 Special commission expense 45,085 82,331 Fees from banking services, net 30,864 33,005 Board of Directors and other Board Committee member
remuneration 2,897 3,069
The total amount of compensation charged or paid to key management personnel during the year is included in Note 23.
82 Financial Statements & Auditors’ Report

Notes to the Consolidated Financial Statementsfor the years ended December 31, 2012 and 2011
54
THE SAUDI INVESTMENT BANK
NOTES TO THE CONSOLIDATED FINANCIAL STATEMENTS
For the years ended December 31, 2012 and 2011
34. Capital adequacy
The Bank’s objectives when managing capital are to comply with the capital requirements set by SAMA to safeguard the Bank’s ability to continue as a going concern, and to maintain a strong capital base. Capital adequacy and the use of regulatory capital are monitored by the Bank’s management. SAMA requires the Bank to hold a minimum level of regulatory capital and maintain a ratio of total regulatory capital to risk-weighted assets (RWA) at or above the requirement of 8%. The Bank monitors the adequacy of its capital using ratios established by SAMA. These ratios measure capital adequacy by comparing the Bank’s eligible capital with its consolidated statement of financial position assets, commitments, and notional amount of derivatives, at a weighted amount to reflect their relative risk.
2012 2011
SAR’000 SAR’000
Credit Risk RWA
47,661,656 38,572,080
Operational Risk RWA 3,081,431 2,913,004
Market Risk RWA 283,449 1,021,386
Total Pillar- I RWA
51,026,536 42,506,470
Tier I Capital 8,877,054 8,091,138
Tier II Capital 112,819 34,815
Total Tier I & II Capital 8,989,873 8,125,953
Capital Adequacy Ratio %
Tier I Ratio 17.40% 19.04%
Tier I + Tier II Ratio 17.62% 19.12% 35. Asset management and brokerage services
The Bank offers investment services to its customers, through a subsidiary, which include management of investment funds in consultation with professional investment advisors, with assets under management totalling approximately SAR 3,963 million (2011: SAR 4,171 million). This includes funds managed under Shariah approved portfolios amounting to approximately SAR 1,110 million (2011: SAR 1,189 million).
83Financial Statements & Auditors’ Report

Notes to the Consolidated Financial Statementsfor the years ended December 31, 2012 and 2011
55
THE SAUDI INVESTMENT BANK
NOTES TO THE CONSOLIDATED FINANCIAL STATEMENTS
For the years ended December 31, 2012 and 2011
36. Employee stock options
The Group has share-based payment plans outstanding at the end of the year. Significant features of the Plans are as follows: Grant dates: January 1, 2008, 2009, 2010, 2011 and 2012 Maturity dates: Between 2010 and 2015 Vesting period: 4 years per plan Vesting conditions: participating employees to remain in service Method of settlement: Shares Cost to participating employees: SAR 4.09 to SAR 5.00 per share. The stock options outstanding as of December 31, 2012 and 2011 have a weighted average contractual life of between one and four years. The stock options are granted only under a service condition with no market condition. In 2012, the Bank vested 50% of the shares granted in January 2010, 25% of the shares granted in January 2009 and 25% of the shares granted in January 2008 equivalent to 590,997 shares, for a total estimated cost of SR 8.4 million. In 2011, the Bank vested 50% of the shares granted in January 2009 and 25% of the shares granted in January 2008 equivalent to 369,374 shares, for a total estimated cost of SAR 5.6 million.
37. Issued IFRS but not yet effective The Group has chosen not to early adopt the following standards, which are effective for the Bank’s 2013 financial reporting year: IAS 1 Amendments - Presentation of items of other comprehensive income IFRS 10 - Consolidated financial statements IFRS 11 - Joint Arrangements IFRS 12 - Disclosure of interests in other entities IFRS 13 - Fair value measurement IAS 19 Revised 2011 - Employee benefits IAS 27 Revised 2011 - Separate financial statements IAS 28 Revised 2011 - Associates and joint ventures IFRS 7 Amendments - Disclosure on offsetting financial assets and liabilities Amendments to the basis for conclusions on IAS 1, 16, 32, and 34 (Annual improvements 2011)
In addition to the above, the Group has chosen not to early adopt IFRS 9 (2010) – Financial instruments, and the amendment to IAS 32 - Financial instruments: Presentation on offsetting financial assets and financial liabilities, which will not be effective until January 1, 2015 and January 1, 2014, respectively. The Group is currently assessing the implication of the above standards and amendments on the Group and the timing of adoption.
38. Comparative figures
Certain prior year figures have been reclassified to conform to the current year presentation.
39. Board of Director’s approval The consolidated financial statements were approved by the Board of Directors on 9th Rabi Al Awal 1434H corresponding to January 21, 2013.
40. Basel II Pillar 3 disclosures (unaudited) Under Basel II pillar 3, certain quantitative and qualitative disclosures are required, and these disclosures will be made available on the Bank’s website www.saib.com.sa as required by the Saudi Arabian Monetary Agency. Such disclosures are not subject to review nor audit by the external auditors.
84 Financial Statements & Auditors’ Report


Qualitative Disclosures Under Pillar III of Basel IIFor The Year Ended December 31, 2012
RISK EXPOSURE AND ASSESSMENTThe complexity of today’s financial sector, business operations, and diversity of geographical locations requires identification, measurement, aggregation and effective management of risks and efficient allocation of capital to derive an optimal risk and return ratio. The Saudi Investment Bank (the Bank) manages its risks in a structured, systematic, and transparent manner through a broad risk policy that embeds comprehensive risk management into the Bank’s organizational structure, risk measurement, and monitoring processes.
The key features of The Bank’s comprehensive risk management policy include:
• The Board of Directors (the Board) provides overall risk management direction and oversight.
• Risk management is embedded as an intrinsic process and is a core competency for all of its employees.
• The Bank manages its credit, market, operational, and liquidity risks in a coordinated manner within the organization.
• The Bank’s risk management function is independent of the business units.
• The Bank’s internal audit function reports to the Board Audit Committee and provides independent validation of the business unit’s compliance with risk policies and procedures and the adequacy and effectiveness of the risk management framework on a bank-wide basis.
The risk management function ensures that:
• The Bank’s overall business strategy is consistent with its risk policy approved by the Board.
• Appropriate risk management architecture and systems are developed and implemented.
• The portfolio of risks and limits are routinely monitored, including at appropriate regional levels.
The risk management function assists the Board and senior management in controlling and actively managing the Bank’s overall risk.
Scope and Nature of Risk Reporting ToolsThe comprehensive risk management framework enables the Bank to identify, assess, limit, and monitor risks using a wide range of quantitative and qualitative tools. Some of these tools are common to a number of risk categories, while others are tailored to the particular features of specific risk categories and enable generation of information such as:
• Credit risk in commercial and consumer lending and other asset exposures such as collateral coverage ratios, limit utilization, past due and alerts, among others;
• Quantification of the susceptibility of the market value of single positions or portfolios to changes in market parameters (commonly referred to as sensitivity analysis); and
• Quantification of exposure to losses due to extreme movements in market prices or rates.
The Bank continuously assesses the adequacy and effectiveness of its reporting tools and metrics in light of the changing risk environment.
Risk Management ProcessesThrough the comprehensive risk management framework, transactions and outstanding risk exposures are quantified and compared against authorized limits, whereas non-quantifiable risks are monitored against policy guidelines and key risk and control indicators. Any discrepancies, excesses, or deviations are escalated for appropriate action.
SCOPE OF APPLICATIONThe name of the top corporate entity in the group to which this framework applies is The Saudi Investment Bank.
87
Qualitative Disclosures Under Pillar III of Basel IIFor The Year Ended December 31, 2012
The results of subsidiaries acquired or disposed of during the year are fully included in the consolidated statement of financial position and consolidated statement of income from the date of the acquisition or up to the date of disposal, as appropriate. The Bank has the following three subsidiaries:
• Alistithmar Capital for Financial Securities and Brokerage Company, a limited liability company, and is 100% owned by the Bank.
• SAIB BNP Paribas Asset Management Company, a limited liability company, and is 55% owned by the Bank with the remaining 45% owned by Saudi and Foreign shareholders. On September 25, 2011, The Capital Market Authority (“CMA”) approved a request submitted by Alistithmar for Financial Services and Brokerage Company (Alistithmar) to acquire the net assets of SAIB BNP Paribas Asset Management Company (AMCO). The CMA also approved Alistithmar’s request to amend Alistithmar’s business profile to include all licensed activities (Dealing, Managing, Arranging, Advising, and Custody). The Business Transfer Agreement between Alistithmar and the AMCO shareholders was completed in December 2011 and the net assets were acquired by Alistithmar on December 31, 2011. SAIB BNP Paribas Asset Management Company is now in the process of liquidation.
• Saudi Investment Real Estate Company, a limited liability company, and is owned 99% by the Bank with the remaining 1% owned by a representative Saudi shareholder. The company has not yet commenced any significant operations.
Each subsidiary, except the Saudi Investment Real Estate Company, is regulated by CMA rules and regulations, which also sets and monitors capital adequacy requirements.
Investments in associates are initially recognized at cost and subsequently accounted for under the equity method of accounting. The Bank has investments in the following four associates:
• Amex (Saudi Arabia) Ltd. (“AMEX”) is a limited liability company with Amex (Middle East), Bahrain. is incorporated in Saudi Arabia and the Bank holds a 50% interest. The principal activities of include the issuance of credit cards and the offer of other American Express products in Saudi Arabia.
• Saudi Orix Leasing Company (“Orix”) is a Saudi Arabian closed joint stock company in Saudi Arabia and the Bank holds a 38% interest. The principal activities of Orix include lease-financing services in Saudi Arabia.
• Amlak International for Finance and Real Estate Development Co. (“Amlak”) is a Saudi Arabian closed joint stock company in Saudi Arabia and the Bank holds a 32% interest. The principal activities of Amlak include real estate finance products and services.
• Mediterranean & Gulf Insurance and Reinsurance Co.-KSA (MedGulf) is a joint stock company in Saudi Arabia and the Bank holds a 19% interest. The principal activities of Medgulf include offering a full range of insurance products and services to the Saudi market.
The Bank also has a 20% interest in Naeem Investment Company, which has no operations.
The Bank has no other subsidiaries nor operates any other business activities outside of Saudi Arabia. The Bank is subject to all laws and regulations of Saudi Arabia and is regulated by the Saudi Arabian Monetary Agency (SAMA). The Bank also follows regulations issued by the Ministry of Commerce and the Capital Market Authority (CMA).
There are no restrictions, or other major impediments, on the transfer of funds or regulatory capital within the group.
CAPITAL STRUCTUREThe authorized, issued and fully paid up capital of the Bank consists of 550 million ordinary shares of SAR 10 each as of December 31, 2012.
The total equity of the Bank as of December 31, 2012 was SAR 9,379 million (2011: SAR 8,557 million).
88
Qualitative Disclosures Under Pillar III of Basel IIFor The Year Ended December 31, 2012
Tier I Capital as of December 31, 2012 was SAR 8,877 million (2011:SAR 8,091 million), which is considered the core measure of the Bank’s financial strength and includes share capital, reserves, retained earnings and minority interests.
Additional Tier II Capital as of December 31, 2012 was SAR 113 million (2011: SAR 35 million), which consists of the allowed portions of revaluation reserves and general provisions.
Total Tier I and Tier II Capital as of December 31, 2012 was SAR 8,990 million (2011: 8,126 million).
Eligible Reserves are created by appropriations of profit and are maintained for future growth and to meet statutory requirements. The eligible reserves are mainly comprised of statutory reserves, other reserves, and retained earnings.
CAPITAL ADEQUACYWhile managing capital, the Bank’s objectives are to comply with the capital requirements set by SAMA to safeguard the Bank’s ability to continue as a going concern and to maintain a strong capital base.
Capital adequacy and the use of regulatory capital are routinely monitored by the Bank’s management. SAMA requires the Bank to hold a minimum level of regulatory capital and maintain a ratio of total regulatory capital to risk-weighted assets (RWA) at or above the requirement of 8%.
The Bank monitors the adequacy of its capital using ratios established by SAMA. These ratios measure capital adequacy by comparing its eligible capital with its balance sheet assets, commitments, and notional amount of derivatives at a weighted amount to reflect their relative risk.
Internal Capital Adequacy and Assesment Plan
A comprehensive analysis of capital assessment and adequacy, through the process of an Internal Capital Adequacy Assessment Plan (ICAAP), is carried out by the Bank on an annual basis for which robust models and commonly accepted methodologies are applied for the estimation of the minimum required capital. This process is supported by the use of proprietary capital planning methodologies. The analysis and results thereof are presented to the Board of Directors for review and approval.
Based on the detailed ICAAP analysis conclusions, the Bank’s balance sheet remains strong, and is adequately capitalized for current and potential risks, which may be manifested during the next year.
Stress Testing Frame Work
During 2012, the Bank completed a comprehensive stress test exercise based on the Bank’s consolidated statement of financial position as of June 30, 2012.
In order to establish a firm and robust stress testing program, the Bank completed a stress testing framework that allows the Bank to adopt stress testing practices and methodologies that make stress testing an effective and integral part of the Bank’s risk management function, as well as to meet regulatory requirements of SAMA.
The Bank has also appointed a stress testing committee (STC) headed by the Chief Risk Officer and has implemented a bank-wide stress testing policy (STP) which has been approved by the Bank’s Board of Directors. The STC, in accordance with the STP, has furthermore appointed a cross-functional team designated as the Stress Testing Team (STT) to conduct the detailed stress testing work and submit results of such work to the STC for its review and feedback.
The Bank’s Stress Testing framework specifies the frequency and schedule of stress tests and reporting of stress test results in accordance with SAMA’s requirements. It also outlines the roles and responsibilities of the Bank’s Board of Directors, Asset - Liability Management Committee (“ALMAC”), STC, and STT. It further includes the responsibilities of the Bank’s Internal Audit and Compliance Department in the stress-testing program.
89

Qualitative Disclosures Under Pillar III of Basel IIFor The Year Ended December 31, 2012
The Stress Test results completed in 2012 and approved by the Board of Directors, show that the Bank is adequately capitalized to withstand even a severe stress and exceeds the Basel minimum capital ratio even under the severe stress scenario.
RISK MANAGEMENTCredit Risk Management
The Bank manages exposures to credit risk, which is the risk that one party to a financial instrument will fail to discharge an obligation and cause the other party to incur a financial loss. Credit exposures arise principally in lending and investment activities. There is also credit risk embedded in off-balance sheet accounts, such as loan commitments.
Credit Risk Management Strategy
The approach to credit risk management is based on the foundation to preserve the independence and integrity of the credit risk assessment, management and reporting processes combined with clear policies, and the limits and approval structures which guide the day-to-day initiation and management of the Bank’s credit risk exposure. This approach includes credit limits that are established for all customers after a careful assessment of their creditworthiness and the pay-out analysis.
Standing policy guidelines included in the Bank’s Credit Policy Manual approved by the Board of Directors require that all credit proposals must be reviewed and approved by the Credit Committee.
Whenever necessary, credit facilities are secured by acceptable forms of collateral to mitigate the related credit risks.
The Board defines the Bank’s credit risk management strategy and approves significant credit risk policies to ensure alignment of the Bank’s exposure with its risk policy.
The Bank also uses external ratings of the major rating agencies, where available.
The Bank controls credit risk by monitoring credit exposures, limiting transactions with specific counterparties, and continually assessing the creditworthiness of counterparties.
The Bank’s credit risk management policies are designed to identify and set appropriate risk limits and to monitor the risks and adherence to limits. Actual exposures against limits are routinely monitored.
The Bank’s credit risk for derivatives represents the potential cost to replace the derivative contracts if counterparties fail to fulfill their obligation, and to control the level of credit risk taken. The Bank assesses counterparties using the same techniques as for its lending activities.
Concentrations of credit risk arise when a number of counterparties are engaged in similar business activities, or activities in the same geographic region, or have similar economic features that would cause their ability to meet contractual obligations to be similarly affected by changes in economic, political or other conditions. Loan Portfolio Concentration risk is well managed under the Bank’s Strategic Plan.
Concentrations of credit risk indicate the relative sensitivity of the Bank’s performance to developments affecting a particular industry or business or geographical location.
The Bank seeks to manage its credit risk exposure through diversification of lending activities to ensure that there is no undue concentration of risks with individuals or groups of customers in specific locations, businesses or industries.
The Bank also takes security when appropriate. In addition, the Bank seeks additional collateral from the counterparty as soon as impairment indicators are noticed for the relevant individual loans or advances.
Management monitors the market value of collateral, requests additional collateral in accordance with
90

Qualitative Disclosures Under Pillar III of Basel IIFor The Year Ended December 31, 2012
underlying agreements, and monitors the market value of collateral obtained during its review of the adequacy of the allowance for impairment losses.
The Bank regularly reviews its credit risk management policies and systems to reflect changes in market products and practices, and emerging best practices.
Credit Risk Management Structure
Senior management and respective committees implement the Board’s credit risk strategy and develop policies and procedures for identifying, assessing, monitoring, and controlling credit risk.
The Bank’s Executive Committee chaired by the Chairman of the Board meets periodically to review loan portfolio quality and standards. The Bank’s Audit Committee appointed by the Board reviews the audit reports submitted by the Bank’s General Auditor throughout the year.
Key Features of Credit Risk Management
Credit facilities are granted based on detailed credit risk assessments, which consider the purpose of the facility and source of repayment, prevailing and potential macro-economic factors, industry trends, and the customer’s positioning within its industry peer-group.
In compliance with SAMA regulations, lending to individual board members and related parties is fully secured and monitored by the Credit Committee. Such transactions are made on substantially the same terms, including interest rates and collateral, as those prevailing at the time for comparable transactions with unrelated parties.
All new proposals and/or material changes to existing credit facilities are reviewed and approved by the Credit Committee and / or by the Executive Committee within the provisions of the Credit Policy Guide approved by the Board.
The credit facility administration process is undertaken as a segregated function to ensure proper execution of all credit approvals, maintenance of documentation, and proactive control over maturities, expiry of limits, collateral valuation, and legal covenants.
Credit Risk Monitoring, Reporting and Measurement System
The Bank’s exposures are continuously monitored through a system of triggers and early-warning signals aimed at detecting adverse symptoms that could result in the deterioration of credit risk quality. The triggers and early-warning systems are supplemented by facility utilization and collateral valuation monitoring, together with a review of upcoming credit facility expiration and market intelligence to enable timely corrective action by management. The results of the monitoring process are reflected in the internal rating process.
Credit risk is monitored on an ongoing basis with formal monthly and quarterly reporting to the Credit Committee, senior management, and the Board to ensure awareness of shifts in credit quality and portfolio performance along with changing external factors such as economic and business cycles.
Consumer credit risk reporting also includes a dashboard for consumer and small business lending, classification, and delinquency monitoring.
Specialized and focused Special Credit Unit teams handle the management and collection of problem credit facilities and take any legal action if required.
Credit Risk Mitigation Strategy
Portfolio diversification is the cornerstone of the Bank’s credit risk mitigation strategy, which is implemented through customer, industry, and geographical limit structures.
To ensure diversification at the portfolio level, interrelated companies with the same management or ownership structure are classified and treated as one entity.
91

Qualitative Disclosures Under Pillar III of Basel IIFor The Year Ended December 31, 2012
Credit risk mitigants such as collateral and guarantees are effective mitigating factors within the Bank’s portfolio and collateral quality is continuously monitored and assessed.
Past-due and impairment
Credit facilities are classified as past due when a payment has not been received on its contractual payment date, or if the facility is in excess of pre-approved limits.
A credit facility exposure is considered impaired if the interest or a principal installment is past due for more than 90 days and the exposure is downgraded to a non-performing category.
Approaches for Specific and General Impairment
The non-performing loans are managed and monitored as irregular exposures and are classified into Sub-standard and Doubtful categories which are then used to guide the provisioning process of general as well as specific impairment provisions.
The Bank uses a credit classification system as a tool to assist in managing the quality of credit risk within the lending portfolio. The Bank maintains ten classification grades that differentiate between performing, past due but not impaired, and impaired portfolios, and allocates portfolio and specific provisions, accordingly.
The Credit Committee conducts quality classification exercises over all of its existing borrowers subject to the guidelines provided in the Credit Policy Guide.
Consumer loan loss provisions are allocated on the basis of portfolio provisioning in compliance with SAMA regulatory requirements.
The adequacy of provisions are regularly reviewed and adjusted according to a portfolio risk analysis undertaken at least on a monthly basis.
The Bank uses external ratings (where available) from Fitch, S&P and Moody’s to supplement internal ratings during the process of determining credit limits. Unrated public issue instruments are risk-weighted at 100% for capital adequacy purposes.
Standardized Approach and Supervisory Risk Weights
The Bank currently uses the Standardized Approach for the credit risk capital calculation charge under SAMA guidelines as amended from time to time.
Names of External Credit Assessment Institutions (ECAIs) used and reasons for any changes
The Bank uses the ratings issued by Standard & Poor’s (S&P), Moody’s, and Fitch, which are the ECAIs approved by SAMA for the Standardized Approach.
There were no changes in the ECAIs used by the Bank in 2012. The Bank has not yet implemented the Internal Ratings-Based (IRB) Approach.
Types of exposures for which each agency is used
The Bank does not use any specific agency exclusively for any particular type of exposure.
The available ratings of any of the above three approved ECAIs on the obligors classified as Sovereign, Public Sector Entities, Multilateral Development Banks, Banks and Security Firms, and Corporates are used for risk weighting the exposures on them.
A description of the process used to transfer public issue ratings to comparable assets in the banking book
The Bank’s exposure to the obligor will reflect the correct issue rating from an acceptable ECAI long-term issuer rating.
92

Qualitative Disclosures Under Pillar III of Basel IIFor The Year Ended December 31, 2012
Distinction between long-term and short-term claims is made only in respect of claims on banks. Generally, short-term ratings are deemed to be issue specific to be used only for the rated short-term facility. Short-term ratings are not used for any other short-term claims.
If there are three or more assessments with different risk weights, the assessments corresponding to the two lowest risk weights are used and the higher of those risk weights is applied.
In general, the Bank follows the guidelines issued by SAMA with respect to the use of ECAI ratings.
The alignment of an alphanumerical scale of each agency used with risk buckets
The alignments of the ratings of each ECAI are made as per the standard mapping published by SAMA.
Exposures Related To Counterparty Credit Risk
The Bank manages and controls credit risk by monitoring credit exposures, limiting transactions with specific counterparties, and continually assessing the creditworthiness of counterparties.
The Bank’s risk management policies are designed to identify and to set appropriate risk limits and to monitor the risks and adherence to limits. Actual exposures against limits are routinely monitored.
In addition to monitoring credit limits, the Bank manages the credit exposure relating to any trading activities. The Bank may close out transactions or assign them to other counterparties to mitigate credit risk.
The Bank’s credit risk for derivatives represents the potential cost to replace the derivative contracts if counterparties fail to fulfill their obligation. To control the level of credit risk taken, the Bank assesses counterparties using the same techniques as for its lending activities.
SecuritizationThe Bank does not have any Securitization exposure or risk.
Market Risk Management The Bank recognizes market risk as the risk due to potential losses in on-and off-balance sheet positions arising from movements in market prices such as interest rates, foreign exchange rates, equity prices and commodity prices.
Market-Risk Management Framework
The Bank has in place a market-risk management framework which governs the Bank’s trading and non-trading activities related to market risk. The Bank separates market risk related activities between its banking book and its trading book.
The relevant department heads within the Treasury and Investment Group are responsible for managing market risk arising from any trading activities.
The Bank’s Asset Liability Management Committee (ALMAC) is responsible for monitoring and oversight of market risk inherent within the Bank’s trading and non-trading activities.
The Market Risk Department is responsible for monitoring and reporting the Bank’s market risk exposures.
For regulatory capital purposes, the Bank calculates its market risk capital requirements according to the Standardized methodology.
All activities giving rise to market risk are conducted within a structure of approved credit and position limits.
Monitoring of Market Risk
The main objective of market risk management is to manage the risks resulting from changes in market
93

Qualitative Disclosures Under Pillar III of Basel IIFor The Year Ended December 31, 2012
factors so that they are maintained at acceptable levels and in line with the overall risk management policy of the Bank. The Bank has established a market risk management policy and specified market risk measurements and limits in accordance with the nature and complexities of its financial activities. The Asset-Liability Management Committee, Treasury and Investment Group, and the Market Risk Department are mainly responsible for managing, monitoring, and controlling this risk in accordance with policy.
Liquidity risk in the banking book is routinely monitored through liquidity risk limits based on short-term and long-term maturities, loan-to-deposit ratios, and SAMA liquidity ratios. The Bank manages it’s liquidity through the domestic money markets including swaps and repo markets, and through international money markets such as US dollar and GCC markets.
Diversification of funding is an important component of the Bank’s liquidity management strategy. The two largest components of customer deposits include time deposits and commodity deposits. The Bank conducts liquidity-risk stress tests whereby the stress scenarios incorporate both internal and external liquidity risk factors. The stress tests carried out in 2012 showed that the Bank has continued to maintain a sufficient excess amount of liquidity in various stressed scenarios.
Interest Rate Risk in the Banking BookInterest rate risk in the banking book (IRRBB) is the exposure of the Bank’s financial position to adverse movements in interest rates. Changes in interest rates affect earnings by changing its net interest income and also affect the underlying value of assets, liabilities and off-balance sheet financial instruments. The main sources of interest rate risk are repricing risk, yield curve risk, basis risk, and optionality risk.
The Bank’s interest rate risk management process includes implementation of interest rate strategies and policies, gap analysis of rate sensitive assets and liabilities in banking activities, as well as a system of internal controls and reports. In particular, they address the need for effective interest rate risk measurement, and monitoring and related control functions within the interest rate risk management process.
The Bank has introduced an Interest Rate Risk Management (IRMM) system to manage its interest rate risk and includes a set of strategies, policies, operational procedures, and control practices. The interest-rate risk in the banking book is managed through a gap limit structure and the risk on capital is managed by using economic value analysis, which is supplemented by periodic analysis of scenarios (instantaneous parallel shift of +/-100 bps and +/-200 bps to the yield curve) to capture the extreme indicative measures of net interest income to interest rate changes.
The Bank actively manages interest rate risk in the banking book based on interest rate maturity limits approved by ALMAC. All interest rate sensitive assets and liabilities are segregated according to their appropriate interest re-pricing maturity dates and currency and managed accordingly.
The Bank monitors potential long-term effects of changes in interest rates on the present value of all future cash flows by using economic value analysis to analyze and measure the risk on capital.
To hedge and minimize interest risk and take advantage of interest rate movements, the Bank uses approved hedging products and strategies to periodically rebalance assets and liabilities to bring interest rate sensitive positions within desired tolerance levels.
Equity Price Risk in the Banking Book Substantially all of the equities in the banking book are actively quoted on the local stock exchange on a daily basis and are liquid. A minimal portion of the equity investment portfolio is not actively traded.
Investments in associates are strategic in nature and are accounted for using the equity method of accounting.
94

Qualitative Disclosures Under Pillar III of Basel IIFor The Year Ended December 31, 2012
Operational Risk ManagementThe Bank manages Operational Risk, as defined in the Basel II accord. Operational Risk is defined as the risk of loss resulting from inadequate or failed internal processes, people and systems or from external events. Operational Risk includes Legal Risk but excludes Strategic and Reputational Risks.
Strategies and Processes
The Bank’s Operational Risk Management Framework approved by the Board provides a structured approach to identify, assess, monitor, and control operational risk through:
• Conducting Risk and Control Self-Assessment (RCSA) workshops;
• Monitoring of agreed Action Plans that have emerged as a result of RCSA workshops;
• Maintaining operational risk loss event databases for analysis and reporting;
• Implementing and monitoring of Key Risk Indicators; and
• Creating awareness about the operational risk management among the Bank employees;
An operational risk appetite matrix is also used for monitoring operational risk losses on an ongoing basis.
The key components of this framework are comprehensively documented through approved policies and procedures.
Structure and Organization of Operational Risk Management Function
ALMAC has the overall responsibility of supervising the implementation of the operational risk framework across the Bank.
The Operational Risk Management Department (ORMD) functions as part of the Risk Management Group. The Bank has adopted a structured and proactive approach for the management of operational risks. The ORMD is subject to regular reviews by the Bank’s Internal Audit Department.
Scope and Nature of the Operational Risk Management Function
The ORMD collects data related to operational losses from day-to-day operations and feeds it into the Operational Risk Management system. This covers activities such as:
• Feeding the results of RCSA workshops for risk and control assessment;
• Providing follow-up on actions and losses;
• Maintaining an Operational Risk Loss Event Database;
• Generating various standard reports for monitoring and control; and
Any new products of the Bank are assessed for inherent operational risks. The Bank’s insurance contracts are also subject to ORMD review on an annual basis. Finally, the outsourcing contracts of the Bank are reviewed by the ORMD from an operational risk perspective.
The Bank is currently using the Basic Indicator Approach of the Basel II Accord to arrive at the Operational Risk Capital Charge. This is calculated by taking 15% of the average gross income of the Bank for the last three years, as defined under section 650 of Basel II Accord in the SAMA Basel II guidelines.
95
