the sustainable development strategy of the municipal ... la rocque... · the sustainable...
TRANSCRIPT
Woodrow Wilson International Center for Scholars
Washington, D.C.
The Sustainable Development Strategy of the
Municipal Government of Rio de Janeiro
Eduarda de La Rocque
Petras Shelton-Zumpano
Prepared for and presented at the seminar, “Citizen Security in Brazil:
Progress and Challenges,” organized by the Woodrow Wilson
International Center for Scholars in Washington D.C., 28 March 2014.
Washington, D.C.
August 2014
Abstract: The purpose of this article is to describe the conception of sustainable development and its associated
model of urban revitalisation, enshrined in the strategic development plan of the municipal government of Rio
de Janeiro. Good governance, economic, social and environmental development were included in the plan as
pillars of municipal development. Indicators of performance in each of these dimensions are analyzed, and an
examination is made of the hypothesis that good governance is an indispensable requirement for sustainable
municipal development. Based on international and local evidence, the article proposes that achieving
sustainable development goals is facilitated substantially by multi-sector partnerships with mechanisms for
citizen participation.
2
Rio de Janeiro’s Vision for Sustainable Development and its Municipal Strategic Plan1
By many accounts the municipal government of Rio de Janeiro has become one of the leaders of local
governments in the global South for discussions on sustainable development. In 2012, the city hosted
the most important sustainable development summit, the United Nations Conference on Sustainable
Development (Rio+20). The outcome document of the conference, “The Future We Want”2,
established a common global vision that has framed Rio de Janeiro’s development agenda and the
policies of the municipal government. This vision conceives poverty eradication as one of the most
important overarching objectives and essential requirements of sustainable development, along with
the need for profound changes in patterns of consumption and production, and the protection of
natural resources.
The economic, social and environmental pillars of sustainable development outlined by the
Brundtland Commission in 1987 were reasserted at the Rio+20 Conference. The United Nations
Sustainable Development Solutions Network (SDSN)3 and the United Nations Development
Programme (UNDP)4 propose a fourth pillar, good governance, not only of public administration but
also of the alliances established between people, governments, civil society and the private sector,
including those prescribed by the Rio+20 outcome document. Reflecting this global agenda, the
municipal government of Rio de Janeiro implemented a results-based public management model
based on four-year strategic plans, fostering meritocratic culture, efficiency and the accomplishment
of developmental goals5. Many of the targets and indicators of the 2013-2016 municipal plan,
particularly those related to public management, were influenced by good governance guidelines
proposed by the global sustainable development community. In order to improve practices related to
governance, municipal officials take part in several global networks of policy experts and
development stakeholders, such as the multi-sector UN-SDSN. Following the global inauguration of
the SDSN by UN Secretary-General Ban Ki Moon in 2012, a Brazilian session was launched in Rio
de Janeiro in March 2014. The Brazilian SDSN is co-hosted by the municipal government of Rio de
Janeiro, represented by the Pereira Passos Institute (IPP-Rio), Conservation International, the Federal
Rural University of Rio de Janeiro and the Federal University of Rio de Janeiro. Taking part in these
networks has helped members to mobilize resources and rapidly exchange information,
methodologies and technologies.
A Window of Opportunity for Urban Revitalization
The municipal strategic plan for Rio de Janeiro implemented between 2009 and 2012 was launched in
the midst of a global financial crisis, but local political and economic conditions presented a window
of opportunity for accelerated growth and sustainable development. Several indicators of municipal
1 Isadora Araújo provided excellent research assistance, Bárbara Caballero, Felipe Lins, Fernando Cavallieri,
Jennifer Asman, Julia Daniel, Katcha Poloponsky and Luis Valverde, from the Pereira Passos Institute, read
through several versions and contributed with invaluable suggestions. 2 UN General Assembly Resolution 66/288, The Future We Want, UN Doc A/RES/66/288 (27 July 2012),
https://rio20.un.org/sites/rio20.un.org/files/a--‐conf.216l--‐1_english.pdf 3 Leadership Council of the Sustainable Development Solutions Network, An Action Agenda for Sustainable
Development: report for the UN Secretary-General (2014), http://unsdsn.org/wp-
content/uploads/2013/06/140505-An-Action-Agenda-for-Sustainable-Development.pdf 4 UNDP, Governance for Sustainable Development: Integrating Governance in the Post-2015 Development
Framework (2014), http://www.undp.org/content/dam/undp/library/Democratic%20Governance/Discussion-
Paper--Governance-for-Sustainable-Development.pdf 5 Evans, P. & Rauch, J. E., “Bureaucracy and Growth: A Cross-National Analysis of the Effects of ‘Weberian’
State Structures on Economic Growth” American Sociological Review (1999), 64(5): 748–65,
http://homepage.ntu.edu.tw/~kslin/macro2009/Evans%20and%20Rauch%201999.pdf
3
economic output reinforced optimism, as well as the prospect of a potentially huge oil production
increase off the coast of Rio de Janeiro state6. Shortly after the election of Mayor Eduardo Paes in
2009, a new period of political alignment began between the three spheres of government, federal,
state and municipal, bolstering urban regeneration7. The city has also benefited from global visibility,
strengthened branding and an increase in capabilities to influence agendas in international arenas8. In
2010 the city hosted the 5th World Urban Forum, in 2011 it hosted the World Economic Forum on
Latin America, in 2012 Rio+20, in 2013 the FIFA Confederations Cup and World Youth Day, in 2014
the FIFA World Cup, in 2015 the city celebrates its 450th year, and in 2016 the Summer Olympics
will be held.
Mega-event impacts have been categorized as short-term or long-term, and visible or invisible9.
Among the most visible short-term benefits are World Cup and Olympic employment, community
development, upgrading of sports infrastructure and revenue from the actual games. Long-term
benefits include urban infrastructure, sports facilities, housing, an increase in tourism and the
expansion of volunteering organizations. However, long-term visible impacts can also include
significant increases in the cost of living, which can be detrimental for the most vulnerable
communities. In addition to visible impacts, invisible impacts, both positive and negative, affect
mega-event legacies. In the short-term, city and regional branding and political will for deeper urban
transformations can be strengthened, but resources have to be displaced from other demands in order
to underwrite mega-game investments. Social legacies depend on the effective management of these
displacements and of the impact of inflation on lower income groups. Revenues from mega-events
usually cover operational costs, but expenditures on infrastructure might not be recovered if demand
is much lower than the supply, therefore legacies have to be designed in harmony with long-term city
development plans 10
.
Public perceptions regarding displacement of expenditures caused by mega-events contributed to
social unrest in Rio. In June 2013 over 1.5 million people took to the streets in Brazil with several
demands relating to sustainable development. Public transport, health and education services were
among the main grievances, but more than 30 percent of protestors interviewed by researchers
mentioned the World Cup legacy11
. In the national media, there were many reports that the streets of
6 Governo do Estado do Rio de Janeiro. Pré-sal: de quanto estamos falando? Uma Análise macroeconômica da
produção potencial dos campos do Présal brasileiro, Subsecretaria de Estudos Econômicos do Estado do Rio de
Janeiro (2010), http://www.fazenda.rj.gov.br/sefaz/content/conn/UCMServer/uuid/dDocName%3A1724036 7 Souza, Alessandra Augusta; La Rocque, Eduarda & Boavista, José Marcelo Souza, “Revitalizando a Economia
do Município do Rio de Janeiro: O Mercado Financeiro” Texto Preliminar para Discussão (No. 03, Maio),
Secretaria Municipal da Fazenda do Rio de Janeiro (2011), pp.3,
http://www.rio.rj.gov.br/dlstatic/10112/1753111/DLFE-228114.pdf/TDSMF.pdf 8 Federal University of Rio de Janeiro/COPPE/SAGE, Olympic Games Impact (OGI) Study - RIO 2016:
Relatório inicial (R1) do Estudo dos impactos e do legado dos Jogos Rio 2016. Rio de Janeiro: Comitê
Organizador dos Jogos Olímpicos e Paralímpicos Rio 2016 (2014), pp.20,
http://www.brasil2016.com/sites/default/files/parceiros/ogi_rio_2016_r1_br2_0.pdf 9 Poynter, Gavin, “From Beijing to Bow Bells: Measuring the Olympics Effect” London East Research Institute
- Working Papers in Urban Studies (March 2006),
http://www.uel.ac.uk/londoneast/research/FromBeijingtoBowBells.pdf 10
Solberg, Harry Arne & Preuss, Holger, "Major Sport Events and Long-Term Tourism Impacts" Journal of
Sport Management (2007), 21, 213-234,
http://wspahn.camel.ntupes.edu.tw/ezcatfiles/t063/download/attdown/0/event%20long%20term%20tourism%20
JSM%202007.pdf 11
IBOPE Inteligência, Pesquisa de opinião pública sobre os manifestantes, 20 de Junho (2013),
http://especial.g1.globo.com/fantastico/pesquisa-de-opiniao-publica-sobre-os-manifestantes/
4
Rio de Janeiro attracted over 300,000 people, one of the largest protests in Brazilian history. Rio de
Janeiro is a national capital, its citizens are highly politicised and civil society is very active. These
characteristics represent an opportunity for multi-sector sustainable development alliances to benefit
from citizen participation.
Good Governance: Foundation of Sustainable Development
Governance has been described as a fourth pillar of sustainable development but also as its foundation
and pre-requisite. The United Nations Human Settlements Programme (UN-Habitat) has suggested
that the following are components of good governance: citizen participation, results-based
management, decentralisation, accountability and transparency, gender equality and inter-municipal
cooperation, both national and international12
. In 2012, Rio de Janeiro Mayor Eduardo Paes began a
revision of the 2009-2012 strategic plan, an important instrument for transparency and results-based
management. It was concluded that more than 80 percent of targets had been met and a new 2013-
2016 strategic plan was formulated, with a vision for 2030. Transforming Rio into the best city in the
southern hemisphere to live and work is the overarching objective of the new plan, which aims to
eradicate extreme poverty and inequality in Rio, while turning the city into the state capital in Brazil
with the best public education and health systems.
A survey of the opinions of one thousand citizens was carried out and approximately one hundred
municipal civil servants invested more than 2000 hours of work, in collaboration with the professional
services firm McKinsey, to formulate the new strategic plan for 2013-2016. The plan is comprised of
56 targets, including an ambitious one for housing deficit reduction, and a four-year investment
budget of BRL 38.6 billion, equivalent to approximately USD 17 billion. The municipal treasury will
provide around 60% of the budget. The remainder is being met with external sources, such as
concessions, public private partnerships (PPPs), intergovernmental transfers and loans. As part of the
municipal system for project management and target monitoring (SMGPM), a results-based
management model, analysts were stationed in each department of the executive to feed the system
coordinated by the Chief of Staff’s Office.
An important mechanism for citizen participation established in Rio de Janeiro in 2011 was the
central city services telephone contact centre and online site 1746. In 2013, 3.5 million requests were
received and the target set in the strategic plan for the year 2016 was surpassed. Nonetheless the
integration of remote and walk-in citizen contact services remains a challenge. The strategic plan also
addresses decentralisation, aiming to turn all of the city’s 33 regional administration headquarters into
fully equipped self-service contact centres.
The city is active in several inter-municipal cooperation mechanisms, most notably as chair of the
C40 Cities Climate Leadership Group. It also sponsors the BRICS Policy Centre, one of the top think
tanks in the world for research on governance in emerging economies. Very few local governments in
Brazil have dedicated planning institutes. The city planning Pereira Passos Institute (IPP-Rio) has a
mandate to monitor and formulate several of Rio de Janeiro’s development indicators and to update
official geographical data. Working collaboratively with the United Nations Human Settlements
Programme (UN-Habitat) and with organizations from many sectors, IPP-Rio collects, processes and
analyses information on local sustainable urban development.
12
UN-Habitat, State of Latin American and Caribbean cities: towards a new urban transition, United Nations
Human Settlement Programme (2012),
http://mirror.unhabitat.org/pmss/getElectronicVersion.aspx?nr=3386&alt=1
5
Peace and Security: Key Components of Governance
There is a worldwide growing recognition that good governance requires peace and security, which
should be a priority for all levels of government and a target of multi-sector strategies13
. The UN
System Task Team on the Post-2015 UN Development Agenda14
called for the inclusion of peace and
security as major components of development. This call has been echoed by public security specialists
in Brazil15
. Urban insecurity has become a major impediment for effective governance, particularly in
slums and informal settlements that have been dominated by criminal gangs over the past decades. In
many favelas gangs targeted resident associations and local leaders, restricting community
mobilization, mobility and the provision of services.
In December 2008, the state government of Rio de Janeiro inaugurated in Santa Marta favela the first
pacifying police unit (UPP) of the new community and proximity policing model for slums. The
pacification policy receives financial support from the municipal government and from the private
sector. According to the online database of the Institute of Public Security of Rio de Janeiro (ISP-RJ),
the number of homicides decreased substantially in the city of Rio de Janeiro following the
introduction of the UPP model, from 2,336 in 2007 to 1,206 in 2012. The homicide rate decreased -25
percent from 2009 to 2010. From 2010 to 2012 the declining trend continued at a slower pace. The
trend was reverted in 2013 by a 10 percent rise in murders, but despite recent increases in crime, pre-
pacification levels were undeniably worse. Specialists estimate that around 5,000 murders were
prevented since the inauguration of the pacifying police units16
. Many people believe that security
improvements have had spill over effects on the quality of governance and of life conditions.
Rio+Social: Good Governance of Favelas with UPP Police Stations
With the objective of helping the state government to consolidate pacification policing, the municipal
government of Rio de Janeiro, represented by IPP-Rio, established an international technical
cooperation project with UN-Habitat. The UPP Social project was piloted in 2010, formally launched
in 2011, and renamed Rio+Social in 2014. During its inception, the project was influenced by UN-
Habitat’s Safer Cities Programme, which has been in operation since 1996 and was recently expanded
into a Global Network of Safer Cities. This network emphasises the need for a holistic notion of
safety that draws attention to four key factors of contemporary crime prevention strategies: (1) the
degree of social cohesion, (2) the extent of urban inequalities, (3) the risks of the built environment,
and (4) the scope of inclusiveness in urban governance17
.
13
World Bank, Making Brazilians Safer: analyzing the dynamics of violent crime. Washington, D.C.: World
Bank (2013),
http://wwwwds.worldbank.org/external/default/WDSContentServer/WDSP/IB/2013/03/15/000442464_2013031
5123229/Rendered/PDF/707640ESW0REVI0ics0of0Violent0Crime.pdf 14
UN System Task Team on the Post-2015 UN Development Agenda, Realizing the Future We Want for All,
Report to the Secretary-General (2012),
http://www.un.org/en/development/desa/policy/untaskteam_undf/untt_report.pdf 15
Ricardo, Carolina et al.,“Promoção da paz, segurança, justiça e governança na agenda de desenvolvimento
pós-2015: declaração de especialistas em segurança pública”, Fórum Brasileiro de Segurança Pública
(2014),http://www.forumseguranca.org.br/storage/download/post2015%20narrative%20(portuguese)%20july14
%202014-ef2.pdf 16
Zachhi, José Marcelo; Strozenberg, Pedro & Ramos, Silvia, "Nova etapa nas UPPs: É preciso consolidar uma
polícia democrática" O Globo (21/05/2014), http://oglobo.globo.com/opiniao/nova-etapa-nas-upps-12549078 17
Velasquez, Elkin, “Prolegomena: urban development as urban safety” in UN-HABITAT (Ed.) Urban Safety
through Slum Upgrading. Nairobi: United Nations Human Settlements Programme (2012).
6
The Rio+Social program has a territorial management team that operates in the pacified favelas of
municipal Rio de Janeiro on a permanent basis, strengthening networks, social cohesion and social
capital. By late 2014, around 770,000 people lived in communities with Rio+Social coverage,
corresponding to 12 percent of the city population, just over half of the city’s slum residents. The
territorial team is comprised of field workers that produce data and engage residents, community
based organisations and public administrators in multi-sector partnerships. It includes a mobilizations
and partnerships unit, to incubate sustainable development projects with civil society and the private
sector, and a network development working group that carries out research and promotes
collaboration and knowledge transfer in the territories.
Reducing urban inequalities, particularly of access to public services, is a primary concern of all three
core units of Rio+Social, the territorial, information and institutional management teams. The
information management team processes data on public services collected by the territorial team,
updating the city’s publicly available maps and databases. The institutional management team
coordinates relations and facilitates connections and partnerships between the various municipal
government departments in order to improve the quality and efficiency of public expenditures in
favelas. The City Information Department of IPP-Rio, with the support of the Rio+Social information
and institutional management teams, updates the official map of municipal investments and facilities
in favelas and surrounding areas, which in 2014 included interactive tags, contact details and
statistical data of 549 schools, hospitals and other municipal services18
. Another important component
of the inequality reduction strategy is training for local residents. In order to offer this service, multi-
sector partnerships have been established with several government departments, companies and
academic centres.
The program generates data on risks related to the built environment, which affect living conditions,
social cohesion and urban inequalities. A rapid participatory mapping (MRP) methodology is
employed annually to generate information on public infrastructure and the quality of the built
environment in pacified slums. Indicators are compiled on landslides and geological risks, drainage
and sanitation infrastructure, street lighting and other components of the built environment. The
program supports slum upgrading policies by providing the housing, civil defence and dozens of other
departments with data on favela settlements and with access to networks and partnerships.
Cooperating with the state government of Rio de Janeiro, the utility company Light and several other
organizations, IPP-Rio took part in the creation of a multi-sector participatory governance mechanism
called Travessias for the community-led management of sports facilities in favelas. The partnership
established to implement this mechanism, improve the urban environment and reduce inequality of
access to healthy activities leveraged investments from the public and the private sectors. Inclusive
governance and community participation are among the most important objectives and methods of
Rio+Social. They are reflected in the territorial and participatory nature of implemented projects.
The Economic Pillar of Sustainable Development
Until recently, the municipality of Rio de Janeiro did not perform well in traditional economic terms.
An important leader of the city’s business community highlighted that from 1976 to 2006 real GDP
was stagnant19
. In 1999 the city of Rio de Janeiro accounted for 6.8 percent of the national economy,
18
Rio+Social: Mapa Interativo de Equipamentos Públicos em Favelas Pacificadas e Entorno (2014),
http://www.rio.rj.gov.br/web/ipp/riomaissocial 19
Alqueres, José Luiz, “A evolução do ambiente de negócios no Rio de Janeiro” in Urani, André & Giambiagi,
Fabio (Eds.) Rio: a hora da virada. Rio de Janeiro: Elsevier (2011), pp. 60-72.
7
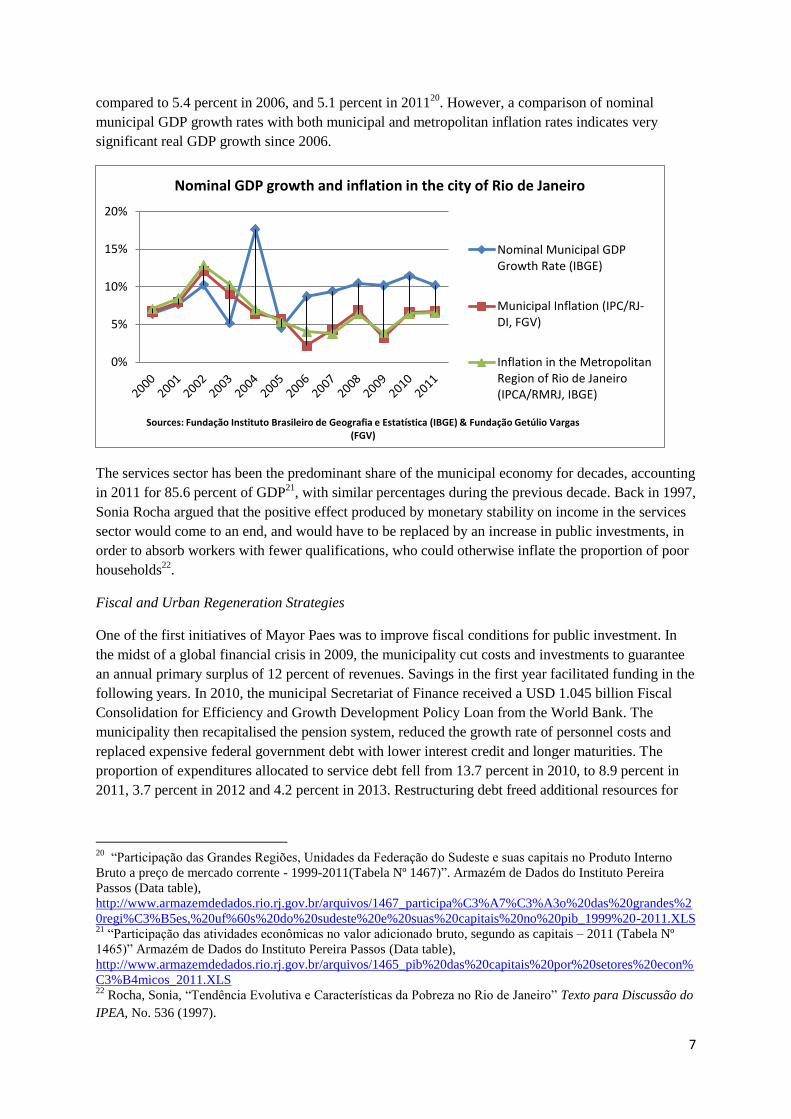
compared to 5.4 percent in 2006, and 5.1 percent in 201120
. However, a comparison of nominal
municipal GDP growth rates with both municipal and metropolitan inflation rates indicates very
significant real GDP growth since 2006.
The services sector has been the predominant share of the municipal economy for decades, accounting
in 2011 for 85.6 percent of GDP21
, with similar percentages during the previous decade. Back in 1997,
Sonia Rocha argued that the positive effect produced by monetary stability on income in the services
sector would come to an end, and would have to be replaced by an increase in public investments, in
order to absorb workers with fewer qualifications, who could otherwise inflate the proportion of poor
households22
.
Fiscal and Urban Regeneration Strategies
One of the first initiatives of Mayor Paes was to improve fiscal conditions for public investment. In
the midst of a global financial crisis in 2009, the municipality cut costs and investments to guarantee
an annual primary surplus of 12 percent of revenues. Savings in the first year facilitated funding in the
following years. In 2010, the municipal Secretariat of Finance received a USD 1.045 billion Fiscal
Consolidation for Efficiency and Growth Development Policy Loan from the World Bank. The
municipality then recapitalised the pension system, reduced the growth rate of personnel costs and
replaced expensive federal government debt with lower interest credit and longer maturities. The
proportion of expenditures allocated to service debt fell from 13.7 percent in 2010, to 8.9 percent in
2011, 3.7 percent in 2012 and 4.2 percent in 2013. Restructuring debt freed additional resources for
20
“Participação das Grandes Regiões, Unidades da Federação do Sudeste e suas capitais no Produto Interno
Bruto a preço de mercado corrente - 1999-2011(Tabela Nº 1467)”. Armazém de Dados do Instituto Pereira
Passos (Data table),
http://www.armazemdedados.rio.rj.gov.br/arquivos/1467_participa%C3%A7%C3%A3o%20das%20grandes%2
0regi%C3%B5es,%20uf%60s%20do%20sudeste%20e%20suas%20capitais%20no%20pib_1999%20-2011.XLS 21
“Participação das atividades econômicas no valor adicionado bruto, segundo as capitais – 2011 (Tabela Nº
1465)” Armazém de Dados do Instituto Pereira Passos (Data table),
http://www.armazemdedados.rio.rj.gov.br/arquivos/1465_pib%20das%20capitais%20por%20setores%20econ%
C3%B4micos_2011.XLS 22
Rocha, Sonia, “Tendência Evolutiva e Características da Pobreza no Rio de Janeiro” Texto para Discussão do
IPEA, No. 536 (1997).
0%
5%
10%
15%
20%
Sources: Fundação Instituto Brasileiro de Geografia e Estatística (IBGE) & Fundação Getúlio Vargas (FGV)
Nominal GDP growth and inflation in the city of Rio de Janeiro
Nominal Municipal GDPGrowth Rate (IBGE)
Municipal Inflation (IPC/RJ-DI, FGV)
Inflation in the MetropolitanRegion of Rio de Janeiro(IPCA/RMRJ, IBGE)
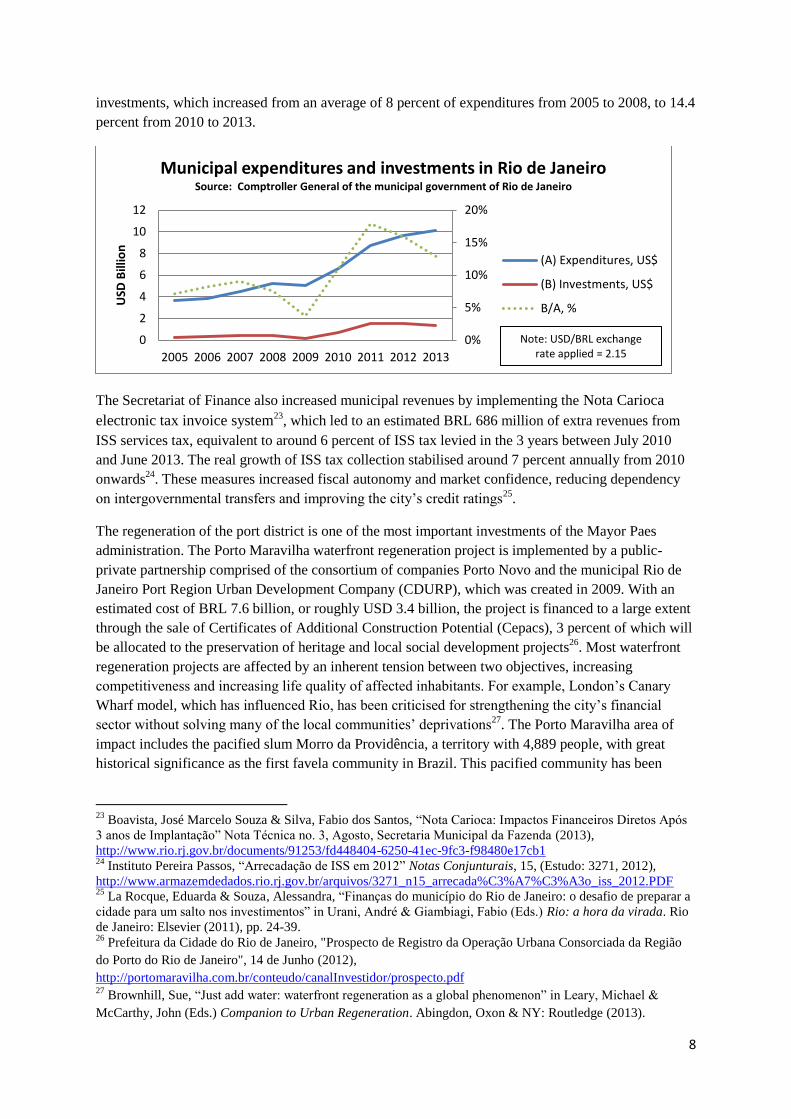
8
investments, which increased from an average of 8 percent of expenditures from 2005 to 2008, to 14.4
percent from 2010 to 2013.
The Secretariat of Finance also increased municipal revenues by implementing the Nota Carioca
electronic tax invoice system23, which led to an estimated BRL 686 million of extra revenues from
ISS services tax, equivalent to around 6 percent of ISS tax levied in the 3 years between July 2010
and June 2013. The real growth of ISS tax collection stabilised around 7 percent annually from 2010
onwards24
. These measures increased fiscal autonomy and market confidence, reducing dependency
on intergovernmental transfers and improving the city’s credit ratings25
.
The regeneration of the port district is one of the most important investments of the Mayor Paes
administration. The Porto Maravilha waterfront regeneration project is implemented by a public-
private partnership comprised of the consortium of companies Porto Novo and the municipal Rio de
Janeiro Port Region Urban Development Company (CDURP), which was created in 2009. With an
estimated cost of BRL 7.6 billion, or roughly USD 3.4 billion, the project is financed to a large extent
through the sale of Certificates of Additional Construction Potential (Cepacs), 3 percent of which will
be allocated to the preservation of heritage and local social development projects26
. Most waterfront
regeneration projects are affected by an inherent tension between two objectives, increasing
competitiveness and increasing life quality of affected inhabitants. For example, London’s Canary
Wharf model, which has influenced Rio, has been criticised for strengthening the city’s financial
sector without solving many of the local communities’ deprivations27
. The Porto Maravilha area of
impact includes the pacified slum Morro da Providência, a territory with 4,889 people, with great
historical significance as the first favela community in Brazil. This pacified community has been
23
Boavista, José Marcelo Souza & Silva, Fabio dos Santos, “Nota Carioca: Impactos Financeiros Diretos Após
3 anos de Implantação” Nota Técnica no. 3, Agosto, Secretaria Municipal da Fazenda (2013),
http://www.rio.rj.gov.br/documents/91253/fd448404-6250-41ec-9fc3-f98480e17cb1 24
Instituto Pereira Passos, “Arrecadação de ISS em 2012” Notas Conjunturais, 15, (Estudo: 3271, 2012),
http://www.armazemdedados.rio.rj.gov.br/arquivos/3271_n15_arrecada%C3%A7%C3%A3o_iss_2012.PDF 25
La Rocque, Eduarda & Souza, Alessandra, “Finanças do município do Rio de Janeiro: o desafio de preparar a
cidade para um salto nos investimentos” in Urani, André & Giambiagi, Fabio (Eds.) Rio: a hora da virada. Rio
de Janeiro: Elsevier (2011), pp. 24-39. 26
Prefeitura da Cidade do Rio de Janeiro, "Prospecto de Registro da Operação Urbana Consorciada da Região
do Porto do Rio de Janeiro", 14 de Junho (2012),
http://portomaravilha.com.br/conteudo/canalInvestidor/prospecto.pdf 27
Brownhill, Sue, “Just add water: waterfront regeneration as a global phenomenon” in Leary, Michael &
McCarthy, John (Eds.) Companion to Urban Regeneration. Abingdon, Oxon & NY: Routledge (2013).
0%
5%
10%
15%
20%
0
2
4
6
8
10
12
2005 2006 2007 2008 2009 2010 2011 2012 2013
USD
Bill
ion
Municipal expenditures and investments in Rio de Janeiro Source: Comptroller General of the municipal government of Rio de Janeiro
(A) Expenditures, US$
(B) Investments, US$
B/A, %
Note: USD/BRL exchange rate applied = 2.15
9
serviced since 2010 by UPP Social and Rio+Social, which seeks to reduce the tension between those
two objectives.
Poverty and Inequality
In spite of investments and real income growth, the municipal economy of Rio de Janeiro has been
characterised in the most recent years by diminishing but substantial poverty and mounting income
inequality. According to the Atlas of Human Development in Brazil28
, poor people and extremely
poor people in Rio de Janeiro represented, respectively, 5 percent and 1.25 percent of the total
population in 2010, compared to 8.85 percent and 2.2 percent in 2000, or 14.1 percent and 4 percent
in 1991. However, 4.3 percent of households declared in 2010 that they did not have any sources of
income other than government cash-transfer programs29
. Although many households are likely to have
omitted income, this indicates that the extremely poor population in 2010 could be larger than 1.25
percent. Moreover, the Pereira Passos Institute (IPP-Rio)30
highlights that 20.7 percent of the
population in Rio de Janeiro lived in households with per capita income of less than half the minimum
wage, roughly equivalent to $6 a day considering the World Bank’s Purchasing Power Parity
conversion factor for 2010. Earning half of that, 9.2 percent of the population in 2010 survived on less
than a quarter of the Brazilian minimum wage per capita, or $3 a day, compared to 16.2 percent in
Brazil and 9.6 percent in São Paulo. The median poverty line for all developing countries is
approximately $2 a day31
. In the slums of Rio de Janeiro non-work related income and distribution
policies such as the Bolsa Família and Cartão Família Carioca play an important role in poverty
reduction32
.
While poverty is undeniably shrinking, inequality in the municipality has risen slightly. According to
the Brazilian federal government33
, between 1990 and 2011 the Brazilian Gini coefficient fell from
0.607 to 0.527, reaching its lowest point since 1960, to a large extent due to cash transfer policies
such as the Bolsa Familia program. By contrast, from 1991 to 2000 the Gini coefficient for the city of
Rio de Janeiro increased from 0.6092 to 0.6150, and then to 0.6391 in 2010, placing it among the
most unequal cities in the country34
. Inequality is very evident comparing slums to the rest of the city.
In 2010, 12.8 percent of households in pacified slums earned less than $3 per capita a day and 34.5
28
United Nations Development Programme, Institute for Applied Economic Research & João Pinheiro
Foundation, “Profile: Rio de Janeiro, RJ” in Atlas of Human Development in Brazil. Brasilia: PNUD, IPEA &
FJP (2013), http://www.atlasbrasil.org.br/2013/en/perfil/rio-de-janeiro_rj. 29
"Domicílios particulares permanentes por classes de rendimento nominal mensal domiciliar per capita,
segundo as Áreas de Planejamento, Regiões Administrativas e Bairros - Município do Rio de Janeiro - 2010,
(Tabela 3148)”. Armazém de Dados do Instituto Pereira Passos (Data table),
http://www.armazemdedados.rio.rj.gov.br/arquivos/3148_domic%C3%ADlios%20por%20classes%20de%20re
ndimento.XLS 30
Instituto Pereira Passos, "Renda e Posse de Bens" Cadernos do Rio, Junho, (2013),
http://www.armazemdedados.rio.rj.gov.br/arquivos/3293_distribuicao_renda_posse_bens.PDF 31
Chen, Shaohua & Ravaillon, Martin, "An update to the World Bank’s estimates of consumption poverty in the
developing world". Development Research Group, World Bank (2012),
http://siteresources.worldbank.org/INTPOVCALNET/Resources/Global_Poverty_Update_2012_02-29-12.pdf 32
Paes de Barros, Ricardo & Pero, Valéria, “Pobreza no Rio de Janeiro: tendências recentes e desafios para o
futuro” in Urani, André & Giambiagi, Fabio (Eds.) Rio: a hora da virada. Rio de Janeiro: Elsevier (2011), pp
191-212. 33
IPEA, “A década inclusiva (2001-2011): desigualdade, pobreza e políticas de renda” Comunicados do IPEA,
No. 155, 25 de Setembro, (2012),
http://www.ipea.gov.br/agencia/images/stories/PDFs/comunicado/120925_comunicadodoipea155_v5.pdf 34
IBGE Censo Demográfico, “Índice de Gini da renda domiciliar per capita – Rio de Janeiro”, IBGE (2010).
10
percent earned less than $6, compared to 7.7 percent and 18.5 percent, respectively, in the rest of the
city35
.
The connection between the pacification policy and house prices in Rio de Janeiro demonstrates the
linkages between the different dimensions of sustainable development. Frischtak and Mandel suggest
that the arrival of UPPs account for 15 percent of price growth in the formal property markets in Rio
de Janeiro between 2008 and mid-201136
. Data on property price growth in favelas was not included
in their study but was expected to be even greater than in adjacent neighbourhoods. The Gini
coefficient for house prices in their model fell from 0.280 to 0.265 from the end of 2008 to mid-2011,
indicating a reduction in price inequality across the city. They suggest that properties with the lowest
prices could benefit comparatively more from the valuation effect but highlight a wide range of price
responses, contrasting an increase of 6 percent in Batan UPP, in the West Zone, with 21 percent in
Chapéu-Mangueira UPP in the wealthier South Zone. There are clear benefits for many property
owners but public administrators must also consider the impact of pacification on gentrification and
on the purchasing power of tenants. Over the course of a decade, renting residential property replaced
buying and selling as the predominant transaction in the housing market of Rio de Janeiro’s favelas37
.
This structural shift could limit the positive effect of pacification on wealth in favelas.
The Social Pillar of Sustainable Development
Rio de Janeiro’s municipal profile in the Atlas of Human Development in Brazil has improved
substantially over the course of the last two decades. The city ranks 45th
out of 5600 municipalities
measured by the national Municipal Human Development Index (M-HDI), which considers three
dimensions: longevity, education and income. Rio de Janeiro emerged from a medium level of human
development of 0.639 in 1990 to 0.799 in 2010, on the verge of being included in the category of very
high human development, above 0.8. Over the course of those two decades, Brazil went from a very
low to a high level of human development.
In order to enable local precision in planning, researchers in IPP-Rio devised a Social Development
Index (IDS), which identified variations from 2000 to 2010 of 19,258 territorial units of the
municipality38
. The IDS index is based on national census micro-data and combines indicators of
literacy, access to sanitation and waste collection, housing conditions and income. Three areas are
clearly distinguishable in the social development map of the city. The South Zone mostly has very
high levels with very few spots of lower social development. The North Zone predominantly has
households with intermediary and some with lower levels of development. The West Zone is divided
fairly equally between two halves, one with predominantly intermediary and the other with lower IDS
ratings. The West Zone had the fastest positive variation from 2000 to 2010, while the North Zone
deteriorated substantially over that decade.
35
UPP Social / IPP-Rio & UN-Habitat, “Tabela compilada UPP Social: Total e Percentual de Domicílios
Particulares por Rendimento Nominal Mensal Domiciliar Per Capita” (2014), http://www.uppsocial.org/wp-
content/uploads/2014/07/Tabela_compilada.xls. 36
Frischtak, Claudio & Mandel, Benjamin, “Crime, House Prices, and Inequality: The Effect of UPPs in Rio”
Federal Reserve Bank of New York Staff Reports, no. 542 (2012),
http://www.newyorkfed.org/research/staff_reports/sr542.pdf 37
Pulici, Andrea et al., O Impacto do Programa Favela-Bairro (PROAP III) na valorização imobiliária e na
mobilidade residencial nas favelas da cidade do Rio de Janeiro: Relatório Final. OIPSOLO/IPPUR/UFRJ &
BID (2012) 38
Cavalierri, Fernando & Lopes, Gustavo, "Índice de Desenvolvimento Social (IDS) da Cidade do Rio de
Janeiro (2000 – 2010)" Notas Técnicas do IPP-Rio, 27, Fevereiro (2014),
http://www.armazemdedados.rio.rj.gov.br/arquivos/3350_nt_27_ids0010.PDF
11
Municipal expenditures increased from BRL 10.8 billion in 2009 to BRL 21.8 in 2013 (around USD
9.7 billion) 39
. During that period, expenditures on education increased from 20 percent to 22.4 percent
of the total budget, health decreased slightly from 18.8 percent to 18.2 percent, while urbanization,
housing and sanitation increased from 12 percent to 20.8 percent. From 2009 to 2013, around USD
800 million was invested in pacified slums, primarily for urbanization and housing, but also in health
and education. Further investments of almost USD 400 million were announced for 2014-16 and
allocated primarily for education40
.
Education, Health and Housing
In 2000, 18 percent of children between the ages of 0 and 3 attended nursery school in Rio de Janeiro,
compared to 40 percent in 2010, whereas the total number of children in nursery schools funded by
the municipality increased from 43,300 in 2008 to 63,200 in May 201241
. In addition, between 2000
and 2010 the percentage of 4 and 5 year old children who went to preschool increased from 70
percent to 88 percent. However, many thousands of children are still on waiting lists to attend schools,
and some families do not even register their children on lists. Children from households identified in
surveys as black or of African-Brazilian descent have lower levels of preschool and secondary school
attendance than the city average, and secondary school attendance is lower in low-income
neighbourhoods. The rate of adult illiteracy among the black population is more than double that of
the white population, almost 4 percent compared to 1.8 percent in 2010. Alarmingly, illiteracy among
black children of the 8-9 age group was 8 percent, compared to 4 percent among white children of the
same age. Reflecting economic and ethnic inequality, illiteracy in public schools is higher than in
private schools. In relation to the 10-14 age group, the municipal government managed to reduce
functional illiteracy from 14 percent in 2008 to 4.1 percent in 2012. In addition to focusing on
illiteracy, the municipality implemented a meritocratic educational governance model throughout the
city and created the Schools of Tomorrow Program (Escolas do Amanhã), offering full-time
education, social services and new teaching methods in 151 schools in pacified communities42
.
The Atlas of Human Development in Brazil indicates that life expectancy in Rio de Janeiro increased
from 67.9 years in 1991 to 75.7 in 2010. Improvements in access to water and sanitation have had an
impact on health conditions in Rio de Janeiro. Many favelas had already undergone government
urbanization programs before pacification. According to the 2010 census 93.8 percent of households
in pacified areas had adequate sanitation, not much less than the 94.9 percent city average43
.
Rio+Social provides the municipal housing policy makers with research, analysis and strategic
coordination of stakeholders to form sustainable and enduring multi-sector partnerships. Another
significant improvement has been the infant mortality rate, which fell from 36.1 per thousand live
39
Prefeitura da Cidade do Rio de Janeiro, Prestação de Contas 2013. Rio de Janeiro: Controladoria Geral do
Município (2014) 40
Instituto Pereira Passos, “Rio+Social: Ações municipais em áreas pacificadas”, (2014),
http://www.rio.rj.gov.br/dlstatic/10112/4677271/4125271/AcoesMunicipaisemareaspacificadas.pdf 41
Instituto Pereira Passos, "Educação" Cadernos do Rio, Junho (2013),
http://www.armazemdedados.rio.rj.gov.br/arquivos/3290_educacao.PDF 42
Schwartzman, Simon, “Melhorar a educação no Rio de Janeiro: um longo caminho” in Urani, André &
Giambiagi, Fabio (Eds.) Rio: a hora da virada. Rio de Janeiro: Elsevier (2011), pp. 227-241. 43
UPP Social / IPP-Rio & UN-Habitat, “Tabela compilada UPP Social: Total e Percentual de Domicílios
Particulares Permanentes por Tipo de Esgotamento Sanitário”, (2014), http://www.uppsocial.org/wp-
content/uploads/2014/07/Tabela_compilada.xls
12
births in 1980 to 13.6 in 200944
. Road safety improvements and the reduction of homicide rates
previously discussed also helped to increase life expectancy in recent years45
. Due to the connections
between different dimensions of development, the expansion of coverage of the family health strategy
(ESF), from 7 percent of the population in 2009 to 40 percent by the end of 2012, contributed not only
to reduce death rates, but also to increase school attendance and employment46
. Increasing coverage to
70 percent was included as one of the targets of the strategic municipal plan for 2016. The city target
was already met in pacified slums in 2014, when ESF coverage reached 73 percent and 100 percent in
several communities. Nonetheless weak governance and lack of coordination between different levels
of government remains a major challenge to improvements in public health47
.
The Environmental Pillar of Sustainable Development
On a global scale, there is mounting evidence that the current economic growth model based on fossil
fuels and on unsustainable consumption patterns clashes with planetary environmental limits. There is
also evidence that beyond a certain level of income necessary to fulfil basic needs, extra income does
not substantially improve quality of life and wellbeing. Rapidly growing wealth multiplies the
environmental impacts of consumption and investments without providing proportionate benefits in
terms of wellbeing48
.
In Rio de Janeiro, climate change is a vulnerability associated with greater flood risks due to rising
sea levels, landslides due to more frequent and intense rain fall, and the spread of climate related
diseases such as dengue49
. In 2011, the municipal government prepared, in collaboration with the
British government, a Climate Vulnerability Map that revealed environmental, social, infrastructure
and economic vulnerabilities50
. Rising sea levels and meteorological tides require complex disaster
risk mitigation strategies to address the drainage system and public health. Twenty four hours a day,
the Rio Operations Centre monitors streams of data to increase municipal resilience and support
public administration. Security forces, traffic managers, fire brigades and disaster response authorities
can plan emergency responses and use a videoconference crisis room for rapid reaction. In partnership
with the state government, civil society and the private sector, the municipal government of Rio de
44
Carneiro, Alcides; Iozzi, Rosanna & Santos, Lucia, "Causa Mortis: um panorama das doenças por faixa etária
na Cidade do Rio de Janeiro - 1980 a 2009" Coleção Estudos Cariocas, No. 20130201 (2013),
http://portalgeo.rio.rj.gov.br/estudoscariocas/download/3270_CausaMortis_panorama_1980_2009.pdf. 45
"Indicadores de Saúde de Residentes no Município do Rio de Janeiro 2000-2011" Armazém de Dados do
Instituto Pereira Passos,
http://www.armazemdedados.rio.rj.gov.br/arquivos/3365_indic_nascimento%20mortalidade_mrj.PDF 46
Harzheim, Erno; Lima, Karine & Hauser, Lisiane, Reforma da atenção primária à saúde na cidade do Rio de
Janeiro - avaliação dos primeiros três anos de clínicas da família: Pesquisa avaliativa sobre aspectos de
implantação, estrutura, processo e resultados das Clínicas da Família na cidade do Rio de Janeiro. Porto
Alegre, RS: OPAS, (2013). 47
“Munoz, Flavia Poppe de,“A saúde no Rio de Janeiro: o velho compromisso pendente” in Urani, André &
Giambiagi, Fabio (Eds.) Rio: a hora da virada. Rio de Janeiro: Elsevier (2011), pp. 213-226. 48
Resende, André Lara, Os limites do possível: a economia além da conjuntura. São Paulo: Portfolio-Penguin
(2013). 49
Carbon Disclosure Project, CDP Cities 2013 Report for the City of Rio de Janeiro. London: CDP (2013), http://c40productionimages.s3.amazonaws.com/other_uploads/images/78_CDP_Cities_2013_Rio.original.pdf?1
401840553 50
Franco, Nelson Moreira, “A cidade do Rio de Janeiro no contexto das mudanças climáticas e na transição para
economia verde” Cadernos Adenauer, 13 (Edição Especial 2012), 109-124, http://www.kas.de/wf/doc/6999-
1442-5-30.pdf
13
Janeiro helped to create an Environmental Exchange to support environmental protection with
tradable instruments such as environmental reserve and emission quotas51
.
The Municipal Climate Change Policy
In 2011, Mayor Eduardo Paes approved the Municipal Climate Change and Sustainable Development
Policy, which includes a municipal plan, a forum, fiscal incentives and a dedicated fund. The policy
also sets targets to reduce greenhouse gas emissions, compared to 2005, by 8 percent in 2012, 16
percent in 2016 and 20 percent in 2020. It creates incentives for the growth of renewable energy and
Clean Development Mechanisms such as carbon credits. The action plan was revised in December
2013 by the municipal government and the Federal University of Rio de Janeiro, which coordinated
the formulation of the third greenhouse gas inventory of the municipality52
. This inventory was one of
thirty around the world devised in collaboration with the World Resources Institute, C40 and ICLEI –
Local Governments for Sustainability, to pilot the Global Protocol for Community-scale Greenhouse
Gas Emissions.
According to the inventory, emissions in Rio de Janeiro doubled from 2005 to 2012, reaching 24,269
Gg CO2e. The majority of the increase in emissions came from the energy sector, which had 105 percent
more emissions in 2012 than in 2005, increasing its total share of emissions from 75 percent to 79
percent. Transport is the most polluting energy subsector. From 2005 to 2012 transport emissions
increased 23 percent, although their share of total emissions actually fell from 47 percent to 30
percent. Emissions from industrial processes, excluding those resulting from energy supplies,
increased 475 percent over the course of seven years. They accounted for almost 11 percent of city
emissions, compared to 4 percent in 2005. By contrast, emissions from waste in 2012 accounted for
10 percent of city emissions, compared to 19 percent in 2005.
Climate Change Mitigation and Adaptation Strategies
Reforming the transport sector is one of the strategies included in the municipal plan to reduce
emissions. An increase in the number of users of mass transit systems is planned, from 18 percent of
the population in 2011 to 60 percent in 2016, corresponding to 4 million people. Addressing the
transport system is the largest contribution towards reaching the emissions target. Other projects
include the expansion of cycling routes, from 150km to 450km by 2016, the Bairro Maravilha
program, which is upgrading public lighting and reducing energy use, the 500,000 new trees initiative
and the reforestation program, which is set to complete 1,700 hectares by 2016.
In terms of waste management, the strategic plan includes a significant expansion of sanitation in
planning area five (AP5), the West Zone, and aims to collect 25 percent of all recyclable waste by
2016. The municipal conservation department and its urban waste company Comlurb often cooperate
with the Pereira Passos Institute (IPP-Rio) to plan garbage collection and maintenance logistics in
favelas. The waste management policy Vamos Combinar was implemented as a multi-sector
partnership and originated from collaboration between Rio+Social, at the time called UPP Social,
51
Rio de Janeiro Environmental Exchange, Operational Report 2011-2013. Rio de Janeiro: BVRio (2014),
http://www.bvrio.org/site/images/publicacoes/relatorio2013_ing_04.pdf. 52
Centro Clima, Inventário das emissões de gases do efeito estufa da cidade do Rio de Janeiro em 2012 e
atualização do plano de ação municipal para redução de emissões: resumo técnico. Rio de Janeiro: Municipal
Secretariat of the Environment & The Centre for Integrated Studies on Climate Change and the Environment of
the Federal University of Rio de Janeiro (2013),
http://www.rio.rj.gov.br/dlstatic/10112/1712030/4114528/CRJ_InventarioGEE2012_resumo_tecnicoPORTUG
UESFINAL.pdf.
14
community activists and grassroots organisations. The public spaces maintenance policy Sou + Minha
Comunidade also uses the participatory information systems of IPP-Riofor planning53
. The Morar
Carioca urban upgrading and housing program aims to improve sanitation, waste collection and public
lighting for 156,000 households by the end of the plan. These investments clearly have a positive
environmental impact, but a more significant contribution towards greenhouse gas emissions would
require a significant expansion of the still nascent municipal capability to capture biogas.
Environmental development and the other pillars of sustainability require sustainable governance,
accountability, consensual performance indicators and the adequate measurement of social and
environmental costs54
.
Multi-Sector Partnerships for Effective Governance of Sustainable Development
As demonstrated by Rio+Social and several other initiatives, the municipal government of Rio de
Janeiro has been experimenting with new models of interaction between the public, the private and
the not-for-profit sectors to address democratic and governance deficits. The advantages of multi-
sector governance models by comparison to more traditional and isolated government initiatives have
not yet been systematically evaluated in Rio de Janeiro, but several of the city’s opinion leaders have
concluded that multi-sector partnerships are more efficient in the long-run, albeit harder to implement
in the short-term. In 2002, at the Johannesburg World Summit on Sustainable Development, the Type
II Partnership was launched, a new voluntary multi-stakeholder model for sustainable development
initiatives. At the Rio+20 Summit, around 700 of these voluntary commitments were made. To guide
the implementation of these commitments a voluntary accountability framework was proposed by the
United Nations Department of Economic and Social Affairs based on annual reporting of progress, a
registry of initiatives, public access to performance indicators and shadow-reporting, i.e. independent
third-party reviews55
. The Rio+20 outcome document “The Future We Want” prescribes the
integration and periodical updating of internet-based registries as a principle of governance for
sustainable development. The Sustainable Development Solutions Network follows this
recommended framework.
In Brazil, several organisations support multi-sector cooperation. The Inter-American Development
Bank (IADB) and the Brazilian Institute of Municipal Administration (IBAM) carried out research
and capacity building to promote public-private alliances for local development56
. Vale Foundation
has proposed Public-Private Social Partnerships, multi-stakeholder projects that aim to strengthen
human development, the reach of public policies, citizen participation and the effectiveness of social
53
Allis, Joana & Franca, Monique, "Environmental Education in Integrative Waste Management: Case Study of
Favelas in Rio de Janeiro" in Medeiros, Rodrigo & Swaruk, Larry (Eds.) Sustainable Development Practice:
Advancing Evidence-Based Solutions for the Post-2015 Agenda, Proceedings of the 2013 International
Conference on Sustainable Development Practice. New York: Global Association of the Master's in
Development Practice Programs (2013), p. 286 – 294. 54
Besserman, Sérgio; Rosa, Rodrigo & Lins, Clarissa, “Sustentabilidade é competitividade: para o Rio e para o
Brasil” in Urani, André & Giambiagi, Fabio (Eds.) Rio: a hora da virada. Rio de Janeiro: Elsevier, pp. 123-136. 55
UNDESA (2014) Sustainable Development in Action: special report on Voluntary Commitments and
Partnerships for Sustainable Development, July (2011),
http://sustainabledevelopment.un.org/content/documents/1479SD%20in%20Action%20Report%20final%20(1fv
).pdf 56
Programa Alianças Público Privadas, A cooperação entre os setores público, privado e o terceiro setor nos
municípios: um balanço das ações do Programa Alianças Público-Privadas. [coordenação de] Karin Segala;
[redação de] Alexandre Carlos de Albuquerque Santos – Rio de Janeiro: IBAM; Fomin/BID, (2014). (Coletânea
Alianças Público-Privadas para o Desenvolvimento Local,v.1),
http://www.aliancaspublicoprivadas.org.br/app/wp-content/uploads/2014/07/01txt_introducao-v.editada.pdf
15
investments made by the private sector57
. While the majority of Type II Partnerships had arguably less
private sector involvement than expected58
, in Rio de Janeiro private sector social investments are
common. IPP-Rio has incubated several of these, often employing Rio+Social methodologies,
including Travessias, the community-managed sports facilities project financed by the utility
company Light S.A., and Agentes da Transformação, a training program for young household
researchers to survey youth issues in favelas funded by Telecom Italia Mobile (TIM).
Concerns have been raised that by handing public sector obligations to businesses Public-Private
Partnerships and Social Investment Funds could weaken welfare policies59
. The Porto Maravilha
regeneration in Rio de Janeiro has been criticised for promoting gentrification and social exclusion
due to private property speculation60
. Multi-sector alliances equipped with participatory planning tools
that engage citizens and civil society can do the opposite, strengthening welfare and inclusion.
Participatory and multi-sector planning can also increase the legitimacy of democratic representation,
especially if information technologies and group decision support systems are used61
. Each sector of
society has unique comparative advantages that can be combined to produce sustainable development.
The private sector can be an efficient social investor. Academia can provide monitoring tools. Civil
society and end-users can facilitate and help to supervise project implementation. Most importantly,
the public sector must retain a coordinating role in multi-sector partnerships as the legitimate
representative of the public interest and the best suited actor to foster networks for sustainable
development.
57
Fundação Vale, Parcerias intersetoriais: Perspectivas e desafios. Rio de Janeiro: Vale (2013),
http://www.fundacaovale.org/ptbr/artigos/ultimosartigos/Documents/fundacaovale_publicacaoPSPP_completo.p
df 58
Bäckstrand, Karin, “Multi-stakeholder partnerships for sustainable development: rethinking legitimacy,
accountability and effectiveness European Environment” European Environment, (2006)16(5), 290–306. 59
Mendes, Alexandre Fabiano, “Entre choques e finanças: a “pacificação” e a “integração” da favela à cidade
no Rio de Janeiro” O Social em Questão, (2014)18(31), 237 – 252. 60
Sanchez, Fernanda & Broudhoux, Anne-Marie, “Mega-events and urban regeneration in Rio de Janeiro:
planning in a state of emergency” International Journal of Urban Sustainable Development, (2013)5(2), 132-
153. 61
Majamaa, Wisa, The 4th P – People – in urban development based on public-private-people partnership.
Dissertation for the degree of Doctor of Science in Technology, Faculty of Engineering and Architecture of
Helsinki University of Technology (2008).