the sustainable development framework in lebanon a
TRANSCRIPT

The Sustainable
Development
Framework in Lebanon
A National Assessment
The Sustainable
Development
Framework in Lebanon
A National Assessment
Framework in Lebanon:
A National Assessment
2015

Author: Jana El-Baba (ESCWA)
National Focal Points: Mr. Youssef Naddaf and Ms. Lamia Mansour
(Lebanese Ministry of Environment)
Disclaimer: This initial draft was prepared in February 2015 and is intended for
discussion with national stakeholders. It has not been formally edited or reviewed. The
views expressed are those of the author and do not necessarily reflect the views of
ESCWA, the UN Secretariat or the Lebanese Ministry of Environment.

iii
Contents
I. About this report .................................................................................................................. 1
II. Brief overview of sustainable development trends and progress made over the past two
decades ....................................................................................................................................... 2
III. Sustainable development priorities in Lebanon ..................................................................... 5
A. Achieve employment generating economic growth ................................................................... 8
B. Build institutional and administrative capacities and improve governance............................. 10
C. Improve social protection systems for all groups and address inequalities ............................. 12
D. Achieve energy security ............................................................................................................ 14
E. Develop infrastructure and sustainable cities .......................................................................... 16
1. Water .................................................................................................................................... 18
2. Solid wastes........................................................................................................................... 19
3. Transport ............................................................................................................................... 20
F. Protect natural habitats and biodiversity ................................................................................. 21
IV. The institutional framework for sustainable development in Lebanon ................................. 22
A. Major development actors ....................................................................................................... 22
B. National policy interventions for sustainable development .................................................... 24
1. National overarching strategy or plan for sustainable development ................................... 24
2. Sectoral policies and strategies............................................................................................. 25
C. Laws governing sustainable development ................................................................................ 30
1. Ratification of global and regional agreements .................................................................... 30
2. Milestone laws promoting environmental sustainability ..................................................... 32
V. Key national barriers to sustainable development ............................................................... 33
A. Institutional barriers ................................................................................................................. 33
B. Political barriers ........................................................................................................................ 34
C. Financial barriers ....................................................................................................................... 35
D. Untapped scientific and technological capacity ....................................................................... 37
VI. Innovative practices or success stories in overcoming key obstacles to sustainable
development ............................................................................................................................. 38
A. Banque du Liban’s environmental loans ................................................................................... 39
B. Tannourine Cedar Forest Nature Reserve ................................................................................ 39
C. Methyl bromide substitution .................................................................................................... 39
D. Oil spill response ....................................................................................................................... 40
E. Healthcare waste management ................................................................................................ 41
F. Air quality monitoring ............................................................................................................... 41
G. National poverty targeting ........................................................................................................ 42
VII. Lessons learned and recommendations for national implementation of the post-2015
development agenda ................................................................................................................. 42
Annex 1. Sustainable development graphical trend analysis ........................................................ 45
Annex 2. Evaluation of Lebanon’s Economic and Social Reform Action Plan (2012-2015) against
good practices ........................................................................................................................... 56
Annex 3. Evaluation of national goals against the SDGs ............................................................... 59
Bibliography .............................................................................................................................. 66

iv
List of tables
Table II.1 Summary trend analysis of selected sustainable development indicators ............................. 3
Table III.1. Development priorities for Lebanon as stipulated in selected recent national documents ..
........................................................................................................................................................ 6
Table III.2. Challenges facing SMEs in Lebanon ...................................................................................... 9
Table III.3. Key public administration challenges and proposed goals to address them ...................... 11
Table III.4. Multi-faceted discrimination in Lebanon ............................................................................ 13
Table III.5. Lebanon’s Infrastructure score and ranking compared to neighboring countries ............. 17
Table IV.1. Sectoral strategies or policy documents issued since 2005 and their compliance with basic
governance principles ........................................................................................................................... 27
Table IV.2. Signature and ratification by Lebanon of core international human rights treaties .......... 30
Table IV.3. Ratification by Lebanon of main multilateral environmental agreements ........................ 31
Table IV.4. Lebanon’s trade and investment agreements .................................................................... 31
Table IV.5. Milestone laws and decrees promoting environmental sustainability ............................... 32
List of figures
Figure III.1. Unemployment distribution by age and gender, 2009 ........................................................ 8
Figure III.2. Distribution of Lebanese emigrants by age and educational attainment (2004-2008) ....... 8
Figure III.3. The contribution of tourism to GDP and employment (2000-2013) ................................. 10
Figure III.4. Vacancy rate in civil service jobs and average employee rate by job category ................. 11
Figure III.5. (a) Number of students per teacher in public, private and private subsidized schools; (b)
Qualifications of public school teachers ............................................................................................... 13
Figure III.6. Electricity gap in Lebanon .................................................................................................. 14
Figure III.7. Blackout daily average in different areas of Lebanon (2010 to 2013) ............................... 15
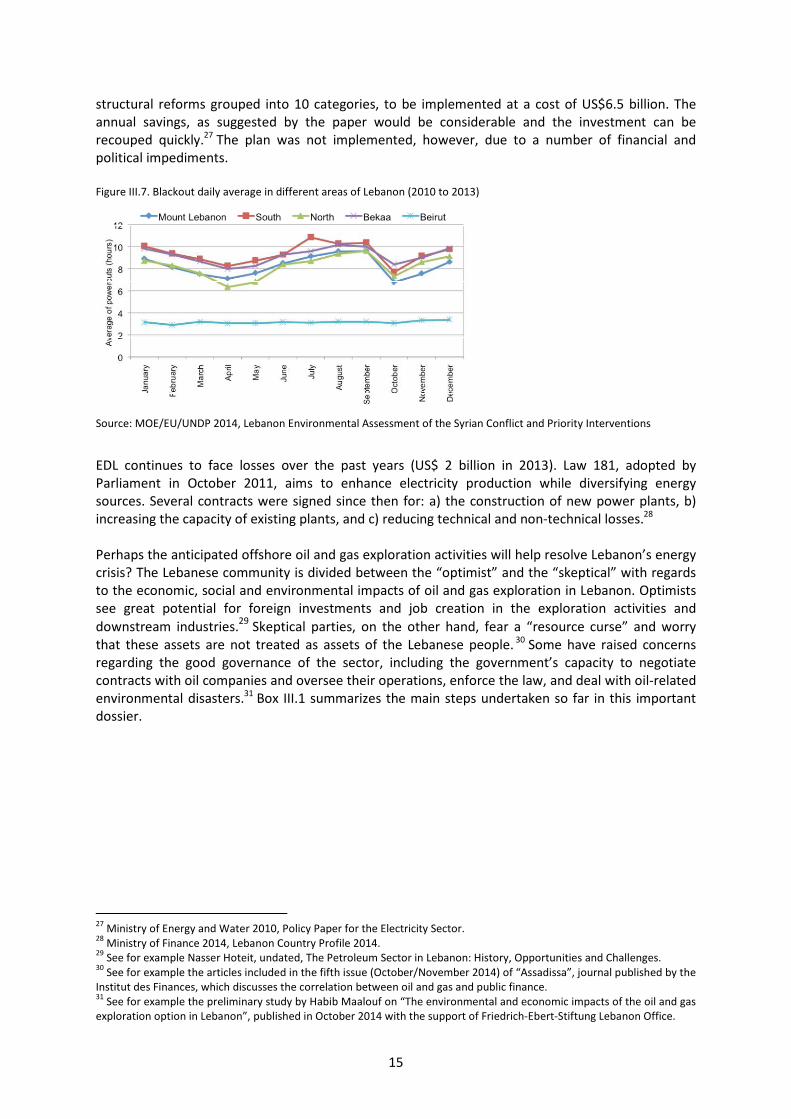
Figure III.8. Access to water in the various regions of Lebanon, 2008 ................................................. 19
Figure III.9. Municipal solid waste treatment ....................................................................................... 19
Figure III.10. Total estimated anthropogenic and biogenic emissions from various sources, 2010 .... 20
Figure IV.1. Public bodies attached to the Presidency of the Council of Ministers .............................. 23
Figure V.1. Public debt as % of GDP ...................................................................................................... 35
Figure V.2. Real GDP growth rate ......................................................................................................... 36
Figure V.3. (a) FDI trend; (b) FDI structure by investor in 2013; (c) FDI structure by sector in 2013 ... 37
Figure V.4. (a) ODA by donor; (b) ODA by sector, 2013 ........................................................................ 37
Figure V.5. Fields of education in Lebanon by ISCED* (2009 - 2010) ................................................... 38
List of boxes
Box III. 1. The Lebanese gas exploration dream starts to materialize .................................................. 16
Box III.2 Disaster risk analysis in Lebanon ............................................................................................. 17
Box III.3. Impact of the influx of Syrian refugees on water, wastewater and solid waste ................... 18
Box III.4. Impact of the influx of Syrian refugees on terrestrial ecosystems ........................................ 22
Box IV.1. The Lebanese private sector: A development partner? ........................................................ 24
Box V.1. Israel’s 2006 war on Lebanon ................................................................................................. 35
Box VII.1. Recommendations regarding the Post-2015 Development Agenda .................................... 44

v
Abbreviations and acronyms
MoSA Ministry of Social Affairs
MoYS Ministry of Youth and Sports
MPA Marine protected area
NCLW National Commission for Lebanese Women
NGP Non-governmental organization
ODP Ozone depletion potential
OECD Organization for Economic Cooperation
and Development
OMSAR Office of the Minister of State for
Administrative Reforms
OOSC Out of school children
PAR Petroleum activities regulations
PCM Presidency of the Council of Ministers
PPP Public private partnership
PPP Purchasing power parity
PV Photovoltaic
R&D Research and development
SCP Sustainable consumption and production
SDGs Sustainable Development Goals
SEA Strategic environmental assessment
SME Small and medium organization
SODEL Sustainable Oil and Gas Development in
Lebanon
UN United Nations
UNDP United Nations Development Programme
UNEP United Nations Environment Program
UNHCR United Nations High Commissioner for
Refugees
UNISDR United Nations Office on Disaster Risk
Reduction
UNRWA United Nations Relief and Works Agency
UPR Universal Periodic Review
US$ United States dollars
USJ Université Saint Joseph
WDI World Development Indicators
WTO World Trade Organization
ACWUA Arab Countries Water Utilities Association
AQRU Air Quality Research Unit
ASDR Arab Sustainable Development Report
AUB American University of Beirut
BdL Banque du Liban
CAS Central Administration of Statistics
CCA Common Country Assessment
CDIAC Carbon Dioxide Information Analysis
Center
CDR Council for Development and
Reconstruction
CI Central Inspection
CNRS National Council for Scientific Research
CO2 Carbon dioxide
CoM Council of Ministers
CSB Civil Service Board
CSO Civil society organization
CSR Corporate social responsibility
DESA Department of Economic and Social Affairs
ECOSOC Economic and Social Council
EDL Electricité du Liban
EEZ Exclusive economic zone
ESCO Energy service company
ESCWA Economic and Social Commission for
Western Asia
EU European Union
FAO Food and Agriculture Organization
FDI Foreign direct investment
GBA Greater Beirut Area
GDP Gross domestic product
GEF Global Environment Facility
GNI Gross national income
GRI Global Reporting Initiative
GW Gigawatt
ha Hectare
HCP Higher Council for Privatization
ICT Information and communication
technology
IDAL Investment Development Authority of
Lebanon
IdF Institut des Finances
ILO International Labor Organization
kg Kilogram
km, km2 Kilometer, square kilometer
kWh Kilo-watt hours
LCEC Lebanese Center for Energy Conversation
LEDO Lebanese Environment and Development
Observatory
LL Lebanese Lira
LPA Lebanese Petroleum Administration
MCM Million cubic meter
MDGs Millennium Development Goals
MEHE Ministry of Education and Higher Education
MENA Middle East and North Africa
MoA Ministry of Agriculture
MoE Ministry of Environment
MoEW Ministry of Energy and Water
MoI Means of implementation
MoPH Ministry of Public Health

I. About this report
The present report was prepared by the United Nations Economic and Social Commission for
Western Asia (ESCWA) in cooperation with the Lebanese Ministry of Environment in early 2015. It is
one of several national sustainable development assessments commissioned by ESCWA in selected
Arab countries as inputs to the Arab Sustainable Development Report (ASDR), the prototype edition
of which is expected to be published in 2015.1
In September 2015, the global community under the umbrella of the United Nations will be adopting
a Post-2015 Development Agenda, which will include a set of universal Sustainable Development
Goals (SDGs) that will supersede the Millennium Development Goals (MDGs). As of 2016, all
countries are expected to report on progress towards the achievement of this agenda as part of a
universal review process and a “country-led, national component for accountability”.2 As such, the
ASDR and its set of national assessments come at a timely moment to lay the grounds for
subsequent regional and national-level sustainable development review and reporting efforts.
Lebanon has a long tradition of producing good analytical reports on sustainable development.
Recently, a set of important national reports have been published, such as the MDG Report 2013-
2014 and the National Report to Rio+20 (2012), while the bibliography section of this report lists a
plethora of valuable documents. Therefore, the present document is not intended to repeat what
has previously been reported. Rather, it is meant to be a concise report that provides a bird’s eye
view of the sustainable development framework in Lebanon, synthesizing information rather than
going in detail into any particular sector.
The added value of the report stems from the following:
• Adopting a wide and comprehensive understanding of sustainable development, and taking
the themes of the SDGs as a normative framework. As noted above, this will help lay the
grounds for future national progress reviews of the post-2015 agenda;
• Providing a comprehensive assessment of sectoral policies and strategy documents and
highlighting gaps within Lebanon’s sustainable development policy framework. As such, the
report is a first attempt at assessing how different are Lebanon’s goals and targets from the
ones proposed globally within the post-2015 SDGs;
• Mapping existing sources of information (bibliography) and guiding the interested reader to
further references where more information can be obtained.
The preparation of this report faced a number of challenges, including the following:
• The absence of a national integrated development plan to be used as basis of analysis. To
go around this gap, the report delved into the multitude of sectoral strategies and plans
issued over the past 10 years by different ministries. While some of these documents were
1 The Arab Sustainable Development Report is a component of ESCWA’s Rio+20 follow-up programme and is therefore
tightly linked to the regional preparatory process for the Post-2015 Development Agenda. The report is led by ESCWA with
contributions from UNEP and the various UN organizations active in the region, and it will form the primary input into the
2nd
session of the Arab High-Level Forum on Sustainable Development to be held in Bahrain, 2-5May 2015. The report has
several objectives, including the assessment of trends, progress and gaps in the implementation of sustainable
development in the region as well as to strengthen the science-policy interface. 2 According to the “Synthesis Report of the Secretary-General on the Post-2015 Sustainable Development Agenda”
(A/69/700), a universal review process will be initiated at the national level which will inform the regional and global level
reviews. The national accountability component may include a Government report, a national stakeholder report and a
report compiling information and data from UN agencies and international financial institutions (para. 149).

2
not approved by the Council of Ministers, they are thought to be indicative of Lebanon’s
overall development pathway. Another challenging aspect is that information was generally
unavailable regarding the level of implementation of these plans over the years, and their
fate remained mostly unclear.
• Lack of up-to-date data. Statistics date 3-4 years back at best, with figures on poverty dating
to 2004. In a situation of flux that Lebanon is undergoing, some of these figures may no
longer be applicable. In addition, there are contradicting figures depending on source (for
example on GDP and debt). Whenever possible, preference was given to official national
statistics published by the Central Administration of Statistics (CAS).
The report is structured as follows: Section 2 provides a brief trend analysis based on a selected set
of sustainable development indicators; Section 3 highlights the top sustainable development
priorities for Lebanon over the next 15 years, including emerging and persistent priorities, and their
reflection in the proposed 17 SDGs; Section 4 looks at Lebanon’s institutional framework for
sustainable development with focus on development actors, sectoral policies and the legal
framework; Section 5 summarizes the key obstacles preventing the implementation of sustainable
development in Lebanon; Section 6 highlights a set of “success stories” that were able the overcome
the obstacles identified earlier; and Section 7 concludes with recommendations to the global post-
2015 process based on national lessons learned.
II. Brief overview of sustainable development trends and progress
made over the past two decades
This section attempts to provide an overview of the trends that Lebanon has followed over the past
two decades in terms of a selected number of indicators. Given the need to have long time series,
reliance was made in this section on two global databases, namely the MDG Indicators Database3
and the World Bank’s World Development Indicators Database.4 Indicators were selected from a
large dataset based on the following criteria:
1- Data availability over a large number of years, in order to enable the fitting of a trend line
(with the exception of poverty, as explained below);
2- When different indicators are available that relate to the same issue, preference was given
to indicators that are part of the League of Arab States’ agreed set of core Sustainable
Development Indicators;
3- Indicators that are thematically varied and cover the various core issues of the SDGs;
4- Indicators that show statistically significant change over time. For example, the MDG
database shows that the “Proportion of the population using improved drinking water
3 http://mdgs.un.org/unsd/mdg/Default.aspx.
4 http://data.worldbank.org/country/lebanon.
What’s next?
This initial draft of the report is intended for discussion with national stakeholders. Views compiled
through this consultation will help the author in finalizing the report. Sections VI and VII in
particular will benefit from stakeholder inputs. It is also expected that the final version of the
report will include an Executive Summary with key messages to policy-makers.

sources, total” and the “
total” remained 100% over the past two decades. As such, these indicators have been
omitted from the analysis
5- Whenever the indicator was available in both the WDI and MDG databases, the data was
obtained from the latter
Lebanon (although not all indicators in the MDG database
6- For poverty only, since no data was available
figures were obtained from the UNDP study on poverty. For this particular indicator, figures
are particularly outdated and are probably not representative of the poverty situ
The graphical representation of the
below summarizes trends using
the worse, a cloud sign mean
improvement. For some indicators, only arrows were used to reflect an upward
since the change cannot be qualified
example).
Table II.1 Summary trend analysis of selected sustainable development indicators
Theme Indicator
Population Population growth (annual %)
Population Age dependency ratio (% of working
population)
Poverty Individuals living with very low satisfaction of
basic needs
Poverty Population living under upper poverty line
($4/day)
Food Prevalence of anemia among children (% of
children under 5)
Food Cereal yield (kg per hectare)
Health Life expectancy at birth, total (years)
Health Children under five mortality rate per 1,000
live births
Health Children 1 year old immunized against
measles, percentage
Health Maternal mortality ratio per 100,000 live
births
Education Total net enrolment ratio in primary
education, both sexes
Education Primary completion rate, both sexes
Education Public spending on education, total (% of
GDP)
Gender Seats held by women in national parliament,
percentage
Gender Labor force, female (% of total labor force)
Water Renewable internal freshwater resources per
capita (cubic meters)
Energy Electricity production from oil sources (% of
total)
Energy Electricity production from renewable
sources (kWh)
Economy GDP per capita (constant 2005 US$)
Economy GDP per capita growth (annual %)
3
” and the “Proportion of the population using improved sanitation facilities,
” remained 100% over the past two decades. As such, these indicators have been
omitted from the analysis, despite their importance;
the indicator was available in both the WDI and MDG databases, the data was
obtained from the latter to give preference to figures produced by
all indicators in the MDG database are generated by governments
verty only, since no data was available in neither the WDI nor the MDG databases,
figures were obtained from the UNDP study on poverty. For this particular indicator, figures
are particularly outdated and are probably not representative of the poverty situ
graphical representation of the full statistical data is provided in Annex 1, whereas table II.1
using pictorials, where a lightning sign signifies that the trend is towards
the worse, a cloud sign means that there is no significant change, and a sun sign reflects
improvement. For some indicators, only arrows were used to reflect an upward
since the change cannot be qualified to be “good” or “bad” (such as for population growth for
Table II.1 Summary trend analysis of selected sustainable development indicators
Trend Remark / Caution
Population growth (annual %)
Large variations may suggest data
inconsistency.
Age dependency ratio (% of working-age
Individuals living with very low satisfaction of
Outdated data. To be interpreted
caution.
Population living under upper poverty line
Outdated data. To be interpreted with
caution.
Prevalence of anemia among children (% of
Cereal yield (kg per hectare)
at birth, total (years)
Children under five mortality rate per 1,000
Children 1 year old immunized against
Maternal mortality ratio per 100,000 live
ratio in primary
Two dips were observed in 1997 and 2006.
Primary completion rate, both sexes
The overall PCR level, however, is positive.
Public spending on education, total (% of
by women in national parliament,
To be interpreted with caution.
remains very low at 3% of seat
in 2005 then decreased in 2009
Labor force, female (% of total labor force)
Renewable internal freshwater resources per
Electricity production from oil sources (% of
Electricity production from renewable
Overall level remains very low.
(constant 2005 US$)
Upward trend after 2007 attributed in large
part to the construction sector.
GDP per capita growth (annual %)
Large variations from one year to another.
Negative trend since 2010.
Proportion of the population using improved sanitation facilities,
” remained 100% over the past two decades. As such, these indicators have been
the indicator was available in both the WDI and MDG databases, the data was
produced by the government of
are generated by governments);
in neither the WDI nor the MDG databases,
figures were obtained from the UNDP study on poverty. For this particular indicator, figures
are particularly outdated and are probably not representative of the poverty situation today.
provided in Annex 1, whereas table II.1
where a lightning sign signifies that the trend is towards
, and a sun sign reflects
or downward trend,
population growth for
suggest data
Outdated data. To be interpreted with
Outdated data. To be interpreted with
Two dips were observed in 1997 and 2006.
The overall PCR level, however, is positive.
To be interpreted with caution. Overall level
% of seats (% increased
in 2005 then decreased in 2009).
Overall level remains very low.
Upward trend after 2007 attributed in large
part to the construction sector.
Large variations from one year to another.
Negative trend since 2010.

Theme Indicator
Economy Inflation, GDP deflator (annual %)
Economy Total debt service (% of GNI)
Economy Current account balance (% of GDP)
National
accounting
aggregate
Adjusted net savings (% of GNI)*
Employment Unemployment, total (% of total labor force)
Innovation Scientific and technical
Industry Industry, value added (% of GDP)
Cities Urban population (% of total)
Cities Population density (people per sq. km of
land area)
SCP Consumption of all Ozone
Substances in ODP metric tons
SCP Energy use (kg oil equivalent) per $1,000
GDP (Constant 2005 PPP $)
Climate
change
Carbon dioxide emissions (CO
of CO2 per capita (CDIAC)
Climate
change
Carbon dioxide emissions (CO
$1 GDP (PPP) (CDIAC)
Ecosystems Terrestrial and marine areas protected, sq.
km.
Ecosystems Forest area (% of land area)
MoI/Finance Debt service as percentage of exports of
goods and services and net income
MoI/Finance Tax revenue (% of GDP)
MoI/Finance Net ODA received (% of GNI)
MoI/
Technology
Mobile-cellular subscriptions
inhabitants
MoI/
Technology
Internet users per 100 inhabitants
MoI/Data Overall level of statistical capacity (scale 0
100)**
Notes: SCP = Sustainable Consumption and Production; MoI = Means of Implementation
change; = Negative trend; = Upward trend;
* Adjusted net saving is derived from the standard national accounting measure of gross saving by making four
adjustments: (i) consumption of fixed capital is deducted to obtain net national saving; (ii
education is added to account for investment in human capital; (iii) estimates of the depletion of a variety of natural
resources are deducted to reflect the decline in asset values associated with extraction and depletion;
made for damages from carbon dioxide and particulate emissions. Source
Books for the years 2006 to 2014.
** The “overall level of statistical capacity
methodology; source data; and periodicity and timeliness (refer to the World Bank site for details).
Sources: MDG Indicators Database, World Bank World Development Indicators Database
2014.
4
Trend Remark / Caution
Inflation, GDP deflator (annual %)
Total debt service (% of GNI)
However, the trend over recent years has
been positive.
Current account balance (% of GDP)
Adjusted net savings (% of GNI)*
To be interpreted with caution. While the
overall trend is positive, indicator has been
decreasing consistently since 2009.
Unemployment, total (% of total labor force)
The period 2007-2009 witnessed an
important drop in unemployment rate.
Scientific and technical journal articles
To be interpreted with caution as it does not
reflect quality or impact
Industry, value added (% of GDP)
Urban population (% of total)
Population density (people per sq. km of
Consumption of all Ozone-Depleting
Substances in ODP metric tons
Energy use (kg oil equivalent) per $1,000
GDP (Constant 2005 PPP $)
Curve is bell-shaped. Level in 2010 returned
to 1990 value after increase in the mid
2000’s.
Carbon dioxide emissions (CO2), metric tons
per capita (CDIAC)
Level is higher compared to other non
Arab countries (e.g. Egypt, Tunisia and
Jordan).
Carbon dioxide emissions (CO2), kg CO2 per
Terrestrial and marine areas protected, sq.
Forest area (% of land area)
Increase took place between 2000
but is small and insufficient in absolute
terms.
Debt service as percentage of exports of
goods and services and net income Data available from 2002 onward.
Tax revenue (% of GDP)
While the trend is positive, the
however, is low.
Net ODA received (% of GNI)
Upward trend due mainly to
2006 (Israel war). As indicated later in the
report, most ODA goes to
issues and contributes little to development.
cellular subscriptions per 100
Internet users per 100 inhabitants
Overall level of statistical capacity (scale 0 -
Lebanon made an important improvement
from around 40 to 65 over the past 10 years.
However, room for improvement is still high.
: SCP = Sustainable Consumption and Production; MoI = Means of Implementation; = Positive trend;
= Upward trend; = Downward trend.
* Adjusted net saving is derived from the standard national accounting measure of gross saving by making four
adjustments: (i) consumption of fixed capital is deducted to obtain net national saving; (ii) current public expenditure on
education is added to account for investment in human capital; (iii) estimates of the depletion of a variety of natural
resources are deducted to reflect the decline in asset values associated with extraction and depletion;
made for damages from carbon dioxide and particulate emissions. Source for this indicator: World Bank
verall level of statistical capacity” is a composite indicator covering three dimensions, namely
methodology; source data; and periodicity and timeliness (refer to the World Bank site for details).
World Bank World Development Indicators Database, and Lebanon’s MDG report 2013
However, the trend over recent years has
To be interpreted with caution. While the
overall trend is positive, indicator has been
decreasing consistently since 2009.
2009 witnessed an
important drop in unemployment rate.
To be interpreted with caution as it does not
reflect quality or impact of these articles.
shaped. Level in 2010 returned
to 1990 value after increase in the mid-
compared to other non-gulf
(e.g. Egypt, Tunisia and
Increase took place between 2000 and 2005
but is small and insufficient in absolute
Data available from 2002 onward.
While the trend is positive, the overall level,
trend due mainly to sharp spike in
As indicated later in the
report, most ODA goes to humanitarian
issues and contributes little to development.
Lebanon made an important improvement
from around 40 to 65 over the past 10 years.
improvement is still high.
= Positive trend; = No
* Adjusted net saving is derived from the standard national accounting measure of gross saving by making four
) current public expenditure on
education is added to account for investment in human capital; (iii) estimates of the depletion of a variety of natural
resources are deducted to reflect the decline in asset values associated with extraction and depletion; (iv) deductions are
World Bank Little Green Data
hree dimensions, namely statistical
methodology; source data; and periodicity and timeliness (refer to the World Bank site for details).
, and Lebanon’s MDG report 2013-
5
Caution must be made in the interpretation of these trends due to the following: a) inconsistencies
with national data sources may affect their reliability; b) the indicators provided in table II.1 provide
a partial picture, at best, of sustainable developments trends, as it is not practical in this report to
cover all possible sustainable development indicators; and c) while a trend may generally be
positive, the level (or value) of the indicator in absolute terms is inadequate. Furthermore, a major
limitation of this trend analysis relates to the unavailability of comprehensive and recent data on
poverty and deprivation, governance, freedoms, and levels of inequality, which as described in the
remainder of this report, constitute important sustainable development challenges in Lebanon.
Based on table II.1, three general areas of concerns are apparent where Lebanon has exhibited a
negative trend. The first relates to water and energy, with decreasing per capita share of water and
increasing reliance on oil sources for electricity generation. The second is an increasing population
density, notably in urban areas, with unsustainable consumption patterns (as seen from the
increasing per capita carbon dioxide emissions). The third area of concern is of economic and
financial nature and relates to debt sustainability, deficit in the balance of accounts and low value
addition in industry. These areas constitute important future priorities for Lebanon and will be
discussed in the subsequent sections of this report.
III. Sustainable development priorities in Lebanon
In the absence of a clear vision and a single, overarching development policy document for Lebanon,
the identification of the top sustainable development priorities for Lebanon over the next 15 years
was approached through a review of recent authoritative national documents as listed in table III.1
below. The table provides a summary of the priorities identified in selected documents, and
demonstrates that national priorities have not evolved much over the last decade. For the sake of
practicality, recurring themes in the table were combined into a manageable number of top
priorities. In addition, two issues of importance that have emerged over the past few years were
identified, namely the Syrian refugees’ crisis and the discovery of offshore petroleum reserves.
The top six sustainable priorities identified for Lebanon are the following:
• Achieve employment generating economic growth;
• Build institutional and administrative capacities and improve governance;
• Improve social protection systems for all groups and address inequalities;
• Achieve energy security;
• Develop infrastructure and sustainable cities;
• Protect natural habitats and biodiversity.
It is noteworthy that the above priorities are in line overall with the SDGs, notably with goals 7
(energy), 8 (growth and employment), 9 and 11 (infrastructure and cities), 10 (inequality), 15
(ecosystems) and 16 (institutions). However, some national particularities exist in the targets, as will
be highlighted in the remainder of this section and also in section 4. It is also important to note that
the issue of refugees has not being included in the SDGs, which may be considered as a critical
shortfall of the agenda from the perspective of refugee-hosting countries such as Lebanon. In fact,
according to UNHCR’s Global Trends Report 2013,5 Lebanon occupies 3
rd place worldwide in terms of
the number of refugees it hosts (after Pakistan and Iran) and the 1st place in terms of the ratio of
refugees to population size.
5 Available at http://www.unhcr.org/5399a14f9.html.

6
Table III.1. Development priorities for Lebanon as stipulated in selected recent national documents
Document (1)
Main identified priorities (2)
Economic Social Environmental Other
Policy Statement of the National
Interest Government, March 2014
− Address fiscal problems and
achieving economic recovery
− Energy, oil and gas
− Improve citizens’ living standards
and conditions
− Wages and social pension
− Syrian refugees
− Security and stability, fighting
terrorism
− Decentralization and
revitalization of the state
apparatus
Post 2015 national consultations
in Lebanon: The Lebanon We
Want, 2013 (3)
− Inclusive growth and job creation − Improve the quality and
distribution of basic services
− Infrastructure and public
transportation
− Good governance and political
reforms
− Peace-building and conflict
prevention
National Report to the United
Nations Conference on
Sustainable Development
(Rio+20), 2012 (4)
− Improving energy sustainability − Creating more and better jobs
− Producing more food with fewer
resources
− Making cities more sustainable
− Balancing water supply and
demand
− Respecting the Mediterranean
Sea
− Disaster mitigation and
preparedness
Economic and Social Reform
Action Plan (2012-2015), 2012
− Public debt management, fiscal
and budget reforms
− Private sector development
− Infrastructure rehabilitation
(energy, transportation water
and sanitation, telecom)
− Reform of education, pension
and health insurance systems
− Equitable social protection
scheme
− Regional and municipal
development
− Solid waste management
− Quarries
− Reforestation
− Institutional and administrative
reform (e-government, e-
services, automation of records)
− Statistical master plan
National Social Development
Strategy, 2011
− Achieve better health
− Strengthen social protection
− Provide quality education
− Improve opportunities for
equitable and safe employment
− Revitalize communities and
develop the social capital
Social Pact, 2010 − Strengthen social development
and improve social conditions
− Ensure quality health services to
all
− Expand social safety nets
− Promote quality education for all
− Provide opportunities for decent,
productive and safe employment
− Protect the environment and
manage natural resources
− Adopt integrated plans and
development strategies across
regions

7
Document (1)
Main identified priorities (2)
Economic Social Environmental Other
Lebanon - Country partnership
strategy for the period FY11-FY14,
World Bank 2010 (5)
− Fiscal stability and public
financial management
− Competitive business
environment
− Improve infrastructure and
support local economic
development
− Human capital development and
social protection (including
education, health, gender, social
safety nets)
− Environment and waste
management (item included
under infrastructure)
− Build statistical capacity (item
included under fiscal stability)
United Nations Development
Assistance Framework for
Lebanon 2010-2014, 2010 (6)
− Socio-economic development
and regional disparities reduction
− Human rights
− Gender
− Environmental sustainability − Democratic governance and
institutional development
Recovery, Reconstruction, and
Reform (Paper presented by the
Lebanese Republic, to the
International Conference for
Support to Lebanon, Paris III),
2007
− Enhance growth and the
competitiveness of the Lebanese
economy
− Implement a privatization
program
− Reform to fiscal and monetary
policies
− Develop social safety nets to
protect the most vulnerable
− Reform to education and health
sectors
− Reform state owned enterprises
− Improve governance and
transparency in public sector
Social Action Plan, 2007 − Reducing poverty
− Improving access to primary
education
− Improving access to basic health
care
− Local development
Source: Compiled by ESCWA from the documents listed in column 1.
Notes:
(1) Documents in the table have been ordered by date, from the newest to the oldest.
(2) The classification of priorities into economic/ social/ environmental is done to facilitate comparison only and is not meant to disregard the tight interlinkages between these priorities.
(3) While the document is prepared by the UN Resident Coordinator Office for Lebanon, it reflects an inclusive consultation process.
(4) Noted as “aspirations for sustainable development” and included in section VI of the report.
(5) Document reflects 2009 Lebanese Government’s “Progress and Development” Policy Statement. Listed priorities reflect “areas of engagement” of the World Bank.
(6) The UNDAF builds on the results of the Common Country Assessment of 2007 and takes into consideration the Government’s Paris III reform programme.

8
A. Achieve employment generating economic growth
The creation of job opportunities is beyond doubt a top priority for Lebanon, notably for women and
youth. Equally important is the need to diversify the job market into different productive economic
sectors (such as industry, agriculture, and tourism), and to distribute employment opportunities
within the various regions of Lebanon, beyond Beirut and the major cities.
According to the latest official census, the unemployment figure in 2009 was at 6.4%, with important
differences between men (5%) and women (10.4%).6 As seen in figure III.1, the highest affected age
bracket is the 15-24 (half of the unemployed are within the 15-24 age bracket), especially for
women. Furthermore, despite high rates of tertiary education, qualified human resources find
difficulty in getting employed. Indeed, unemployment rate among the educated is higher, reaching
9% for university degree holders. Returns to education that reflect earnings in relation to education
levels are generally low (estimated at 9%) compared to a global average of 21%. Unemployment
among the youth has fuelled the protracted problem of brain drain, which is also compounded by
political instability. As depicted in figure III.2, emigrants are mostly young and educated. The large
diaspora has created a heavy economic dependence on remittances, which constituted 25% of GDP
in 2008, higher than foreign direct investment.
Figure III.1. Unemployment distribution by age and gender, 2009
Source: Redrawn from Central Administration of Statistics, The labour market in Lebanon, Statistics in Focus (SIF), Issue
number 1, October 2011.
Figure III.2. Distribution of Lebanese emigrants by age and educational attainment (2004-2008)
Source: Redrawn from Ministry of Economy and Trade 2014, Lebanon SME Strategy: A Roadmap to 2020.
The recent influx of Syrian refugees has surpassed one million in 2014, equaling around 20% of the
Lebanese population, with a large proportion being in the working age bracket. This has exacerbated
unemployment rates and brought wages down especially in peripheral regions where already
6 Central Administration of Statistics 2009, Multiple Indicators Cluster Survey 2009

9
unemployment and poverty prevail. Furthermore, Syrian refugees are willing to work for longer
hours and are not covered by social benefits. For example, FAO estimated that the wages of workers
in agriculture dropped by as much as 60% due to competition by refugees, while the construction
and services sectors have also been affected to some extent. While some Lebanese businesses have
profited from the lower labor costs, some are facing increasing completion from Syrian owned micro
enterprises.7
As per the constitution, Lebanon has always adopted a liberal economic system that promotes
entrepreneurship and guarantees private property. The private sector is the major contributor to the
economy. The Lebanese economy depends largely on services (namely commerce, tourism and
financial services), which contribute over 60% of GDP and 73% of job opportunities. However, weak
investments in the productive sectors (agriculture and industry) have limited Lebanon’s economic
growth and employment creation potential. Over two thirds of total investments have been made in
the real estate sector, which generates a limited number of jobs that benefit mostly non-Lebanese
workers (it is estimated that 9% of all workers are employed in the construction sector).8
Investments have been hampered by macroeconomic imbalances that increase long term risks and
accordingly raise interest rates. Lack of competitiveness has also discouraged investments in
productive sectors.
It is acknowledged that small and medium enterprises (SMEs) represent major employers in most
countries, including in Lebanon. However, SMEs in Lebanon face a number of challenges hampering
their development. The Lebanon SME strategy, prepared by the Ministry of Economy and Trade in
2014 differentiated between overarching challenges and those that affect specific levels, as shown in
Table III.2 below.
Table III.2. Challenges facing SMEs in Lebanon
Overarching challenges At the entrepreneur level At the industry level
• The growth barrier: SMEs are unable
to move to the next stage of growth
• Delayed knowledge economy and
weak R&D
• SMEs unable to cope with changing
business environment
• Economic uncertainty and financial
stress
• Uncoordinated institutional setup
and limited support
• The owner-manager unable to move
to next level
• Family controlled businesses with
closed capital bases
• Women entrepreneurs not achieving
their potential
• Unfair competition, prevalence of
exclusive agencies and oligopolies
• Trading inefficiencies and lack of
trade agreements
• Weak legal enforcement and
inefficient judicial system
• Weak creditor protection with low
recovery rates
• Taxation applies equally to all
enterprises with no incentives for
SMEs
• Persisting red tape and costly
processes
• Enduring cultural stigma of failure
• Untapped innovation potential
• Nascent intellectual property
protection system
• Poor market research and lack of
information
At the national level At the enterprise level
• Reliance on informal workforce and
high fixed employment costs
• Hurdles for foreign skilled labor and
limited knowledge transfer
• Shallow Beirut Stock Exchange with
low capitalization and trading volumes
• Poor infrastructure across the
territory
• The middle management gap driven
by poor talent retention
• Capabilities, whether organizational
or individual, are not developed
• Lack of technical specialists and
highly skilled workforce
• Distorted cost of capital and weak
capital bases
• Lack of capital supply through risk-
sharing equity
• Limited investments and financial
instruments
Source: Adapted from Ministry of Economy and Trade, 2014, Lebanon SME Strategy: A Roadmap to 2020
7 ILO Regional Office for Arab States, 2014, Assessment of the impact of Syrian refugees in Lebanon and their employment
profile. 8 Ministry of Finance 2014, Lebanon Country Profile 2014.

10
While tourism is employment generating, in terms of both direct and indirect job creation, it is
volatile by nature. Since the political environment has not been very favorable over the past decade,
this has been reflected in a relatively consistent decline in the contribution of tourism to GDP and
employment (See figure III.3).
Figure III.3. The contribution of tourism to GDP and employment (2000-2013)
Source: World Trade and Tourism Council as quoted in the Rural Tourism Strategy for Lebanon, 2014
The concept of “green jobs” offers win-win solutions to the dual challenge of employment and
environmental protection and sustainable development. An ILO study provided a preliminary
assessment of the potential for green jobs in Lebanon in four sectors, namely energy, construction,
waste management and agriculture/forestry.9 The report found that there is significant green job
creation potential in areas such as solar water heating and organic farming. The report recognizes,
however that to achieve this potential requires the application of a set of measures that combine
human resource development, enforcement of environmental and employment policies and
improvements to the investment climate for green businesses.
B. Build institutional and administrative capacities and improve governance
The World Bank has identified six aggregate “Worldwide Governance Indicators” that cover: a) voice
and accountability; b) political stability and absence of violence; c) government effectiveness; d)
regulatory quality; e) rule of law; and f) control of corruption.10 Lebanon has exhibited from 1996 to
2013 a downward trend in five of these six indicators, with regulatory quality being the only
dimension where progress has effectively been achieved. It is noteworthy that in the five indicators
a dip is observed in the 2005-2006 period onward.11
Addressing governance issues requires concerted action at all levels. Perhaps a first and basic
requirement before any reform actions can be properly implemented and sustained, is to build an
effective public sector apparatus. Indeed, the role of civil servants as agents of change cannot be
underestimated.
Unfortunately, the civil service apparatus in Lebanon faces a number of constraints, many of which
have become deep-rooted, requiring concerted action at different levels. The Office of the Minister
of State for Administrative Reforms (OMSAR) was established after the end of the civil war in 1995
to modernize public administration and ensure that public services are delivered efficiently to all
citizens at the highest level of ethics and integrity. In its latest strategy,12 OMSAR listed seven key
9 ILO 2011, Green Jobs Assessment in Lebanon: Synthesis Report.
10 For information on these indicators, visit: www.govindicators.org.
11 WGI Country Data Report for Lebanon (1996-2013), available at
http://info.worldbank.org/governance/wgi/pdf/c124.pdf. 12
OMSAR, Strategy for the Reform and Development of Public Administration in Lebanon, January 2011.

11
public administration challenges, and a number of goals for improving the current situation as
summarized in table III.3.
Table III.3. Key public administration challenges and proposed goals to address them
Challenges Goals
- Weak strategic planning approaches;
- Inadequate organizational structures, overlapping
mandates and excessive centralization;
- Complex bureaucratic procedures which encourage
bribery and subjectivity
- Lack of highly qualified and well-trained human
resources (due to low wages);
- Ineffective monitoring and accountability systems;
- Poor use of ICT systems and lack of legal frameworks
enabling electronic procedures;
- Inadequate public buildings;
- Lack of political will to undertake the necessary
reforms.
- Modernize laws and regulations;
- Restructure public entities and modernize roles and
mandates;
- Restructure monitoring institutions;
- Build human capacities;
- Build institutional capacities and promote strategic
planning;
- Promote good governance and accountability;
- Focus on serving citizens and the achievement of
outcomes;
- Establish an e-government portal and promote the use
of ICTs;
- Concentrate public role to strategic functions and
promote public-private partnership.
Source: OMSAR, 2011, Strategy for the Reform and Development of Public Administration in Lebanon.
According to 2010 statistics, and due to a freeze on public sector hiring, 70% of civil service jobs
were vacant. This trend is expected to get worse if the freeze continues, since an important
proportion of employees in all job categories are now in their fifties and are soon to retire (See
figure III.4).
Figure III.4. Vacancy rate in civil service jobs and average employee rate by job category
Job
category
% jobs
vacant
Average
employee age
First 41% 58 years
Second 58% 56 years
Third 54% 46 years
Fourth 73% 48 years
Fifth 81% 55 years
Source: OMSAR, 2011, Strategy for the Reform and Development of Public Administration in Lebanon.
There are three main national bodies mandated to build the capacity of public administration in
Lebanon, namely: a) the National Institute of Administration; b) OMSAR; and c) the Institut des
Finances Basil Fuleihan (IdF) - Ministry of Finance. IdF published in 2011 a report on the training
system for public administration,13 which highlighted two areas of concern, namely that: a) real
training needs of public employees, both immediate and strategic ones, have not been properly
identified; and b) efforts among the above-mentioned institutions need to be coordinated to ensure
that supply of training meets demand.
13
Institut des Finances Basil Fuleihan 2011, Institutional Development Plan: Horizon 2015.
Filled 30%
(6,685)Vacant
70%
(15,344)
Civil service jobs
3,046
contractual
&
1,973
wage earners

12
C. Improve social protection systems for all groups and address inequalities
There are wide social disparities between regions in Lebanon, with poverty being concentrated in
pockets notably in the Akkar region in the North and in the suburbs of large cities. The national
poverty lines have been identified in the 2004-2005 income survey to be $2.4 (lower line) and $4
(upper line). According to these criteria, it was estimated that 28% of the Lebanese population were
below the $4 upper poverty line while 8% are below the $2.4 lower line.14 Almost half of the latter
category lives in the North.15
The Mapping of Human Poverty and Living Conditions in Lebanon 2004, published by UNDP and the
Ministry of Social Affairs in 2008, clearly showed the differences in the levels of deprivation between
the central regions of Lebanon (Beirut and Mount Lebanon) and peripheral regions (North, South
Bekaa and Nabatieh). Comparison was made according to 24 indicators spanning five areas, namely
housing, education, water, sanitation and electricity, health and economic situation.16 A recent study
of poverty and deprivation in the city of Tripoli in North Lebanon confirmed that the situation has
not improved over the past 10 years. Indeed, the report showed that 57% of households in the
surveyed districts of Tripoli are deprived while 26% are severely deprived, with economic
deprivation being the most widespread (affecting 77% of surveyed households) followed by health
and housing deprivation (35% of households) then by education deprivation (25% of households).17
According to the Human Development Report of Lebanon 2008-2009, the lack of a civic personal
status law and the prevalence of confessionalism reinforce inequality between social groups and
may even be considered to be among its leading causes. In many instances, the inequality is
effectively in terms of opportunity and quality of services, rather than quantity. The report argues
that in turn, inequality is among the major causes of religious, ethnic and tribal allegiance, which
fuels instability. The circle becomes a vicious one as sectarian and political conflict promote
clientelism and maintain the “rights” of religious communities to civil servant appointments and
ministries.18
Table III.4 highlights some of the multiple facets of discrimination and inequality between social
groups in Lebanon. In particular, inequality between men and women has many dimensions. In
economic terms, women receive less pay for equal jobs (particularly in high level jobs) despite better
educational attainment overall, and as shown above, unemployment is higher among women. On
the other hand, it is noteworthy that Lebanon has the highest proportion of elderly among the Arab
countries (% of population >65 age exceeding 7%).19 However, the elderly remain unprotected by
the government, with 97% of all nursing homes being privately owned.20
While education and healthcare services are generally considered to be of relatively good standard,
inequalities in accessing these services and disparities in terms of quality need to be addressed. In
education for example, around two thirds of students attend private or subsidized private schools,
while only one third of students go to public schools. Public schools are avoided due to low student
14
Heba Laithy, Khalid Abu-Ismail and Kamal Hamdan, 2008, Poverty, Growth and Income Distribution in Lebanon
(International Poverty Centre Country Study No. 13, available at http://www.ipc-undp.org/pub/IPCCountryStudy13.pdf) 15
Lebanon - Country partnership strategy for the period FY11-FY14, World Bank 2010. 16
Readers are invited to consult the elaborate study for detailed results, available at
http://www.lb.undp.org/content/dam/lebanon/docs/Poverty/Publications/Mosa%20mapping%20Book%20with%20senten
ce.pdf. 17
ESCWA and the Arab Urban Development Institute 2014 (Original in Arabic: مشروع دراسة الفقر الحضري في البلدان العربية، الفقر The Study is based on a survey of 1500 households conducted in 2011 (Refer to study for detailed .( في مدينة طرابلس
methodology). 18
UNDP 2009, Lebanon 2008-2009 National Human Development Report: Toward a Citizen’s State. 19
ESCWA 2012, Statistical Abstract of the Arab Region, Issue No. 32. 20
Lebanon National Report to the United Nations Conference on Sustainable Development (Rio+20), 2012.

13
achievement rates, relative weakness in foreign languages, and the absence of extracurricular
activities.21
Table III.4. Multi-faceted discrimination in Lebanon
Social group Estimated number Facets of discrimination
Prisoners 7,800 prisoner Human rights violations, overcrowding
Refugees 447,000 Palestinians (Jan 2014, UNRWA)
6,100 Iraqis (UNHCR 2015 projection)
860,000 Syrians (Jan 2014)
Civil rights deficits
Migrant domestic workers Over 250,000 worker Violence, lack of legal protection,
indecent work conditions
Persons with disability 74,000 or 2% of the population (2004 data) Education and employment
opportunities
Women 49% of the population Honor crimes and domestic violence,
unequal pay and higher
unemployment, citizenship rights
Children 23% of the population below 15 (the % is
exhibiting a decreasing trend)
Violence
Elderly 10% of the population above 45
(the % is exhibiting an increasing trend)
Inadequate healthcare and pension
systems
Rural and peri-urban NA Higher incidence of poverty, low
quality services
Source: Compiled by authors from UNHCR (http://www.unhcr.org/pages/49e486676.html#LEBBE), UNRWA
(http://www.unrwa.org/where-we-work/lebanon), ILO (http://www.ilo.org/beirut/countries/lebanon/lang--en/index.htm),
Daily Star (http://www.dailystar.com.lb/News/Lebanon-News/2014/Jul-04/262578-prisons-engendering-worse-
offenders.ashx), ESCWA-LAS 2014 Disability in the Arab Region, and CAS website.
Spending on public education is considered to be inefficient as the number of teachers is high but
inefficiently distributed according to regions and educational subjects. The student to teacher ratio
is 7.7 in public schools compared to 11.5 and 19.1 in private and subsidized private schools
respectively. The qualifications of public school teachers are low with over half of them not holding a
university degree (See figure III. 5).22 Unfortunately, and due to the Syrian crisis, the number of out-
of-school children (OOSC) in June 2014 was estimated at more than 280,000, urging the Ministry of
Education to launch an initiative to reach all children in Lebanon with education.23
Figure III.5. (a) Number of students per teacher in public, private and private subsidized schools; (b) Qualifications of public
school teachers
Source: Ministry of Higher Education 2010, Education Sector Development Plan (General Education): 2010-2015
21
Ministry of Education and Higher Education 2010, National Education Strategy Framework and Education Sector
Development Plan (General Education): 2010-2015. 22
Ibid. 23
Ministry of Education and Higher Education 2014, Environmental Management Plan and Guidelines for Reaching All
Children with Education in Lebanon.

14
D. Achieve energy security
Ensuring reliable access to electricity for all the population in a socially just and environmentally
sustainable manner is another top priority for Lebanon. Indeed, the electricity problem in Lebanon is
endemic. Successive wars have damaged the full electricity supply chain from generation to
transmission to distribution, while governance issues have increased financial losses in the form of
uncollected power bills and illegal connections on the grid. Demand for electricity has surpassed
supply by Electricite du Liban (EDL) – the public utility controlling 90% of the sector – many years
ago, and the gap is worsening. Over the past few years, the import of electricity from neighboring
Syria was disrupted due to the on-going crisis, and the influx of Syrian refugees has further increased
demand for electricity, adding more strain to an already precarious situation. The gap between
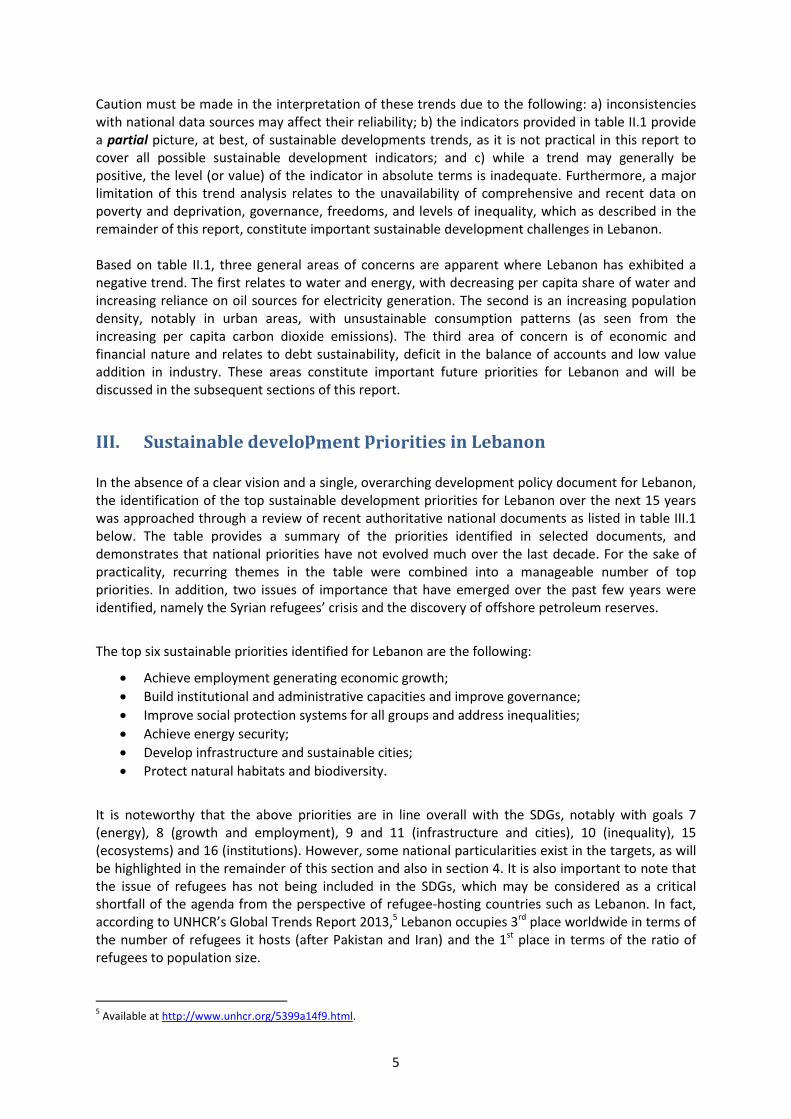
supply and demand was estimated in 2014 to be in the order of 1.2 GW (see figure III.6).24 As a
result, blackouts are regular, ranging from 3 hours in Beirut to 12 hours in other areas (see figure
III.7), with the situation worsening during high consumption periods (cold winter and hot summer
months). Dependence on private generators is high, leading to both financial and environmental
impacts. Indeed, diesel generators are the main source for covering the supplemental demand of
251 MW associated with the Syrian refugees population.25
Figure III.6. Electricity gap in Lebanon
Source: Marc Ziade 2012, Technical Challenges to 24/7 electricity in Lebanon, http://www.carboun.com/energy/technical-
challenges-to-247-electricity-in-lebanon/
Supply issues include the following: a) Ageing power plants and lack of maintenance; b) Inefficient
operation, due in part to reliance on gasoil rather than natural gas; c) Sizeable losses in transmission
and distribution systems; and d) Lack of monitoring and poor management.26
According to the 2010 Policy Paper for the Electricity Sector prepared by the Ministry of Energy and
Water, electricity production is economically and socially inefficient. An annual deficit of US$1.5
billion is borne by the Government while losses to the national economy, in the form of cost of
energy not supplied, is estimated at more than $2.5 billion dollars per year, paid by consumers.
Losses on the system are significant, totaling about 40%, where 15% are of technical nature, 20% are
non-technical losses and the remaining 5% are due to uncollected bills. The paper argues also that
the applied tariff structure is not socially just as it subsidizes all users regardless of consumption or
wealth. Small users have to bear similar fixed charges as large ones. The paper proposes a set of
24
Rami Ariss, “Power Ships” Keeping Lebanon’s Grid Afloat, 24 March 2014 (http://berc.berkeley.edu/power-ships-
keeping-lebanons-grid-afloat/). 25
MOE/EU/UNDP 2014, Lebanon Environmental Assessment of the Syrian Conflict and Priority Interventions. 26
Marc Ziade 2012, Technical Challenges to 24/7 electricity in Lebanon (http://www.carboun.com/energy/technical-
challenges-to-247-electricity-in-lebanon/).
15
structural reforms grouped into 10 categories, to be implemented at a cost of US$6.5 billion. The
annual savings, as suggested by the paper would be considerable and the investment can be
recouped quickly.27 The plan was not implemented, however, due to a number of financial and
political impediments.
Figure III.7. Blackout daily average in different areas of Lebanon (2010 to 2013)
Source: MOE/EU/UNDP 2014, Lebanon Environmental Assessment of the Syrian Conflict and Priority Interventions
EDL continues to face losses over the past years (US$ 2 billion in 2013). Law 181, adopted by
Parliament in October 2011, aims to enhance electricity production while diversifying energy
sources. Several contracts were signed since then for: a) the construction of new power plants, b)
increasing the capacity of existing plants, and c) reducing technical and non-technical losses.28
Perhaps the anticipated offshore oil and gas exploration activities will help resolve Lebanon’s energy
crisis? The Lebanese community is divided between the “optimist” and the “skeptical” with regards
to the economic, social and environmental impacts of oil and gas exploration in Lebanon. Optimists
see great potential for foreign investments and job creation in the exploration activities and
downstream industries.29 Skeptical parties, on the other hand, fear a “resource curse” and worry
that these assets are not treated as assets of the Lebanese people. 30 Some have raised concerns
regarding the good governance of the sector, including the government’s capacity to negotiate
contracts with oil companies and oversee their operations, enforce the law, and deal with oil-related
environmental disasters.31 Box III.1 summarizes the main steps undertaken so far in this important
dossier.
27
Ministry of Energy and Water 2010, Policy Paper for the Electricity Sector. 28
Ministry of Finance 2014, Lebanon Country Profile 2014. 29
See for example Nasser Hoteit, undated, The Petroleum Sector in Lebanon: History, Opportunities and Challenges. 30
See for example the articles included in the fifth issue (October/November 2014) of “Assadissa”, journal published by the
Institut des Finances, which discusses the correlation between oil and gas and public finance. 31
See for example the preliminary study by Habib Maalouf on “The environmental and economic impacts of the oil and gas
exploration option in Lebanon”, published in October 2014 with the support of Friedrich-Ebert-Stiftung Lebanon Office.

16
Box III. 1. The Lebanese gas exploration dream starts to materialize
While the idea of petroleum exploration is not new to Lebanon, a major step towards the realization of this idea was the
completion in 2013 of 2D and 3D seismic surveys of Lebanon’s Exclusive Economic Zone (EEZ). The surveys confirmed the
potential for offshore oil and gas exploration, although the amounts of recoverable gas cannot be proven until exploration
activity starts. To prepare the grounds, Offshore Petroleum Resources Law 132, adopted by parliament in August 2010,
provided the legal framework for the exploration and extraction of oil and gas from Lebanon’s territorial waters and EEZ. In
December 2012, the Lebanese Petroleum Administration (LPA) was formed under the Ministry of Energy and Water to
regulate the petroleum sector.
Law 132 stipulates, among other issues, that Lebanon reserves the right to carry out or participate in petroleum activities,
and that proceeds from petroleum activities shall be placed in a sovereign fund. The subsequent Petroleum Activities
Regulations (PAR) provide, among others: a) the rules governing the conduct of petroleum activities; b) the elements to be
included in the Exploration and Production Agreement which is signed between the government and oil companies; and c)
the general rights and duties of operators and right holders.
Sustainability issues have received attention. Article 11 of the PAR requires the government to undertake a strategic
environmental assessment (SEA) before any rights are awarded. A preliminary SEA was conducted which is expected to be
updated regularly as the process advances. The SEA resulted in a set of recommendations to be implemented as part of the
Sustainable Oil and Gas Development in Lebanon “SODEL” project, which has two components, one on health, safety and
environment and another on the use of alternative fuels in the energy and transport sectors. On the other hand, operators
are required to undertake Environmental Impact Assessments for their development and production plans, as well as
dismantling.
In addition to the legal framework, progress achieved so far include: a) Delimitation of 10 blocks within the Lebanon EEZ; b)
completion of a pre-qualification process for the 1st
round of bidding, with twelve applicants pre-qualified as right-holders
operators and thirty four as right-holders non-operators.
Source: Lebanese Petroleum Administration website (http://www.lpa.gov.lb/).
E. Develop infrastructure and sustainable cities
Lebanon has a high rate of urbanization compared to neighboring countries (with the exception of
the Gulf countries). As Lebanese cities grow beyond their service capacity (notably Beirut), issues of
infrastructure, especially water and wastewater, solid waste management, and sustainable transport
become critical. These issues pose major environmental challenges including pollution of water
bodies, degradation of coastal areas and poor air quality, which are highly associated with health
risks. In addition, unchecked urban expansion and poor regulation and enforcement of land use and
building codes in Lebanon increases disaster risks. This applies equally to large-scale risks such as
earthquakes and tsunamis, and smaller-scale risks like floods, landslides and forest fires. The
sustainability of cities and other areas of Lebanon depends critically on the country’s ability to
prevent, reduce and manage risks, in addition to the capacity to respond to crises and recover from
related consequences (See box III.2).
Compared to other countries with similar level of economic development,32 the status of the
Lebanese infrastructure is considered to be poor. The World Bank assesses public expenditure on
infrastructural development projects in Lebanon to have low returns. For example, a 2010 Public
Expenditure Review of the water sector in Lebanon33 shows that the level of expenditure on water,
averaging 0.5 percent of GDP, is below investment requirements due to limited fiscal capacity. This is
compounded by low expenditure efficiency associated with the inadequate technical, financial and
commercial performance of Regional Water Authorities. Should business remain as usual, the report
projects that Lebanon may face chronic water shortages by 2020.
32
The World Bank categorizes Lebanon among upper middle income countries. See
http://data.worldbank.org/country/lebanon. 33
World Bank 2010, Republic of Lebanon Water Sector: Public Expenditure Review (Report No. 52024-LB).

17
Box III.2 Disaster risk analysis in Lebanon
A situation analysis of disaster risk in Lebanon, conducted in 2010, provided and evaluation of available studies and data,
institutional capabilities and professional expertise related to disaster risk reduction. In terms of studies and data, the
study pointed to some positive aspects, notably the availability of hazard exposure and other base maps and the on-going
preparation of a number of risk assessment studies. Areas of improvement included the need to follow sound
methodologies, collate and validate scattered information, fill some data gaps and make data widely accessible to the
research community and the public. In terms of institutional capacity, centers of expertise – public and private – were
undertaking various efforts, although mandates overlapped and linkages between scientific information and
policy/decision-making were unclear and needed to be tightened. Shortages in capacity and expertise were highlighted,
especially in areas of geology and flood management, necessitating the development of a capacity-building strategy to
rectify the situation.
Source: UNDP Global Risk Identification Programme 2010, Disaster Risk Assessment in Lebanon: A Comprehensive Country
Situation Analysis
It may be argued that the root cause behind the problems of infrastructure is largely political. For
example, disagreement among political leaders regarding the role of the private sector in the
provision of infrastructural services and other basic services has frequently led to implementation
impasses. The solid waste management portfolio, which triggered so many back and forth
discussions in the Council of Ministers, is a case in point.
In addition to the impact on the well-being of citizens, the poor quality of infrastructure services is
also affecting the business environment, especially for SMEs. The World Economic Forum’s Global
Competitiveness Report for 2014-201534 shows that Lebanon ranks low in terms of overall
infrastructure (at 2.3 value35 and 140 rank), including for roads (2.8 value and 120 rank) and mobile
telephone subscriptions (80.6 subscriptions/100 population and 114 rank). The situation of sea ports
and airport infrastructure is better with a medium ranking compared to other Arab countries (see
table III.5).
Table III.5. Lebanon’s Infrastructure score and ranking compared to neighboring countries
Country Quality of overall
infrastructure
Quality of roads
Quality of port
infrastructure
Quality of air transport
infrastructure
Quality of electricity supply
Fixed telephone lines/100 pop.
Mobile telephone subscriptions/100
pop.
Attribute Value Rank Value Rank Value Rank Value Rank Value Rank Value Rank Value Rank
UAE 6.4 3 6.6 1 6.5 3 6.7 2 6.6 11 22.3 50 171.9 6
Bahrain 5.6 21 5.4 22 5.7 15 5.2 39 6.2 31 21.8 53 165.9 8
Oman 5.4 25 6.0 8 5.2 33 5.1 42 6.3 20 9.7 88 154.6 18
Qatar 5.4 26 5.0 34 5.4 24 6.0 12 6.5 15 19.0 60 152.6 21
Saudi Arabia 5.2 29 5.3 26 5.0 40 5.1 41 6.2 26 16.4 70 176.5 5
Cyprus 5.2 30 5.3 24 4.9 45 5.1 43 5.5 43 30.6 36 95.2 104
Turkey 5.1 33 4.9 40 4.4 57 5.4 34 4.8 72 18.1 65 93.0 105
Jordan 4.8 48 4.1 61 4.1 72 4.8 55 5.4 49 5.2 105 141.8 31
Morocco 4.6 55 4.5 51 4.9 43 4.8 51 5.4 48 8.9 94 128.5 45
Israel 4.4 63 4.7 45 3.8 86 4.9 50 5.9 34 44.8 15 122.8 53
Kuwait 4.3 67 4.6 48 3.9 82 3.8 100 5.0 63 15.1 75 190.3 3
Tunisia 3.9 83 3.7 83 3.9 83 4.2 77 5.0 65 9.3 89 115.6 63
Algeria 3.6 102 3.1 107 2.8 117 3.0 128 4.0 91 8.0 99 102.0 91
Egypt 2.9 125 2.9 118 4.2 66 4.6 60 2.7 121 8.3 97 121.5 55
Mauritania 2.6 134 2.3 137 2.4 135 2.4 140 3.3 105 1.4 120 102.5 90
Yemen 2.5 136 2.5 131 2.6 128 2.3 141 1.5 142 4.7 107 69.0 127
Lebanon 2.3 140 2.8 120 4.1 73 4.5 65 1.4 143 18.0 66 80.6 114 Libya 1.9 144 2.1 142 2.6 131 2.4 139 2.8 116 12.7 82 165.0 9
Note: Value ranges from 1 (worse) to 7 (best).
Source: World Economic Forum 2014, The Global Competitiveness Report 2014–2015: Full Data Edition.
34
World Economic Forum 2014, The Global Competitiveness Report 2014–2015: Full Data Edition. 35
Values provided range from 1 (worse) to 7 (best).

18
As described in Box III.3, the influx of Syrian refuges over the past few years has had significant
impact on water, wastewater and solid waste infrastructures in Lebanon, therefore exacerbating an
already difficult situation.
Box III.3. Impact of the influx of Syrian refugees on water, wastewater and solid waste
The influx of Syrian refugees has important impacts on water, wastewater and solid waste. Increased demand for water
associated with refugee population was estimated at between 33 and 53 million cubic meters (May 2014 estimate) and
was expected to reach a figure between 43 and 70 million cubic meters in December 2014. Similarly, the refugee
population was estimated to increase the level of wastewater generated by 8 to 14 percent, with the largest increase being
in the Bekaa region. Finally, the increase of solid waste generation attributed to the refugees was estimated at 889 tons
per day or 324,568 tons per year by the end of 2014. The majority of this incremental waste is expected to be thrown in
open dumps, therefore increasing the risk of contamination of land, surface water and groundwater.36
Source: Ministry of Environment, UNDP and EU 2014, Lebanon Environmental Assessment of the Syrian Conflict and
Priority Interventions
1. Water
Following one of Lebanon’s driest years in recent times, summer of 2014 witnessed genuine popular
concerns about water security. This exceptional situation is expected to become closer to the norm
in future years due to increasing demand for water and the impacts of climate change on
precipitation patterns. There are wide disparities in access to water between the different regions in
Lebanon (Figure III.8). In the Beirut metropolitan area, where the majority of the Lebanese
population resides, connectivity to the water distribution network is relatively high (over 90%) at
reasonably low cost (flat fee of LL296,000 equivalent to less than $200). However, intermittence of
supply is the issue of concern, which average supply as low as three hours a day in the summer
season. Reliance on private water supply (tankers and bottled water) is therefore common, and
comes at a high cost for poorer households, raising social justice concerns. Connected customers pay
as much as 65% of their total expenditure on water to private suppliers.37
Public water supply and consumption are inefficient due to lack of volumetric metering, high losses
in the distribution network and inadequate bill collection. A recent survey conducted by the Ministry
of Energy and Water in collaboration with UNDP revealed more than 59 thousand unlicensed private
wells compared to around 21,000 licensed ones.38 This over-abstraction of underground water leads
to water capital depletion and seawater intrusion.
Wastewater, both domestic and industrial, is largely disposed untreated in coastal waters and rivers
(92% of generated wastewater) due to a number of reasons: Around one third of households are not
connected to the public sewerage network (notably outside the Beirut and mount Lebanon areas);
treatment capacity is low as treatment plants are not yet operational; or works to connect the
sewerage network to the treatment plants are unfinished. The World Bank estimated the cost of
environmental degradation due to untreated wastewater disposal to be at 1% of GDP.39
36
Ministry of Environment, UNDP and EU, 2014, Lebanon Environmental Assessment of the Syrian Conflict and Priority
Interventions. 37
Ahmad Nizam 2011, Water Sector Reform in Lebanon and Impact on Low Income Households (presentation made at the
4th ACWUA Best Practices Conference on Water and Wastewater Utilities Reform “Changes and Challenges”, Sharm El
Sheikh, 7-8 December 2011. 38
As quoted in Ministry of Environment, UNDP and EU 2014, Lebanon Environmental Assessment of the Syrian Conflict and
Priority Interventions. 39
As quoted in Lebanon’s MDG Report 2013-3014.
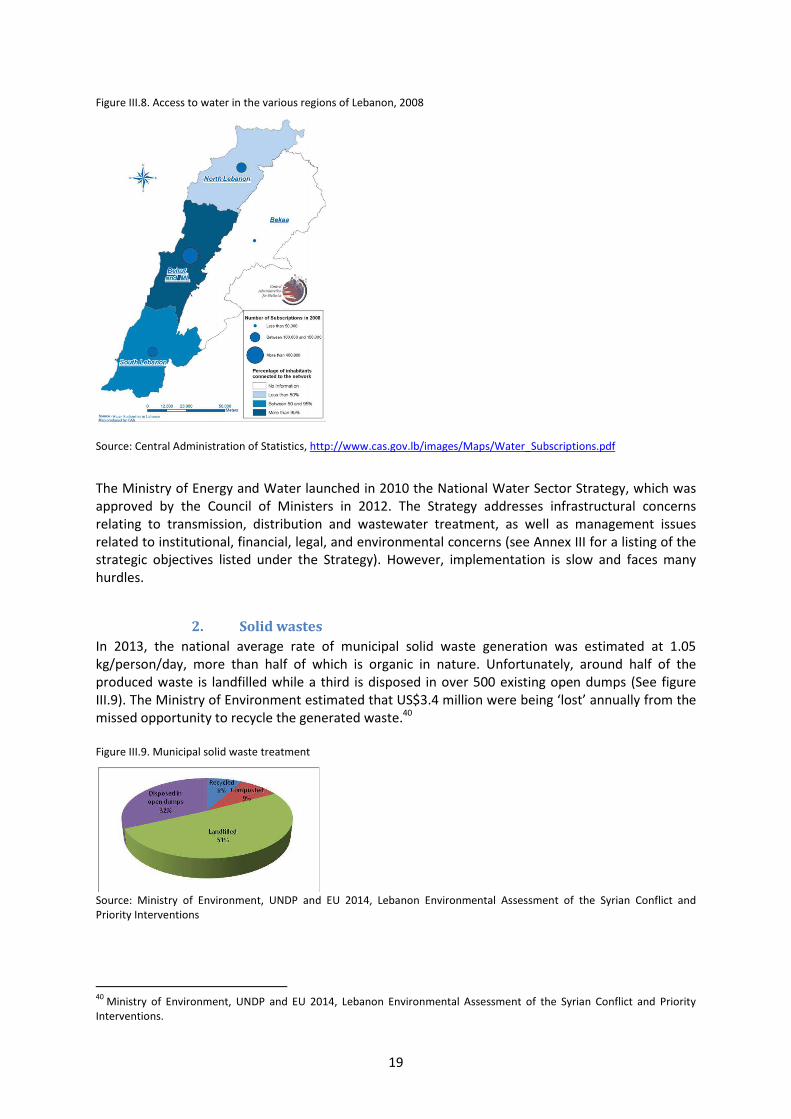
19
Figure III.8. Access to water in the various regions of Lebanon, 2008
Source: Central Administration of Statistics, http://www.cas.gov.lb/images/Maps/Water_Subscriptions.pdf
The Ministry of Energy and Water launched in 2010 the National Water Sector Strategy, which was
approved by the Council of Ministers in 2012. The Strategy addresses infrastructural concerns
relating to transmission, distribution and wastewater treatment, as well as management issues
related to institutional, financial, legal, and environmental concerns (see Annex III for a listing of the
strategic objectives listed under the Strategy). However, implementation is slow and faces many
hurdles.
2. Solid wastes
In 2013, the national average rate of municipal solid waste generation was estimated at 1.05
kg/person/day, more than half of which is organic in nature. Unfortunately, around half of the
produced waste is landfilled while a third is disposed in over 500 existing open dumps (See figure
III.9). The Ministry of Environment estimated that US$3.4 million were being ‘lost’ annually from the
missed opportunity to recycle the generated waste.40
Figure III.9. Municipal solid waste treatment
Source: Ministry of Environment, UNDP and EU 2014, Lebanon Environmental Assessment of the Syrian Conflict and
Priority Interventions
40
Ministry of Environment, UNDP and EU 2014, Lebanon Environmental Assessment of the Syrian Conflict and Priority
Interventions.
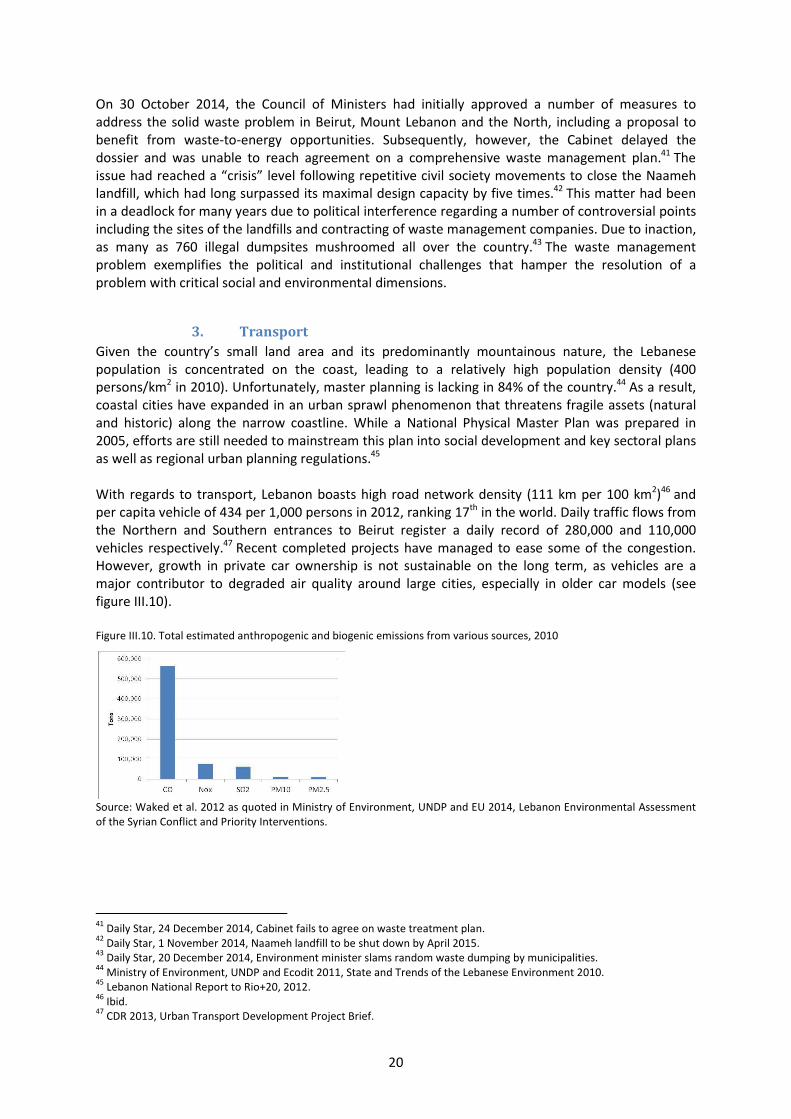
20
On 30 October 2014, the Council of Ministers had initially approved a number of measures to
address the solid waste problem in Beirut, Mount Lebanon and the North, including a proposal to
benefit from waste-to-energy opportunities. Subsequently, however, the Cabinet delayed the
dossier and was unable to reach agreement on a comprehensive waste management plan.41 The
issue had reached a “crisis” level following repetitive civil society movements to close the Naameh
landfill, which had long surpassed its maximal design capacity by five times.42 This matter had been
in a deadlock for many years due to political interference regarding a number of controversial points
including the sites of the landfills and contracting of waste management companies. Due to inaction,
as many as 760 illegal dumpsites mushroomed all over the country.43 The waste management
problem exemplifies the political and institutional challenges that hamper the resolution of a
problem with critical social and environmental dimensions.
3. Transport
Given the country’s small land area and its predominantly mountainous nature, the Lebanese
population is concentrated on the coast, leading to a relatively high population density (400
persons/km2 in 2010). Unfortunately, master planning is lacking in 84% of the country.44 As a result,
coastal cities have expanded in an urban sprawl phenomenon that threatens fragile assets (natural
and historic) along the narrow coastline. While a National Physical Master Plan was prepared in
2005, efforts are still needed to mainstream this plan into social development and key sectoral plans
as well as regional urban planning regulations.45
With regards to transport, Lebanon boasts high road network density (111 km per 100 km2)46 and
per capita vehicle of 434 per 1,000 persons in 2012, ranking 17th in the world. Daily traffic flows from
the Northern and Southern entrances to Beirut register a daily record of 280,000 and 110,000
vehicles respectively.47 Recent completed projects have managed to ease some of the congestion.
However, growth in private car ownership is not sustainable on the long term, as vehicles are a
major contributor to degraded air quality around large cities, especially in older car models (see
figure III.10).
Figure III.10. Total estimated anthropogenic and biogenic emissions from various sources, 2010
Source: Waked et al. 2012 as quoted in Ministry of Environment, UNDP and EU 2014, Lebanon Environmental Assessment
of the Syrian Conflict and Priority Interventions.
41
Daily Star, 24 December 2014, Cabinet fails to agree on waste treatment plan. 42
Daily Star, 1 November 2014, Naameh landfill to be shut down by April 2015. 43
Daily Star, 20 December 2014, Environment minister slams random waste dumping by municipalities. 44
Ministry of Environment, UNDP and Ecodit 2011, State and Trends of the Lebanese Environment 2010. 45
Lebanon National Report to Rio+20, 2012. 46
Ibid. 47
CDR 2013, Urban Transport Development Project Brief.

21
F. Protect natural habitats and biodiversity
Land resources in Lebanon suffer from different forms of degradation, with soil erosion, salinization
and contamination considered to be the three main challenges.48 Land degradation in Lebanon can
be attributed to both natural (mainly related to topography and lithology) and human-induced
causes. The latter causes include unplanned, fast urban expansion (and associated road construction
activity), inappropriate agricultural and irrigation practices and fertilizer application (leading to
salinization and contamination), and quarrying activities. Due to post-war high demand for
construction material, the quarrying area doubled within a period of 10 years (1996-2005) from
2,897 ha to 5,267 ha, with expansion (sometimes of illegal nature) occurring on fragile mountainous
land at the expense of forests and agricultural lands.49 On the other hand, urbanization, forest fires,
overgrazing and abusive felling are the four main direct drivers of forest degradation and
deforestation. The year 2007 was a record year in both number of fires (324 fires) and extent of the
damaged area (4,197 ha).50
Lebanon’s forest cover is estimated at 13% of the total land area. A joint FAO/Ministry of Agriculture
assessment of 222 permanent sampling plots concluded that as much as 85% of forests in Lebanon
are degraded while 14% have been impacted by fire. Warmer temperatures due to climate change
are expected to endanger Lebanon’s specie of national pride, the Cedrus libani, which has been
recently added to the IUCN’s Red List of Threatened Species.51 On the positive side, and as of June
2014, the number of established nature reserves reached 15, with a total area amounting to
approximately 2.5 percent of the Lebanese territory.52
A report on the cost of environmental degradation, undertaken in cooperation with the World Bank-
METAP in 2005 attributes a 0.6% GDP loss to soil and wildlife degradation.53 Environmental
governance, including institutions, laws, information and statistics, research and development
activity and funding, must be strengthened if the environment is to be sustainably managed.54 It
should be borne in mind, however, that the human induced land degradation and deforestation
pressures described above are driven by underlying socio-economic, institutional and legislative
forces. Therefore, environmental degradation cannot be addressed in isolation from the socio-
economic context, but rather it needs to be mainstreamed and approached in an integrated manner.
In particular, the impact of Syrian refugees on terrestrial ecosystems, as summarized in box III.4
cannot be approached from an environmental approach without regard to humanitarian and even
political factors.
48
Ministry of Environment, UNDP and Ecodit 2011, State and Trends of the Lebanese Environment 2010. 49
Darwish T. 2009, Sustainable Land Management Practices to Reverse Land Degradation in Lebanon, ESCWA paper
E/ESCWA/SDPD/2009/WG.2/5. 50
Ministry of Environment, UNDP and Ecodit 2011, State and Trends of the Lebanese Environment 2010. 51
Ministry of Environment, GEF and UNDP 2014, Safeguarding and Restoring Lebanon’s Woodland Resources Project 52
Ministry of Environment, UNDP and EU 2014, Lebanon Environmental Assessment of the Syrian Conflict and Priority
Interventions. 53
World Bank 2011, Republic of Lebanon Country Environmental Analysis (Report No. 62266-LB). 54
Ministry of Environment, UNDP and Ecodit 2011, State and Trends of the Lebanese Environment 2010.

22
Box III.4. Impact of the influx of Syrian refugees on terrestrial ecosystems
Due to the Syrian refugee crisis, and in response to heightened demand for housing, permits were provided by the Ministry
of Interior and Municipalities for the accelerated construction of housing units that do not necessarily meet urban planning
procedures and building standards. In addition, the number of informal tented settlements hosting Syrian refugees rose
from 282 in June 2012 to 1,069 in April 2014. These settlements create the risk of encroachment on agricultural or
environmentally sensitive areas and fragile ecosystems, in addition to the harm caused by tree felling for heating,
increased surface water abstraction and inadequate septage and solid waste disposal.
Source: Ministry of Environment, UNDP and EU 2014, Lebanon Environmental Assessment of the Syrian Conflict and
Priority Interventions.
To conclude this section, it should be noted that future scenarios for Lebanon remain highly
unpredictable, hinging on whether the political environment – internal and external - will stabilize to
allow for the implementation of planned structural reforms. In particular, developments relating to
the Syrian refugees crisis will have a substantial impact on a number of variables. The Government
of Lebanon implemented in late 2014 provisions limiting the entry of Syrians into Lebanon, the
results of which remain unclear. In addition, whether and how the Lebanese government will
succeed to put the recently discovered gas reserves to its development advantage will highly
impinge on the future transformations of Lebanon.
IV. The institutional framework for sustainable development in
Lebanon
The institutional framework is understood in this section to include: a) the organizations and actors
involved in sustainable development; b) the set of government policies and strategies guiding the
development process; and c) the laws that govern sustainable development.
A. Major development actors
Lebanon lacks an integrated strategic planning entity having lead responsibility for sustainable
development. Instead, a number of key actors play complementary, and sometimes overlapping
roles. Without underestimating the importance of the roles played by sectoral ministries, the
following paragraphs describe major actors (those having overarching mandates) and their roles. The
Ministry of Environment was included given the mandate granted by the Council to Ministers to the
Minister of Environment to act as “National Coordinator of Sustainable Development” (COM
Decision 103 dated 6/4/2006).
• The Lebanese Parliament is Lebanon’s legislative body. According to the 2014-2015 list,
there were 16 parliamentary committees, including one on environment.55 Due to Lebanon’s
political crisis and disagreement about a new electoral law, the Lebanese Parliament
unfortunately “self-extended” its term twice, in May 2013 and November 2014 (term
extended to 2017). Civil society has termed this extension unconstitutional and a blow to
democracy.56
• The Council of Ministers is Lebanon’s executive body and is responsible for enacting
regulations through decisions and decrees. It is headed by the Presidency of the Council of
Ministers (PCM), which oversees a number of important public bodies as shown in figure
55
https://www.lp.gov.lb/Temp/Files/ed833a61-83cd-4658-bdf7-b6c16dce1224.pdf 56
Reuters, 5 November 2014, Lebanese parliament extends own term till 2017 amid protests.

23
IV.1. Among these bodies, the Central Administration of Statistics is the official public
institution mandated to generate, coordinate and disseminate national statistics.
Figure IV.1. Public bodies attached to the Presidency of the Council of Ministers
Note: CI = Central Inspection, CSB = Civil Service Board, CAS = Central Administration of Statistics, IDAL =
Investment Development Authority of Lebanon, CDR = Council for Development and Reconstruction, CNRS =
National Council for Scientific Research
Source: Compiled by authors based on http://www.pcm.gov.lb/arabic/subpg.aspx?pageid=4211.
• The independent judiciary system of judges and prosecutors enforces laws and regulations,
including on environmental issues. In April 2014, law no. 251 was adopted which allows for
the appointment of full-time environmental attorney generals and inspection judges in
various Lebanese governorates. This constitutes an important step forward in environmental
governance and accountability.
• The Council for Development and Reconstruction (CDR) was established in 1977 to lead
reconstruction projects, succeeding the Ministry of Planning. In 2001, it was merged with
other national bodies to become the single executive national agency implementing
infrastructure and development projects. CDR also prepares sectoral plans (e.g. the master
land use plan) that are subsequently implemented and managed by concerned ministries.57
• The Ministry of Environment was established in 1993 (law 216/1993). Its mandate was
expanded in 2005 through law 690/2005, which promoted its role in all issues relating to the
environment and sustainability of natural resources. In 2009, a decree (2275/2009) defined a
new organizational structure and increased the number of staff to 182 full-timers, though
current staff size remains below this number. The Ministry cooperates with a network of
research institutions including the Industrial Research Institute, the Lebanese Agricultural
Research Institute and the National Council for Scientific Research.58
• Municipalities are important local development actors having diverse responsibilities.
Despite that, the 994 Lebanese municipalities face chronic shortage in finance.59
In order to ensure coordination across ministries and other concerned stakeholders on particular
development-related themes such as poverty, environment, education and health, inter-ministerial
committees are typically established with varying mandates and structures. For example, the
Ministry of Finance lists on its website three inter-ministerial committees chaired by the Prime
Minister that are responsible for following-up on the implementation of Paris III reforms in the
economic, social and privatization and infrastructure domains. 60 The effectiveness of these
committees needs to be properly assessed.
57
Ministry of Finance 2014, Lebanon Country Profile 2014. 58
Ministry of Environment, UNDP and Ecodit 2011, State and Trends of the Lebanese Environment 2010. 59
Ibid. 60
http://www.finance.gov.lb/en-US/finance/Reforms/Pages/InterMinisterialCommitteeDocuments.aspx
Presidency of the
Council of Ministers
Monitoring and
oversight bodies
(e.g. CI, CSB)
Public
administrations and
authorities
(e.g. CAS, IDAL)
Religious councils and
courts
Councils and funds
(e.g. CDR, CNRS)

24
In addition to governmental bodies, civil society organizations are important development actors in
Lebanon compared to other neighboring countries. Registered NGOs exceeded in number 6,000
organizations, although their level of dynamism and impact is very mixed.61 NGOs typically
participate in consultations and can to some extent influence the decision-making process.62 In the
environmental field alone, the Ministry of Environment estimates the presence of over 300
registered NGOs covering a broad spectrum of activities.63 Some NGOs have acquired important
niches such as reforestation and combating forest fires, the protection of natural reserves and
organic farming.
As a country with a liberal economic system, the private sector plays an important role in Lebanon’s
economy and has the potential to become a main development partner. The Lebanese political
parties are divided between opponents and proponents of private sector involvement in public
services provision. Measures are being taken to increase and regulate the private sector’s role, as
shown in box IV.1. The box also describes initiatives by Lebanese enterprises to improve their
sustainability profile.
Box IV.1. The Lebanese private sector: A development partner?
The Higher Council for Privatization was established in 2000 and is headed by the Prime Minister with four permanent
members namely the ministers of Finance, Economy and Trade, Justice and Labor. Since the adoption of the privatization
framework law in 2000, two sector-specific laws have been enacted by Parliament in 2002, namely in the
telecommunication and the electricity sectors. According to Lebanon’s Paris III paper, public-private partnership was to be
promoted by allocating the private sector a bigger role in the implementation of large infrastructural projects and public
service delivery. A PPP draft law is still pending Parliament approval since 2007.64
In 2013, HCP launched the PPP guidelines
to raise awareness about the subject.65
The concept of corporate social responsibility (CSR) is slowly gaining grounds among Lebanese enterprises. Between 2003
and 2014, 27 Lebanese entities have registers as members in the UN’s Global Compact,66
including companies, SMEs,
Universities and NGOs. Interest in CSR reporting is still embryonic: Two companies only have since 2013 issued Global
Reporting Initiative (GRI) compliant reports.67
On the other hand, Lebanese companies are interested in improving their environmental performance and engaging in the
emerging environmental goods and services sector. Lebanon’s Cleaner Production Center has since its establishment by
the Ministry of Environment in 2002 been assisting SMEs adopt sustainable practices and industrial production modes that
are resource efficient and produce less pollutants.68
The Association of Lebanese Industrialists’ Environment and Energy
Department is also assisting industrialists through their Green Help Desk by providing training and information on green
economy opportunities.69
B. National policy interventions for sustainable development
1. National overarching strategy or plan for sustainable development
As stated earlier, Lebanon does not have a national overarching sustainable development vision,
strategy or plan. The country lacks a national economic plan and a poverty reduction strategy (or
other forms of medium-term development plans such as 5-year plans).
61
Daily Star, 27 November 2014, Lebanon’s civil society sector: a lost continent. 62
Next Generation Democracy (2014) Middle East and North Africa – Track 1: People and Communities, Regional Trends
2000-15 and Scenarios 2015-2030. 63
Ministry of Environment, UNDP and Ecodit 2011, State and Trends of the Lebanese Environment 2010. 64
http://www.hcp.gov.lb/index.asp 65
http://www.hcp.gov.lb/pictures/pdffile/News0.9128229_final%20guide_13Feb2014_website.pdf 66
https://www.unglobalcompact.org/participants/search 67
The companies are Audi Bank in the financial services sector and Holcim in the construction sector. Source: Global
Reporting Initiative’s Sustainability Disclosure Database. 68
http://www.lebanese-cpc.net 69
The Green Help Desk was established in 2012 in cooperation with ESCWA. See http://www.ali.org.lb/english/green.asp.

25
The Lebanese Constitution, promulgated in 1926, makes no explicit reference to sustainable
development. However, in its preamble, introduced by the 1990 amendment, the constitution
declares that Lebanon abides by the Universal Declaration of Human Rights, and that it respects
“social justice and equality of rights and duties among all citizens without discrimination”. Finally,
the constitution considers the equal development among regions as a basic pillar of State unity.70
Section III of this document has provided a list of key recent policy documents providing overall
guidance to development action (Table III.1). From this list, it is perhaps the “Economic and Social
Reform Action Plan (2012–2015): Seven Pillars for Implementing Economic and Social Reform in
Lebanon,” prepared by the Presidency of the Council of Ministers in 2012 that best summarizes
current development courses adopted by the Lebanese government.
A number of global studies, including by the Organization for Economic Cooperation and
Development (OECD) and the UN Department of Economic and Social Affairs (DESA), have identified
a number of good practices that make a strategy or plan effective in the achievement of its aims.
These good practices include: 1) Integration of economic, social and environmental pillars; 2) A long-
term, inter-generational timeframe; 3) Being based on analysis and comprehensive assessments; 4)
High level of vertical and horizontal coordination among institutions; 5) High participation of
stakeholders; 6) Having clear and measurable goals, targets and indicators; 7) Continuous
monitoring and evaluation; 8) Inclusion of adequate policy mix; and 9) Clear provisions for mobilizing
the required means of Implementation.
Annex 2 attempts to assess the Economic and Social Reform Action Plan (2012–2015) against the
above-mentioned criteria. The objective is not to be critical of this plan in particular, as it is
understood that the Action Plan is not, and cannot be considered as, an overall and long term
national sustainable development plan. The aim is only to identify and raise awareness about areas
that could be improved upon in future exercises. In this regard, Annex 2 shows that areas requiring
improvement mainly include the need to strengthen the science-policy interface and conduct
integrated assessments to guide strategy formulation. Another area of deficiency relates to the
adoption of clear, quantitative targets, which is a pre-requisite for genuine monitoring, evaluation
and follow-up. In addition, it is not clear how vertical and horizontal coherence is being assured nor
regarding the level of participation by different stakeholders in the strategy formulation process.
2. Sectoral policies and strategies
Various Lebanese ministries have formulated over the course of the past ten years policy or strategy
documents that have guided their actions in support of sustainable development. It is important to
analyze these documents to see how much they are supportive of the achievement of the
Sustainable Development Goals that have been globally proposed as part of the anticipated post-
2015 development Agenda,71 and identify major gaps.
Table IV.1 provides an inventory of sectoral policies/strategies issued by different ministries since
2005 onward. The table provides a preliminary assessment of these documents according to the
following five basic governance principles: 1) Status of endorsement by the Council of Ministers as a
sign of political will; 2) Availability on the Internet, as a minimum sign of transparency and fulfillment
of the public’s right to information; 3) How much these documents are based on scientific
70
The Lebanese Constitution Promulgated May 23, 1926 with its Amendments, available at:
http://www.presidency.gov.lb/English/LebaneseSystem/Documents/Lebanese%20Constitution.pdf 71
The SDG proposal as prepared by the Open Working Group may be accessed at:
https://sustainabledevelopment.un.org/sdgsproposal.
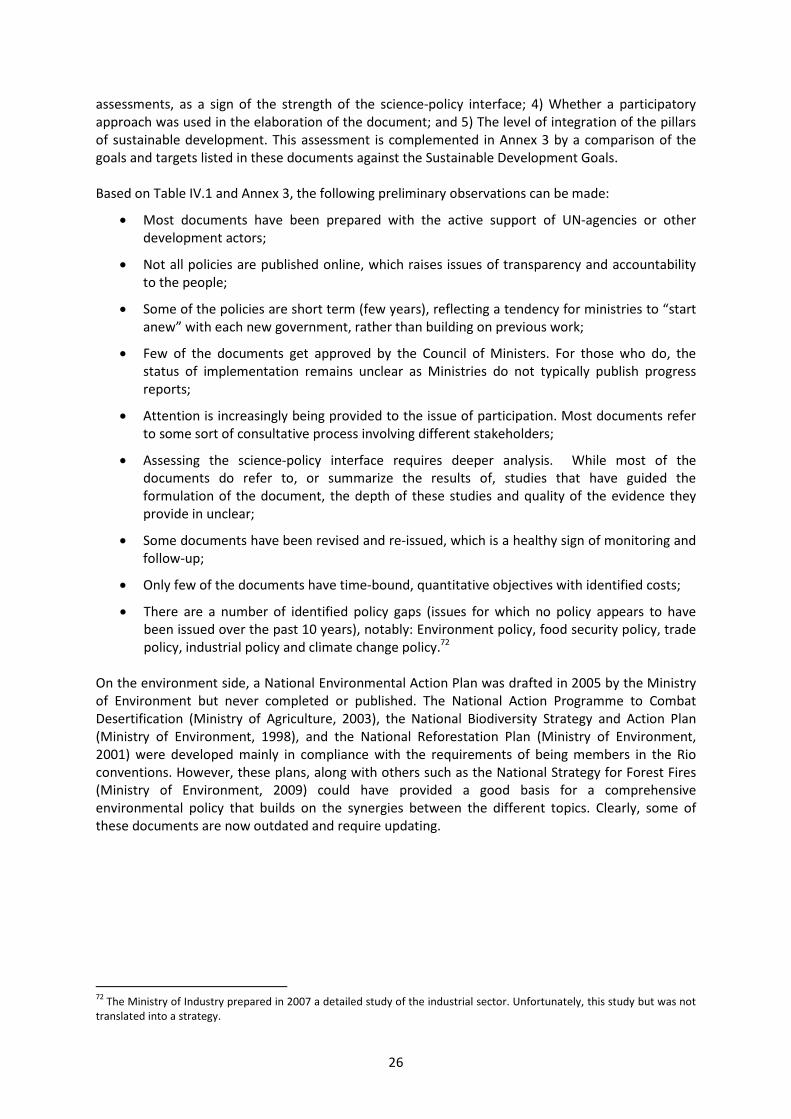
26
assessments, as a sign of the strength of the science-policy interface; 4) Whether a participatory
approach was used in the elaboration of the document; and 5) The level of integration of the pillars
of sustainable development. This assessment is complemented in Annex 3 by a comparison of the
goals and targets listed in these documents against the Sustainable Development Goals.
Based on Table IV.1 and Annex 3, the following preliminary observations can be made:
• Most documents have been prepared with the active support of UN-agencies or other
development actors;
• Not all policies are published online, which raises issues of transparency and accountability
to the people;
• Some of the policies are short term (few years), reflecting a tendency for ministries to “start
anew” with each new government, rather than building on previous work;
• Few of the documents get approved by the Council of Ministers. For those who do, the
status of implementation remains unclear as Ministries do not typically publish progress
reports;
• Attention is increasingly being provided to the issue of participation. Most documents refer
to some sort of consultative process involving different stakeholders;
• Assessing the science-policy interface requires deeper analysis. While most of the
documents do refer to, or summarize the results of, studies that have guided the
formulation of the document, the depth of these studies and quality of the evidence they
provide in unclear;
• Some documents have been revised and re-issued, which is a healthy sign of monitoring and
follow-up;
• Only few of the documents have time-bound, quantitative objectives with identified costs;
• There are a number of identified policy gaps (issues for which no policy appears to have
been issued over the past 10 years), notably: Environment policy, food security policy, trade
policy, industrial policy and climate change policy.72
On the environment side, a National Environmental Action Plan was drafted in 2005 by the Ministry
of Environment but never completed or published. The National Action Programme to Combat
Desertification (Ministry of Agriculture, 2003), the National Biodiversity Strategy and Action Plan
(Ministry of Environment, 1998), and the National Reforestation Plan (Ministry of Environment,
2001) were developed mainly in compliance with the requirements of being members in the Rio
conventions. However, these plans, along with others such as the National Strategy for Forest Fires
(Ministry of Environment, 2009) could have provided a good basis for a comprehensive
environmental policy that builds on the synergies between the different topics. Clearly, some of
these documents are now outdated and require updating.
72
The Ministry of Industry prepared in 2007 a detailed study of the industrial sector. Unfortunately, this study but was not
translated into a strategy.
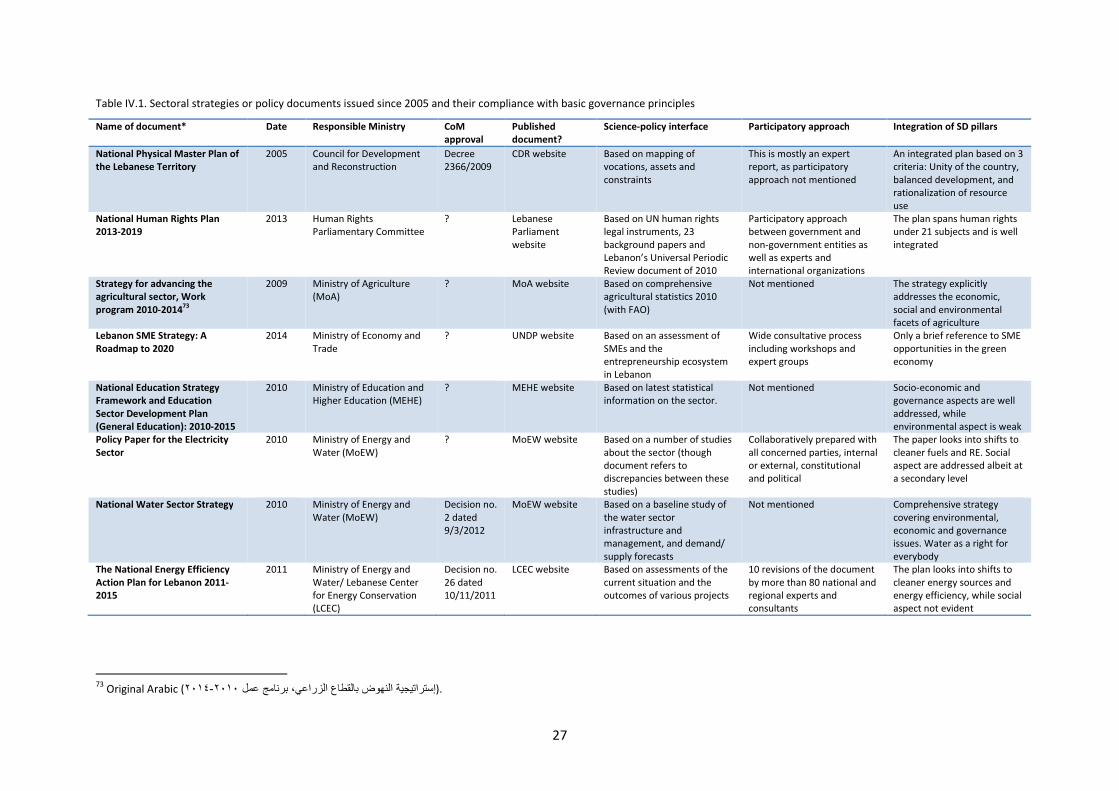
27
Table IV.1. Sectoral strategies or policy documents issued since 2005 and their compliance with basic governance principles
Name of document* Date Responsible Ministry CoM
approval
Published
document?
Science-policy interface Participatory approach Integration of SD pillars
National Physical Master Plan of
the Lebanese Territory
2005 Council for Development
and Reconstruction
Decree
2366/2009
CDR website Based on mapping of
vocations, assets and
constraints
This is mostly an expert
report, as participatory
approach not mentioned
An integrated plan based on 3
criteria: Unity of the country,
balanced development, and
rationalization of resource
use
National Human Rights Plan
2013-2019 2013 Human Rights
Parliamentary Committee
? Lebanese
Parliament
website
Based on UN human rights
legal instruments, 23
background papers and
Lebanon’s Universal Periodic
Review document of 2010
Participatory approach
between government and
non-government entities as
well as experts and
international organizations
The plan spans human rights
under 21 subjects and is well
integrated
Strategy for advancing the
agricultural sector, Work
program 2010-201473
2009 Ministry of Agriculture
(MoA)
? MoA website Based on comprehensive
agricultural statistics 2010
(with FAO)
Not mentioned The strategy explicitly
addresses the economic,
social and environmental
facets of agriculture
Lebanon SME Strategy: A
Roadmap to 2020
2014 Ministry of Economy and
Trade
? UNDP website Based on an assessment of
SMEs and the
entrepreneurship ecosystem
in Lebanon
Wide consultative process
including workshops and
expert groups
Only a brief reference to SME
opportunities in the green
economy
National Education Strategy
Framework and Education
Sector Development Plan
(General Education): 2010-2015
2010 Ministry of Education and
Higher Education (MEHE)
? MEHE website Based on latest statistical
information on the sector.
Not mentioned Socio-economic and
governance aspects are well
addressed, while
environmental aspect is weak
Policy Paper for the Electricity
Sector
2010 Ministry of Energy and
Water (MoEW)
? MoEW website Based on a number of studies
about the sector (though
document refers to
discrepancies between these
studies)
Collaboratively prepared with
all concerned parties, internal
or external, constitutional
and political
The paper looks into shifts to
cleaner fuels and RE. Social
aspect are addressed albeit at
a secondary level
National Water Sector Strategy 2010 Ministry of Energy and
Water (MoEW)
Decision no.
2 dated
9/3/2012
MoEW website Based on a baseline study of
the water sector
infrastructure and
management, and demand/
supply forecasts
Not mentioned Comprehensive strategy
covering environmental,
economic and governance
issues. Water as a right for
everybody
The National Energy Efficiency
Action Plan for Lebanon 2011-
2015
2011 Ministry of Energy and
Water/ Lebanese Center
for Energy Conservation
(LCEC)
Decision no.
26 dated
10/11/2011
LCEC website Based on assessments of the
current situation and the
outcomes of various projects
10 revisions of the document
by more than 80 national and
regional experts and
consultants
The plan looks into shifts to
cleaner energy sources and
energy efficiency, while social
aspect not evident
73
Original Arabic ( ٢٠١٤-٢٠١٠إستراتيجية النھوض بالقطاع الزراعي، برنامج عمل ).

28
Name of document* Date Responsible Ministry CoM
approval
Published
document?
Science-policy interface Participatory approach Integration of SD pillars
Solid Waste Management Plan
for Beirut, Mount Lebanon and
the North
2014 Ministry of Environment Decision
No. 46
dated
30/10/2014
– Still under
negotiation
No ? ? ?
Marine Protected Areas Strategy 2012 Ministry of Environment No IUCN website Based on a literature
scientific assessment of
biodiversity values and
surveyed through field trips
Not mentioned While the document has a
strong environmental focus, it
addresses alternative
socio-economic activities in
marine protected areas
National Strategy for Forest Fire
Management in Lebanon74
2009 Ministry of Environment Decision
No. 52
dated
13/5/2009
No Based on a mapping of forest
fires and an analysis of their
causes
National working group was
formed involving local key
players
The strategy acknowledges
that socio-economic causes
contribute to fires and the
impact of fires on
communities
Ministry of Public Health
Strategic Plan
2007 Ministry of Public Health
(MoPH)
? MoPH website Based on a review of the
health context and the
progress achieved in health
reform
Not mentioned The plan has a strong social
focus, with care to contain
health costs. Environmental
aspects not addressed
National Social Development
Strategy of Lebanon
2011 Ministry of Social Affairs No No Based on an in-depth
assessment of historical social
policy and the national
development context
The Strategy was elaborated
by an inter-ministerial
committee and involved wide
consultations
The strategy has a strong
social focus
Social Action Plan: Toward
Strengthening Social Safety Nets
and Access to Basic Social
Services
2007
Ministry of Social Affairs ? PCM’s Rebuild
Lebanon website
Based on a review of poverty
related research
Not mentioned Focus solely on social safety
nets
Rural Tourism Strategy for
Lebanon
2014 Ministry of Tourism ? Beyond Beirut
website
Based on a rural tourism
value chain assessment
Prepared through a series of
interviews, workshops and
focus group discussions
(more than 150 stakeholders)
Rural tourism is approached
from an integrated economic,
social and environmental
perspective
Strategy of the Lebanese
Ministry of Youth and Sports
2010-202075
2010 Ministry of Youth and
Sports (MoYS)
? MoYS website Not mentioned Not mentioned Limited in scope to sports and
scouting
Lebanese Youth Policy76
2012 Ministry of Youth and
Sports (MoYS)/ Youth
Forum for Youth Policy
Yes (3 April
2012)
MoYS website Not mentioned Wide consultations including
14 workshops in different
regions of Lebanon and 5
expert roundtables in 2009
Integrates youth issues in
various sectors
74
Original in Arabic ((ا)ستراتيجية الوطنية )دارة حرائق الغابات في لبنان. 75
Original in Arabic ( ٢٠٢٠-٢٠١٠استراتيجية وزارة الشباب والرياضة ). 76
Original in Arabic (وثيقة السياسة الشبابية في لبنان).

29
Name of document* Date Responsible Ministry CoM
approval
Published
document?
Science-policy interface Participatory approach Integration of SD pillars
National Strategy for
Women in Lebanon
2011-202177
2010 National Commission for
Lebanese Women (NCLW)
Yes (12 June
2012)
NCLW website Strategy refers to outcomes
of different studies. However
these studies are not cited.
Consultations with public and
non-governmental
institutions
The strategy addresses an
integrated set of women
issues in various fields.
Science, Technology and
Innovation Policy
2006
(reviewed
in 2009)
National Council of
Scientific Research
? CNRS website Based on a study of socio-
economic challenges facing
Lebanon and how to address
them.
Prepared with the
involvement of the Lebanese
scientific community and
international experts
Looks at how science,
technology and innovation
can address societal problems
in Lebanon, including
environmental ones
Strategy for the Reform and
Development of Public
Administration78
2011 Office of the Minister of
State for Administrative
Reform (OMSAR)
? OMSAR website Based on studies conducted
by OMSAR
No. Prepared by a working
group consisting of senior
administrative and academic
leaders, specialists and IT
experts
Topic is cross-cutting by
nature.
High Level E-Government
Strategy Document
2007 Office of the Minister of
State for Administrative
Reform (OMSAR)
? OMSAR website Not mentioned Inputs by different
stakeholders, government
and non-government
Focus on both citizens and
business needs
Statement of ICT Government
Policy
2011 Presidency of the Council
of Ministers (PCM)
? PCM’s National
ICT Strategy
Coordination Unit
website
Not mentioned Not mentioned Focus on both citizens and
business needs
Vision for the Development of
the Regions of Lebanon79
2009 Presidency of the Council
of Ministers (PCM)
? PCM website Based on a review of public
investment programmes and
the Mapping of Human
Poverty and Living Conditions
in Lebanon (UNDP and MoSA
2004)
Not mentioned The proposed action plan
covers the various SD pillars.
* Policy documents are ordered by responsible ministry then by date.
Note: CoM = Council of Ministers; (?) means that information was not available or not confirmed.
Sources: Compiled by the authors from the documents in column 1.
77
Revision of the 1996 National Strategy for Women’s Affairs prepared by the National Commission for Lebanese Women, which was established in 1996 under the Presidency of the Council
of Ministers. 78
An update to a similar strategy prepared by OMSAR in 2001. 79
Original in Arabic, titled: ورقة عمل مقدمة من رئاسة مجلس الوزراء حول رؤية )نماء المناطق اللبنانية

30
C. Laws governing sustainable development
1. Ratification of global and regional agreements
Lebanon has ratified many international treaties, notably the core treaties relating to human rights,
as can be seen in table IV.2. However, more efforts are needed to ratify all human rights treaties
(including those that were only signed) and their optional protocols, such as the conventions relating
to enforced disappearance, migrant workers and persons with disabilities. In addition, where
ratification did take place, implementation has overall been weak. For example, many draft laws to
improve human rights’ situation remain stalled.80 The Human Rights Council’s Universal Periodic
Review (UPR) that Lebanon underwent in 2010 identified 41 recommendations that received the
support of Lebanon, 28 recommendations that were considered to be implemented or in the
process of implementation, while 40 others did not receive national support or were rejected and 14
were to be re-examined by Lebanon at a later stage.81 One of the recommendations receiving
support is the strengthening of the institutional framework for human rights, including through the
establishment of a national human rights institution in accordance with the Paris Principles. Another
flagged area of weakness relates to reporting by Lebanon to treaty bodies, since some reports were
overdue for years. The report to the Committee on Economic, Social and Cultural Rights, for
example, is overdue since 1995.82
Table IV.2. Signature and ratification by Lebanon of core international human rights treaties
Treaty Signature Date Ratification or
Accession(a) Date
International Convention on the Elimination of All Forms of Racial
Discrimination*
12 Nov 1971 (a)
International Covenant on Civil and Political Rights 03 Nov 1972 (a)
International Covenant on Economic, Social and Cultural Rights 03 Nov 1972 (a)
Convention on the Rights of the Child 26 Jan 1990 14 May 1991
Optional Protocol to the Convention on the Rights of the Child on the
involvement of children in armed conflict
11 Feb 2002
Optional Protocol to the Convention on the Rights of the Child on the sale
of children child prostitution and child pornography
10 Oct 2001 08 Nov 2004
Convention against Torture and Other Cruel Inhuman or Degrading Treatment or
Punishment
05 Oct 2000 (a)
Convention on the Elimination of All Forms of Discrimination against Women* 16 Apr 1997 (a)
Optional Protocol of the Convention against Torture 22 Dec 2008 (a)
International Convention for the Protection of All Persons from Enforced
Disappearance
06 Feb 2007
Convention on the Rights of Persons with Disabilities 14 Jun 2007
* Ratified with reservation.
Source: http://tbinternet.ohchr.org/_layouts/TreatyBodyExternal/Treaty.aspx
On the other hand, multilateral environmental agreements and trade and investment agreements
have also been signed as listed in tables IV.3 and IV.4, noting that these are not exhaustive lists.
Lebanon has initiated procedures for accession to the WTO in 1999 and a working party has been
established, and economic and legislative reforms required for conformity to WTO requirements are
underway.
Benefit to Lebanon from the signature of trade and investment agreements requires a detailed
analysis which is beyond the scope of this report. Just to give a preliminary indication, exports to the
80
Human Rights Watch, World Report 2013, Lebanon chapter (http://www.hrw.org/world-report/2013/country-
chapters/lebanon). 81
Human Rights Council 2011, Report of the Working Group on the Universal Periodic Review - Lebanon (A/HRC/16/18). 82
Compilation prepared by OHCHR and submitted to the Human Rights Council (A/HRC/WG.6/9/LBN/2).

31
EU – one of the leading trade partners for Lebanon - over the past 10 years have fluctuated between
a lowest of €217 million in 2005 and a highest of €412 million in 2011. In 2013, exports to the EU
consisted mainly of fuels and mining products (22.8%), agriculture products (22.6%) and chemicals
(13.4%).83 Lebanon can improve its export potential only if it improves the quality of its products and
abides by global environmental standards adopted in the EU and other important markets. For
example, a study conducted by UNEP84 estimated that phasing out methyl bromide and use of
alternatives in the production of vegetables and fruits would be environmentally beneficial and
improve Lebanon’s compliance with the Montreal Protocol, to which it is a member. Economically
speaking, methyl bromide substitution will come at an additional cost; however this cost may be
recouped as it will become possible for Lebanese agricultural products to enter EU and other
markets (see success story on methyl bromide substitution in section VI).
Table IV.3. Ratification by Lebanon of main multilateral environmental agreements
Treaty Signature Ratification
Agreement on the Conservation of African-Eurasian Migratory Waterbirds 01 Jan 2002
Convention for the Protection of the Mediterranean Sea Against Pollution
(Barcelona Convention)
++ Prevention and Emergency Protocol
++ Specially Protected Areas Protocol
08 Nov 1977
01 Jan 1978
01 Jan 1995
Basel Convention on the Control of Transboundary Movements of Hazardous
Wastes and their Disposal
22 Mar 1989 21 Dec 1994
Convention on Biological Diversity
++ Cartagena Protocol on Biosafety
12 Jun 1992 15 Dec 1994
06 Feb 2013 (a)
Convention on International Trade in Endangered Species 26 May 2013
International Treaty on Plant Genetic Resources for Food and Agriculture 01 Jan 2002
Rotterdam Convention on the Prior Informed Consent Procedure for Certain
Hazardous Chemicals and Pesticides in International Trade
13 Nov 2006 (a)
Stockholm Convention on Persistent Organic Pollutants 23 May 2001 03 Jan 2003
UN Watercourses Convention 25 May 1999 (a)
United Nations Convention to Combat Desertification 14 Oct 1994 16 May 1996
United Nations Framework Convention on Climate Change
++ Kyoto Protocol
12 Jun 1992 15 Dec, 1994
13 Nov 2006 (a)
Vienna Convention for the Protection of the Ozone Layer
++ Montreal Protocol on Substances that Deplete the Ozone Layer
30 Mar 1993 (a)
31 Mar 1993 (a)
World Heritage Convention 01 Jan 1983
Note : (a) = accession; Source: http://www.informea.org/countries/LBN/membership/.
Table IV.4. Lebanon’s trade and investment agreements
Agreement Date Benefit
Euro-Mediterranean Partnership
Initiative
2003 Lebanese industrial and most agricultural products enjoy free access
to the EU market (within the limits of tariff quotas)
Free Trade Agreement with the
European Free Trade Association
2004 Lebanese industrial exports enjoy free access to Switzerland,
Liechtenstein, Norway, and Iceland
Greater Arab Free Trade Area 2005 Exemption of tariffs on all agricultural and industrial goods traded
between the 17 Arab member countries
Bilateral Free Trade Agreements Multiple With Egypt, Iraq, Kuwait, Syria, and the UAE
Bilateral Agreements for the
Promotion and Protection of
Investments
Multiple 54 agreements provide a fair and equitable treatment on a non-
discriminatory basis, and a full protection and security of foreign
investments in both countries
Double Taxation Agreements Multiple 32 agreements promote the exchange of goods and services, the
inflow of capital, and technology by preventing double taxation and
fiscal evasion
Source: Investment Development Authority of Lebanon (IDAL)
83
European Union 2013, Trade in goods with Lebanon, available at:
http://trade.ec.europa.eu/doclib/docs/2006/september/tradoc_113412.pdf. 84
UNEP 2005, Effects of trade liberalization on agriculture in Lebanon with special focus on products where methyl
bromide is used.

32
2. Milestone laws promoting environmental sustainability
Lebanon has taken serious steps, especially since early nineties, to improve the legal framework
related to environmental sustainability. An important effort to diagnose the status of environmental
legislations in Lebanon was undertaken by the Ministry of Environment and its partners in 2004.85 It
would be valuable now, more than 10 years later, to update this work and assess whether legislative
gaps have effectively been closed.
Table IV.5 below lists a few laws and decrees that are considered to be milestones in promoting
environmental governance, protection and natural resource management, noting that this is far
from being an exhaustive list. Among the challenges, however, are the slow pace of enacting decrees
to implement these laws (sometimes taking as much as 10 years or more to issue the decrees), as
well as the institutional capacity to monitor and enforce. For example, important decrees that are
still waiting to be enacted include the establishment of a National Environmental Council and
National Environmental Fund (as per law 444/2002, which constitutes the overarching legal
instrument for environmental protection).86
Table IV.5. Milestone laws and decrees promoting environmental sustainability
Theme Reference no.
and year
Role
Environmental
governance
Law 216/1993 Establishment of the Ministry of Environment
Law 444/2002 Overarching legal instrument for environmental protection
Law 690/2005 Mandate of the Ministry of Environment and its organizational structure
Decree
2275/2009
Organization of the units under the Ministry of Environment, their mandate and staffing
Decree
8633/2012
Specify the projects that require Environmental Impact Assessments
Decree
8213/2012
Require all policies, plans, programmes and investments affecting large areas or
complete sectors to undergo Strategic Environmental Assessments
Decree
8471/2012
Require specific industrial establishments to obtain certification of environmental
compliance (to be renewed every 3 years).
Law 251/2014 Appointment of full-time environmental attorney-generals and inspection judges
Various laws and
decrees
Ratification of multilateral environmental agreements
Water Law 221/2000
Law 241/2000
Reorganize Lebanon’s 21 water committees into four Water Establishments plus the
Litani River Authority
Air quality Law 341/2001 Reduce air pollution from the transport sector
Decision 8/1 of
2001
Define environmental limit value for stack emissions and effluent discharge from
different establishments
Forests Law 558/1996 Protection of forests
Law 92/2010 Ban land use of burnt forest to discourage acts of arson
Land Decree
2366/2009
Approve the National Land Use Master Plan
Quarries Decree
8803/2002
Regulate the quarries sector to limit their environmental impacts
Solid waste Decree
13389/2004
Categorize health care waste and set guidelines for its management
Energy Law 132/2010 Regulate offshore oil and gas exploration activities
Natural
reserves
Various laws and
decrees
Establishment of natural reserves in different locations on the Lebanese territory
Source: Ministry of Environment, UNDP and Ecodit 2011, State and Trends of the Lebanese Environment 2010.
85
Ministry of Environment 2004, State of the Environmental Legislation Development and Application System in Lebanon
(Original in Arabic وضع نظام استصدار التشريعات البيئية وتطبيقھا في لبنان). 86
Ministry of Environment, UNDP and Ecodit 2011, State and Trends of the Lebanese Environment 2010.

33
V. Key national barriers to sustainable development
A number of gaps and obstacles of different nature continue to hinder the implementation of
sustainable development in Lebanon. While many of these have already been alluded to in earlier
sections of this report, the following paragraphs provide a systematic review of the main barriers
and gaps related to the ‘means of implementation.’87 As such, barriers have been categorized into
institutional, political, financial and information-related groups.
A. Institutional barriers
As indicated earlier in this report, an overarching national vision and plan for sustainable
development in Lebanon is lacking. Instead, a piecemeal, sector-based approach largely
characterizes development action. At certain times, action starts at the sub-sector level without
having a sector level umbrella (e.g. support to certain agricultural sub-sectors without having an
agriculture policy governing the overall sector). Furthermore, recurrent conflicts and persistent state
of instability has translated into emergency mode operation favoring recovery over long-term
strategic planning.88
On the positive side, more recent policy documents such as those listed in section III of this report,
have exhibited higher levels of integration of the pillars of sustainable development. In particular,
the social development aspect has regained prominence in political discourse, with the 2007 Paris III
document and the Social Action Plan being clear indicators of this paradigm shift. However, the
environmental and governance pillars have somehow remained outside the sphere of economic and
social policy documents and are less frequently addressed in an explicit way. This should not in itself
be considered a bad sign if these cross-cutting issues are properly mainstreamed across the other
pillars.
Section III.B presented the challenge facing public administration institutions in terms of being
under-staffed and under-resourced. A recruitment freeze and high staff turnover due to low wages
and dissatisfaction with the system have resulted in public institutions that are unable to attract and
retain highly qualified employees. For example, the Ministry of Environment should have 182 full-
timers while now it only has 60. Its budget share amounted in 2008 to 0.04% of the total
government expenditures.89 Bilateral cooperation projects have to some extent filled this gap.
However, these projects cannot be sustained over the long term and do not necessarily preserve
institutional memory.
Corruption, lack of transparency and impunity affect development in many ways. Transparency
International has ranked Lebanon 136 among 175 countries in terms of the corruption perception
index, with a score of 27/100. While this report was being prepared, a food safety scandal was
unraveled that reflected the extent of fraud, violations of the law and lack of coordination between
ministries responsible for food safety in Lebanon.90 A low score was also provided by Transparency
International in terms of the control of corruption, which reflects perceptions of the extent to which
public power is exercised for private gain. In terms of budget openness, Lebanon received an Open
87
The notion of ‘means of implementation’ was coined since the first Rio conference in 1992, and refers to the
interdependent mix of financial resources, technology, capacity-building, and the national enabling environment required
to implement sustainable development in developing countries. 88
ESCWA 2011, Review and Assessment of Capacity for Sustainable Development in Lebanon. 89
Ministry of Environment 2008, Emerging Markets in the Environmental Sector: Goods and Services Overview. 90
Daily Star, 27 November 2014, Lebanon to boost ministerial coordination over food safety.

34
Budget Index score of 32 over 100, which reflects low availability of budget documents and low level
of data comprehensiveness contained in them.91
Table III.4 provides a snapshot of the multi-faceted discrimination in Lebanon. The absence of a
unified civil personal status code discriminates between citizens depending on religion (e.g.
minimum age for marriage, inheritance) and gender (e.g. right to nationality). Furthermore, the
unavailability of a universal social protection system translates into discrimination against persons
with disability and the elderly. Discrimination in government policy regarding the development of
different regions in Lebanon has intensified inequality between the capital city and peripheral
regions. Finally, political considerations have translated into discrimination against Palestinian
refugees, such as restrictions on work and ownership of property.
Finally, there cannot be proper planning, monitoring, follow-up and accountability without adequate
statistical data collection. Lebanon’s statistical capacity has been improving as was shown in section
II on trends, however there is much more that can be done. The Lebanese Environment and
Development Observatory (LEDO)92 made a good start by identifying back in 2000 a set of indicators
covering the various pillars of sustainable development. However, this good effort was discontinued.
There is a need for a statistical master plan to coordinate data collection between the different
parties, and to increase data disclosure and accessibility. Also, the understaffing of statistical
departments in various ministries need to be addressed.
B. Political barriers
Political instability has unfortunately characterized Lebanon since the mid seventies, with studies
attributing the country’s political history to a combination of internal (notably sectarianism and lack
of accountability) and external (relationships with neighbors) factors.93 A prolonged civil war (1975-
1990) was followed by decades of sectarian tensions and intermittent conflicts including three wars
with Israel (1996, 1999, and 2006). The assassination of Prime Minister Rafik Hariri in February 2005
represented a turning point in Lebanon’s political scene as it divided the country into two political
camps. More recently, the specter of terrorism has increased, due in part to spillover effects from
the war in Syria.
The impact of political instability on the Lebanese economy is devastating. For example, the
economic cost of Israel’s 2006 war on Lebanon was estimated by the World Bank to be at $2.8 billion
in direct losses and much higher indirect losses (See Box V.1). Recent political volatility led to a dip in
real GDP growth rate from 10% in 2009 to an estimated 1.5% in 2013.94
In addition to the economic effects, impacts on overall government performance, planning and
policy implementation are equally significant. Indeed, Lebanon faces difficulties in forming and
maintaining a regular government, holding parliamentary elections, and electing a president. The
electoral law changed nine times over the course of thirteen parliamentary elections since
independence, in an effort to ensure that existing leaders and power structure is maintained.95 In
May 2014, the presidential term of Michel Sleiman expired. However, lack of agreement between
the political blocks has prevented the election of a successor.
91
http://www.transparency.org/country#LBN 92
http://www.moe.gov.lb/ledo/index.html 93
ESCWA, 2007, The Rebuilding and Revival of Lebanon: A Policy Paper with Initiatives (E/ESCWA/ECRI/2007/2/Rev.1). 94
Lebanon MDG report 2013-2014. 95
UNDP 2009, Lebanon 2008-2009 National Human Development Report: Toward a Citizen’s State.

35
Box V.1. Israel’s 2006 war on Lebanon
On 12 July 2006, Israel launched a 34-day war on Lebanon, which left a tremendous mark of destruction. Areas that were
notably hit included the South of Lebanon and the southern suburbs of Beirut, although other locations were also affected.
The human toll was high with around 1,100 deaths (the majority being civilians including women and children), 4,400
injured and over one million displaced persons. The physical infrastructure was systematically targeted with the
destruction of 30,000 homes, 100 bridges and many factories and critical facilities. The economic cost of the war was
estimated by the World Bank to be at $2.8 billion in direct losses and much higher indirect losses in the form of losses to
the economy and increased stress on public finances, exacerbating the country’s already precarious fiscal situation. The
spill of 15,000 tons of oil into the Mediterranean Sea resulting from the bombing of the Jiyeh power plant constituted an
environmental disaster that affected the full Lebanese coastline and extended to Syria (see section VI for a description of
the response efforts to this catastrophe). The UN General Assembly voted in December 2014, with an overwhelming
majority, for a resolution requesting Israel to allocate to the Government of Lebanon the sum of $856.4 million in
compensation for this ecological disaster (Resolution A/RES/69/212).
As the geographic areas hit by the war coincided largely with under-developed areas of Lebanon, a major challenge – and
indeed an opportunity – was to ensure that reconstruction efforts led to tangible sustainable development gains in terms
of addressing poverty and unemployment. Indeed, the Government of Lebanon put forward at the 3rd
donor conference in
Paris an ambitious plan of structural reform measures and in return, donors pledged support totaling $7.6 billion. The
significant amounts of aid received has put the Lebanese government to test in terms of participatory governance and
transparency as well as its capacity for coordinated action with donors, beneficiaries and various development actors for
better aid effectiveness.
Sources: Human Rights Watch, 2007, Why They Died: Civilian Casualties in Lebanon during the 2006 War; World Bank,
2010, Lebanon - Country partnership strategy for the period FY11-FY14. Washington, DC: World Bank; ESCWA, 2007, The
Rebuilding and Revival of Lebanon: A Policy Paper with Initiatives (E/ESCWA/ECRI/2007/2/Rev.1).
C. Financial barriers
The Lebanese civil war (1975-1990) caused extensive physical damage that was estimated at $25
billion.96 Following the end of the civil war, the government of Lebanon had to borrow funds to
reconstruct, at high interest rates. Interest payments eroded revenues leading to significant fiscal
deficits. Public debt as percentage of GDP escalated from 50% in 1992 to 180% in 2006, forcing
Lebanon to adopt austerity measures as part of IMF transfer conditionalities. Government efforts in
2007 to curtail the debt burden succeeded in lowering the ratio to 146% in 2009 and it currently
lingers at around 140% (See figure V.1).
Figure V.1. Public debt as % of GDP
* Forecast
Sources: 1992, 1998, 2004-2007 data: CCA 2007; 2000-2002: Paris II; 2009-2013 data: MDG report; 2014-2015: Report by
the International Institute of Finance (as quoted by Elias Sakr, Daily Star 14 October, IIF says Lebanon’s debt-to-GDP ratio
to hit 146 pct in 2014)
96
Lebanese Government 2007, Recovery, Reconstruction, and Reform (paper presented to the Paris III conference).
Syrian crisis
Paris III / Doha Accord
Hariri assassination
/ 2006 Israel war
Paris II

36
Recently, a cost of living pay increase for the public sector, agreed in 2012, was estimated to
translate into a yearly increase in government expenditure amounting to US$564 million. This will
add to the country’s chronic budget deficit. Demands for salary scale increases for the public sector
employees continued in 2014 with several demonstrations, notably by public school teachers.
Under unfavorable political and institutional conditions, the private sector, which contributes to 80%
of Lebanon’s GDP becomes paralyzed. Indeed, the real GDP growth rate plummeted in 2013 to
around 1.5% (See figure V.2). Adopted in 2012, the increase in minimum wages for the private sector
from LL 500,000 to LL 675,000 (around $450) put additional pressure on business owners.97
Lebanon is largely an importing country, with trade balance deficit exhibiting a steady increase over
the years. The Syrian crisis put additional restrictions on exports as Lebanon lost a main trading
route. As a result, exports decreased from $405 million in 2013 to $244 million in 2014, while the
trade deficit increased from $16.797 billion in 2012 to $17.292 billion in 2013.98
Figure V.2. Real GDP growth rate
Sources: 1992-2005 data: UN Common Country Assessment for Lebanon 2007; 2006-2008 data: Presidency of the Council
of Ministers 2012, Economic Accounts of Lebanon 1997-2010; 2009-2013 data: Lebanon MDG Report 2013-2014.
Remittances constitute an important source of income for Lebanon. In 2014, Lebanon received $7.7
billion, coming second in place in the Middle East and North Africa region after Egypt, and occupying
18th position globally. In addition, Lebanon occupies the top position in the region and 13th position
globally in terms of remittances as a percentage of GDP, which equaled 17% in 2013. Remittances
are witnessing a strong yearly growth rate of 1.6%.99 While the impact of remittances on poverty
alleviation in Lebanon is probably sizeable, further research is needed to assess whether these
remittances are being channeled into the formal sector in a way to allow their investment into public
uses.
In terms of foreign direct investment (FDI), instability in the past few years have translated into a
decreasing FDI trend, with FDI dropping from around $5 billion in 2010 to slightly less than $3 billion
in 2013. Despite the drop, FDI in 2013 accounted for over 6% of GDP, topping other countries in the
MENA region in relative terms. The biggest share of FDI comes from European countries (45%) and
Arab countries (31%). FDI is invested mostly in trade/retail (31%), tourism (17%), services (16%) and
construction (11%), therefore contributing to sizeable share of employment in Lebanon.100 An
97
Ministry of Finance 2014, Lebanon Country Profile 2014. 98
Lebanese Customs Department as reported in Daily Star, 28 February 2014, Lebanon’s trade deficit widens by 31
percent. 99
Byblos Bank 2014, Lebanon This Week Issue 373. 100
Investment Development Authority of Lebanon (IDAL) FDI data page,
(http://investinlebanon.gov.lb/en/lebanon_at_a_glance/foreign_direct_investments).
0
2
4
6
8
10
12
1992 1998 2004 2005 2006 2007 2008 2009 2010 2011 2012 2013
%
Syrian crisis
Paris III / Doha Accord
Hariri assassination /
2006 Israel war
Paris II

37
emerging positive trend relates to FDI investments that have started to take place in productive and
high value added sectors such as ICT. Figure V.3 provides details on FDI trend and structure in 2013.
Figure V.3. (a) FDI trend; (b) FDI structure by investor in 2013; (c) FDI structure by sector in 2013
Source: Investment Development Authority of Lebanon (IDAL) FDI data page,
(http://investinlebanon.gov.lb/en/lebanon_at_a_glance/foreign_direct_investments).
In 2013, Lebanon received a total of $626 million in official development assistance (ODA), which
amounted to 1.39% of its GNI. The United States was the top donor in that year (more than $300
million). However, and as shown in figure V.4, around $400 million went to humanitarian aid
(associated with the Syrian crisis) and assistance to Palestinian refugees (through UNRWA).101
Despite the big need for this kind of assistance (more of it is needed in fact), figures reflect that the
contribution of ODA to development in Lebanon is fairly insignificant.
Figure V.4. (a) ODA by donor; (b) ODA by sector, 2013
Source: Redrawn from the OECD website, http://www.compareyourcountry.org/aid-
statistics?cr=undefined&lg=en&page=11.
D. Untapped scientific and technological capacity
Lebanon has no ministry for science and technology (S&T). The function of formulating a national
S&T policy was assigned to the National Council for Scientific Research (CNRS), which is also
responsible for policy implementation and research production. A science, technology and
innovation policy was drawn by CNRS in 2006 and subsequently updated in 2009.
CNRS is underfunded. According to the 1962 law establishing the CNRS, the public budget allocated
to scientific research was supposed to equal 1% of GDP. While the Council’s total budget increased
over the years (with fluctuations), the 1% target never materialized. A study102 estimates the R&D
spending to be at 0.22% of GDP, and the number of full-time equivalent researchers to bet at 200
R&D staff for one million people, both of these figures being below regional averages.
101
OECD Aid Statistics, available at http://www.oecd.org/dac/stats/data.htm. 102
Jacques Gaillard 2007, Evaluation of Scientific, Technology and Innovation Capabilities in Lebanon.

38
The past decade has witnessed the proliferation of private universities (38 universities in 2009),
though the Lebanese University remains the top one in term of number of students (more than
100,000 students of the total of 180,000 university students attend the Lebanese University).103
Given the high rate of youth unemployment and immigration, it is legitimate to question whether
the higher education system is meeting market demand. Figure V.5 shows a relatively low
preference of students for sciences and engineering compared to other disciplines.
Figure V.5. Fields of education in Lebanon by ISCED* (2009 - 2010)
* International Standard Classification of Education
Source: Education in Lebanon, Statistics in Focus (SIF), Central Administration of Statistics, Lebanon, Issue number 3, April
2012.
Only a few of the private universities in Lebanon have S&T faculties or undertake research. Where
research is undertaken, the incentive system (promotion of university professors) skews research
activities to the publication of papers in peer-reviewed journals rather than encouraging research to
address societal problems or industry needs. Hence, the research-industry link is effectively broken
as can be shown by a 2014 CNRS survey104 that showed low reliance of industry on university
research. At the same time research conducted in the private sector in Lebanon is considered to be
limited.105
VI. Innovative practices or success stories in overcoming key
obstacles to sustainable development
This section presents a few case studies that are considered to be innovative sustainable
development success stories in Lebanon. Other success stories abound, however, and we invite
reviewers of this draft version of the report to propose more good cases. Preference in the selection
of the cases is given to projects that were successfully implemented and have stood the test time (in
contrast to projects that seem to start well but are later discontinued). Another important criterion
is the level integration of the pillars of sustainable development, as we look for projects that serve
the triple bottom line, economic, social and environmental. A scorecard for each case indicates why
it was considered a success.
103
Education in Lebanon, Statistics in Focus (SIF), Central Administration of Statistics, Lebanon, Issue number 3, April 2012. 104
CNRS and World Bank 2014, Innovation Survey within the Industrial Sector of Lebanon. 105
Rafik Hariri University and ESCWA 2014, Revisiting the purpose of scientific research to better impact development in
the Arab world.

39
A. Banque du Liban’s environmental loans
Banque du Liban (BdL) launched in 2010 its green
finance initiative as detailed in circular 236.106 The core
concept is that by exempting banks from part of the
required reserve requirement, these banks can make
available to businesses low-cost loans that can help
them finance environmentally friendly projects with
medium to long term maturities.
Starting initially with energy-related projects, support
was extended to non-energy projects, and covers new
and existing projects. Productive projects such as
organic farming and eco-tourism are also eligible for
funding.
Demand for these loans has been increasing, and loans to the green building sector alone have
exceeded $100 million. The Governor of BdL hopes that such projects can help reduce Lebanon’s oil
bill amounting to $6 billion per year by 10-20%. The environmental sector is estimated to generate
2-3% of GDP, with positive spill-over effects on other sectors such as tourism.107
B. Tannourine Cedar Forest Nature Reserve
Tannourine Nature Reserve was established according
to law no. 9 of 1999 and hosts one of the biggest and
densest cedar forests in Lebanon.108 Located in the
northern part of the Mount Lebanon range, the reserve
is managed by a local Committee in cooperation with
the Ministry of the Environment.
In addition to the cedars, the reserve hosts a number of
important birds and mammals. The Society for the
Protection of Nature in Lebanon reports 15 species of
soaring birds breeding and migrating over the site,
including species that are regionally rare.109 Hiking and
other touristic activities are managed in the reserve in a
way to protect the biodiversity.
C. Methyl bromide substitution
In compliance with the Montreal Protocol, Lebanon embarked on a project to phase out the use of
methyl bromide in agriculture before 2015. Methyl bromide is an ozone depleting substance that is
used extensively in greenhouse farming as a fumigant to control a wide spectrum of pests.
106
Circular 236 dated 25/11/2010, Reserve Requirements, http://www.bdl.gov.lb/circulars/download/370/ar. 107
Annahar, 2 July 2014, Launching the Green Roof: Salemeh encourages banks to give green loans (original in Arabic). 108
Tannourine Nature Reserve website, http://www.arztannourine.org/. 109
Society for the Protection of Nature in Lebanon website, http://www.spnl.org/ibas-kbas/tannourine-cedars-nature-
reserve/.
Scorecard: BdL environmental loans
� Environmental benefits are achieved while
getting the economy moving, improving
balance of payment and creating
employment;
� Responds to government policy: financing
the national energy efficiency and renewable
energy plan;
� Cooperation between the public and private
sectors.
Scorecard: Tannourine Cedar Nature Reserve
� Sustained since 1999;
� Protection of the Cedrus libani and other
important Lebanese flora and fauna;
� Cooperation between the government
(Ministry of Environment) and a local
committee;
� Environmental resources protected while
creating source of income generation
through tourism.

40
Led by the Ministry of Environment, this on-going project started in 1999 in cooperation with UNEP
and subsequently expanded its scope through additional cooperation with UNIDO. The objective was
to demonstrate the technical and economic viability of alternatives to methyl bromide, train local
farmers on the correct use of these alternatives, and progressively eliminate the use of the
chemical.110
Three main agricultural sectors were selected, namely
vegetables, cut flowers and strawberries. A national
geodatabase was built that includes information on
greenhouse producers in various regions in Lebanon.
The database by itself is an important achievement of
the project as it provides useful information for the
implementation of future projects in support of the
sector. The database containing over 3,000 sites and is
freely available online.111
D. Oil spill response
In July 2006, Israel bombed the Jiyeh power plant
(south Lebanon), causing 15,000 tons of heavy fuel oil
to spill into the Mediterranean Sea. A cooperative oil
spill response under the leadership of the Ministry of
Environment was initiated to contain the crisis while
making the best use of available resources –
governmental and NGOs (local and international). 112
The first priority consisted in capturing and removing
free floating mobile oil to prevent pollution of new
sites, notably sensitive ecosystems and culturally
important sites. Operations were executed until March 2007 and covered around 70 sites. Donors
assisted through the provision of aid material and technical assistance including training on the use
of response and treatment equipment. This equipment was later deposited with the Ministry of
National Defense and Ministry of Interior and Municipalities to put that equipment to good use if
needed in the future. Once this initial phase was completed, a longer-term phase was initiated to
clean up the oil slick from 30 identified sites, an operation that extended into 2009. An additional
challenge related to the management of the collected oil spill waste, which had to be treated and/or
stored under safe conditions.
The act was internationally condemned and four United Nations General Assembly resolutions were
issued to date that require Israel to compensate Lebanon for this great loss. The last resolution
issued in December 2014 put the compensation at $856.4 million.
110
http://www.moe.gov.lb/mebr/geodatabase/download/UNDP-MeBr%20Project.pdf. 111
Database can be searched at http://www.moe.gov.lb/mebr/geodatabase/list.asp. 112
http://www.moe.gov.lb/oilspill2006/index.htm.
Scorecard: Methyl bromide substitution
� Triple benefits: environmental (ozone
protection), economic (access to agricultural
markets) and social (better health);
� Generation of geodatabase that is useful
beyond the project;
� Sustained since 1999.
Scorecard: Oil spill response
� Cooperation between government (different
actors) and NGOs;
� Build the capacity of national actors to
enable future response to other national
emergencies;
� International condemnation of the act
through the United Nations.

41
E. Healthcare waste management
Lebanon was estimated in 1998 to produce more than 5,000 tons of infectious medical waste each
year, in addition to 20,000 tons of non-risk waste.113 The inappropriate disposal of such waste can
lead to serious air, water and soil pollution through the release of dioxins, mercury and other
pollutants. Different technologies are possible such as autoclaving and incineration.
The main legislative text governing the management
of healthcare waste in Lebanon is decree 8006 dated
11/06/2002, which was subsequently amended
through decree 13389, dated 30/09/2004. The decree
classifies medical waste into different categories and
requires that medical waste be treated prior to
disposal. In order to help healthcare facilities to
comply with government legislation, the Ministry of
Environment published in 2002 the “Environmental
Auditing Manual for Hospitals”.114
Treatment of medical waste can be costly for healthcare facilities and is better performed
cooperatively. Further to the issuance of the above decrees, some large hospitals established their
own treatment units, while others relied on regional centers managed by NGOs or other local
bodies. As a result of close follow-up by the Ministry and issuance of “notices”, the compliance rate
increased “slowly but surely”, exceeding 50% of hospitals (64% of the total infectious medical waste)
in 2008.115
F. Air quality monitoring
National air quality monitoring started in 2003
through an effort by the Université Saint Joseph (USJ)
with the Municipality of Beirut, and was limited at the
time to ambient air quality in Beirut. Twenty-three
monitoring stations for sampling and analyzing
gaseous and particulate phase air pollutants were
originally installed. The project was expanded in 2008
to cover the Greater Beirut Area, in partnership with
the American University of Beirut (AUB). AUB and USJ
under the umbrella of the Lebanese National Council
for Scientific Research (CNRS) established the Air
Quality Research Unit (AQRU) to study air pollutant
levels in GBA and their transformations in the atmosphere.116
Subsequently, the geographic scope was expanded outside GBA as more partners joined the
network (e.g. Tripoli Environment and Development Observatory and University of Balamand, which
monitor the industrial area of Chekka). The Air Quality Index was developed and is frequently
updated for the Hadath, Beirut, Zahleh, Sidon, and Baalbek regions with plans to expand to other
113
SWEEP-Net 2010, Country Report on the Solid Waste Management in Lebanon. 114
Ibid. 115
Ministry of Environment website, http://www.moe.gov.lb/Mobile/Sectors/Land/Sub-Sectors/Sub-Sectors-
Details.aspx?id=15&lang=en-US. 116
Ministry of Environment, UNDP and Ecodit 2011, State and Trends of the Lebanese Environment 2010.
Scorecard: Air quality monitoring
� Strengthens the science-policy interface;
� Expanding geographic scope over the years;
� Multi-disciplinary cooperation between the
public sector and research and academic
institutions;
� Increased public awareness through
transparency of results.
Scorecard: Healthcare waste management
� Strong enforcement and continuous follow-
up by the Ministry of Environment leading to
gradual increase in compliance levels;
� Creation of a network of medical waste
management service providers;
� Capacity building of healthcare personnel
and public environmental awareness.
campaign.

42
regions in the future. The public can check the status of the index (“Camil the Chameleon”) through
the Environmental Resources Monitoring in Lebanon website.117 Current cooperation efforts with
USJ and the Italian Government are seeking to build capacity in the assessment of the cumulative
impact of new projects on air quality using Ensemble Air Quality Modeling.118
G. National poverty targeting
As part of the comprehensive social reforms that the
Government of Lebanon committed to in the Paris III
paper, the Ministry of Social Affairs launched the
National Poverty Targeting Program (NPTP). NPTP
aims to assist the poorest Lebanese families in an
equitable and transparent way, with eligibility being
determined according to a rigorous methodology.
The adopted mechanism, called Proxy Means Testing
(PMT), assesses the family’s level of poverty using a
multi means testing methodology. A set of 62
indicators that are the most correlated to the social,
economic situation of the family were selected as
basis for determining the household’s welfare, and a
questionnaire was designed accordingly. Income is
not used due to its inadequacy and problems with
reporting it in an accurate manner. Approved families benefit from: a) full health coverage to all
family members; b) coverage of the cost of chronic diseases medication; c) free registration in public
schools; d) free public school books; and e) Discount of LL20,000 on the electricity bill.
An information system was set up that links 98 centers, and 400 social workers were trained on the
methodology. Families apply in any of the 98 centers and receive the visit of a social worker that fills
the questionnaire. Families are assigned a poverty score according to a mathematical formula. In the
first phase of the project (2011-2012), 57,000 Lebanese families applied for support, and the
programme is on-going.119
VII. Lessons learned and recommendations for national
implementation of the post-2015 development agenda
This section is to be completed based on the outcomes of the multi-stakeholder consultation. The
idea is to outline how the international community - through a supportive global partnership and
within the context of the post-2015 agenda and the SDGs - can help Lebanon to overcome some of
the obstacles or barriers to sustainable development that are beyond its national means. The below
paragraphs provide a starting point and are based on published documentation.
The national report to Rio+20 provided in its last section a set of four recommendations to the
Conference. These can be summarized as follows:
117
http://erml.moe.gov.lb/. 118
The Ministry of Environment’s Achievements in 2014. 119
Website of the National Poverty Targeting Program, http://www.nptp-mosa.com/.
Scorecard: National poverty targeting
� Responds to an approved government
policy;
� Uses a transparent and equitable
methodology that adheres to worldwide
norms;
� Rationalizes the use of limited government
resources;
� Poorest families benefit from social,
educational, and health benefits;
� Builds the capacity of ministry personnel and
develops an integrated information system.

43
• Reform to global economic system: Lebanon called for changing the business model to
reduce disparities between countries, ease the debt burden on developing countries to
expand fiscal space;
• Reform to the global institutional framework for sustainable development: Lebanon
called for the reform of UNEP and ECOSOC for further integration of the pillars of
sustainable development;
• Establish a global environmental court: The court would be well placed to examine
deliberate environmental crimes, such as the one committed by Israel against Lebanon
in 2006, and which caused the worst recorded oil spill in the east Mediterranean.
• Reaffirm the Palestinian right of return: Palestinian refugees live in unsustainable
conditions and their return to their homeland is the responsibility of the global
community.
The Lebanon MDG Report 2013-2014 acknowledges that only a few of the MDG targets will be
achieved by the 2015 deadline. It pointed specifically to the need to protect achievements made so
far by addressing the Syrian refugee crisis through a “development-oriented approach”, though the
MDGs did not include a refugee-specific target.
Among the lessons learned from the Lebanese MDGs experience relate to the need to resolve
methodological differences in the production of data and maintain periodicity of reports.
Furthermore, more benefit could have been achieved from the MDGs at the policy-making level if
the global goals and targets had been tailored to the national context and needs. Finally, the report
highlights the importance of strengthening monitoring and evaluation processes by clarifying and
reinforcing accountability mechanisms to ensure effective implementation.
Other ideas that could be put forward by Lebanon to the inter-governmental process on the post-
2015 agenda can be inspired by the recommendations included in the joint Arab paper submitted to
the meeting of the Arab Council of Social Affairs Ministers in October 2014, and in which the
representative of Lebanon was a member. The paper stresses among others the importance of
fighting terrorism, providing means of implementation, and supporting the right to development
(See box VII.1 for details).

44
Box VII.1. Recommendations regarding the Post-2015 Development Agenda
A paper prepared by a group of Arab country representatives, including Lebanon, and submitted to the meeting of the
Arab Social Ministers Council made a number of recommendations regarding the Sustainable Development Goals and
other components of the Post-2015 Development Agenda. Some of these were based on comments made by the Arab
Group in New York. Recommendations included the following:
- Have a universal agenda for all countries while offering flexibility in the formulation of regional and national
targets that suit the particularities and priorities of the member countries, and stressing on the importance of
policy space;
- Include, both in the declaration and in goal 16, the issue of the eradication of all forms of occupation and foreign
domination;
- Stress on the commitment by all countries to international laws;
- Promote international efforts to combat terrorism by addressing its root causes;
- Stress on the political-institutional dimension and the cultural dimension as pillars of sustainable development
(in addition to the environmental, economic and social pillars);
- Separate the goal on institutions from the goal on peace and security;
- Expand the scope of the Principle of Common but Differentiated Responsibilities beyond environmental issues;
- Have a separate goal on the global partnership for development including fair economic and trade systems, debt
relief for developing countries and removal of aid conditionalities;
- Balance the roles of development actors, including government, civil society and the private sector;
- Stress on the right to development;
- Integrate the population and demographic dimensions within the agenda, as well as issues of youth, women,
elderly and persons with disabilities;
- Separate the means of implementation from global partnership and clarify the responsibilities of national
governments, international organizations, as well as joint responsibilities
Source: SDGs and Post-2015: Analytical paper and recommendations, paper submitted by representatives of Egypt, Algeria,
Saudi Arabia, Sudan, Jordan and Lebanon to the meeting of the Arab Council of Social Affairs Ministers on Arab Post-2015
Development Goals, held in Sharm El Sheikh, 27-28 October 2014 (original in Arabic ورقة ٢٠١٥ بعد ما جندةأو المستدامة التنمية غايات
٢٠١٤ كتوبرأ ٢٨ -٢٧ الشيخ شرم المسؤولين كبار اجتماع عن وتوصيات صادرة تحليلية ).

45
Annex 1. Sustainable development graphical trend analysis

46

47

48

49

50

51

52

53

54

55
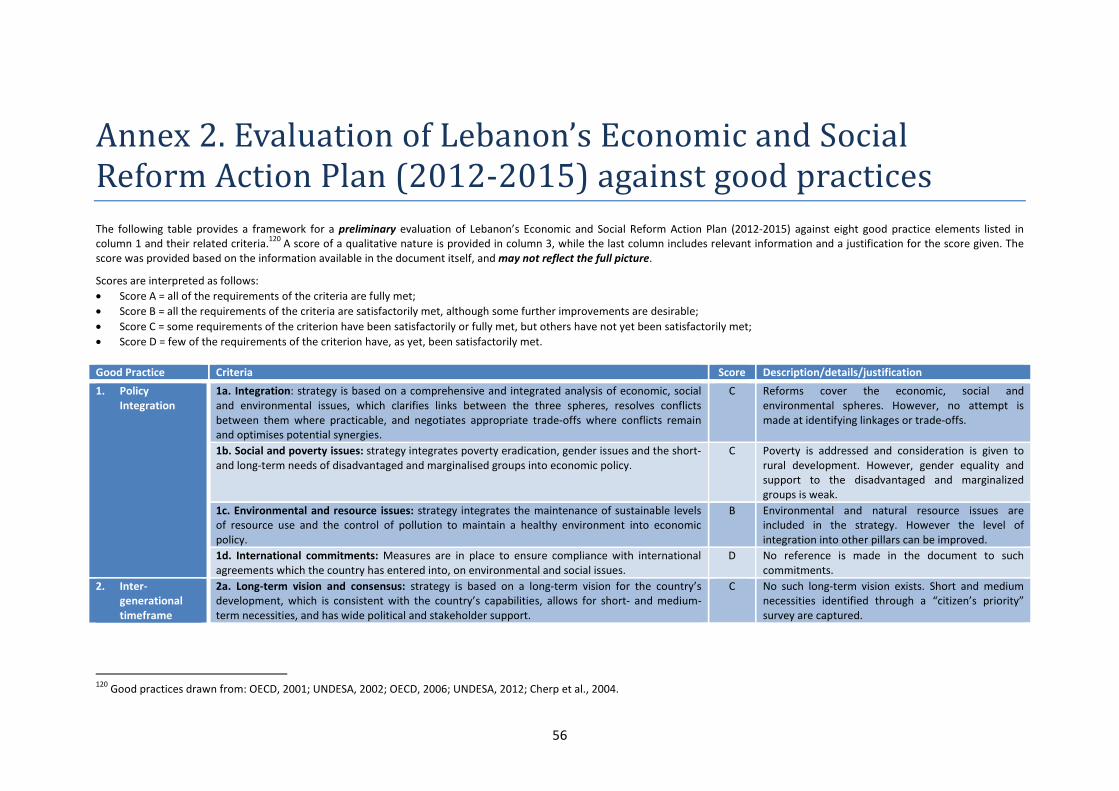
56
Annex 2. Evaluation of Lebanon’s Economic and Social
Reform Action Plan (2012-2015) against good practices
The following table provides a framework for a preliminary evaluation of Lebanon’s Economic and Social Reform Action Plan (2012-2015) against eight good practice elements listed in
column 1 and their related criteria.120
A score of a qualitative nature is provided in column 3, while the last column includes relevant information and a justification for the score given. The
score was provided based on the information available in the document itself, and may not reflect the full picture.
Scores are interpreted as follows:
• Score A = all of the requirements of the criteria are fully met;
• Score B = all the requirements of the criteria are satisfactorily met, although some further improvements are desirable;
• Score C = some requirements of the criterion have been satisfactorily or fully met, but others have not yet been satisfactorily met;
• Score D = few of the requirements of the criterion have, as yet, been satisfactorily met.
Good Practice Criteria Score Description/details/justification
1. Policy
Integration
1a. Integration: strategy is based on a comprehensive and integrated analysis of economic, social
and environmental issues, which clarifies links between the three spheres, resolves conflicts
between them where practicable, and negotiates appropriate trade-offs where conflicts remain
and optimises potential synergies.
C Reforms cover the economic, social and
environmental spheres. However, no attempt is
made at identifying linkages or trade-offs.
1b. Social and poverty issues: strategy integrates poverty eradication, gender issues and the short-
and long-term needs of disadvantaged and marginalised groups into economic policy.
C Poverty is addressed and consideration is given to
rural development. However, gender equality and
support to the disadvantaged and marginalized
groups is weak.
1c. Environmental and resource issues: strategy integrates the maintenance of sustainable levels
of resource use and the control of pollution to maintain a healthy environment into economic
policy.
B Environmental and natural resource issues are
included in the strategy. However the level of
integration into other pillars can be improved.
1d. International commitments: Measures are in place to ensure compliance with international
agreements which the country has entered into, on environmental and social issues.
D No reference is made in the document to such
commitments.
2. Inter-
generational
timeframe
2a. Long-term vision and consensus: strategy is based on a long-term vision for the country’s
development, which is consistent with the country’s capabilities, allows for short- and medium-
term necessities, and has wide political and stakeholder support.
C No such long-term vision exists. Short and medium
necessities identified through a “citizen’s priority”
survey are captured.
120
Good practices drawn from: OECD, 2001; UNDESA, 2002; OECD, 2006; UNDESA, 2012; Cherp et al., 2004.

57
Good Practice Criteria Score Description/details/justification
3. Analysis and
assessments
3a. Analysis and information: strategy based on a comprehensive analysis of the present situation
and of forecasted trends and risks, using reliable information and high-quality data on changing
environmental, social and economic conditions.
D No information is provided in this regard.
3b.Integrated assessment: strategy used integrated assessment tools and models to identify the
environmental, economic and social costs/benefits and tradeoffs/synergies of policy and strategy
options.
D No information is provided in this regard.
4. Coordination
and institutions
4a. High level political commitment: strategy has high-level government commitment (i.e. head of
state) and a strong institution or group of institutions is spearheading the process (e.g. office of
head of state, central planning or finance ministry).
B The plan corresponds to the government’s ministerial
declaration for 2011 and is spearheaded by the
Presidency of the Council of Ministers.
4b. Horizontal coherence: full range of relevant government departments and agencies involved in
formulating and implementing strategy, with adequate mechanism (e.g. committee) for
coordination.
D No information is provided in this regard.
4c. Vertical coherence: local and regional authorities involved in developing strategy, with relevant
delivery aspects devolved to sub-national levels.
D No information is provided in this regard.
4d. Responsibilities for implementation: Responsibility for implementing strategies is clearly
assigned to bodies with the appropriate authority.
A The executing agency is identified for each
deliverable in the reform matrix
5. Stakeholder
participation
5a. Involvement of stakeholders: the country’s processes of strategic planning, implementation,
monitoring and review include the participation of stakeholders, including government,
decentralised authorities, elected bodies, non-governmental and private sector institutions and
marginalised groups.
D Document does not refer to any process of
consultation or participatory approach.
5b. Transparency and accountability: the management of the country’s strategic planning
processes is transparent, with accountability for decisions made.
C No accountability mechanism or measures have been
specified.
5c. Communication and public awareness: measures are taken to increase public awareness of
sustainable development, to communicate relevant information, and to encourage the
development of stakeholder involvement in the strategic planning process.
C The plan is published on the internet with possibility
to ask for more information through e-mail.
However, much more can be done to raise
awareness and increase public involvement.
6. Goals, targets
and indicators
6a. Realistic goals: strategy articulates clear and realistic long-term goals, in line with national
circumstances and priorities as well as international development goals.
B The goals are more short to medium term (by nature
of document which covers 4 years)
6b. Targets and indicators: have been defined for key strategic economic, social and environmental
objectives, with indicators through which they can be monitored.
D No quantitative targets or indicators are specified.
7. Monitoring and
evaluation
7a. Monitoring and feedback: systems are in place for monitoring the implementation of strategies
and the achievement of their defined objectives, for recording the results, and for reviewing their
effectiveness as strategies for sustainable development, with effective mechanisms for feedback
and revision within the planning process.
D Document does not refer to any monitoring and
feedback processes. No progress reports were
issued.
8. Policy coverage 8a. Adequate policy mix: strategy includes a range of different types of policy measures, including
regulatory policies, economic instruments, fiscal incentives and public financing or PPPs.
A The proposed deliverables are varied between
regulatory, institutional and filed projects.

58
Good Practice Criteria Score Description/details/justification
9. Means of
Implementation
9a. Budgetary provision: strategy clearly articulates costs and budgetary requirements and is
integrated into the budget process with clear linkages to sources of funding, such that plans have
the financial resources to achieve their objectives.
A Outlays from the national budget are specified for
each deliverable in the reform matrix.
9b. Capacity for implementation: strategy includes realistic mechanisms to develop the capacity
required to implement it.
D Capacity for implementation is not mentioned in
document.
9c. International support and partnerships: process is co-ordinated with donor or other assistance
programmes, the private sector and civil society, with clear articulation of priorities and
opportunities for assistance, cooperation and partnerships.
C The document specifies where financing through
donors will be required. However, it is not clear
whether this is based on existing donor assistance
projects.

59
Annex 3. Evaluation of national goals against the SDGs
The following table provides framework for providing a summary of national sustainable development goals and targets compared against the set of 17 global SDGs
proposed by the Open Working Group. In the absence of an overarching policy document, national goals listed in column 2 have been extracted from the various
documents included in table IV.1 of this report. As some of these documents have not been approved by the Council of Ministers, they are provided on an indicative basis
only to highlight the country’s overall development course. Where quantitative targets have been provided (in rare cases), they were included in column 3. Gaps are
marked NA (Not available).
Proposed global SDGs National goals National targets
Goal 1: End poverty in all its
forms everywhere
National Social Development Strategy of Lebanon, 2011
1. Strengthen social protection through a pension scheme, unemployment fund, disability
insurance fund, and eliminate discrimination in protection schemes
2. Provide livelihood assistance to vulnerable households
3. Protect marginalized groups notably women and children (including institutionalized children
and children at risk) and people with disability
4. Empower the Ministry of Social Affairs to effectively lead the social sector and strengthen the
governance and institutional capacity of the National Social Security Fund
Social Action Plan: Toward Strengthening Social Safety Nets and Access to Basic Social Services
(2007)
1. Reduce poverty, including through cash transfers to poorest households and eradicating child
labor
2. Improve access to primary education and prevent drop-outs
3. Improve access to basic health care
4. Promote small scheme local development projects
Social Action Plan: Toward Strengthening Social
Safety Nets and Access to Basic Social Services
(2007)
Cash assistance amounting to $600/annum to
poorest households (increasing to $800/annum for
female headed households)
Goal 2: End hunger, achieve food
security and improved nutrition,
and promote sustainable
agriculture
Agricultural Development Strategy: Work Plan 2010-2014 (2009)
1. Reform the legislative framework
2. Improve the role of the Ministry of Agriculture and promote coordination with public and
private sectors
3. Develop agricultural infrastructure and improve the efficiency of natural resource use
4. Activation of agricultural extension services
5. Activation of monitoring of agricultural activities including forestry, hunting and fishing
6. Enhance production chains and improve quality, marketing and exports
7. Develop programs to support SMEs
8. Conserve natural resources and regulate the use of marginal and grazing lands.
NA

60
Proposed global SDGs National goals National targets
Goal 3: Ensure healthy lives and
promote well-being for all at all
ages
Ministry of Public Health Strategic Plan, 2007
1. Improve the health indicators and reduce regional discrepancies
2. Improve the overall quality of health service delivery
3. Sustain health care financing reform
4. Provide cost effective and safe drugs and rationalize their consumption and prescription
5. Strengthen the MOH preventive programs
National Social Development Strategy of Lebanon, 2011
1. Work toward ensuring health coverage for all and unification of health insurance schemes
2. Promote cost effectiveness in the health sector
3. Regulate the registration and pricing of drugs, promote the use of generic drugs and enforce
ethical guidelines in the drug market
4. Regulate the quality of in-patient and ambulatory health care services
5. Strengthen the regulatory and policy-making role of the Ministry of Public Health
NA
Goal 4: Ensure inclusive and
equitable quality education and
promote life-long opportunities
for all
Education Sector Development Plan (General Education): 2010-2015
1. Education Available on the Basis of Equal Opportunity
2. Quality Education that Contributes to Building A Knowledge Society
3. Education that Contributes to Social Integration
4. Education that Contributes to Economic Development
5. Governance of Education
Education Sector Development Plan (General
Education): 2010-2015
1. Increase the level of net enrollment:
- in elementary education to 98%
- in intermediate education to 90%
- in secondary education to 65%
Goal 5: Achieve gender equality
and empower all women and
girls
National Strategy for Women in Lebanon 2011-2021
1. Achieve citizenship to its fullest potential on the basis of full and unconditional equality
between men and women in rights and duties in legal texts, as well as in all fields of practice
2. Promote opportunities for girls and women in the areas of education and training
3. Achieve full equality between men and women in health care through the provision of health
services and care for girls and women, including reproductive-health care
4. Combat poverty among women, and give special attention to the eradication of poverty in
general
5. Promote the participation of women in the economic sector
6. Achieve full and unconditional equality between men and women in all fields and sectors and
in decision-making positions
7. Combat all forms of violence affecting girls and women in all areas
8. Eradicate stereotyping of women in local culture and in such media forms as radio, television
and advertising
9. Enhance the contribution of women to environmental protection
10. Strengthen the capacity of institutions concerned with women’s issues at the national level,
and reinforce the partnership between NCLW and public-sector departments and CSOs
11. Protect girls and women in situations of emergency, armed conflict, war and natural disaster
12. Introduce gender mainstreaming in all fields
Quantitative targets included in the implementation
plan 2013-2016
1. Electoral laws: 30% of seats minimum in
parliament and local councils
2. Improve participation of women in economic and
political life, including in political parties and the
media (30% of leading positions minimum)
61
Proposed global SDGs National goals National targets
Goal 6: Ensure availability and
sustainable management of
water and sanitation for all
National Water Sector Strategy (2012)
1. Maximize the potential and improve the quality of surface water resources
2. Improve management and protection of groundwater resources
3. Fulfill deficits through groundwater and/or surface storage according to potential and
availability per region
4. Ensure proper and continuous access to high quality water supply
5. Increase coverage of wastewater collection networks and treatment capacities
6. Optimize current wastewater treatment processes
7. Support a full implementation of the water sector reform
8. Improve on capital spending responsibilities
9. Improve the management of the irrigation sector
10. Introduce and implement new tariff strategies
11. Promote private sector participation
12. Gradually achieve O&M and then full cost-recovery
13. Enhance and modernize the legal setup
14. Enforce a regulatory regime
15. Achieve advanced climate change knowledge
16. Improve water quality, flood mitigation and protection of recharge zones
17. Implement awareness and conservation campaigns
National Water Sector Strategy (2012): By 2020,
1. Additional 64 MCM of surface water resources
2. Artificial recharge of groundwater aquifers (up to
200 MCM at an initial stage)
3. Surface storage - dams and hill lakes (additional
670MCM static/880MCM dynamic in identified sites)
4. Water supply transmission (2,800 km) and storage
tanks (191,000 m3)
5. Water supply distribution (9,600 km) and customer
metering (1 million water meters)
6. Irrigation rehabilitation and expansion (additional
30,000 ha during 2011-2020 to reach 60,000 ha by
2035)
7. Wastewater collection (80% by 2015 and 95% in
2020) and treatment (30% by end 2012, 80% by 2015
and 95% in 2020)
Goal 7: Ensure access to
affordable, reliable, sustainable,
and modern energy for all
Policy Paper for the Electricity Sector (2011)
1. Increase generation capacity
2. Reduce transmission losses
3. Improve distribution services and bill collection
4. Diversify fuel mix
5. Promote renewable energy
6. Improve energy efficiency
7. Review tariff structure
8. Set norms and standards for the provision of electric services
9. Corporatize EdL
10. Improve the legal framework
National Energy Efficiency Action Plan (2012)
1. Ban the import of incandescent lamps to Lebanon
2. Adopt the energy conservation law and institutionalization of the Lebanese Center for Energy
Conservation (LCEC) as the national energy agency for Lebanon
3. Promote decentralized power generation by PV and wind applications in the residential and
commercial sectors
4. Solar water heaters for buildings and institutions
5. Design and implement a national strategy for efficient and economic public street lighting in
Policy Paper for the Electricity Sector (2011)
1. Capacity targets: 4,000 MW by 2014 and 5,000
MW thereafter (including 40 MW from hydro, 60-100
MW from wind and 15-25 MW from waste to energy
2. Energy mix targets: 2/3 natural gas, 12%
renewable energy: 12% by 2020
3. Energy efficiency targets: save a minimum of 5% of
the total demand
National Energy Efficiency Action Plan (2012)
1. Ban the import of incandescent lamps by 2012
2. Wind and solar PV capacity of 50 to 100 MW by
2015
3. 190,000 m2 of solar water heater collectors by
2014
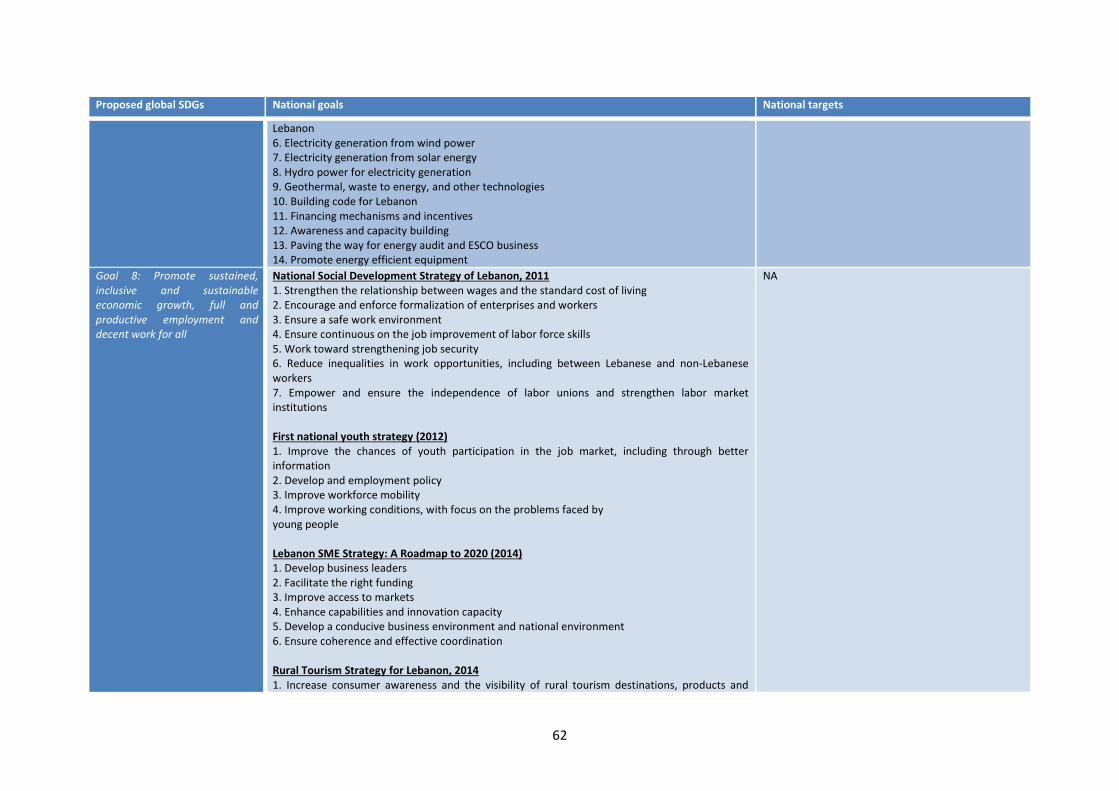
62
Proposed global SDGs National goals National targets
Lebanon
6. Electricity generation from wind power
7. Electricity generation from solar energy
8. Hydro power for electricity generation
9. Geothermal, waste to energy, and other technologies
10. Building code for Lebanon
11. Financing mechanisms and incentives
12. Awareness and capacity building
13. Paving the way for energy audit and ESCO business
14. Promote energy efficient equipment
Goal 8: Promote sustained,
inclusive and sustainable
economic growth, full and
productive employment and
decent work for all
National Social Development Strategy of Lebanon, 2011
1. Strengthen the relationship between wages and the standard cost of living
2. Encourage and enforce formalization of enterprises and workers
3. Ensure a safe work environment
4. Ensure continuous on the job improvement of labor force skills
5. Work toward strengthening job security
6. Reduce inequalities in work opportunities, including between Lebanese and non-Lebanese
workers
7. Empower and ensure the independence of labor unions and strengthen labor market
institutions
First national youth strategy (2012)
1. Improve the chances of youth participation in the job market, including through better
information
2. Develop and employment policy
3. Improve workforce mobility
4. Improve working conditions, with focus on the problems faced by
young people
Lebanon SME Strategy: A Roadmap to 2020 (2014)
1. Develop business leaders
2. Facilitate the right funding
3. Improve access to markets
4. Enhance capabilities and innovation capacity
5. Develop a conducive business environment and national environment
6. Ensure coherence and effective coordination
Rural Tourism Strategy for Lebanon, 2014
1. Increase consumer awareness and the visibility of rural tourism destinations, products and
NA

63
Proposed global SDGs National goals National targets
services domestically and internationally
2. Institutionalize rural tourism at the level of the local communities
3. Improve and enforce conservation and protection of the environmental, cultural, historical,
agricultural heritage of rural areas
4. Diversify, modernize and improve quality of rural destinations, products and services
5. Improve policies, legislation, and regulation of the rural tourism sector and enforcement of
laws across the value chain
6. Improve information and data collection and management to support sound planning
7. Develop the culture of rural tourism among the young generation and in the education system
8. Improve domestic and international business linkages and networking
Goal 9: Build resilient
infrastructure, promote inclusive
and sustainable industrialization
and foster innovation
Science, Technology and Innovation Policy for Lebanon (2009)
1. Implement 13 research programmes targeting strategic priorities in: a) basic sciences, industry
and engineering; b) environment and agriculture; c) health and medical sciences
2. Improving the research environment
3. Develop the information and communication infrastructure
4. Linking academia and research centers to the private sector, public agencies, NGOs and society
at large
5. Strengthen data collection and the role of CNRS
6. Strengthen national and international partnerships
NA
Goal 10: Reduce inequality within
and among countries
Vision for the Development of Regions of Lebanon (2009)
1. “Soft” enablers, including reform to the legal and institutional frameworks incentivizing
investments in regions
2. “Hard” enablers, including public infrastructural investments in the regions
3. Social enablers, including investments in health and education in the regions
4. Implementation of “catalyst” projects that boost local economies and promote small and
medium investments by the private sector
NA
Goal 11: Make cities and human
settlements inclusive, safe,
resilient and sustainable
National Physical Master Plan (2009)121
1. Structure the territory around the major urban centers;
2. Link all regions to national economic development;
3. Distribute major public facilities in an effective and integrated manner;
4. Unite the territory with an efficient and developed transportation network;
5. Ensure a quality urban development that respects the characteristics of each region;
6. Highlight and benefit from the natural wealth of the country;
7. Exploit water resources sustainably;
8. Resolve efficiently the problems of quarries, wastewater and solid wastes
NA
121
Major guidelines (rather than goals) of the plan. Source: Presentation made by Mr. Sami Feghali (CDR) during the Expert Group Meeting on Bridging the Urban Divide in the ESCWA region:
Towards Inclusive Cities, organized by ESCWA in Beirut, 25-26 November 2010.

64
Proposed global SDGs National goals National targets
Goal 12: Ensure sustainable
consumption and production
patterns
NA
NA
Goal 13: Take urgent action to
combat climate change and its
impact
NA
NA
Goal 14: Conserve and
sustainably use the oceans, seas
and marine resources for
sustainable development
Lebanon’s Marine Protected Area Strategy, 2012
1. Strengthening institutional capacity and Marine Protected Areas (MPAs) management.
2. Contributing through MPAs to resource management and sustainable development.
3. Developing scientific research in MPAs
NA
Goal 15: Protect, restore and
promote sustainable use of
terrestrial ecosystems,
sustainably manage forests,
combat desertification, and halt
and reverse land degradation
and halt biodiversity loss
National Strategy for Forest Fire Management in Lebanon, 2009
1. Disseminate information and build capacity in forest fire management and forest restoration;
2. Develop effective fire prevention measures and build environmental and social resilience
3. Provide concerned parties with the needed equipment to fight fires and ensure readiness
4. Extinguish fires rapidly and prevent expansion of burning area
5. Support communities who suffered losses from the fire and restore the affected forest area
National Strategy for Forest Fire Management in
Lebanon, 2009
Extinguish fire within 20 minutes
Goal 16: Promote peaceful and
inclusive societies for sustainable
development, provide access to
justice for all and build effective,
accountable and inclusive
institutions at all levels
Strategy for the Reform and Development of Public Administration in Lebanon (2011)
1. Modernize laws and regulations;
2. Restructure public entities and modernize roles and mandates;
3. Restructure monitoring institutions;
4. Build human capacities;
5. Build institutional capacities and promote strategic planning;
6. Promote good governance and accountability;
7. Focus on serving citizens and the achievement of outcomes;
8. Establish an e-government portal and promote the use of ICTs;
9. Concentrate public role to strategic functions and promote public-private partnership.
National Human Rights Plan 2013-2019
1. Rights and freedoms related to justice
2. Civic and political rights and freedoms
National Social Development Strategy of Lebanon, 2011
1. Preserve and promote cultural heritage as an essential resource in national development
2. Reinforce a Lebanese identity shared by all citizens
3. Create and promote shared public spaces
4. Empower the youth of Lebanon
5. Strengthen judicial independence
NA

65
Proposed global SDGs National goals National targets
High Level E-Government Strategy Document, 2007
1. e-Reform –improve the overall efficiency of government and achieve significant cost savings
2. e-Citizen –deliver services to the citizen in a fast, reliable and easy to understand and use
service
3. e-Business –provide integrated services to the business community and make it easier for the
private sector to do business with government
4. e-Community –promote regional development, targeting disadvantaged citizens
Goal 17: Strengthen the means
of implementation and revitalise
the global partnership for
sustainable development
(see subsections of this goal below) (see subsections of this goal below)
Goal 17: Finance NA NA
Goal 17: Technology Statement of ICT Government Policy (2011)
1. Increase investment in government owned ICT undertakings and infrastructure and facilitate
investments by the private sector.
2. Supply citizens and business with full range of modern telecommunication services
3. Adopt an enabling legal framework
4. Implement e-government
5. Encourage private equity and venture capital involvement
6. Stimulate the use of IT by consumers and small businesses
7. Develop human capital
8. Measure the digital economy
9. Improve governance of the ICT sector
Statement of ICT Government Policy (2011)
By 2015:
1. Increase GDP due to ICT contribution across all
sectors by 2%
2. Fixed line penetration to households is to exceed
92%
3. Fixed broadband subscribers to exceed 300,000
4. Mobile penetration to population to exceed 100%
5. Mobile broadband to reach around 25% of the
total mobile customer base
6. Broadband speeds for home users at more than
10Mbit/s and business users at 100Mbit/s
Goal 17: Capacity building NA NA
Goal 17: Trade NA NA
Goal 17: Systemic Issues – Policy
and institutional coherence
NA NA
Goal 17: Systemic Issues – Multi-
stakeholder partnerships
NA NA
Goal 17: Systemic issues – Data,
monitoring and accountability
NA NA

66
Bibliography
1. Ahmad Nizam 2011, Water Sector Reform in Lebanon and Impact on Low Income Households (presentation made at
the 4th ACWUA Best Practices Conference on Water and Wastewater Utilities Reform “Changes and Challenges”,
Sharm El Sheikh, 7-8 December 2011.
2. Annahar, 2 July 2014, Launching the Green Roof: Salemeh encourages banks to give green loans (Original in Arabic
البيئة لمشاريع قروض منح على المصارف نشجع: س�مة ؛لبنان لمصرف الرئيسـي المقرّ في ا�خضر السطح إط�ق ).
3. Arab NGO Network for Development (2007), Development Reforms in Lebanon: Between concepts of sustainable
development and the challenges of war and rehabilitation - A civil society perspective.
4. Association of Lebanese Industrialists’ Green Help Desk, http://www.ali.org.lb/english/green.asp.
5. Banque du Liban, Circular 236 dated 25/11/2010, Reserve Requirements,
http://www.bdl.gov.lb/circulars/download/370/ar (original in Arabic ٢٣٦تعميم وسيط رقم ).
6. Byblos Bank 2014, Lebanon This Week Issue 373.
7. Central Administration of Statistics 2008, Water Subscriptions Map, available at:
http://www.cas.gov.lb/images/Maps/Water_Subscriptions.pdf.
8. Central Administration of Statistics 2009, Multiple Indicators Cluster Survey 2009 (original in Arabic العنقودي المسح المؤشرات متعدد ).
9. Central Administration of Statistics 2011, The Labour Market in Lebanon, Statistics in Focus (SIF), Issue number 1,
October 2011.
10. Central Administration of Statistics 2012, Education in Lebanon, Statistics in Focus (SIF), Issue number 3, April 2012.
11. Council for Development and Reconstruction 2005, National Physical Master Plan of the Lebanese Territory
12. Council for Development and Reconstruction 2013, Urban Transport Development Project Brief.
13. Council for Development and Reconstruction 2013, Progress Report, available at:
http://www.cdr.gov.lb/eng/progress_reports/pr102013/index.asp.
14. Daily Star, 28 February 2014, Lebanon’s trade deficit widens by 31 percent.
15. Daily Star, 14 October 2014, IIF says Lebanon’s debt to GDP ratio to hit 146 pct in 2014.
16. Daily Star, 31 October 2014, Lebanon must tackle its water crisis head-on.
17. Daily Star, 1 November 2014, Naameh landfill to be shut down by April 2015.
18. Daily Star, 27 November 2014, Lebanon to boost ministerial coordination over food safety.
19. Daily Star, 27 November 2014, Lebanon’s civil society sector: a lost continent.
20. Daily Star, 20 December 2014, Environment minister slams random waste dumping by municipalities.
21. Daily Star, 24 December 2014, Cabinet fails to agree on waste treatment plan.
22. ESCWA 2007, The Rebuilding and Revival of Lebanon: A Policy Paper with Initiatives (E/ESCWA/ECRI/2007/2/Rev.1).
23. ESCWA 2009, Unpacking the Dynamics of Communal Tensions: A Focus Group Analysis of Perceptions among Youth in
Lebanon.
24. ESCWA 2012, Statistical Abstract of the Arab Region, Issue No. 32.
25. ESCWA and the Arab Urban Development Institute 2014 (Original in Arabic: البلدان في الحضري الفقر دراسة مشروع طرابلس مدينة في الفقر العربية، ).
26. ESCWA and the League of Arab States 2014, Disability in the Arab Region (Original in Arabic ا3عاقة في المنطقة العربية : .(لمحة عامة
27. European Union 2013, Trade in goods with Lebanon, available at:
http://trade.ec.europa.eu/doclib/docs/2006/september/tradoc_113412.pdf.
28. Global Reporting Initiative’s Sustainability Disclosure Database.
29. Government of Lebanon 2014, Policy Statement of the National Interest Government.
30. Government of Lebanon 2013, Environmental and Social Assessment (ESA) of the Lebanon Pollution Abatement
Project (LEPAP).
31. Habib Maalouf 2014, The environmental and economic impacts of the oil and gas exploration option in Lebanon
(Original in Arabic ا9قتصادية لخيار التنقيب عن الغاز والنفط في لبنانا5ثار البيئية و ), with the support of Friedrich-Ebert-
Stiftung Lebanon Office.
32. Heba Laithy, Khalid Abu-Ismail and Kamal Hamdan, 2008, Poverty, Growth and Income Distribution in Lebanon
(International Poverty Centre Country Study No. 13, available at http://www.ipc-
undp.org/pub/IPCCountryStudy13.pdf).
33. Higher Council for Privatization 2013, Public Private Partnerships in Lebanon (original in Arabic الشراكة بين القطاعين :available at ,(العام والخاص في لبنان
http://www.hcp.gov.lb/pictures/pdffile/News0.9128229_final%20guide_13Feb2014_website.pdf. 34. Higher Council for Privatization website, http://www.hcp.gov.lb/.
35. Human Rights Council 2010, Compilation prepared by OHCHR in accordance with paragraph 15(b) of the annex to
Human Rights Council resolution 5/1 (A/HRC/WG.6/9/LBN/2).
36. Human Rights Council 2011, Report of the Working Group on the Universal Periodic Review - Lebanon (A/HRC/16/18).

67
37. Human Rights Parliamentary Committee 2013, National Human Rights Plan 2013-2019.
38. Human Rights Watch 2007, Why They Died: Civilian Casualties in Lebanon During the 2006 War.
39. Human Rights Watch, World Report 2013, Lebanon chapter (http://www.hrw.org/world-report/2013/country-
chapters/lebanon).
40. ILO Regional Office for Arab States 2011, Green Jobs Assessment in Lebanon: Synthesis Report.
41. ILO Regional Office for Arab States 2014, Assessment of the impact of Syrian refugees in Lebanon and their
employment profile.
42. Institut des Finances Basil Fuleihan 2011, Institutional Development Plan: Horizon 2015 (Original in French).
43. Institut des Finances Basil Fuleihan 2014, Assadissa fifth issue (October/November 2014).
44. Institut des Finances Basil Fuleihan (undated), Leadership in the Public Sector: Lebanon’s experiment with installing
competitive recruitment for senior government positions.
45. Investment Development Authority of Lebanon FDI data, available at:
http://investinlebanon.gov.lb/en/lebanon_at_a_glance/foreign_direct_investments/fdi_data.
46. Jacques Gaillard 2007, Evaluation of Scientific, Technology and Innovation Capabilities in Lebanon.
47. Lebanese Cleaner Production Center website, http://www.lebanese-cpc.net.
48. Lebanese Republic 1995, The Lebanese Constitution Promulgated May 23, 1926 with its Amendments.
49. Lebanese National Council for Scientific Research and World Bank 2014, Innovation Survey within the Industrial Sector
of Lebanon.
50. Lebanese National Council of Scientific Research 2009, Science, Technology and Innovation Policy
51. Lebanese Parliament, List of Parliamentary Committees 2014-2015 (Original in Arabic ٢٠١٥-٢٠١٤اللجان النيابية ),
https://www.lp.gov.lb/Temp/Files/ed833a61-83cd-4658-bdf7-b6c16dce1224.pdf.
52. Lebanese Petroleum Administration website, http://www.lpa.gov.lb/.
53. Lebanese Republic 2002, Beyond Reconstruction and Recovery: Towards Sustainable Growth (paper presented to the
Paris II conference).
54. Lebanese Republic 2007, Recovery, Reconstruction, and Reform (paper presented to the Paris III conference).
55. Lebanese Republic 2012, Lebanon National Report to the United Nations Conference on Sustainable Development
(Rio+20).
56. Marc Ziade 2012, Technical Challenges to 24/7 electricity in Lebanon (http://www.carboun.com/energy/technical-
challenges-to-247-electricity-in-lebanon/).
57. Millennium Development Goals Indicators Database, http://mdgs.un.org/unsd/mdg/Default.aspx.
58. Ministry of Agriculture 2003, National Action Programme to Combat Desertification.
59. Ministry of Agriculture 2004, National Report to the Fifth Session of the United Nations Forum on Forests.
60. Ministry of Agriculture, Strategy for Advancing the Agricultural Sector 2010-2014 (Original in Arabic النھوض إستراتيجية ٢٠١٤-٢٠١٠ عمل برنامج الزراعي، بالقطاع ).
61. Ministry of Economy and Trade 2014, Lebanon SME Strategy: A Roadmap to 2020.
62. Ministry of Education and Higher Education 2010, National Education Strategy Framework and Education Sector
Development Plan (General Education): 2010-2015.
63. Ministry of Education and Higher Education 2014, Environmental Management Plan and Guidelines for Reaching All
Children with Education in Lebanon.
64. Ministry of Energy and Water 2010, National Water Sector Strategy.
65. Ministry of Energy and Water 2010, Policy Paper for the Electricity Sector.
66. Ministry of Energy and Water/ Lebanese Center for Energy Conservation 2011, The National Energy Efficiency Action
Plan for Lebanon 2011-2015.
67. Ministry of Environment 1998, National Biodiversity Strategy and Action Plan.
68. Ministry of Environment 2004, State of the Environmental Legislation Development and Application System in
Lebanon (Original in Arabic لبنان في وتطبيقھا البيئية التشريعات استصدار نظام وضع ).
69. Ministry of Environment 2008, Emerging Markets in the Environmental Sector: Goods and Services Overview.
70. Ministry of Environment 2012, Lebanon’s Marine Protected Areas Strategy.
71. Ministry of Environment 2013, National Greenhouse Gas Inventory Report and Mitigation Analysis for the Land Use,
Land Use Change and Forestry Sector (Lebanon’s Third National Communication to the UNFCCC).
72. Ministry of Environment 2014, Solid Waste Management Plan for Beirut, Mount Lebanon and the North.
73. Ministry of Environment and others 2009, National Strategy for Forest Fire Management in Lebanon (Original in Arabic
.(ا3ستراتيجية الوطنية 3دارة حرائق الغابات في لبنان74. Ministry of Environment, Environmental Resources Monitoring in Lebanon project, http://erml.moe.gov.lb/.
75. Ministry of Environment, GEF and UNDP 2014, Safeguarding and Restoring Lebanon’s Woodland Resources Project.
76. Ministry of Environment, Lebanese Environment and Development Observatory,
http://www.moe.gov.lb/ledo/index.html.
77. Ministry of Environment, UNDP and Ecodit 2011, State and Trends of the Lebanese Environment 2010.
78. Ministry of Environment, UNDP and EU 2014, Lebanon Environmental Assessment of the Syrian Conflict and Priority
Interventions.
79. Ministry of Environment’s Achievements in 2014.

68
80. Ministry of Environment, Methyl Bromide Alternatives Project of Lebanon website,
http://www.moe.gov.lb/mebr/geodatabase/home.asp.
81. Ministry of Environment, Oil Spill Catastrophe website, http://www.moe.gov.lb/oilspill2006/index.htm.
82. Ministry of Environment website, http://www.moe.gov.lb/Mobile/Sectors/Land/Sub-Sectors/Sub-Sectors-
Details.aspx?id=15&lang=en-US.
83. Ministry of Finance 2009, International Conference for Support to Lebanon Paris III, 11th
Progress Report.
84. Ministry of Finance 2014, Lebanon Country Profile 2014.
85. Ministry of Finance, http://www.finance.gov.lb/en-
US/finance/Reforms/Pages/InterMinisterialCommitteeDocuments.aspx.
86. Ministry of Health 2007, Ministry of Health Strategic Plan.
87. Ministry of Higher Education 2010, Education Sector Development Plan (General Education): 2010-2015.
88. Ministry of Industry 2007, The Lebanese Industrial Sector Facts and Findings - 2007.
89. Ministry of Social Affairs 2001, National Population Policy in Lebanon (original in Arabic الوثيقة الوطنية للسياسة السكانية .(في لبنان
90. Ministry of Social Affairs 2007, Social Action Plan: Toward Strengthening Social Safety Nets and Access to Basic Social
Services
91. Ministry of Social Affairs 2010, Social Pct.
92. Ministry of Social Affairs 2011, National Social Development Strategy of Lebanon.
93. Ministry of Social Affairs, National Poverty Targeting Program, http://www.nptp-mosa.com/.
94. Ministry of Tourism 2014, Rural Tourism Strategy for Lebanon.
95. Ministry of Youth and Sports 2010, Strategy of the Lebanese Ministry of Youth and Sports 2010-2020 (Original in
Arabic ٢٠٢٠-٢٠١٠ والرياضة الشباب وزارة إستراتيجية ).
96. Ministry of Youth and Sports and Youth Forum for Youth Policy 2012, Lebanese Youth Policy (Original in Arabic وثيقة لبنان في الشبابية السياسة ).
97. Nasser Hoteit, undated, The Petroleum Sector in Lebanon: History, Opportunities and Challenges.
98. National Commission for Lebanese Women 2010, National Strategy for Women in Lebanon 2011-2021.
99. Next Generation Democracy (2014) Middle East and North Africa – Track 1: People and Communities, Regional Trends
2000-15 and Scenarios 2015-2030.
100. OECD Aid Statistics, available at http://www.oecd.org/dac/stats/data.htm.
101. OECD website, http://www.compareyourcountry.org/aid-statistics?cr=undefined&lg=en&page=11.
102. OECD-UNDP 2014, Stabilisation Systems Analysis – Lebanon Results and roadmap Workshop: Beirut September 25/26
2014.
103. Office of the Minister of State for Administrative Reform 2007, High Level E-Government Strategy Document.
104. Office of the Minister of State for Administrative Reform 2011, Strategy for the Reform and Development of Public
Administration in Lebanon.
105. Open Working Group 2014, Proposal for Sustainable Development Goals, available at:
https://sustainabledevelopment.un.org/sdgsproposal.
106. Paul Salem 2014, Scenarios of Change and Possibilities of Reform in Lebanon, Middle East Institute.
107. Presidency of the Council of Ministers 2009, Vision for the Development of the Regions of Lebanon (Original in Arabic
اللبنانية المناطق �نماء رؤية حول الوزراء مجلس رئاسة من مقدمة عمل ورقة ).
108. Presidency of the Council of Ministers 2011, Statement of ICT Government Policy.
109. Presidency of the Council of Ministers 2012, Economic and Social Reform Action Plan (2012-2015): Seven Pillars for
Implementing Economic and Social Reform in Lebanon.
110. Presidency of the Lebanese Republic, The Lebanese Constitution, available at:
http://www.presidency.gov.lb/English/LebaneseSystem/Documents/Lebanese%20Constitution.pdf.
111. Rafik Hariri University and ESCWA 2014, Revisiting the purpose of scientific research to better impact development in
the Arab world.
112. Rami Ariss, “Power Ships” Keeping Lebanon’s Grid Afloat, 24 March 2014 (http://berc.berkeley.edu/power-ships-
keeping-lebanons-grid-afloat/).
113. Reuters, 5 November 2014, Lebanese parliament extends own term till 2017 amid protests.
114. Revision of the 1996 National Strategy for Women’s Affairs prepared by the National Commission for Lebanese
Women, which was established in 1996 under the Presidency of the Council of Ministers.
115. Roger Nasnas 2007, Emerging Lebanon: Towards and Economic and Social Vision.
116. Sami Feghali, National Physical Master Plan of Lebanon, Presentation made during the Expert Group Meeting on
Bridging the Urban Divide in the ESCWA region: Towards Inclusive Cities, organized by ESCWA in Beirut, 25-26
November 2010.
117. SDGs and Post-2015: Analytical paper and recommendations, paper submitted by representatives of Egypt, Algeria,
Saudi Arabia, Sudan, Jordan and Lebanon to the meeting of the Arab Council of Social Affairs Ministers on Arab Post-
2015 Development Goals, held in Sharm El Sheikh, 27-28 October 2014 (original in Arabic جندةأو المستدامة التنمية غايات ٢٠١٤ كتوبرأ ٢٨ -٢٧ الشيخ شرم المسؤولين كبار اجتماع عن وتوصيات صادرة تحليلية ورقة ٢٠١٥ بعد ما ).
118. Society for the Protection of Nature in Lebanon website, http://www.spnl.org/ibas-kbas/tannourine-cedars-nature-
reserve/.

69
119. SWEEP-Net 2010, Country Report on the Solid Waste Management in Lebanon,
http://www.databank.com.lb/docs/CountryreportLebanon-En-mai2011.pdf.
120. Synthesis Report of the Secretary-General on the Post-2015 Sustainable Development Agenda, A/69/700.
121. Talal Darwish 2009, Sustainable Land Management Practices to Reverse Land Degradation in Lebanon, ESCWA paper
E/ESCWA/SDPD/2009/WG.2/5.
122. Talal Darwish et al. 2010, Environmental Impact of Quarries on Natural Resources in Lebanon, Land Degradation and
Development 22: 345-358 (2011).
123. Tannourine Nature Reserve website, http://www.arztannourine.org/.
124. Transparency International, Lebanon country data, http://www.transparency.org/country#LBN.
125. UNEP 2005, Effects of trade liberalization on agriculture in Lebanon with special focus on products where methyl
bromide is used.
126. United Nations 2007, Common Country Assessment for Lebanon.
127. United Nations 2010, Development Assistance Framework for Lebanon 2010-2014.
128. United Nations 2013, Post 2015 national consultations in Lebanon: The Lebanon We Want.
129. UNDESA and ESCWA 2011, Guidance Notes and Recommendations for Sustainable Development Planning in Lebanon.
130. UNDESA and ESCWA 2011, Review and Assessment of Capacity for Sustainable Development in Lebanon.
131. UNDP 2008, Mapping of Human Poverty and Living Conditions in Lebanon (original in Arabic خارطة الفقر البشري٢٠٠٤وأحوال المعيشة في لبنان )
http://www.lb.undp.org/content/dam/lebanon/docs/Poverty/Publications/Mosa%20mapping%20Book%20with%20s
entence.pdf.
132. UNDP 2009, Lebanon 2008-2009 National Human Development Report: Toward a Citizen’s State.
133. UNDP 2009, Lebanon MDG Report 2008.
134. UNDP 2012, The Syrian Crisis: Implications for Development Indicators and Development Planning - Lebanon.
135. UNDP Global Risk Identification Programme 2010, Disaster Risk Assessment in Lebanon: A Comprehensive Country
Situation Analysis.
136. UNDP-CEDRO 2012, National Bioenergy Strategy for Lebanon.
137. UNDP/CDR 2003, Lebanon MDG Report 2003.
138. UNDP/CDR 2014, Lebanon MDG Report 2013-3014.
139. UNDP/Lebanese Parliament 2013, Role of Parliament and Parliamentary Committees in Increasing Job Opportunities
for the Lebanese Youth (original in Arabic اللبناني للشباب العمل فرص زيادة في النيابية واللجّان النواب مجلس دور ).
140. UNHCR Global Trends 2013, War’s Human Cost, available at: http://www.unhcr.org/5399a14f9.html.
141. UNISDR 2012, Making Lebanon Resilient: Achieving Disaster Risk Reduction in the Arab States - Good Practice Country
Brief.
142. United Nations Global Compact Database Search, https://www.unglobalcompact.org/participants/search.
143. World Bank 2010, Lebanon - Country partnership strategy for the period FY11-FY14.
144. World Bank 2010, Republic of Lebanon Water Sector: Public Expenditure Review (Report No. 52024-LB).
145. World Bank 2011, Republic of Lebanon Country Environmental Analysis (Report No. 62266-LB).
146. World Bank 2012, Lebanon Country Water Sector Assistance Strategy 2012-2016 (Report No. 68313-LB).
147. World Bank 2014, Migration and Development Brief No. 23.
148. World Bank, World Development Indicators, Lebanon Country Data, http://data.worldbank.org/country/lebanon.
149. World Bank’s Worldwide Governance Indicators Country Data Report for Lebanon (1996-2013), available at
http://info.worldbank.org/governance/wgi/pdf/c124.pdf.
150. World Bank’s Worldwide Governance Indicators, www.govindicators.org.
151. World Bank, Little Green Data Book (issues for the years 2006 to 2014).
152. World Economic Forum 2014, The Global Competitiveness Report 2014–2015: Full Data Edition.